Taxation with Representation: Intergovernmental Grants in a Plebiscite Democracy
Byron F. Lutz*
February 7, 2006
Keywords: Desegregation, education, dropout, race
Abstract: Intergovernmental grants play a significant role in the provision of local public goods. The seminal work of Bradford and Oates (1971 a,b) provides a strong prediction on how such grants influence local government spending decisions. The theory emphasizes that voters perceive grant income and private income to be fungible. Under the assumption that government spending decisions reflect voter preferences, unconditional grants are spent on public goods at voters' marginal propensity to spend on such goods out of private income. Grants are therefore mostly offset by reductions in local government spending and there is little increase in expenditures in the area targeted by the grant. The theory can be summarized as predicting that intergovernmental grants are equivalent to a lump-sum tax reduction for the residents of the government receiving the grant. A large empirical literature contradicts this prediction and finds that grants are systematically spent as intended by the sending government. This empirical tendency has been termed the "flypaper effect" because it suggests that grants stick where they are targeted. Hines and Thaler (1995) survey the empirical intergovernmental grants literature and document that virtually all previous research finds a substantial flypaper effect.2 This literature is difficult to evaluate. Many of the grants studied may not be unconditional. Price effects may explain the deviation from the theoretical prediction (Moffitt (1984), Megdal (1987)). In other cases, grants examined may have a repeated game element. Governments receiving the grants are constrained to spend them on the targeted area in order to ensure the sending government will continue the transfers in the future (Chernick 1979). Finally, most of the studies consider situations in which there is considerable doubt whether the budgeting process reflects the preferences of voters (Oates (1979), Filimon, Romer and Rosenthal (1982)) . A recent set of papers finds more support for the theory. Duggan (2000), Knight (2002) and Gordon (2004) document that governments offset most or all of the grant funds they receive. These papers use strong research designs and demonstrate that the empirical regularity known as the flypaper effect does not hold in all cases. In contrast, several recent papers, also using strong research designs, estimate a significant flypaper effect (Baicker (2001), Card and Payne (2002), Evans and Owens (2005) and Singhal (2005)). Viewed as a whole, the recent literature is inconclusive. Understanding the influence intergovernmental grants exert on local government spending decisions is important from a policy perspective. Intergovernmental grants provide significant revenue for the local public sector. In 2002, state-issued grants accounted for one-third of total local government revenue in the U.S. In addition, grants are one of the primary vehicles employed by state governments to enact redistribution. This is particularly important in the area of education. Since the early 1970s, most states have enacted some type of school finance reform. These reforms involve reducing the extent of local financing and increasing state funding, typically by issuing intergovernmental grants. I use a 1999 court-mandated school finance reform in New Hampshire to test the theoretical prediction that unconditional grants are equivalent to a tax reduction. The New Hampshire reform provides a compelling setting for the test for at least four reasons. First, the reform produced an extremely large increase in intergovernmental grants -- the typical school district experienced an approximate 200 percent increase in grants from the state. In addition, the reform was imposed by an outside body, the courts. The magnitude and exogenous nature of the reform allow for a strong research design. Second, there is a presumption that the grants were used in a manner consistent with the preferences of voters. A majority of municipalities in New Hampshire determine the provision of public goods by a form of direct democracy. In addition, the reform itself was highly politicized. It was the central issue in New Hampshire politics over the period in question. Given these facts, it is reasonable to presume that the voters were aware of the policy reform and could easily express their preferences through the political process. In contrast, the connection between voter preferences and government decisions is unclear in many previous tests of the theory. Third, the data used in this paper allow for an assessment of the effect of the grants on local taxation. This is important because it permits a more nuanced approach than merely testing for the presence or absence of the flypaper effect. It allows for a direct test of the theoretical prediction that grants are equivalent to a tax reduction. Rejecting the flypaper effect is insufficient to confirm this prediction because grants often produce changes in spending in areas other than the area targeted (Craig and Inman (1982), Baicker and Gordon (2004)). If a significant portion of a grant is used to fund government spending in any area, whether targeted or not, the theoretical prediction is contradicted. Understanding the validity of the prediction is important. The incidence of the offset grants -- the assessment of who receives the benefit of the transfer payments -- differs depending on how they are ultimately used. For example, Duggan (2000) shows that local governments in California reduce their funding to public hospitals by one dollar for each dollar the hospital receives in grants. The incidence of these offset grants differs if they were used for a) tax reduction or b) to fund local health clinics unassociated with the targeted hospitals. Understanding the validity of the theory also provides guidance in assessing situations in which the flypaper effect does operate. Determining the mechanism generating the flypaper effect (i.e. the reason for the deviation from the theoretical prediction) is crucially dependent on knowing whether the standard theory holds in an ideal setting or is fundamentally flawed. If the theory holds under ideal conditions, traditional explanations for the flypaper effect, such as voter misperception and bureaucratic capture, should be examined. If the theory is false, alternative explanations, such as the behavioral theories proposed by Hines and Thaler (1995), should be considered. Fourth, housing price data allow for estimation of a market-based measure of the welfare gain produced by the grants. Grants increase the fiscal surplus - the difference between local public sector benefits and tax liability - of the residents of a receiving locality. This increase should capitalize into property values. If the grants are used efficiently -- i.e. they produce an increase in welfare equal to their cost -- the full value of the grant will capitalize (Brueckner (1979, 1982, 1983), Barrow and Rouse (2004)). The response of property values to the grants therefore provides evidence on the efficiency of local government use of the grants. The empirical strategy exploits the sharp increase in grants arising from the 1999 reform as an instrument for state education funding to localities. The results suggest local governments spend between zero to twenty cents per grant dollar on education and the remaining eighty to one-hundred cents on property tax reduction. The results are supportive of the prediction that, in a setting in which it is likely that government spending decisions reflect the preferences of voters, grants are equivalent to a tax reduction. A theoretical argument is presented suggesting that capitalization of the grants into housing values will generate a lower predicted level of grant offset than the standard prediction. A lack of precision in the estimates, however, prevents drawing conclusions concerning the impact of the grants on property values. Finally, empirical evidence is presented that lower income communities spend a higher fraction of the grant income on education than more wealthy communities. This finding is interpreted as revealing that New Hampshire's Engel curve for education is concave. Concave Engel curves have important implications for the interpretation of offset estimates in previous empirical work. The results of this paper have two important implications for the school finance equalization literature. First, I document that school finance reform has a significant impact on taxation equity -- the distribution of tax burdens with respect to income. The recent literature on school finance reform has overlooked this aspect of finance equalization. Second, I consider a reform that did not affect marginal incentives and retained local control of school finance decisions. The work here illustrates both the strength and weakness of this approach to equalization. While the grants were non-distortionary, they also had limited impact on the distribution of educational expenditures -- a primary goal of school finance reform. The paper proceeds as follows: Section II provides background information on New Hampshire and the 1999 reform. Section III presents a basic theoretical model. Section IV discusses the data and presents summary statistics. Section V presents the empirical model and discusses identification. Section VI presents the results of estimation. Section VII provides interpretation of the results and Section VIII concludes. This section is divided into two parts. The first discusses primary and secondary education in New Hampshire and the 1999 reform. The second discusses New Hampshire's political institutions and explains why the reform grants were likely spent in a manner consistent with voter preferences. New Hampshire school districts take several organizational forms. Many districts are coterminous with municipality boundaries. In other instances, school districts are cooperatives and are composed of students from multiple municipalities. In some cases a municipality has its own school district for a set of grades, typically K - 6, and is part of a cooperative for a different set of grades, typically 7 - 12. Many municipalities send students to an outside school district and pay tuition to the district receiving the students. Tuition is usually set at the average per-pupil cost in the receiving district. The residents of the municipality sending the students are unable to vote on the school budget in the receiving district. Most municipalities which tuition students to another district do so only for the later grades, often 9 - 12, and operate a school district or participate in a cooperative for the earlier grades. Prior to the 1999 reform, New Hampshire education was funded primarily from local sources, with 87 percent of total primary and secondary education revenue coming from the local level -- the highest in the nation. The state with the next highest percent, Connecticut, attributed 57 percent of total revenues to local sources and the median state, Wisconsin, attributed 41 percent (U.S. Bureau of the Census (2000)). In New Hampshire, 9 percent of education revenue was provided by the state through an equalization program and several small categorical aid programs. Local revenue was raised almost exclusively by property taxation. The reliance on local financing created significant dispersion in per-pupil funding and property tax burdens across districts. For example, Sunapee, a town with lakefront property, spent $8,233 per pupil in current expenditures with a tax rate of 11.6 mils.3 Claremont, a property-poor town located near Sunapee, spent $4,223 per pupil with a tax rate of 23.57 mils.4 In the Claremont II ruling, issued in December of 1997, the New Hampshire Supreme Court declared the local property tax used to fund K-12 education unconstitutional. The ruling found the existing school finance scheme provided inadequate educational opportunity in property-poor towns and imposed inequitable tax burdens. There had been several attempts to enact school finance reform through the New Hampshire state courts prior to 1997. These efforts had either failed entirely or generated minor reforms. The successful 1997 suit was part of a national trend in school finance equalization based on state constitution clauses guaranteeing an adequate education. It appears that the 1999 reform succeeded where earlier efforts had failed due to the development of legal doctrine in other states. Appendix A contains a more detailed account of the history of school finance reform in New Hampshire. In response to the Claremont ruling, the state legislature enacted a major reform in November of 1999. Between the December 1997 ruling and the enactment in 1999, there was tremendous uncertainty concerning the magnitude of the reform and the details of how it would be enacted. Under the reform the `cost of adequate education' is calculated for each town. The adequate education amount is a function of the number of students in residence in the municipality, with adjustments for the number of high school students, special education students, low income students and the transportation costs of a district. A statewide property tax was also introduced. The tax imposes a uniform rate on all property in the state. It is collected locally and retained locally. If the amount collected by the tax in a municipality is less than the municipality's adequate education amount, the state issues a grant to make up the difference. These grants are referred to as reform grants. Alternatively, if the amount collected by the tax exceeds the adequate education amount, the excess is remitted to the state. Twenty percent of New Hampshire communities, containing nine percent of the state's population, made these payments in the first year of the reform. Such communities came to be know as `donor towns'. The payments of the donor towns, referred to as excess tax payments, can be viewed as negative grants. The most important determinant of the magnitude of the reform grants and excess tax payments is per-pupil property wealth. Several elements of the reform are worth emphasizing. First, the locally retained portion of the statewide property tax is simply a relabeled local property tax. These funds were previously collected by the towns, continue to be collected by the towns and are retained locally. Second, the locally retained portion of the statewide property tax is completely inframarginal -- every single community, both prior to and after the reform, chose to raise funds significantly in excess of the amount required by the statewide tax. For these reasons, in the empirical work below, the locally retained portion of the statewide property tax is considered to be local revenue. Third, the reform has no price effects. The marginal cost of education remained unchanged in all New Hampshire communities.5 The education grants are in essence lump-sum wealth transfers to the communities. They are provided with no stipulation on their use; they are pure unconditional grants. Likewise, the excess tax payments are pure negative wealth shocks to the donor towns. The reform left control of school finances completely under local control. This aspect of the reform was an explicit attempt by the legislature to preserve the state's political traditions. Fourth, the reform is large in magnitude. As displayed on Table 1, the new funding provided, $276 million, is equal to 19 percent of total pre-reform education revenue in the state. In addition, another $131 million, primarily representing funds from former programs cancelled as part of the reform, is subject to redistribution. Fifth, the reform is not self-financing -- the excess tax payments fund only ten percent of the education grants. The remaining ninety percent is raised from a variety of non-property tax, state-wide revenue sources. Table 2 presents additional information on the reform. Conditional on receiving a reform grant, the typical municipality receives approximately $1600 per-pupil (see row 8), and the average school district experiences an increase of 207 percent in state funding (see row 16). The typical donor town remits approximately $1550 per-pupil to the state (see row 9). Figure 1 graphs New Hampshire municipalities sorted by the net financial impact of the reform - the reform grant (equal to zero for the donor towns) minus grants cancelled as part of the reform minus excess tax payments (equal to zero for towns receiving reform grants). The figure shows that the net financial impact of the reform was distributed smoothly, although a few outliers are present, particularly in the negative range. These outliers are almost all small municipalities with less than 200 students. New Hampshire has a long tradition of local autonomy, colorfully expressed in the state motto "Live Free or Die." Public goods are provided at an extremely localized level and are financed via property taxation. It is the only state never to have enacted a state-wide income or sales tax and has the nation's highest property taxes when measured against income. It is one of only four states without laws restricting local government tax and spending abilities (Sexton and Sheffrin (1995)). The state is also unique in having preserved a form of direct democracy for setting the annual level of local public goods. Many of the state's municipalities and school districts operate under the traditional open meeting form of government. Proposed budgets are presented at an annual meeting and residents, acting as the legislature, vote to accept or amend the budget. Other districts operate under a regime referred to as the official ballot. A meeting of town residents is held to approve or amend the proposed budget. The budget emerging from the meeting is then voted upon by ballot at a later date. Finally, a small number of communities are no-meeting jurisdictions where a representative body, typically a city council, sets the annual budget. The determination of municipal and school budgets is a separate process.6 Budgeting decisions in New Hampshire municipalities likely express the preferences of the decisive voter, as assumed by the standard theory of intergovernmental grants.7 In the context of the identification strategy used in this paper, which uses variation in grants induced by the 1999 reform, the assertion that budgeting decisions express the preferences of the decisive voter requires two assumptions: a) the decisive voter is fully aware of the existence and structure of the 1999 reform b) the political process reflects the decisive voter's preferences. Assumption a) likely holds for two reasons. First, the reform was the central fact in New Hampshire politics over the time period studied here.8 Assumption b) likely holds for municipalities engaged in direct democracy. There are no intervening institutions to distort the decisive voter's preferences. The town meeting form of government allows the decisive voter to directly express his preferences over the provision level of public goods.9 While it is probable that assumptions a) and b) hold, it cannot be verified. What can be said with more certainty is that the decisive voter's preferences are more likely to be expressed in budgeting decisions in New Hampshire than in the settings considered in most of the previous literature. I proceed with the unverifiable assumption that budgeting decisions reflect the preferences of the decisive voter and interpret the empirical analysis accordingly. Many of the explanations for the flypaper effect can be viewed as a failure of the assumption that budgeting decisions reflect the preferences of the decisive voter. For example, Oates (1979) suggests that voter confusion concerning the average versus the marginal price effect of a grant may explain the flypaper effect -- a violation of assumption a). Filimon, Romer and Rosenthal (1982) suggest that bureaucratic capture may prevent grants from being offset -- a violation of assumption b). The New Hampshire setting also rules out another set of potential explanations for the flypaper effect. It can be argued that sending governments would not rationally provide unconditional grants if they expected them to be offset, but rather would employ a mechanism to ensure the grants were spent as intended. The failure to control for this can be viewed as a potentially serious omitted variable problem in the older flypaper literature. Finally, the state contains a large number of small jurisdictions, allowing voters to choose from a large set of public good bundles, and public goods are financed primarily out of local revenue. These facts suggest the there will be a high degree of both Tiebout (1956) sorting - sorting across jurisdictional boundaries in a manner which allows each household to consume their preferred combination of public goods and taxes - and competition among local governments. There is therefore a presumption that local public goods provision is efficient.10 For the above reasons, I argue that the New Hampshire reform provides a unusually compelling test of the theory of intergovernmental grants developed by Bradford and Oates (1971 a,b). The following simple model provides a framework for interpreting the empirical analysis.11 The decisive voter
The government budget constraint is given by Define the percent of total town property owned by the decisive voter as
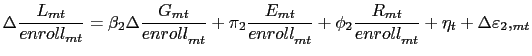
Equation (7) shows the standard offset result under property tax financing. Per-pupil education provision will increase by the decisive voter's marginal propensity to spend on education,
The offset prediction derived above implicitly assumes that all decisive voters have the same marginal propensity to spend on public goods. This would occur if the income expansion path is linear. Figure 2 graphs an expansion path for two goods -- education and the bundle of all other goods. The expansion path is linear, indicating a constant marginal propensity to spend on education. Another way to state this is that the Engel curve, the relationship between demand for a given good and income, is linear. It is plausible that the Engel curve is non-linear. Figure 3 displays a concave income expansion path. As income grows, the decisive voter's marginal propensity to spend on education decreases. A non-linear Engel curve has important implications for interpreting empirical estimates of grant offset. Segments of the population may have marginal propensities which significantly differ from the population as a whole. For example, the decisive voter at point A on the income expansion path has a relatively high marginal propensity. If grants are targeted at this group, the level of offset may be lower than the predicted -0.90 to -0.95, but still be consistent with grant and private income being perfectly fungible. The possibility of non-linear Engel curves is treated empirically below. Specifically, I assess if there is heterogeneity in the level of grant offset associated with the income level of a community. Introduction of a grant will affect housing prices. Housing prices are a function of the bundle of public goods provided by municipality The introduction of a grant changes the fiscal surplus in a receiving locality and breaks the equilibrium. An individual previously just indifferent between moving to the receiving community and remaining in their current community now has an incentive to move in order to consume the larger fiscal surplus. The incentive to relocate will increase demand for housing in the receiving community and property values will increase. Equilibrium is restored when the housing price in the receiving community has increased to the point where it perfectly offsets the increase in the fiscal surplus. Brueckner (1979, 1982, 1983) uses the capitalization insight to construct a test for the efficiency of local public goods provision. Barrow and Rouse (2004) extend this model to focus specifically on the efficiency of local education spending. The theoretical work of these papers suggests that local public goods provision is efficient if each dollar of spending capitalizes at its full net present discounted value of
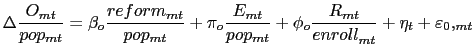
Capitalization also implies less grant offset by the decisive voter if she has a positive propensity to spend out of housing wealth, The data utilized in this paper come from multiple sources. The New Hampshire Department of Education provides data on the reform grants and enrollment by town and school district. The New Hampshire Department of Revenue Administration provides municipal-level tax data and data on aggregate property values by municipality adjusted to market value. The New Hampshire Office of State Planning provides annual population estimates by municipality. The National Public-Elementary-Secondary Finance Data, produced by the Census Bureau, provides school-district-level finance data. The 2000 Census provides demographic information. All dollar values are converted into constant 1999 dollars. In most cases the data provide a balanced panel from 1992 through 2002. Municipalities with fewer than 200 students are excluded from the sample. These municipalities display high year-to-year variance in per-pupil funding levels. Several variables, including total state education aid, are provided at the school district level, but are used in estimation at the municipality level (and vice versa). These variables are disaggregated to the municipality level using the procedure described in Appendix B. Table 2 presents summary statistics for 1998, the last year prior to the reform, and for 2000, the second year of the reform. Panel A contains municipality means. Local education revenue fell by approximately $830 per-pupil between 1998 and 2000 (see row 7). This is strong evidence that local governments offset a large portion of the reform grants. The $830 decrease in education revenue per-pupil likely understates the causal decrease in funding caused by the grants because education revenue was generally increasing during this period. The table also reveals that the market value of aggregate town property increased by approximately 20 percent on average between 1998 and 2000 (see row 10) -- a substantial increase for a two-year period. Property tax rates fell approximately 20 percent over the two years and tax rate dispersion decreased (see rows 11 - 13). The decrease in the tax rate must be interpreted cautiously. It combines the effects of the decrease in local revenue collection with the effects of the increase in property values (which mechanically drives the property tax rate down for a fixed bundle of public goods). Panel B contains school district means. Current education expenditures increased over the period. Districts which had a net financial gain from the reform and districts which suffered a net loss both increased spending by around $385 (see rows 20 and 21). The comparison suggests that the reform had little influence on educational expenditures. Similarly, there was little change in the dispersion of school district expenditures over this period (see rows 18 and 19). The response of local education funding to intergovernmental grants can be assessed with a standard fixed-effects model, estimated by differencing away the fixed effect This estimation strategy suffers from several likely sources of bias. The most serious is time-varying correlation between determinants of local funding and state grants. Such correlation can arise for any number of reasons. Suppose a municipality suffers an economic shock (a plant closure for example) that reduces its aggregate income. The income shock will cause it to decrease school funding. At the same time, grants given on the basis of community income will increase. Such a situation would generate a spurious negative correlation between grants and local revenue for education. Another source of bias arises from endogenous response to the grants. Towns receiving a grant may experience in-migration, altering the preferences of the decisive voter, and school district officials may inflate the statistics upon which grants are based in order to increase the size of the grant received.14 I use an instrumental variables strategy to overcome these problems. The reform grants represent a sharp spike in state education grants resulting from an outside body, the courts, forcing the state to issue them. They can be viewed as an exogenous shock to the level of grants received by a given municipality. The grants are functions of town characteristics measured prior to the reform and the denominator of the instrument is held at its pre-reform level. Endogenous response to the grants does not bias the instrument. Finally, any correlation between time-invariant preferences for education spending and the grants are controlled for by the fixed effect term.15 The structural equation is Baicker and Gordon (2004) document that school finance reform often leads states to reduce aid in areas other than education. Such a reduction occurred in New Hampshire. Revenue sharing to municipalities was reduced and municipalities lost a small portion of their property tax base associated with utility properties. In addition, in 2000, the year after the reform was introduced, there was an increase in state grants not associated with the reform. These three variables - lost municipal revenue sharing, lost utility property tax revenue and change in non-reform state grants - are important controls and are denoted in the structural equation as the vector
The grants were first introduced in late 1999, after budgeting decisions for the school year had already been made. The law which enacted the reform contained a provision allowing towns to call meetings in order to spend the new funds. While some districts did utilize the grants for educational expenditures in the first year (Hall (2001)), it is possible that other districts were constrained from their optimal expenditure by the timing of the grant introduction. I therefore use two and three-year differences. The estimate of offset,
The validity of the instrument is crucially dependent upon the municipal fixed-effect. It controls for municipal preferences over education that are likely correlated with the reform grant instrument. If the assumptions underlying the fixed-effect model are invalid, the instrument may also be invalid. I estimate three additional models to ensure that the fixed-effect model, and hence the instrument, is appropriate. First, I estimate a model which includes a set of municipal-specific linear trends. The structural equation is Second, I adopt a different approach to controlling for trends in local education revenue by including a vector of covariates from the 2000 Census and restricting the model to a single difference. These variables enter the model in levels and control for trends associated with the demographic characteristics of the community. For example, communities with high median household income may increase spending at a faster rate than lower income municipalities. Inclusion of a quadratic in household income controls for such trends. See Table 5 for a complete list of variables included in this model. Third, I estimate a lagged dependent variable model. It is possible that local revenue levels are serially correlated, even after controlling for the fixed-effect. The instrument, the per-pupil reform grant, is (negatively) correlated with past local revenue levels. Serial correlation in local revenue therefore potentially biases the instrument. I address this concern by explicitly controlling for the lagged value of local revenue. The structural equation is Equation (14) is not consistently estimated by OLS due to mechanical correlation between the error term and the lagged dependent variable :
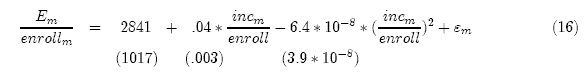
A model similar to the one above is estimated to assess the effect of the reform grants on local public goods other than education. The structural equation is This section is divided into six subsections. The first reports estimates of the response of local education revenue to a change in state education grants. The second reports estimates which explore the possibility that there is heterogeneity in the marginal propensity to spend on education. The third reports estimates for local revenue for non-education public goods. The fourth reports estimates for educational expenditures. The fifth reports estimates which explore the possibility that the results partially reflect migration endogenous to the reform. The last section reports estimates of grant capitalization into property values. Column (1) of Table 3 reports OLS estimates of the structural equation, equation (12). Column (2) includes a set of linear trends, column (3) includes a vector of demographic covariates and column (4) includes a lagged dependent variable. Finally, column (5) is estimated with the year intercepts allowed to vary by the quartile of municipal per-pupil property wealth (this specification is discussed below). Panel A presents the two-year differences and Panel B presents the three-year differences. This format is maintained on Tables 3 - 5. The OLS estimates suggest that municipalities spend approximately one-half of state education grants on education. The other half are offset by reductions in local revenue. These estimates imply a considerable flypaper effect, but are likely biased for the reasons discussed above. Table 4 reports the first-stage estimates. The instrument point estimates are not statistically distinguishable from one, suggesting the reform grant instrument has the expected gradient with respect to total state funding. The reform grant coefficients are estimated very precisely. Table 5, Panel A, reports the IV estimates of the structural equation utilizing two-year differences. These estimates can be interpreted as the causal response of local education revenue to the receipt of grant income from the state. The standard theoretical treatment suggests the estimates should be in the range of -0.9 to -0.95. The primary result, presented in column (1), suggests that receipt of one dollar of grant income induces municipalities to reduce local funding of education by 82 cents. The result is robust to the inclusion of a set of municipal linear trend terms, the inclusion of a vector of covariates and the inclusion of a lagged dependent variable in columns (2), (3) and (4), respectively. Columns (2) through (4) suggest that the assumptions of the fixed effect model are not violated by the data and that the instrument is valid. Column (5) provides an additional robustness check. It allows the year intercepts to vary by the quartile of per-pupil property wealth in 1998, the year prior to the reform. Allowing the year intercepts to vary controls for the possibility that property wealthy districts are increasing education funding at a faster rate than less wealthy districts. Such a scenario would bias the instrument. The results are invariant to the allowing the year intercepts to vary. 18 Those municipalities which make an excess tax payment to the state experience a negative wealth shock. The theoretical treatment above suggests these municipalities should reduce local education revenue by 5 to 10 cents per dollar of excess tax payment. While the estimates on Table 5, Panel A, generally fall within this range, they are estimated imprecisely. A response of the predicted magnitude is likely too small to estimate with precision given the sample size. Theoretically, the response to the excess tax payment plus the response to the state grants should equal negative one. The estimates in column (1) fail to reject this hypothesis with a p-value of 0.37. The remaining columns similarly fail to reject the hypothesis. Appendix C presents the full regression results for Table 5, Panel A. The appendix includes a discussion of the coefficient estimates for the variables included to control for revenue loss associated with the reform and the post-reform increase in non-reform state grants. The above estimates suggest that approximately 80 percent of the education grants were offset in the second year of the reform. Although these estimates are somewhat smaller than predicted by the standard theory, they do suggest that the basic presumption of the theory holds. An alternative explanation is that municipalities are initially constrained from spending the grants. Making capital improvements takes time and there may be a limited supply of teachers available for hire. Panel B therefore presents the results for the three-year differences. These are estimates of the response to the reform in its third year. Panel B provides no evidence that short-run constraints explain the level of offset estimated in Panel A. The extent of grant offset may have actually increased in the third year of the reform relative to the second. The standard specification suggests that 92 cents per grant dollar were offset, while the specification which includes the set of covariates and the specification which allows the year intercepts to vary by the quartile of per-pupil property wealth both suggest complete offset of the grants. These estimates are quite close to the theoretical prediction. The results from the remaining two specifications in Panel B - the linear trend and the lagged dependent variable specifications - both suggest a level of offset of approximately 80 cents, similar to the estimates in Panel A. It should be noted that while these specifications are important checks on the validity of the empirical model, the linear trend terms and lagged dependent variable may capture part of the effect of grant introduction and thereby bias the estimate of grant offset toward zero. The potential for such bias increases as the number of longitudinal observations used to estimate the coefficients on the trend terms and lagged dependent variable decreases. The use of longer differences, such as the three-year differences, reduces the longitudinal size of the sample and thereby increases the likelihood of such bias. Nonetheless, these specifications remain important robustness checks and provide a lower-bound estimate of offset for the third year of the reform of approximately -0.8. The structural equation does not control for time-varying covariates because of the possibility of bias arising from endogenous response to the grants. Perhaps the most significant omitted time-varying covariate is the number of students in a municipality. Appendix Table A2 present specifications identical to those on Table 5, but which include the log number of pupils as a time-varying covariate. The results are quite similar to those found on Table 5. Table 6 present two types of robustness checks. The first, displayed in columns (1) and (2), is a falsification test. Column (1) presents the estimates of a reduced form model similar to equation (15). The reduced form estimate of offset is -0.83 -- almost identical to the comparable IV estimate in column (1), Panel A, of Table 5. Column (2) presents the falsification test. The data is restricted to 1992 through 1998 and a placebo grant is generated by giving each municipality in 1998 the grant it actually received in 2000. The point estimate on the placebo grant is small and imprecise. The falsification test suggests misspecification is not responsible for the results. It also rules out the possibility that municipalities anticipated the grants in 1998 and responded by increasing spending in the 1998 school year. Such behavior would bias the offset estimates presented on Table 5 toward negative one. The second robustness check assesses if the level of offset estimated on Table 5, Panel B, persisted into later years. Specifically, columns (3) and (4) present the results of an IV model using four-year differences. The estimates indicate the level of offset in 2002, the fourth year of the reform. The 2002 response is potentially significant because 2002 budgeting decisions were made after a summer 2001 announcement by the legislature that the grant formula was permanent. Although the reform itself was almost surely permanent, the grant formula, in particular the precise size of the grant to a given community, could have undergone minor changes. This was no longer the case after the announcement. If decisive voters in the pre-2002 period were uncertain as to the permanence of the grants, this may have altered the behavioral response. Although such uncertainty is unlikely, empirically assessing the response in 2002 is important. The 2002 grant variable is problematic. It is based on school and community characteristics in 1999 -- the first year of the reform. Use of the reform grants as an instrument in 2002 introduces the possibility of endogenous response bias. To address this possible bias, the instrument is lagged one year. The reform grants prior to 2002 were based on community and student characteristics measured prior to the reform. The results suggest that the level of offset in 2002 was virtually identical to the level of offset in 2001. If the grants had been viewed as impermanent in the pre-2002 period, it is likely the level of offset would have been higher in the pre-2002 period that afterwards because voters may have feared having to pay for increased expenditures in the future if the grants were reduced (for instance, after a new teacher is hired, he will likely be retained and paid regardless of what grants are received.) The fact that the level of offset was constant indicates that the grants were considered permanent prior to the summer 2001 announcement. More generally, they suggest the results on Table 5, panel B, reflect the permanent response to the grant introduction. Many of the explanations for the flypaper effect concern the type of political institutions within which public goods provision decisions are made. New Hampshire provides a unique opportunity to assess these explanations. Column (1) of Table 7 presents a specification, utilizing two-year differences, which allows the extent of offset to vary both by type of government and by whether or not a municipality was a plaintiff in the Claremont case. The results show no heterogeneity by political institution. The surprising result that towns engaged in representative democracy respond in the same manner as towns engaged in direct democracy is potentially explained by the prominence of the reform. Voter knowledge of the reform may have constrained elected officials to spend the grants in a manner consistent with voter preferences. The plaintiff towns spent approximately 17 cents per dollar more out of the grants than the typical municipality in the second year of the reform. Participation in the suit may reveal an unusually strong preference for education. The plaintiff town effect is short lived, however. There is no evidence of an effect in the third year of the reform - see column (4). Many municipalities tuition students -- i.e. they send students to an outside school district which is neither operated by the sending municipality nor a cooperative of which the sending municipality is a member. The sending districts pay a flat per-student fee equal to the average cost of per-pupil education in the receiving district. Under the assumption that the per-unit cost of education production is not a function of the number of students enrolled, the marginal incentives for a receiving district are unaffected by a tuitioning agreement. The tuition agreement does, however, alter the behavior of the decisive voter in the town sending tuition students. A district sending all of its students is constrained from spending the grant on education. These districts have no ability to influence spending decisions at the margin. Districts which tuition a portion of their students, for example 9-12th grade, will be partially constrained from increasing education spending. Columns (2) and (3) are restricted to municipalities which operate their own school district. Towns engaged in cooperatives are excluded. Column (3) suggests this group offsets approximately 98 cents per grant dollar, an increase from the estimate for the whole sample. Column (3) allows the extent of offset to vary by whether or not a municipality tuition students. The point estimate suggests, as predicted, that districts which tuition students offset a larger percent of the grants, although the estimate is only marginally significant in the second year of the reform and is insignificant in the third year - see column (6). The estimates of offset in the first row of columns (3) and (6) are important. They are estimates of offset for municipalities which operate their own district and do not tuition students. These municipalities are solely responsible for the spending decisions in their school districts and are unconstrained in their decisions by tuitioning arrangements. In addition, the data for these municipalities does not suffer from possible measurement error associated with mapping the variables from school districts to municipalities (see Appendix B). As a result of the above factors, these municipalities provide a particularly straightforward test of the theory. The two and three-year estimates of offset for these districts are -0.93 and -0.95, respectively. Unreported results for these districts in the fourth year of the reform, available from the author upon request, suggest grant offset of -0.90. These estimates are essentially constant over the three years and are very similar to the estimates of the model utilizing the full sample for the third and fourth years of the reform (see Table 5, Panel B and Table 6, respectively). These estimates support the conclusion that the response to the reform was to offset the theoretically predicted 90 to 95 cents per grant dollar. As discussed in section III, it is possible that decisive voters of different income levels have different marginal propensities to spend on public goods. In order to assess this possibility the following equation is estimated on a cross-section of New Hampshire municipalities in 199819, the year prior to the reform Figure 4 displays the positive cross-sectional relationship between per-pupil income and per-pupil education revenue. In addition to the raw data, it plots the OLS trend line and the results of a locally weighted regression of
In order to more rigorously asses if there is heterogeneity in the marginal propensity to spend on education, Table 8 reports estimates of equation (12) which interact the change in state aid with indicator variables for the four quartiles of median household income. These estimates can be interpreted as tracing out a four point Engel curve for New Hampshire. The slope of the Engel curve at the four points is obtained by adding the estimates of offset for each quartile to 1.21 Column (1), which displays estimates for the second year of the reform, suggests that the wealthiest quartile has a 10 to 15 cents per dollar lower marginal propensity to spend on education than the other three, less wealthy, quartiles. The result supports the theory that the Engel curve for education is concave. The results for the third year of the reform, displayed in Column (3), suggest that the second quartile has a 15 cents per dollar higher marginal propensity than the remaining three quartiles. While the lowest income communities are estimated to have a marginal propensity equal to the third and top quartile communities, the results are compatible with lower income communities, in this case those in the second quartile, having a higher marginal propensity. It should be noted, however, that the responses by quartile are not statistically different from each other in the second or third year of the reform. Columns (2) and (4) present the results of an alternative model. The change in state aid, income quartile interaction terms are replaced by a single interaction term - the interaction of the change in state aid and median household income. The model allows the level of offset to vary linearly with income. Both the second and third year estimates suggest that lower income communities have a higher marginal propensity to spend on education. The interaction term coefficient estimates are significant and marginally significant, respectively. The third year estimates imply grant offset of -0.9, -0.94 and -1.01 for the 25th, 50th and 75th median income municipalities, respectively. Figure 5 presents the results of an extremely flexible reduced form specification. The specification interacts the per-pupil reform grant with a quartic in median household income. The model allows the level of offset to vary with income in a non-linear manner. The figure indicates that grant offset increases with median household income, again consistent with a concave Engel curve.22 The results presented above, viewed jointly, suggest the Engel curve for education is concave.23 Lower income municipalities offset grants to a lesser extent than wealthier municipalities, indicating that such communities have a higher marginal propensity to spend on education. Concave Engel curves exist under several different scenarios. For example, if all decisive voters in New Hampshire have identical preferences and there are decreasing marginal returns to education expenditures, the Engel curve will be concave. The concavity of the Engel curve is important in interpreting the estimates of offset in the previous literature on intergovernmental grants. Under the assumption of a concave Engel curve, the bundle of all non-education goods is a luxury good. As income grows, the marginal propensity to spend on education decreases. Low income groups offset less of the reform grants not due to a flypaper effect, but because they have a higher marginal propensity to spend on education. Estimates of offset below the standard prediction of -0.9 to -0.95 may reflect the concavity of the Engel curve, not a violation of the equivalence of grant and private income. This point is discussed in greater detail in section VII below. The wealth shock induced by the reform grants should increase provision of non-education public goods by the decisive voter's marginal propensity to spend on such goods. Estimation of equation (15) using two-year differences provides no evidence that provision of other public goods increased. These estimates are presented on Table 9, Panel A. Column (1) is the standard model, column (2) includes municipal linear trends, and column (3) adds a vector of covariates. The estimates range from 5 to 7 cents of additional other public goods provision per reform grant dollar. These estimates are consistent with the theoretical prediction, but are estimated imprecisely. Panel B presents the estimates for the third year of the reform. The point estimates are close to zero, suggesting the reform grants induced no change in the provision of other local public goods. The portion of the grants not spent on education could have been used for one of two purposes -- funding non-education public goods or financing property tax reduction. The lack of evidence for a change in the provision level of other public goods indicates the offset portion of the grants were used to fund tax reduction. The table provides some evidence that the excess tax payments reduced the provision of other local public goods. The estimates in Panel A are between 6 and 10 cents. The estimates are compatible with the theoretical prediction and are precisely estimated in columns (1) and (3). The results for the third year of the reform are too imprecise to draw conclusions. The extent of offset documented above suggests that the reform had limited impact on educational expenditures. Table 10 attempts to document where the funds that were not offset were spent in the second year of the reform. The estimates are obtained by estimating the empirical model at the level of the school district using expenditure data from the Census school finance data. The dependent variable in columns (1) and (2) is current expenditures (which excludes capital expenditures). The dependent variable in columns (3) and (4) is capital expenditures. Although the estimates are imprecise, they are compatible with the revenue estimates on Table 5. The point estimates from the standard model, columns (1) and (3), suggest that 17 cents per grant dollar were spent on education. The corresponding estimate on Table 5 suggests that 18 cents was spent. Estimates for the third year of the reform, not reported, are similarly imprecise. It is important to note that capital expenditures may be financed with debt. A capital expenditure may appear in a single year, but be financed over a number of years. This alters the interpretation of the coefficient estimates for capital expenditures and potentially explains their imprecision. Interest payment on debt is used as the dependent variable in columns (5) and (6). If school districts respond to the grants by engaging in large-scale capital projects financed by debt, this will be reflected in expenditures on interest. The estimates provide no evidence of debt financed capital spending in response to the reform. The inability to precisely estimate an expenditure response may be due to the expenditure data being of a lower quality than the administrative revenue data. It may also arise from the fact that the expected expenditure response is smaller than the expected revenue response and therefore more difficult to estimate precisely. The interpretation of the results has implicitly assumed that the identity of the decisive voter in each New Hampshire municipality is not altered by the reform. This implicit assumption deserves scrutiny. The reform potentially breaks the Tiebout equilibrium in the state and may produce migration as individuals re-optimize their selection of public good bundles in response to the reform. Such endogenous migration would alter the interpretation of the results. While it is not possible to directly test for endogenous migration, Table 11 assesses whether the observable characteristics of communities change in response to receipt of reform grant income. The observable characteristics are the number of students residing in a municipality, the percent of students eligible for the free lunch program and the percent of students who are white. The model is reduced form and three-year differences are used. There is no evidence of endogenous migration - the estimates are uniformly extremely imprecise. These results support the interpretation offered above which assumes the reform does not endogenously change the identity of the decisive voter. The response of property values to the reform provides a market-based summary of the incidence of the grants. It also provides a test of the efficiency of the market for local public goods in New Hampshire. The extent of offset guarantees that the grants generate a significant increase in the fiscal surplus of a receiving locality -- the same bundle of public goods is provided with a reduced tax burden. If the market for local public goods is efficient, this increase in fiscal surplus will be reflected in the price of property in the receiving district. The extent of capitalization therefore tests not only the efficiency of local government use of the grants, but also the efficiency of the market for public goods. Figure 6 plots the aggregate market value of all property in New Hampshire by year. Aggregate property values display a U-shaped pattern, reflecting the property bust of the early 1990s and the boom of the late 1990s. The grants must be perceived as permanent in order for capitalization to occur. The reform was announced in the fall of 1999 and the legislature announced that the grant formula was permanent in the summer of 2001. In 1999 it was clear that the reform was permanent, but the precise size of the grants could have undergone minor revision. The similar response of local education revenue to the grants in 2000 and 2001 (the three and four-year difference results, respectively) suggests the reform was perceived as permanent prior to 2001. Nonetheless, it is important to test if the extent of capitalization differs before and after the 2001 announcement. A further complication arises from the fact that the property value data for a given year are collected from October 1 to Sept. 31. For 2002, a municipality's aggregate property value is determined using data from October 1, 2001 -- Sept. 31, 2002. Figure 7 displays the time line of the reform in relation to the measurement of property values. It shows that the data from 2002 are the first that will fully reflect capitalization arising from the announcement that the precise structure of the reform was permanent. It also shows that the data from 2001 are problematic because they combine data from before and after the reform was announced as permanent. Similarly, a small portion of the 2000 data reflects property values before the reform was initially announced. The extent of capitalization is explored using the following fixed-effect specification The results of estimation, presented in column (1) of Table 12, provide no evidence of capitalization; the estimates are extremely imprecise. Column (2) allows the extent of capitalization to vary by pre and post 2001. This specification accounts for the 2001 announcement that the precise structure of the reform was permanent. Again, there is no evidence of capitalization. If the rapid increase in property values displayed in Figure 6 was not experienced equally by all municipalities, the fixed effect model may be inappropriate. Column (3) includes linear trend terms to control for possible differential trends in the rate of property appreciation. Such a model, which specifies the dependent variable in log form and employs linear trends, is often referred to as a random growth model (Heckman and Hotz (1989)). The random growth model produces a substantially larger point estimate, but again the results are imprecise. The lack of precision in the estimates prevents drawing any conclusions concerning the extent of capitalization of the grants. This section is divided into two subsections. The first interprets the empirical estimates in relation to the theoretical predictions provided in section III and discusses the estimates in relation to the previous literature on intergovernmental grant. The second interprets the results in relation to school finance reform. Estimation of the empirical model suggests the response of New Hampshire's decisive voters to the reform was to offset 80 cents to 100 cents per grant dollar. The failure to find evidence of a change in the provision of non-education public goods indicates the offset portion of the grants was used entirely to fund property tax reduction. The grants were equivalent to a tax reduction. The basic premise of the Bradford and Oates (1971 a,b) model is supported by the empirical analysis presented in this paper. The lower half of the range of estimates, 80 to 90 cents, is somewhat smaller than the standard theoretical prediction of 90 to 95 cents per dollar. There are two possible interpretations of this deviation from the strict theoretical prediction. The first interpretation is that the results are fully consistent with grant and private income being perfectly fungible. This interpretation is based on two considerations. First, the estimates which fall below the theoretical prediction are not statistically distinguishable from the predited level of offset and many of the results are fully consistent with the theoretical prediction. Particularly important are the results from the standard model for years three and four of the reform and the results for all years of the reform with the sample restricted to the set of districts operating their own district and not engaged in tuitioning students. The estimates from the third and fourth year of the reform are more likely than the estimates from the second year to represent the permanent response to the reform. As discussed in section VI.1, the estimates based on municipalities operating their own district and not engaged in tuitioning provide an especially straightforward test of the theory. These estimates are tightly clustered from -0.9 to -0.95 - precisely the range of the theoretical prediction. Second, as shown in section III, if the decisive voter has a propensity to spend out of housing wealth and the grants capitalize into property values, the predicted level of offset decreases. With a relatively low marginal propensity to spend out of housing wealth of 5 cents per dollar, the predicted offset is 85 to 92 cents per grant dollar. While the property value results displayed on Table 12 fail to confirm that the grants capitalized, they do not reject such capitalization. The second possible interpretation of the lower range of the results is that they indicate a flypaper effect, although one considerably smaller than that suggested by the majority of the previous literature. Ultimately, the empirical estimates presented in this paper are not precise enough to firmly distinguish between the two interpretations. Whichever of these interpretations is accepted, the estimates can unambiguously be interpreted as showing that, in an environment similar to that assumed by Bradford and Oates (1971 a,b), grant income is largely used to fund tax reduction. The basic premise of the theory is shown to be valid. There is evidence that low income municipalities offset a lesser percentage of the grants than higher income communities. This raises the possibility of heterogeneity in the marginal propensity to spend on education. Specifically, it suggests a concave Engel curve. Concave Engel curves have important implications for previous estimates of grant offset. The extent of grant offset in this paper is estimated using most of the New Hampshire income distribution - over 90 percent of the New Hampshire population lives in a community which receives a reform grant. The empirical model is unweighted. Communities at different points in the income distribution receive equal weight in estimating the parameters. Many previous papers, however, use empirical strategies which estimate the level of offset for the mean grant dollar. For example, weighting the estimates in this paper by student enrollment would produce estimates of the level of offset for the mean grant dollar.24 Mean grant dollar offset estimates will largely reflect the preferences of low income voters if the grant program being studied is targeted at low income communities. Formally, empirical estimates of offset based on the mean grant dollar are a weighted average of the offset level for each municipality The results of this paper have implications for future work on intergovernmental grants. They suggest the flypaper effect fails or is small in a setting similar to that assumed by the standard theory. They should not be taken as indicating that the flypaper effect never operates. Indeed, the results have important implications for situations in which the flypaper effect does operate. They suggest that efforts to explain the flypaper effect should start with, or at minimum seriously consider, the traditional explanations such as voter misperception or bureaucratic capture. These explanations focus on institutional factors which prevent the decisive voter's preferences from being expressed. Strumpf (1998), which suggests that the degree of voter misperception produces heterogeneity in the flypaper effect, is a useful step in this direction. More work in this vein is needed. Fiscal equity has two components -- taxation equity and expenditure equity (Inman and Rubinfeld (1979)). The recent literature on school finance reform has extensively considered expenditure equity, the relationship between expenditures and income, but has not examined taxation equity, the relationship between tax burden and income. Given the imprecision of the expenditure estimates, it is difficult to estimate the impact of the reform on expenditure equity. The summary statistics presented in Table 2 indicate a small decrease in the dispersion of expenditures. The introduction of the grants substantially reduced dispersion in property tax rates. An offset estimate of -.9, the midpoint of the range of estimates presented in this paper, implies the reform grants caused the log 90-10 ratio to fall from 0.65 to 0.45 and the coefficient of variation to fall from 0.24 to 0.19.25 Although these are significant reductions in dispersion, the interpretation is unclear. Equity is typically considered in relation to income. A potentially more meaningful assessment of tax equity is the elasticity of property tax burden with respect to income (which should be interpreted as a descriptive statistic, not a behavioral parameter).26 An elasticity of one indicates a neutral tax -- the tax burden increases proportionally with income. The reform increased the elasticity from 0.42 to 0.64, a significant reduction in the regressivity of the property tax. Judged by this metric, the grants were quite successful at reducing taxation inequality in New Hampshire. If taxation equity is valued by policy makers, it is a significant piece of the cost-benefit analysis of school finance reform that has been overlooked by the recent literature on school finance reform. The New Hampshire reform is interesting in the context of school finance equalization because it had no impact on marginal incentives and retained local control of school finances. On the financing side, the reform was funded primarily by statewide, non-property taxation. This is the type of financing advocated in Hoxby's (1996, 2001) influential work on school finance equalization. This type of financing was undoubtedly advantageous. There is no evidence of the distortion of school finance decisions and property values in wealthy communities documented in Hoxby and Kuziemko (2004). On the expenditure side of the reform, the retention of complete local control was problematic. A primary aim of the reform was to reduce expenditure disparities between school districts. The behavioral response of the receiving municipalities severely limited the amount of equalization achieved. The results of this paper suggest that distortion of the financing decisions of districts receiving grants is required to achieve equalization. These distortions should be viewed as part of the cost of equalization in the cost-benefit analysis of school finance reform. This paper documents that in a setting in which there is a strong presumption that public good provision decisions reflect the preferences of a community's decisive voter, 80 to 100 cents per grant dollar are used to fund tax reduction. The estimates support the basic premise of Bradford and Oates (1971a,b) that grant income is equivalent to a tax reduction. In addition, it is shown that the Engel curve for education is concave, a finding with implications for the empirical literature on intergovernmental grants. Specifically, it suggests that estimates of offset below the predicted 90 to 95 cents per grant dollar may not represent a violation of the fungibility of personal and lump-sum grant income. Two contributions are made to the literature on school finance reform. First, the paper considers the impact of school finance reform on taxation equity. To the extent that policy makers value taxation equity, it is an important component of the cost-beneift analysis of school finance reform that has been largely ignored. Second, the results suggest that in order for school finance reform to reduce dispersion in educational expenditures, some distortion of the incentives of the localities receiving aid is required. Finally, the results of the paper can be interpreted more broadly. New Hampshire is a unique setting for studying the provision of local public goods. There are a large number of small jurisdictions providing public goods largely from own source revenue. Many of these jurisdictions use a form of direct democracy to determine the provision level of public goods. These facts generate the expectation that the public goods provision process will allocate the level of public goods consistent with the preferences of each municipality's decisive vote - i.e. that the provision process is allocatively efficient. The evidence that most of the grant income is used to fund property tax reduction, and hence is ultimately used to fund private consumption, is consistent with this hypothesis. Appendix A: School Finance Reform in New Hampshire Prior to the 1999 reform there had been several attempts at reforming school finance in New Hampshire through the state courts. The most recent was the 1982 Jessemen suit which was settled out of court when the state legislature enacted a minor reform. It was the habitual failure of the legislature to fully fund this reform that led to the Claremont suit being filed in 1991. The Claremont reform is part of the national `third wave' education reform27 based on state constitutional clauses guaranteeing an adequate education. These reforms began with a 1989 ruling by the Kentucky Supreme Court. From 1990 through 1999, eleven states have enacted these type reforms. Of particular importance for New Hampshire was an early 1990s ruling in Massachusetts. New Hampshire's constitution is copied in large part from Massachusetts's. The educational clauses in the two constitutions are virtually identical. As a result, when the Claremont decision was being decided, the New Hampshire Supreme Court had a ruling on a very similar suit based on the exact same constitutional language. The Massachusetts decision was cited at length in the Claremont decision. The Kentucky decision is also quoted. It seems clear that it was the development of legal doctrine in other states that dictated the Claremont case's success as compared with the failure of earlier suits. Appendix B : Data Appendix Several variables used in estimation at the municipal level are only available at the school district level and vice versa. These municipal level variables are generated by mapping the variables from the district level to the municipal level. In cases where a municipality is part of only a single school district, the mapping is one-to-one. When a municipality is part of two or more school districts, assumptions must be made. The New Hampshire Department of Education divides the tax base of each municipality into separate pieces corresponding to the school districts the municipality participates in. This is done on the basis of the percentage of total students in the municipality attending each school district. I follow this convention. Variables are mapped from the school district level to the municipal level based on the percent of total municipal students enrolled in each relevant school district. The empirical results are robust to alternative mappings -- for instance mapping based on the percentage of total municipal education revenue going to each relevant school district in the year prior to the reform. The municipal population variable is an estimate produced by the New Hampshire Office of State Planning, except for in 2000, when the Census population figure is used. Many municipalities have large jumps in the population variable in 2000 due to error in the non-Census estimates. It is likely that these errors were gradual and accumulated over the decade as time passed from the 1990 Census. I therefore apportion the error in the population estimate, revealed by the 2000 Census, equally over the years from 1991 to 1999. This produces a substantially smoother population variable. The observation from the municipality of Seabrook is omitted. Seabrook contains a nuclear power plant. The plant was successively devalued over the course of the 1990s. As a result, Seabrook lost close to $800 million in property value, a situation which generates uncertainty concerning the data quality of the variables pertaining to property wealth and property taxes. This is a unique situation unrelated to the school finance reform. Two municipalities participating in inter-state school districts (both municipalities are in cooperatives with municipalities in Vermont) are omitted from the sample. These two municipalities are dropped due to longitudinal inconsistency in the way revenue from the Vermont municipalities is handled. Appendix C : Full Regression Results of Table 4 Table A1 presents the full set of coefficient estimates for the specifications displayed on Table 5 (with the exception of the large vector of demographic covariates included in column (3) -- these are available from the author upon request). The additional coefficient estimates displayed are lost municipal revenue sharing, lost utility property tax revenue and change in non-reform state grants. The state reduced its level of direct financial support to municipalities when it enacted the 1999 education finance reform. The lost revenue sharing aid is a negative wealth shock to the community. Assuming a marginal propensity to spend on education of 5 cents per dollar, the expected point estimate on this variable is .95. The municipality will replace the lost funds, with the exception that the negative wealth shock will induce a 5 cents per lost revenue sharing dollar decrease in education expenditures. The locally-retained portion of the statewide property tax is simply a relabeling of the already existing local property tax. An exception to this pertains to utility property. The state retains 100 percent of revenue collected by the statewide property tax on utility property. This revenue previously was collected by the municipalities. The expected sign on this variable is -.05. The municipality will increase the tax rate to replace the lost tax revenue, but will decrease total education funding by 5 cents on the dollar in response to the negative wealth shock. Finally, in 2000, the state expanded several non-reform education grant programs. The largest expansion was in grants aimed at assisting with capital expenditures. Controlling for this expansion is important for the first-stage reform grant estimates. The new 2000 aid went disproportionately to the same districts that received the reform grants. Failure to control for these new grants might bias the first-stage. Table A1 shows that the coefficients on the two lost revenue variables are imprecisely estimated in all specifications. There is no evidence of a response to these negative wealth shocks. Their inclusion, however, insures that the coefficient estimates of interest, change in state aid and excess tax payment, do not suffer from omitted variable bias. The change in the non-reform grants variable is positive and precisely estimated in most of the specifications. This reflects the fact that the majority of the new grants were matching grants which required an increase in local tax revenue. Anderson, Nathan, "Taxing Business: Effects of Commercial-Industrial Property on Local Fiscal Policy", mimeo, University of Illinois at Chicago, 2005. Anderson and Hsiao, "Estimation of Dynamic Models with Error Components", Journal of the American Statistical Association, Vol. 76, No. 375, 1981. Arellano, Manuel, Panel Data Econometrics, Oxford University Press: Advanced Texts in Econometrics, Oxford, 2003. Baicker, Katherine, "Government Decision-Making and the Incidence of Federal Mandates", Journal of Public Economics, Vol. 82 no. 2, 2001. Bradford, David and Wallace E. Oates, "Towards a Predictive Theory of Intergovernmental Grants", American Economic Review, Vol. 6, No. 2 1971b. Brueckner, Jan, "Property Values, Local Public Expenditure and Economic Efficiency", Journal of Public Economics, Vol. 11, 1979. Brueckner, Jan, "A Test for Allocative Efficiency in the Local Public Sector", Journal of Public Economics, Vol. 19, 1982. Brueckner, Jan, "Property Value Maximization and Public Sector Efficiency", Journal of Urban Economics, Vol. 14, 1983. Brennan G., and James Buchanan, The Power to Tax: Analytical Foundations of a Fiscal Constitution. Cambridge University Press, Cambridge, 1980. Gordon, Nora, "Do Federal Grants Boost School Spending? Evidence from Title I", Journal of Public Economics, Volume 88, Issues 9-10, 2004. Hines, James R., Richard H. Thaler, "Anomalies: The Flypaper Effect", Journal of Economic Perspectives, Vol. 9, No. 4, pg. 217 - 226, 1995. Hoxby, Caroline, "Are Efficiency and Equity in School Finance Substitutes or Complements?", Journal of Economic Perspectives, Vol. 10, No. 4, 1996. Hoxby, Caroline, "All School Finance Equalizations are Not Created Equal", Quarterly Journal of Economics, pg. 1189 - 1231, November 2001. Hoxby, Caroline and Iilyana Kuziemko, "Robin Hood and His Not-So-Merry Plan: Capitalization and the Self-Destruction of Texas School Finance Reform", mimeo, Harvard University, February 2004. Megdal, Sharon, "The Econometrics of Piecewise-Linear Budget Constraints", Journal of Business and Economic Statistics, Vol. 5, No. 2, April 1987. Michener, R. Dean, "New Hampshire" in Public School Finance Programs of the United States and Canada, 1998 - 1999, National Center for Education Statistics, web only publication at http://nces.ed.gov/edfin/publications/pubs.asp, 2001. Minard, Richard A. and Melissa Gagnon, "SB2 at 5: Bonds, Ballots, and the Deliberative Session", New Hampshire Center for Public Policy Studies, 2002. Moffitt, R., "The Effects of Grants-in-Aid on State and Local Expenditures: The Case of AFDC", Journal of Public Economics, Vol. 23, Pg. 279 - 305, 1984. Oates, Wallace, "The Effects of Property Taxes and Local Public Sector Spending on Property Values: An Empirical Study of Tax Capitalization and the Tiebout Hypothesis". Journal of Political Economy, Vol. 77, No.6, 1969. Oates, Wallace, "Lump-Sum Intergovernmental Grants Have Price Effects", Mieszkowski and Oakland eds., Fiscal Federalism and Grants-in-Aid, Washington D.C.: Urban Institute, 1979. Singhal, Monica, "Special Interest Groups and the Allocation of Public Funds", mimeo, Harvard Kennedy School of Government, Oct. 2005.
Introduction
Background
The New Hampshire System of Public Schools and the 1999 Reform
The reform was politically unpopular because it clashed with New Hampshire's strong tradition of local governance. Initially a constitutional amendment was proposed to reverse the decision, but it fell far short of the support required for passage. At any given point between the ruling and the enactment, there were dozens of proposed reform plans being considered by the legislature. On three occasions the state Supreme Court ruled that reforms proposed by the legislature were insufficient. The final such instance occurred after the start of the 1999 school year - the year the new finance scheme was legally mandated to begin. The legislature passed a reform acceptable to the court only after facing the prospect of the state's school districts entering insolvency due to a legal prohibition on raising funds under the old financing scheme.Are Political Decisions Likely to Express the Preferences of the Decisive Voter?
Second, to participate in the political process, most voters have to attend a town meeting where the issues are discussed and then voted on. Under these conditions it is probable that the decisive voter has full information on the reform.
An example of this type of argument is Chernick (1979) who suggests that the flypaper effect arises from grants being a repeated game. Receiving governments fear losing a grant if they fail to spend it as intended by the sending government. The repeated game aspect of a grant is the mechanism used to ensure it is not offset. The New Hampshire reform does not suffer from this omitted variable problem. The reform was imposed by an outside body. No agent has the ability to revoke the grants.Theoretical Predictions
Grant Offset Prediction
![]() in municipality
in municipality
![]() , assumed to have a single child enrolled in municipality m's schools, has the following preferences and budget constraint
, assumed to have a single child enrolled in municipality m's schools, has the following preferences and budget constraint
![]()
(1)
![]() denotes the personal consumption of individual
denotes the personal consumption of individual
![]() (all prices, other than property prices, are normalized to 1 for simplicity),
(all prices, other than property prices, are normalized to 1 for simplicity), ![]() denotes the service level provided by the property owned by individual
denotes the service level provided by the property owned by individual ![]() ,
, ![]() denotes the units of per-pupil education provided by municipality
denotes the units of per-pupil education provided by municipality ![]() ,
, ![]() denotes the units of per-resident other (i.e. non-education) local public services, y
denotes the units of per-resident other (i.e. non-education) local public services, y![]() denotes income,
denotes income,
![]() denotes the property tax rate and
denotes the property tax rate and ![]() denotes the value of property owned by individual
denotes the value of property owned by individual ![]() . The congestible local public goods,
. The congestible local public goods, ![]() and
and ![]() , are financed by a property tax and grants from the state.
, are financed by a property tax and grants from the state.
![]() is the level of provision of all public goods (education and other);
is the level of provision of all public goods (education and other);
![]() where
where ![]() and
and ![]() are the number of students and residents (i.e. voters) respectively in municipality
are the number of students and residents (i.e. voters) respectively in municipality
![]() ;
; ![]() is total property tax revenue and is equal to the tax rate times the aggregate value of property in town
is total property tax revenue and is equal to the tax rate times the aggregate value of property in town ![]() .
. ![]() is the level of the state provided lump-sum grant.
is the level of the state provided lump-sum grant.
![]() where the subscript
where the subscript
![]() denotes the decisive voter. Solving for
denotes the decisive voter. Solving for ![]() in (3) and inserting into (2) yields a redefined budget constraint for the decisive voter
in (3) and inserting into (2) yields a redefined budget constraint for the decisive voter![]() , and inserting (6) yields
, and inserting (6) yields
![]() times the adjustment factor
times the adjustment factor
![]()
![]() . The adjustment factor is the percent of property owned by the decisive voter weighted by the number of students residing in the town.
. The adjustment factor is the percent of property owned by the decisive voter weighted by the number of students residing in the town.
Similary, per-resident other public goods provision will increase by
![]() times the adjustment factor
times the adjustment factor
![]()
![]() . Under the assumption that a town's taxable property is distributed equally among voters and that each voter has a single child enrolled in the town's school, the adjustment factors
. Under the assumption that a town's taxable property is distributed equally among voters and that each voter has a single child enrolled in the town's school, the adjustment factors
![]() and
and
![]() equal one and the result collapses to the easily interpreted offset result
equal one and the result collapses to the easily interpreted offset result
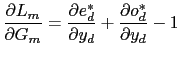
(8)
![]() , is between 0.05 and 0.10 (Hines and Thaler (1995))12, implying that
, is between 0.05 and 0.10 (Hines and Thaler (1995))12, implying that
![]() should equal between -0.9 and -0.95. Each dollar of grant income received by a municipality will result in a reduction in local spending of ninety to ninety-five cents and this reduced spending will be used to finance property tax reduction. Testing this prediction is the primary focus of the empirical section below.
should equal between -0.9 and -0.95. Each dollar of grant income received by a municipality will result in a reduction in local spending of ninety to ninety-five cents and this reduced spending will be used to finance property tax reduction. Testing this prediction is the primary focus of the empirical section below.
Heterogeneity in the Marginal Propensity to Spend on Public Goods
Grant Capitalization
![]() , the tax rate and the service level provided by the home,
, the tax rate and the service level provided by the home,
![]() . In equilibrium, variation in the fiscal surplus -- the difference between public good benefits and the tax burden -- across communities is capitalized into property values (Oates (1969)).
. In equilibrium, variation in the fiscal surplus -- the difference between public good benefits and the tax burden -- across communities is capitalized into property values (Oates (1969)).![]() where
where ![]() is the discount rate. Setting
is the discount rate. Setting ![]() = 0.07, the 30-year conventional mortgage rate in 2001, efficiency implies that capitalization should equal approximately $14 per dollar of grant. This prediction provides a baseline for interpreting the empirical results on capitalization below.
= 0.07, the 30-year conventional mortgage rate in 2001, efficiency implies that capitalization should equal approximately $14 per dollar of grant. This prediction provides a baseline for interpreting the empirical results on capitalization below.![]() (the decisive voter is assumed to be non-credit constrained). The individual budget constraint becomes
(the decisive voter is assumed to be non-credit constrained). The individual budget constraint becomes
![]()
(9)
![]() and
and
![]() equal one, the offset prediction becomes
Introducing capitalization into the model reduces the predicted level of offset. The marginal propensity to spend out of housing wealth is approximately .14 in New Hampshire, based on the estimates of Case, Quigley and Shiller (2001)13. With r = 0.07, equation (10) implies that offset ranges from 0.75 to 0.85. Using a smaller propensity to consume out of housing wealth of 0.05, the offset prediction ranges from 0.85 to 0.92.
equal one, the offset prediction becomes
Introducing capitalization into the model reduces the predicted level of offset. The marginal propensity to spend out of housing wealth is approximately .14 in New Hampshire, based on the estimates of Case, Quigley and Shiller (2001)13. With r = 0.07, equation (10) implies that offset ranges from 0.75 to 0.85. Using a smaller propensity to consume out of housing wealth of 0.05, the offset prediction ranges from 0.85 to 0.92.
Data and Summary Statistics
Empirical Model and Identification
![]() is the number of students residing in municipality
is the number of students residing in municipality ![]() at time
at time ![]() and
and ![]() is a year fixed effect. SPAN CLASS="MATH">
is a year fixed effect. SPAN CLASS="MATH">![]() measures the extent to which local governments offset education funding from the state.
measures the extent to which local governments offset education funding from the state.
![]() The per-pupil reform grant,
The per-pupil reform grant,
![]() , is used as an instrument for per-pupil state grants, where reform
, is used as an instrument for per-pupil state grants, where reform![]() is the reform grant net of state grants cancelled as part of the reform and enroll
is the reform grant net of state grants cancelled as part of the reform and enroll![]() is enrollment in year p, the year prior to the reform.
is enrollment in year p, the year prior to the reform. ![]() The instrument,
The instrument,
![]() , is strongly correlated with state grants and therefore meets the first requirement of a valid instrument. It must also be uncorrelated with
, is strongly correlated with state grants and therefore meets the first requirement of a valid instrument. It must also be uncorrelated with
![]() .
.![]() . The excess tax payments are negative grants. The variable serves as an important control and is of interest in its own right.
. The excess tax payments are negative grants. The variable serves as an important control and is of interest in its own right. ![]() The per-pupil excess tax payment made by a district,
The per-pupil excess tax payment made by a district,
![]() , is instrumented with
, is instrumented with
![]() , the per pre-reform pupil excess tax payment.
, the per pre-reform pupil excess tax payment.
![]() .
.![]() , is identified by the difference in local funding from 1998 to 2000 and 1998 to 2001. In 2000 and 2001, grant amounts were known well in advance of the annual meetings which established spending levels. The estimates of offset will reflect the behavioral decision of the decisive voters, not a mechanical response arising from the timing of the grant introduction.
, is identified by the difference in local funding from 1998 to 2000 and 1998 to 2001. In 2000 and 2001, grant amounts were known well in advance of the annual meetings which established spending levels. The estimates of offset will reflect the behavioral decision of the decisive voters, not a mechanical response arising from the timing of the grant introduction.

(13)
![]() , control for municipal trends in education funding. Accounting for such trends is potentially important because the instrument is largely a function of per-pupil property wealth. Property-wealthy districts may be increasing their rate of spending at a faster pace than property-poor districts. Differential trends of this type would not be controlled for by the fixed-effect and would bias the instrument.
, control for municipal trends in education funding. Accounting for such trends is potentially important because the instrument is largely a function of per-pupil property wealth. Property-wealthy districts may be increasing their rate of spending at a faster pace than property-poor districts. Differential trends of this type would not be controlled for by the fixed-effect and would bias the instrument.
![]() .
. ![]() The second lag of the dependent variable in levels,
The second lag of the dependent variable in levels,
![]() , is used as an instrument for the lagged dependent variable
, is used as an instrument for the lagged dependent variable
![]() .
.
![]() is correlated with the lagged dependent variable and, under standard assumptions, is uncorrelated with the error term. It is a valid instrument.16 17
is correlated with the lagged dependent variable and, under standard assumptions, is uncorrelated with the error term. It is a valid instrument.16 17![]() is the level of funding for local public goods other than education in municipality
is the level of funding for local public goods other than education in municipality ![]() at time
at time ![]() and
and ![]() is the municipal population. The instrumenting strategy remains as above, with the exception that
is the municipal population. The instrumenting strategy remains as above, with the exception that
![]() is instrumented with
is instrumented with
![]() (where
(where ![]() is the year prior to the reform). The approach can be viewed as reduced form in that
is the year prior to the reform). The approach can be viewed as reduced form in that
![]() enters the second-stage directly.
enters the second-stage directly.
Results
Local Revenues for Education
If the short-run constraint theory is valid, the level of offset should decrease over time.Heterogeneity in the Marginal Propensity to Spend on Education
where ![]() is per-pupil local education revenue plus state education aid,
is per-pupil local education revenue plus state education aid, ![]() is income where income includes aggregate private income plus total state education aid. Standard errors are presented in parentheses. The result can be viewed as a naive estimate of the Engel curve for per-pupil education. The coefficient on the squared per-pupil income term in equation (16) is negative and marginally significant, suggesting a concave Engel curve20.
is income where income includes aggregate private income plus total state education aid. Standard errors are presented in parentheses. The result can be viewed as a naive estimate of the Engel curve for per-pupil education. The coefficient on the squared per-pupil income term in equation (16) is negative and marginally significant, suggesting a concave Engel curve20.
![]() on
on
![]() . The locally weighted regression results display evidence of concavity. It should be emphasized that these are naive estimates, provided only for descriptive purposes.
. The locally weighted regression results display evidence of concavity. It should be emphasized that these are naive estimates, provided only for descriptive purposes.Where Did the Offset Portion of the Grants Go?
Where Did the Non-Offset Portion of the Grants Go?
Endogenous Migration
Property Values

(25)
![]() is the aggregate value of all taxable property in municipality
is the aggregate value of all taxable property in municipality ![]() at time
at time ![]() .
.
Interpretation
Intergovernmental Grants
![]() indexes the decisive voters by their point in the income distribution,
indexes the decisive voters by their point in the income distribution, ![]() indicates the decisive voter with the lowest income and
indicates the decisive voter with the lowest income and ![]() indicates the decisive voter with the highest income and
indicates the decisive voter with the highest income and ![]() is the percent of total grants given to the community where decisive voter
is the percent of total grants given to the community where decisive voter ![]() resides. If low income communities have a relatively high marginal propensity to spend on public goods,
resides. If low income communities have a relatively high marginal propensity to spend on public goods,
 , and they are heavily weighted due to receiving a large portion of total grant income, the estimate of offset will be lower than the theoretical prediction. Concave Engel curves may therefore be a partial explanation for the apparent failure of the theory in the previous literature.
School Finance Reform
Conclusion
Appendices
References
Baicker, Katherine and Nora Gordon, "The Effect of Mandated State Education Spending on Total Local Resources", NBER Working Paper # 10701, August 2004.
Barrow, Lisa and Cecilia Elena Rouse, "Using Market Valuation to Assess the Importance and Efficiency of Public School Spending", Journal of Public Economics, Vol. 88, 2004.
Bradford, David and Wallace E. Oates, "The Analysis of Revenue Sharing in a New Approach to Collective Fiscal Decisions", Quarterly Journal of Economics, Vol. 85, No. 3, 1971a.
Card, David and A. Abigail Payne, "School finance reform, the distribution of school spending, and the distribution of student test scores", Journal of Public Economics, Vol. 83, 2002.
Case, Karl, John Quigley and Robert Shiller, "Comparing Wealth Effects: The Stock Market Versus the Housing Market" Cowles Foundation Discussion Paper No. 1335, October 2001.
Chernick, Howard, "An Economic Model of the Distribution of Project Grants" in Fiscal Federalism and Grants-in-Aid, Peter Mieszkowski and William Oakland eds. Washington D.C.: Urban Institute, 1979.
Chioto, Gary, "Parties Focus on Senate Contests; Gubernatorial Issues have Spillover Effect", Boston Globe New Hampshire Weekly, Pg. 1, October 18, 1998.
Craig, Steven and Robert Inman, "Federal Aid and Public Education: An Empirical Look at the New Fiscal Federalism", The Review of Economics and Statistics, Vol. 64. No.4, 1982.
Cullen, Jullie Berry, "The Impact of Fiscal Incentives on Student Disability Rates", Journal of Public Economics, vol. 87, 2003.
Duggan, Mark, "Hospital Ownership and Public Medical Spending", Quarterly Journal of Economics, 2000.
Evans, William and Emily Owens, "Flypaper COPS", mimeo, University of Maryland, 2005.
Filimon, R., T. Romer, and H. Rosenthal. "Asymmetric information and agenda control: The bases of monopoly power in public spending." Journal of Public Economics, 1982.
Fisher, Ronald C. and Leslie E. Papke, "Local Government Responses to Education Grants", National Tax Journal, Vol. 53 no. 1, pg. 153-168, March 2000.
Hall, Douglas E., "Lessons from New Hampshire: What We Can Learn from the History of the State's Role in School Finance Reform 1642 - 1998", New Hampshire Center for Public Policy Studies, 1998.
Hall, Douglas E., "Plumbing the Numbers", No. 1 - 8, New Hampshire Center for Public Policy Studies, 2001, 2002.
Hall, Douglas E. and Stephen F. Knapp, "The Effect of the Official Ballot Referendum Form of Meeting on the Towns and School Districts of New Hampshire", New Hampshire Center for Public Policy Studies, 2000.
Heckman James and V. Joseph Hotz, "Choosing among Alternative Nonexperimental Methods for Estimating the Impact of Social Programs: The Case of Manpower Training," Journal of American Statistical Association, Vol. 84, 1989.
Inman, Robert and Daniel Rubinfeld, "The Judicial Pursuit of Fiscal Equity", Harvard Law Review, Vol. 92, 1979.
Knight, Brian, "Endogenous Federal Grants and Crowd-out of State Government Spending : Theory and Evidence from the Federal Highway Program", American Economic Review, Vol. 92, No. 1, pg. 71 - 92, 2002.
Romer, Thomas and Howard Rosenthal, "Bureaucrats Versus Voters: On the Political Economy of Resource Allocation by Direct Democracy"
textitQuarterly Journal of Economics, Vol. 93, No. 4, Nov. 1979.
Sexton, Terri A. and Steven M. Sheffrin, "Five Lessons from Tax Revolts",
textitState Tax Notes, pg. 1763-1768, December 18, 1995.
Strumpf, Koleman S., "A Predictive Index for the Flypaper Effect", Journal of Public Economics, Vol. 69, pg. 389 - 412, 1998.
Tiebout, Charles, "A Pure Theory of Local Expenditures." Journal of Political Economy, Vol. 64, 1956.
U.S. Bureau of the Census, Public and Elementary-Secondary Education Finances: 1998-1999, Summary Tables, 2000.
Wooldridge, Jeffrey M. Econometric Analysis of Cross Section and Panel Data. MIT Press, Cambridge, Massachusetts. 2002.
Amount in Millions
of Dollars Percent of Total
Pre-Reform Education Revenue
Formerly Available Funds Not Subject to Redistribution - Locally Retained Portion of Statewide Property Tax
417
29%
Formerly Available Funds Subject to Redistribution - Former State Grants Cancelled as Part of the Reform
110
8%
Formerly Available Funds Subject to Redistribution - Statewide Utility Property Tax*
21
1%
New Funds - Excess Tax Payments
24
2%
New Funds - Non-Property Tax Sources
252
17%
Total Adequate Education Amount
824
57%
row
1998
2000
A. Municipality
1
A. Municipality Household Income
*
62339
(16217)
2
A. Municipality % Donor Towns
*
10
(30)
3
A. Municipality % Representative Govt.
*
6
(24)
4
A. Municipality % Modified Traditional Meeting
*
25
(43)
5
A. Municipality Population
7076
(11873)7268
(12121)
6
A. Municipality Students in Residence
1170
(1779)1199
(1826)
7
A. Municipality Local Revenue for Education per Pupil
6287
(1517)5459
(1977)
8
A. Municipality Net Reform Grant per Pupil (conditional on receiving)
.
1632
(545)
9
A. Municipality Excess Tax Payment to State per Pupil (conditional on paying)
.
1548
(1623)
10
A. Municipality Market Value of Property*
395
(574)469
(698)
11
A. Municipality Tax Rate per $1000 of Property (in mils)
27.2
(6.6)21.7
(4.9)
12
A. Municipality Log(90th percentile) - Log(10th percentile)
0.646
0.541
13
A. Municipality Coefficient of Variation
0.242
0.225
14
A. Municipality Number of Observations
160
15
B. School District Students
1568
(2136)1597
(2182)
16
B. School District State Grants per Pupil
762
(606)2338
(1171)
17
B. School District Current Expenditures per Pupil**
6916
(1146)7298
(1171)
18
B. School District Log(90th percentile) - Log(10th percentile)
0.421
0.413
19
B. School District Coefficient of Variation
0.166
0.160
20
B. School District Current Expenditures per Pupil**
(conditional on positive net change in grants)6758
(1053)7139
(1098)
21
B. School District Current Expenditures per Pupil**
(conditional on negative net change in grants8169
(1109)8557
(981)
22
B. School District Number of Observations
125
(1)
(2)
(3)
(4)
(5)
A. 2nd Year of Reform
Δ Per Pupil State Education Funds
-0.52
-0.45
-0.71
-0.61
-0.35
Standard Error
(0.09)
(0.09)
(0.11)
(0.07)
(0.09)
Per Pupil Excess Tax
0.10
0.09
-0.01
0.07
0.04
Standard Error
(0.09)
(0.11)
(0.08)
(0.08)
(0.08)
Δ Lagged Dependent Variable
-0.17
Standard Error
(0.50)
Number of Observations
640
640
160
480
640
B. 3rd Year of Reform
Δ Per Pupil State Education Funds
-0.47
-0.37
-0.89
-0.55
-0.32
Standard Error
(0.08)
(0.11)
(0.16)
(0.08)
(0.07)
Per Pupil Excess Tax
0.13
0.11
-0.05
0.07
0.03
Standard Error
(0.07)
(0.10)
(0.09)
(0.07)
(0.06)
Δ Lagged Dependent Variable
0.18
Standard Error
(0.34)
Number of Observations
483
483
161
322
483
Linear Trends
X
Vector of Covariates
X
Separate Year Intercepts*
X
(1)
(2)
(3)
(4)
(5)
A. 2nd Year of Reform
Δ Per Pre-Reform Pupil Net Reform Grant
1.03
1.03
1.00
1.00
1.03
Standard Error
(0.04)
(0.04)
(0.03)
(0.03)
(0.06)
Per Pre-Reform Pupil Excess Tax
-0.05
-0.04
-0.05
-0.04
-0.05
Standard Error
(0.04)
(0.05)
(0.02)
(0.03)
(0.04)
Δ Lagged Per-Pupil Local Revenue**
-0.02
Standard Error
(0.01)
Number of Observations
640
640
160
480
640
R-squared
.088
.090
.096
.094
.088
B. 3rd Year of Reform
Δ Per Pre-Reform Pupil Net Reform Grant
0.99
1.01
0.96
0.95
1.02
Standard Error
(0.05)
(0.07)
(0.03)
(0.04)
(0.08)
Per Pre-Reform Pupil Excess Tax
-0.01
-0.001
-0.02
-0.001
-0.01
Standard Error
(0.05)
(0.07)
(0.03)
(0.04)
(0.05)
Δ Lagged Per-Pupil Local Revenue**
-0.04
Standard Error
(0.01)
Number of Observations
483
483
161
322
483
R-squared
.083
.086
.094
.091
.083
Linear Trends
X
Vector of Covariates
X
Separate Year Intercepts*
X
(1)
(2)
(3)
(4)
(5)
A. 2nd Year of Reform
Δ Per Pupil Revenue from the State
-0.82
-0.76
-0.76
-0.80
-0.76
Standard Error
(0.07)
(0.09)
(0.09)
(0.07)
(0.14)
Per Pupil Excess Tax
-0.07
-0.09
-0.03
-0.10
-0.07
Standard Error
(0.07)
(0.09)
(0.08)
(0.09)
(0.07)
Δ Lagged Dependent Variable
0.40
Standard Error
(0.40)
Number of Observations
640
640
160
480
640
B. 3rd Year of Reform
Δ Per Pupil Revenue from the State
-0.92
-0.84
-1.01
-0.77
-1.03
Standard Error
(0.08)
(0.10)
(0.11)
(0.11)
(0.20)
Per Pupil Excess Tax
-0.12
-0.15
-0.10
-0.15
-0.15
Standard Error
(0.07)
(0.09)
(0.09)
(0.09)
(0.08)
Δ Lagged Dependent Variable
0.92
Standard Error
(0.44)
Number of Observations
483
483
161
322
483
Linear Trends
X
Vector of Covariates
X
Separate Year Intercepts*
X
Reduced Form - 2 Year Differences
(1)Reduced Form - 2 Year Differences
(2)IV - 4 Year Differences
(3)IV - 4 Year Differences
(4)
Δ Per Pupil Net Reform Grant
-0.83
Standard Error
(0.08)
Δ Placebo Per Pupil Net Reform Grant
-0.03
Standard Error
(0.05)
Δ Per Pupil Revenue from the State
-0.92
-0.96
Standard Error
(0.14)
(0.18)
Vector of Covariates
X
Number of Observations
640
480
322
161
Two - Year Response
Political Economy
(1)Two - Year Response
Muncipalities with Own District
Organization Form
(2)Two - Year Response
Muncipalities with Own District
Organization Form
(3)Three - Year Response
Political Economy
(4)Three - Year Response
Muncipalities with Own District
Organization Form
(5)Three - Year Response
Muncipalities with Own District
Organization Form
(6)
Δ Per Pupil State Rev.
-0.88
-0.98
-0.93
-0.94
-0.99
-0.95
Standard Error
(0.09)
(0.09)
(0.09)
(0.10)
(0.11)
(0.12)
Δ Per Pupil Excess Tax
-0.07
-0.13
-0.13
-0.13
-0.07
-0.08
Standard Error
(0.07)
(0.08)
(0.08)
(0.07)
(0.07)
(0.07)
Δ Per Pupil State Rev. *
0.17
-0.05
Plaintiff Town
(0.06)
(0.12)
Δ Per Pupil State Rev. *
-0.004
-0.04
No Meeting District
(0.08)
(0.10)
Δ Per Pupil State Rev. *
0.10
0.05
Modified Town Meeting
(0.07)
(0.08)
Δ Per Pupil State Rev. *
-0.15
-0.09
Send Tuition Students
(0.08)
(0.10)
Number of Observations
640
324
324
483
243
243
Two-Year Response
(1) Two-Year Response
(2)Three-Year Response
(3)Three-Year Response
(4)
Δ Per-Pupil Revenue from the State
-0.80
-1.01
* Bottom Quartile
(0.09)
(0.10)
Δ Per-Pupil Revenue from the State
-0.82
-0.85
* 2nd Quartile
(0.08)
(0.13)
Δ Per-Pupil Revenue from the State
-0.84
-0.99
* 3rd Quartile
(0.09)
(0.10)
Δ Per-Pupil Revenue from the State
-0.94
-1.00
* Top Quartile
(0.10)
(0.12)
Δ Per Pupil Revenue from the State
-0.57
-0.65
Standard Error
(0.13)
(0.16)
Δ Per Pupil Revenue from the State * Median Household Income*
-5.38
-5.98
Standard Error
(2.39)
(3.20)
Implied Grant Offset at 25th Median Income Percentile
-0.80
-0.90
Implied Grant Offset at 50th Median Income Percentile
-0.83
-0.94
Implied Grant Offset at 75th Median Income Percentile
-0.89
-1.01
Number of Observations
640
483
(1)
(2)
(3)
A. 2nd Year of Reform
Δ Net Reform Grant / Population
0.05
0.05
0.07
Standard Error
(0.04)
(0.06)
(0.05)
Δ Excess Tax Payment / Pop.
-0.10
-0.06
-0.09
Standard Error
(0.03)
(0.06)
(0.04)
Number of Observations
644
644
161
Standard Error
B. 3rd Year of Reform
Δ Net Reform Grant / Population
-0.02
-0.004
-0.01
Standard Error
(0.05)
(0.08)
(0.06)
Δ Excess Tax Payment / Pop.
-0.03
0.05
0.01
Standard Error
(0.07)
(0.12)
(0.07)
Number of Observations
483
483
161
Linear Trends
X
Vector of Covariates
X
Current Expenditures
(1)Current Expenditures
(2)Capital Expenditures
(3)Capital Expenditures
(4)Interest Payment on Debt
(5)Interest Payment on Debt
(6)
2nd Year of Reform
Δ Per Pupil Revenue from the State
0.07
0.001
0.10
0.11
0.002
0.01
Standard Error
(0.08)
(0.10)
(0.19)
(0.27)
(0.02)
(0.02)
Δ Per Pupil Excess Tax
0.07
0.03
-0.09
-0.12
-0.01
-0.01
Standard Error
(0.04)
(0.06)
(0.09)
(0.13)
(0.01)
(0.03)
Number of Observations
496
496
496
496
496
496
Linear Trends
X
X
X
Log of Enrollment
(1)Log of Enrollment
(2)Log of Free Lunch Students
(3)Log of Free Lunch Students
(4)Percent White Enrollment
(5)Percent White Enrollment
(6)
3rd Year of Reform
Δ Per Pupil Net Reform Grant
-0.58
-0.32
5.62
12.76
0.05
-0.07
/100000
(0.97)
(1.20)
(6.74)
(10.94)
(0.10)
(0.17)
Δ Per Pupil Excess Tax
-0.20
0.003
-9.20
-8.99
0.04
-0.07
/100000
(0.73)
(1.06)
(12.81)
(20.23)
(0.07)
(0.10)
Linear Trends
X
X
X
Number of Observations
483
367
370
Log(Market Value of All Property)
(1)Log(Market Value of All Property)
(2)Log(Market Value of All Property)
(3)
Per Pre-Reform Pupil Net Reform Grant
-0.41
-0.01
0.90
Standard Error
(1.25)
(1.34)
(1.01)
Per Pre-Reform Pupil Net Reform Grant * (year >= 2002)
-0.81
-0.01
Standard Error
(1.24)
(1.68)
Number of Observations
1280
Linear Trend Terms
X
(1)
(2)
(3)
(4)
(5)
2nd Year of Reform
Δ Per Pupil Revenue from the State
-0.82
-0.76
-0.76
-0.80
-0.76
Standard Error
(0.07)
(0.09)
(0.09)
(0.07)
(0.14)
Per Pupil Excess Tax
-0.07
-0.09
-0.03
-0.10
-0.07
Standard Error
(0.07)
(0.09)
(0.08)
(0.09)
(0.07)
Δ Lagged Dependent Variable
0.40
Standard Error
(0.40)
Lost revenue Sharing
0.50
0.16
-0.21
0.14
0.34
Standard Error
(0.50)
(0.77)
(0.65)
(0.65)
(0.56)
Lost Utility Tax Revenue
0.98
0.78
0.81
1.11
1.02
Standard Error
(0.77)
(0.96)
(0.74)
(0.86)
(0.82)
Δ Non-Reform Grants
0.71
0.45
0.67
0.64
0.71
Standard Error
(0.22)
(0.30)
(0.25)
(0.26)
(0.26)
Number of Observations
640
640
160
480
640
Linear Trends
X
Vector of Covariates*
X
Separate Year Intercepts**
X
(1)
(2)
(3)
(4)
(5)
A. 2nd Year of Reform
Δ Per Pupil Revenue from the State
-0.86
-0.78
-0.81
-0.86
-0.79
Standard Error
(0.06)
(0.09)
(0.09)
(0.06)
(0.12)
Per Pupil Excess Tax
-0.10
-0.11
-0.04
-0.10
-0.10
Standard Error
(0.07)
(0.07)
(0.07)
(0.07)
(0.07)
Δ Lagged Dependent Variable
-0.09
Standard Error
(0.41)
Number of Observations
640
640
160
480
640
B. 3rd Year of Reform
Δ Per Pupil Revenue from the State
-0.95
-0.83
-0.99
-0.83
-1.02
Standard Error
(0.07)
(0.11)
(0.11)
(0.09)
(0.16)
Per Pupil Excess Tax
-0.13
-0.14
-0.06
-0.11
-0.15
Standard Error
(0.07)
(0.08)
(0.08)
(0.08)
(0.07)
Δ Lagged Dependent Variable
0.41
Standard Error
(0.32)
Number of Observations
483
483
161
322
483
Linear Trends
X
Vector of Covariates
X
Separate Year Intercepts*
X
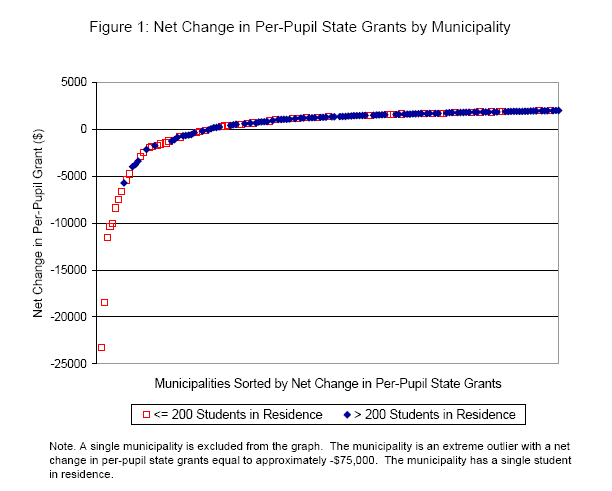
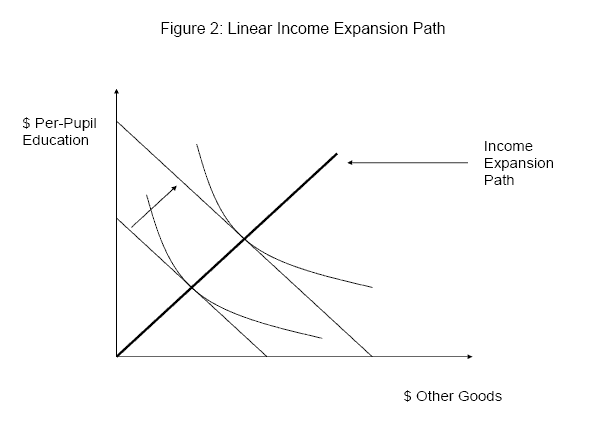
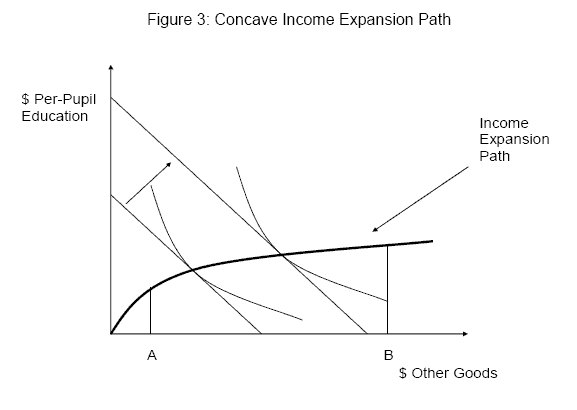
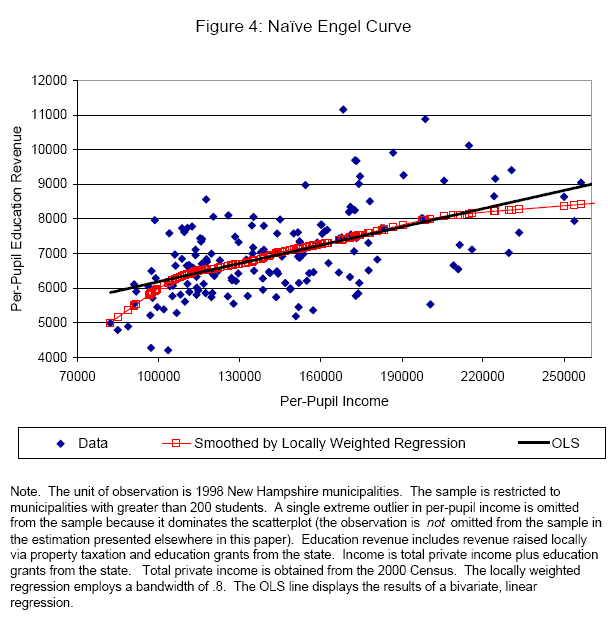
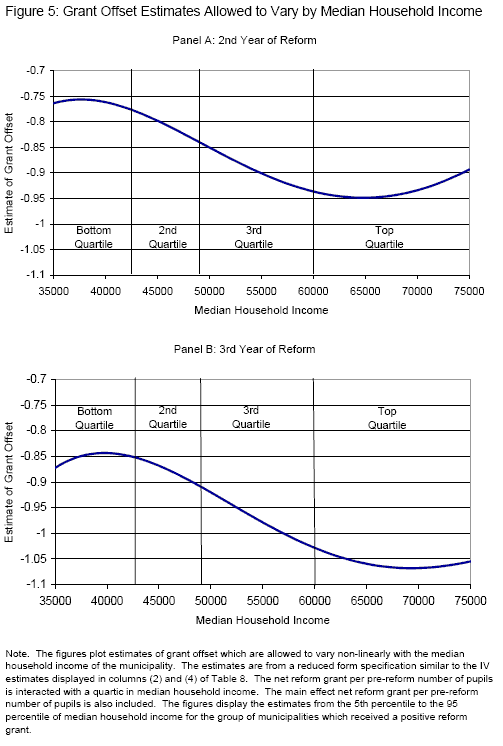
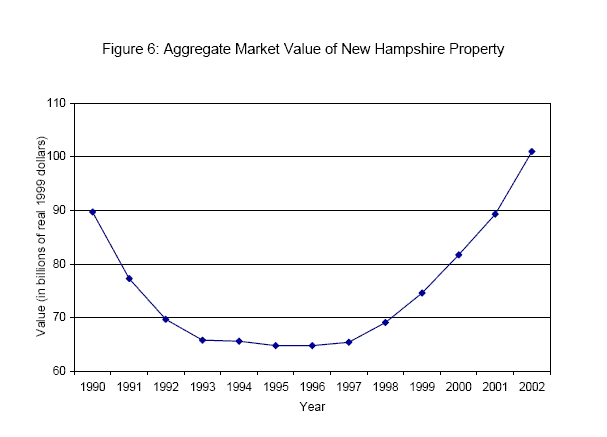
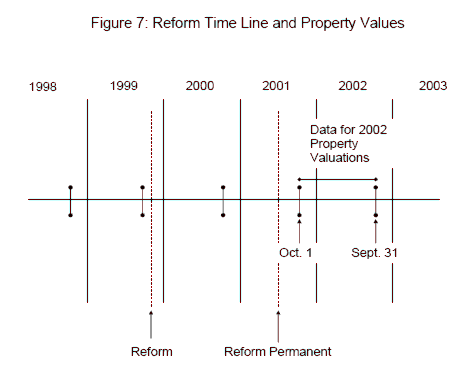
Footnotes
![]() . However, if the incidence of the tax increases on voters differs by municipality, the year effects will not absorb their impact.
. However, if the incidence of the tax increases on voters differs by municipality, the year effects will not absorb their impact. ![]() remains unbiased as long as the incidence is not correlated with the instrument. Formally, implicit in the statement that the instrument is uncorrelated with the error term is the assumption that the incidence on decisive voters of the state-wide tax increases is not correlated with the reform grants received by each decisive voter's municipality. Determining the incidence of the numerous tax increases by municipality is well beyond the scope of this paper. The assumption is quite plausible, however. There is no obvious reason why the incidence of the state-wide tax increases should be correlated with the reform grants. Return to Text
remains unbiased as long as the incidence is not correlated with the instrument. Formally, implicit in the statement that the instrument is uncorrelated with the error term is the assumption that the incidence on decisive voters of the state-wide tax increases is not correlated with the reform grants received by each decisive voter's municipality. Determining the incidence of the numerous tax increases by municipality is well beyond the scope of this paper. The assumption is quite plausible, however. There is no obvious reason why the incidence of the state-wide tax increases should be correlated with the reform grants. Return to Text![]() . Sequential exogeneity conditional on the fixed effect requires
. Sequential exogeneity conditional on the fixed effect requires
![]() An important implication of the sequential exogeneity assumption is that the error terms are conditionally serially uncorrelated :
An important implication of the sequential exogeneity assumption is that the error terms are conditionally serially uncorrelated :
![]() Anderson and Hsiao (1981) propose the instrumenting strategy. Wooldridge (2002) Chp. 11 and Arellano (2003) Chp. 6 contain detailed discussions of the procedure. Return to Text
Anderson and Hsiao (1981) propose the instrumenting strategy. Wooldridge (2002) Chp. 11 and Arellano (2003) Chp. 6 contain detailed discussions of the procedure. Return to Text![]() ; where
; where ![]() is the mean individual property tax payment made in municipality
is the mean individual property tax payment made in municipality
![]() , defined as total tax payments divided by municipal population, and
, defined as total tax payments divided by municipal population, and
![]() is average household income in municipality
is average household income in municipality ![]() . Return to Text
. Return to Text