
The Choice at the Checkout:
Competition Among Payment Instruments
Keywords: Payments, Demand Analysis, Rank Order Logit
Abstract:
Dramatic changes have occurred in the U.S. payment system over the past two decades, most notably an explosion in electronic card-based payments. Not surprisingly, this shift has been accompanied by a series of policy debates, all of which hinge critically on understanding consumer behavior at the point of sale. Using a new nationally representative survey, we transform consumers' responses to open-ended questions on reasons for using debit cards to estimate a characteristics-based discrete-choice demand model that includes debit cards, cash, checks, and credit cards. Market shares computed using this model line up well with aggregate shares from other sources. The estimates are used to conduct several counterfactual experiments that predict consumer responses to alternative payment choices. We find that consumers respond strongly to elapsed time at the checkout counter and to whether the payment instrument draws from debt or liquidity. In addition, substitution patterns vary substantially with demographics. New "contactless" payment methods designed to replace debit cards are predicted to draw market share from cash, checks, and credit, in that order. Finally, although we find an effect of cohort on payment technology adoption, this effect is unlikely to diminish substantially over a 10-year horizon.
1 Introduction
Technological advances and recent policy initiatives have led to substantial changes in the U.S. payment system, most notably an increasing shift from paper to plastic forms of payment.3 Since the mid-1990's, the volume of checks has decreased dramatically, and is currently falling by about three to five percent per year, while the use of electronic payments has greatly expanded. Annual debit card transactions in the U.S. have been growing at over twenty percent per year, and now exceed the number of credit card transactions. As payments have shifted from paper to plastic, the major payment card associations have been the focus of both government and private antitrust actions. These include the challenge by the U.S. Department of Justice of governance practices at Visa and MasterCard, and the civil suit led by Wal-Mart against the card associations' rules on credit and debit card acceptance.4 Currently, the structure and level of interchange fees - the interbank payments made for each credit or debit card transaction - is a hotly debated policy area in both the U.S. and abroad.5
Central to these policy issues is the consumer's choice of payment instrument. While merchants can choose whether to accept a given form of payment, ultimate sovereignty rests with the consumer's choice of which instrument to pull from his or her wallet. The prior research on this topic has highlighted two key aspects to these decisions: consumer demographics and the attributes of payment methods. Carow & Staten (1999) investigate payment choice at gasoline stations and find that age and education are key factors related to debit card adoption. In more recent work, Zinman (2005) and Borzekowski et al. (2006) find similar demographic results for debit card use, as do several studies examining the adoption of other technologies.6Klee (2005) presents pairwise discrete-choice estimates of payment choice as a function of consumer demographics.7 Payment methods attributes are shown to be important by Hirschman (1982) and more recently by Jonker (2005). Hirschman identified several important product attributes that affect payment choice, including "leverage potential" and "transaction time," two factors included in our model; Jonker focuses on safety, speed, cost, and ease of use.
We build on both of these approaches by incorporating demographic information and payment attributes into a structural model. We transform our survey data to allow estimation of a discrete-choice demand model that includes both a rich set of demographic variables and selected product attributes. These are time at checkout, liquidity, and whether the payment type is electronic. In the model, utility from product attributes may vary with consumer demographics. This characteristics-based approach allows us to model the consumer's decision among bundles of attributes rather than simply among unique discrete alternatives. The structure of the model also allows the calculation of counterfactual experiments that predict consumer responses to changes in the payment choice set.
The estimation uses a new nationally representative sample of over 1,500 consumers from midyear 2004. The results indicate that consumer preferences for the three stated attributes vary significantly across demographic groups. Valuations of time, tastes for electronic payment, and the utility of liquid instruments all vary with age, education and region. Contrary to some earlier findings, income is not a significant regressor once other factors are controlled for. Predicted market shares from this model align very well with other data sources, giving us strong confidence in the approach.
Using our demand estimates, the outcomes of three counterfactual scenarios are predicted: removing options from the consumer choice set, adding a hypothetical option to the choice set, and aging the consumer population. The first examines the merchant's choice whether to accept a given instrument. Since merchants are limited in their ability to price discriminate among payment methods, their only free margin currently is whether to accept a given instrument. (This was precisely the flexibility sought - and obtained in 2004 - in the Wal-Mart suit against Visa and MasterCard.) As a result, we predict the outcome of a merchant decision to restrict consumers' choice sets by dropping each of the four instruments. From this experiment we find that substitution patterns are somewhat asymmetric; for example, removing debit would send consumers to cash, checks, and credit, in that order, but removing checks would divert payments equally to debit and cash, then to credit.
The second experiment examines the adoption of new payment instruments. By altering the characteristics of the elements of the choice set, we estimate the impact of one new product innovation: "flash" or contactless debit. This is a technology that allows debit payments by waving the card over a transponder, rather than swiping the card, and is currently being rolled out by certain networks and several large card-issuing banks. The experiment predicts this enhanced debit technology to take a modest share from the three other options.
As a third experiment, we examine what happens as we "age" the population by examining what would happen if each age cohort adopted the preferences over attributes of the cohort behind them. As already discussed, age is an important factor in payment choice, with older individuals less likely to use debit and more likely to use checks. The outcome of this experiment indicates that cohort clearly affects payment choice, and that we do not expect this effect to disappear over a 10-year horizon.
Overall, the results indicate that debit is primarily replacing cash and checks. As newer, faster forms of debit emerge, the trend should continue, although the results from the last experiment indicate that the change may be gradual. The economic impact of these changes on merchants depends critically on merchants' relative costs of handling cash and checks, as well as on interchange rates for debit transactions. If interchange rates continue to rise, merchants could choose not to accept cards and handle the resulting increased cash and check volumes. From a societal perspective, however, debit is cheaper than either cash or paper processed checks; thus, limited acceptance of these cards could be welfare decreasing.8
Finally, the findings shed light on the relatively slower adoption of debit in the U.S. compared to many other developed economies (see, for example, Bolt & Tieman (2005) and Loix et al. (2005)). Because debit serves primarily as a substitute for cash, we would predict debit card adoption rates to be faster in countries with high cash usage, such as those in Europe. In contrast, the U.S. system has historically had much higher use of credit cards and checks. Because debit is a poorer substitute for these methods, we would expect correspondingly slower adoption of debit in the U.S.
2 A New Consumer Survey
Our dataset comes from a special survey instrument issued as part of the Michigan Surveys of Consumers, which samples about 500 households per month and is constructed to be representative of U.S. households. Our dataset includes 1,501 distinct households surveyed over the months of March, April, and May 2004. The nationally representative nature of the sample is an improvement over prior studies that detail U.S. debit card use. For example, the sample for the 2005/2006 American Bankers' Association (ABA)/Dove Study of Consumer Payment Preferences (based on a 2004 survey) consists of checking account holders who voluntary responded to a written survey, with a survey response rate of about 7 percent.9The Michigan Survey sampling frame, in contrast, includes all U.S. households regardless of account holdings and has a considerably higher response rate (around 70 percent).
Table 1 shows checking account holdings and debit card use in our sample. Eighty-eight percent of households reported having a checking account or a similar transaction account at a depository institution; this is consistent with the 2001 Survey of Consumer Finances (SCF), another nationally representative data source.10 About 52 percent of households (60 percent of households with a checking account) have a debit card.11Approximately 45 percent of households (87 percent of households with a debit card) reported having used the card to purchase items at stores in the twelve months preceding the survey. The numbers on debit card use in our survey are generally consistent with results obtained in the 2005/2006 ABA/Dove study.12
2.1 Consumer Substitution
An important advantage of our survey is the set of open-ended questions on the reasons for choosing between debit and other payment options. Two questions were asked in this open-ended fashion: Respondents who reported using debit were asked why they use debit cards, and households who reported that they have a card but do not use debit were asked why not.13
For each respondent, we used keywords to construct three dummy variables for alternatives to debit: cash, check and credit. Each dummy takes on a value of 1 if the respondent mentioned that alternative payment method in their response. These variables are not mutually exclusive; more than one payment substitute could be coded. Both the first and second (if present) reported reasons were used to code these indicators.
Descriptive statistics of reported substitutes are shown in table 2 for debit card users and non-users, conditional on having a debit card. The left column shows the share of debit card users who use debit instead of the respective alternative payment type. Nearly half (48.5 percent) of debit card users mention that debit serves as a substitute for cash. About 32 percent of debit card users report using debit instead of checks, and 19 percent say debit serves as a substitute for credit cards. About 21 percent report no specific alternative payment method. These numbers suggest that debit card users view debit cards primarily as a substitute for "paper" payment methods. This question is explored further in Borzekowski et al. (2006).
The right column of table 2 shows the share of debit non-users who report using the respective payment type instead of debit. Fifty-five percent refer to credit cards as preferable to debit cards; 31 percent refer to checks and 23 percent refer to cash. Twenty-three percent of debit non-users mention no alternative payment method. Thus, the majority of debit card non-users prefer credit cards to debit cards. These asymmetric findings for debit card users and non-users suggest a heterogeneous response to the underlying payment characteristics; we explore this possibility further in the estimation below.
3 Model and Estimation
To apply the demand framework, we first transform the responses to the open-ended questions on reasons for debit card use into a form that allows for estimation of a full discrete-choice model. We use the coded responses on payment choice substitutes to create rankings among the four payment options for each respondent. These rankings are then used as the outcome variables in a rank-order logit model (see Beggs et al. (1981) and Hausman & Ruud (1987)) that incorporates both product and consumer characteristics. We use the coefficient estimates to construct implied choice probabilities across all four payment alternatives. Because the utility interpretation of the rank-order logit model allows us to infer a structural behavioral response on the part of consumers, we use the estimates to perform counterfactual experiments about changes in the consumer choice set.
3.1 Constructing Rankings
From the payment substitutes for debit we recorded above, we construct rankings among payment options, making modest additional assumptions on consumer preferences; the ranking algorithm is summarized in table 3. We define frequent debit users as respondents who use a debit card at least once a week; infrequent users are respondents who have used a debit card within the past 12 months but use it less than once a week. For frequent debit users, debit is ranked first, any mentioned substitute methods are ranked (tied for) second, and any remaining unmentioned substitute methods are ranked (tied for) third. For infrequent debit users, mentioned substitutes are ranked first, and debit and any unmentioned substitutes are ranked second. For debit nonusers, mentioned substitutes are ranked first, unmentioned substitutes are ranked second, and debit is ranked third. In cases in which the respondent does not mention a substitute, all non-debit options are assumed to be tied and the rankings are adjusted accordingly.
Although the open-ended questions were asked only of debit card holders, it is useful to predict aggregate market shares for a broader set of households. Therefore, in addition to constructing rankings for debit card holders, we also construct rankings for all checking account holders without debit cards. The extension to all checking account holders requires assumptions on how to construct rankings among payment options for estimation, as well as how to model the consumer choice sets for both estimation and market share prediction.
To create rankings for estimation, we assume that checking account holders without a debit card choose not to use debit; that is, that they are not exogenously constrained from using debit. Thus, we assume that checking account holders without a debit card rank cash, credit and checks equally and rank debit second to these. When predicting market shares after estimation, we similarly assume that these consumers only have three payment choices.
By constructing the rankings in this way, we make some implicit assumptions. First, the nature and structure of the survey do not control for the type of retailer at which the payment choice is made. If one assumes that for all respondents, the payment choice for which they report their preferences was their typical supermarket visit, the assumption is innocuous. If, however, some respondents recall a restaurant, others a department store and others a car dealership, then the results could be misleading. A corollary is that we assume all four options - cash, check, debit and credit - were available at whatever point of sale the customer has in mind. In addition, it is well known that payment methods vary with number of items purchased and dollar value of purchase (see Klee (2005) and others). Our model does not incorporate either the number of items or the dollar value of purchase, and therefore implicitly assumes that the amount and items bought equal those of the "typical" point-of-sale transaction. To check the robustness of our rankings, we performed the estimation using selected alternative rankings; the results do not change in any substantive way.14
3.2 Utility Maximization in the Rank-Order Logit
Given the rankings, the rank-order logit model allows us to estimate consumer preferences over payment choices. Like the multinomial logit, the rank-order logit specifies implied revealed-preference inequalities generated from reported binary comparisons. These inequalities, along with a
distributional assumption on unobserved heterogeneity, generate closed-form choice probabilities. Formally, we assume consumer ![]() 's utility from payment method
's utility from payment method ![]() takes the following form:15
takes the following form:15
| (1) |
where ![]() is the consumer's mean utility from using payment option
is the consumer's mean utility from using payment option ![]() , and
, and
![]() is a random disturbance which is distributed type I GEV. With this specification, the probability that consumer
is a random disturbance which is distributed type I GEV. With this specification, the probability that consumer ![]() ranks payment method
ranks payment method ![]() over method
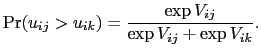
over method ![]() is the standard logit formulation:
is the standard logit formulation:
 |
(2) |
Let
![]() be consumer
be consumer ![]() 's rankings of the available choices, where
's rankings of the available choices, where
![]() gives the rank of the choice in position
gives the rank of the choice in position ![]() . Then the probability of observing
the sequence of rankings is:
. Then the probability of observing
the sequence of rankings is:
![LaTex Encoded Math: \displaystyle \Pr(R_i)=\Pr[u_{r_1} > u_{r_2} > \ldots > u_{r_J}] = { \prod_{h=1}^{J-1} { {\exp{V_{ir_h}}} \over {\sum_{m=h}^{J}\exp{V_{ir_m}}} } },](img11.gif)
where ![]() is the utility received from the option ranked in position
is the utility received from the option ranked in position ![]() . We
specify this utility as
. We
specify this utility as
| (4) |
where ![]() is a
is a
![]() vector of consumer characteristics,
vector of consumer characteristics, ![]() is a
is a
![]() vector of product attributes, and
vector of product attributes, and ![]() is a
is a
![]() vector of coefficients.
vector of coefficients.
Substituting this into equation 3 and taking logs, the log-likelihood is:
![LaTex Encoded Math: \displaystyle L(\beta) = \sum_{i=1}^{N}log\Pr(R_i)= \sum_{i=1}^{N}\sum_{h=1}^{J-1} + \beta (X_i \otimes Z_h) \sum_{i=1}^{N}\sum_{h=1}^{J-1}[\log \sum_{m=h}^{J} \exp(\beta (X_i \otimes Z_h))]](img20.gif)
Note that in this model, an individual consumer's relative preference for any two choices is assumed to be independent of all other choices. In other words, a consumer's preference for, e.g., debit over credit is independent of the availability or the relative rankings of the other choices
available. This is a variant of the usual independence of irrelevant alternatives (IIA) property of logit models and derives from the assumptions that the ![]() 's are independent across choices and that they are extreme value distributed. However, incorporating interaction terms between consumer and choice-specific characteristics implies that the IIA property is relaxed at the aggregate level.16
's are independent across choices and that they are extreme value distributed. However, incorporating interaction terms between consumer and choice-specific characteristics implies that the IIA property is relaxed at the aggregate level.16
The interactions between household and product attributes allow the utility from product attributes to vary across consumers. The product attributes ![]() used in estimation are
"electronic," "liquid," and "time." Electronic is a dummy variable that takes on a value of 1 if the payment instrument is electronic from the viewpoint of the consumer (i.e., debit and credit). Liquid is a dummy variable that equals 1 if the instrument draws funds from liquidity rather than
from a debt instrument (i.e., all options but credit). Time is the estimated minimum time at the checkout counter for a single item purchased at a supermarket.17 Table 4 shows the attributes for all payment choices.
used in estimation are
"electronic," "liquid," and "time." Electronic is a dummy variable that takes on a value of 1 if the payment instrument is electronic from the viewpoint of the consumer (i.e., debit and credit). Liquid is a dummy variable that equals 1 if the instrument draws funds from liquidity rather than
from a debt instrument (i.e., all options but credit). Time is the estimated minimum time at the checkout counter for a single item purchased at a supermarket.17 Table 4 shows the attributes for all payment choices.
Because the choice set contains four elements, the model is identified up to only three product attributes. As a result, the results may be picking up the effect of any other attributes that are highly correlated with the specified set. For example, instead of one of the attributes we included, we could have specified "anonymity" as an attribute that takes on a value of 1 only for cash. However, given the continuous variation in the time variable and the configuration of the "electronic" and "liquid" dummies taken on by each payment method, we are reasonably confident that we are interpreting the coefficients on our chosen attributes accurately.
Note that no price appears in the consumer utility function. Retail payments are unique in that consumers seldom face an explicit price associated with a given payment method. Because of the absence of price in the model, no price elasticities can be computed using the estimates. Instead, the counterfactual experiments (in particular, the diversion ratios computed from dropping payment options) are used to infer substitution patterns.
The results from estimation of the rank-order logit for all checking account holders are presented in table 5. Older households appear to experience disutility from electronic payment methods and from spending out of liquidity. Households in the two youngest age groups appear the most sensitive to time at the checkout counter, as indicated by the positive coefficients on interactions between checkout time and the older age categories (the youngest age category is omitted). Women appear to have a preference for spending from liquidity relative to men, and men have disutility from checkout time relative to women. Single respondents and those with children are time sensitive. Respondents with a bachelors or graduate degree show disutility from spending from liquidity (or better access to credit). Small business owners show a preference for non-electronic methods. Consumers in the South and West prefer electronic payments more strongly than those in other regions, and consumers in the Northeast have the highest relative valuation of time. Overall, the coefficients show heterogeneity in preferences for product characteristics across demographic groups. We now turn to the market shares constructed from the estimates.
4 Counterfactual Experiments
The model generates choice probabilities which aggregate to market shares and incorporates both product and consumer characteristics. We use the model estimates to compute the outcomes of several relevant counterfactual experiments. We perform three types of experiments: (1) dropping each option from the consumer choice set, (2) creating a hypothetical new payment option in the consumer choice set, and (3) "aging" the population to predict future payment choice.
4.1 Dropping a Payment Option from the Choice Set
The legal and policy debates surrounding payment systems hinge upon both merchant acceptance and consumer use of payment methods. Merchants now have the option of dropping any payment choice, but most do not know exactly how consumers might substitute to other payment methods if forced to do so.21 From a policy perspective, the social costs and benefits of merchant refusal to accept a given payment method depend on consumer substitution behavior. We can use our model to directly evaluate consumer substitution of payment methods for an omitted choice, conditional on the decision to make a purchase at a given merchant.22
The counterfactual choice probabilities are computed for an omission of each payment choice, using the parameter estimates and sample data for respondents with a checking account and restricting the choice set to the respective remaining three options. The resulting aggregate market shares for checking account holders are shown in table 8, with the original within-sample market shares shown below for reference. Below each counterfactual share is the diversion ratio: the percentage of the decrease in market share in the omitted option captured by the respective alternate payment method. When debit cards are omitted, debit card market share is absorbed first by cash, then checks, then credit, leaving cash at by far the most popular option at about 45 percent. When cash is omitted, its initial share percent is split fairly evenly across the remaining options, with a slightly higher percent going to checks. For the omission of credit, the initial 19 percent market share goes first to cash, then to checks and debit (in the same order as the initial market shares). Finally, omitting checks results in about half its original share going to cash, followed evenly by debit and credit.
The breakdowns by demographics, shown in table 9, show similar diversion patterns. Note that an omission of debit is predicted to generate remarkably high cash shares among younger respondents, with 69 percent for the 18-24 age category. Dropping checks from the choice set causes the bulk of respondents in the oldest age category to divert to cash, followed by credit, then debit.
Although all options clearly serve as substitutes to some degree, the substitution patterns are not symmetric. For example, on average, cash is the strongest substitute for debit, but checks are the strongest substitute for cash. These effects could have a substantial impact on merchant or social costs. Thus, should a merchant refuse to accept debit, it would expect a substantial increase in cash use.23Borzekowski et al. (2006) find a substantial price response with respect to debit card fees charged by card-issuing banks; the estimates here suggest that these consumers are most likely to turn to cash as a substitute. According to merchant reports, cash is a relatively inexpensive method of payment for merchants to accept; however, from a societal standpoint, cash production and handling is costly for both governments and depository institutions.24 On the other hand, if cash use were discouraged, merchants might expect a surge in check payments.25Although the largest retailers have sophisticated check processing and check fraud protection programs in place, smaller merchants do not, and they (along with depository institutions) could face cost increases from greater check use.26
4.2 Adding a New Payment Option to the Choice Set
Predicting consumer demand for new payment instruments is highly relevant for both public policy and industry strategy. Large-scale investments by firms or governments are typically necessary to launch a new payment technology, especially due to the network effects inherent in such systems, and estimates of consumer behavior can help predict how consumers might respond to such investments in infrastructure. The inclusion of product characteristics into consumer utility in our model means that, by combining product attributes to form new payment options, we can calculate predictions of consumer response to hypothetical introductions to the choice set.
For our computation, we replace an already available payment option with a "new" option by altering the characteristics of the existing option.27 The example we choose is a hypothetical "flash" or "contactless" transaction, for which a consumer waves a card or touches a screen to initiate a payment that draws funds from a deposit account.28 Such a payment option would access liquidity using an electronic format but would be quicker than debit. We compute counterfactual market shares by "replacing" debit with flash; that is, we replace the attributes of debit with those of flash transactions by reducing the time at the checkout to a conservative industry estimate for that of flash while retaining the other two attributes.29 We assume that flash time is approximately 15 seconds less than cash (about 30 seconds less than debit).30
This exercise assumes that flash payment cards are issued by banks and accepted at retail merchants in the same proportions as debit cards, and that adoption is costless for consumers. Nonetheless, because our estimate of the time at checkout for flash transactions is conservative, we view this counterfactual experiment as realistic.
The hypothetical choice probabilities that include flash transactions are shown in table 10, with the original within-sample choice probabilities shown for reference. The model predicts that flash transactions would achieve a market share of around 26 percent, about 40 percent greater than the current market share for debit. Flash transactions are predicted to draw consumers first from cash, then checks, followed by credit. Thus, merchants are unlikely to be able to use flash transactions to reduce the credit card share of transactions (with an associated high interchange fee); however, from a societal perspective, flash payments may be a successful tool to increase the share of electronic transactions. In addition to the overall market shares, the table shows predicted probabilities by age, income and gender. Adoption is predicted to be fairly equal across demographic groups, with the exception of a stronger cash preference for respondents age 18-24 relative to other respondents. As discussed above, a caveat to these predictions is that the parameter estimates for checkout time may reflect a preference for any other characteristics of the respective payment methods that are correlated with checkout time.
To summarize, our inference from this experiment suggests that the adoption of flash technology is likely to result in small changes in overall market shares. We predict flash transactions will draw consumers mainly from paper-based methods rather than from credit cards.
4.3 Aging the Population to Predict Future Payment Choice
Because debit cards themselves have yet to diffuse fully into the economy, it is useful to predict future adoption rates in order to evaluate the future effects of policy or industry changes. Because we estimate age-specific coefficients for each payment attribute, we can isolate this effect on payment instrument choice from the effects of other factors, such as family structure and home ownership, which are also correlated with age.
Note that because we use a cross section rather than a panel, we cannot identify separate effects for age and cohort. We assume that the age coefficient reflects a cohort effect. For example, in the case of debit, for which use is decreasing in age, we assume that older individuals are empirically less likely to adopt debit because its characteristics comprise a new technology, and not because of a differential response to its characteristics that derives purely from chronological age.
We perform the experiment of "aging the population" in the following way. We first reset the values of the cohort-specific coefficients so that each cohort takes on the coefficient of the next youngest cohort, holding the coefficient for the youngest (omitted) cohort and those of all other demographics at their original values. This ages each cohort by about 10 years (less for the youngest age group, and more for the oldest). We then recompute choice probabilities using respondents' original demographic variables and the new coefficient vector. The effect of this computation is to roll the population forward one cohort while holding constant the distribution of other demographic variables. This approach allows individual respondents to "age" with respect to income, education, and family structure, without changing the overall distribution of demographics.31 We then compute aggregate payment market shares along with market shares by demographic group. The difference between the within-sample and counterfactual market shares can therefore be attributed solely to the cohort effect.
The aggregate counterfactual market shares show that aging the population results in slightly higher debit and cash shares and slightly lower credit and check shares. Debit draws proportionally the most from checks. These predictions are consistent with the strong preference of the current younger respondents for quick checkout being applied to older generations' hypothetical payment preferences. The choice probabilities continue to show substantial differences across demographic groups. As expected, the debit card share is predicted to increase the most among the oldest respondents, increasing from a 9- to a 14-percent market share. Overall, this exercise suggests that the cohort-specific preferences that are currently reflected in consumer payment choice will change as the population ages, but are unlikely to alter the aggregate shares dramatically for the 10-year horizon.
5 Conclusion
This paper uses a recent nationally representative survey on U.S. payment preferences at the point of sale to investigate consumers' use of debit cards, credit cards, checks and cash. We demonstrate a method for transforming responses to open-ended survey questions into ranked outcome variables that can be used in a characteristics-based discrete-choice demand system. We then estimate our demand system allowing utility from payment method characteristics to vary with demographic characteristics. Using these estimates, we compute aggregate market shares for each payment instrument and perform the counterfactual experiments of dropping payment methods, predicting demand for an emerging payment method, and synthetically aging the population.
We find that our market shares square well with those computed in other surveys. The market shares vary systematically with age, education, and gender, but less so with income, reflecting the competing motives for payment choice that vary with income. From our counterfactual experiments we predict that merchant refusal to accept payments - or other initiatives to alter consumer payment choice - will have differential effects by payment type. That is, substitution patterns are not symmetric. Our experiment predicting the market share of a newly developed "contactless" payment method, which could replace debit cards if new initiatives take hold, suggests this method will attract modest market shares and will draw mainly from paper-based methods. Finally, after synthetically aging the population, we predict that debit is unlikely to make major inroads over a 10-year horizon based purely on the aging of a population with cohort-specific preferences.
Several questions remain open as areas for future research. First, why has debit rather than credit taken the bulk of business away from checks and cash (even for higher-income, non-credit-revolving households)? What is the saturation point for debit card use? Is there a base level of cash and check use that will remain even after debit cards and similar payment technologies have diffused fully into the economy? Answers to these questions and others will help us to understand more fully the complex problem of payment choice.
| Sample Size | Percent of Sample | |
|---|---|---|
| Total Interviewed | 1,501 | 100.0 |
| Checking Account Holders | 1,316 | 87.67 |
| Debit Card Holders | 783 | 52.17 |
| Debit Card Users | 674 | 44.90 |
| Percent Who Use Debit Instead Of Substitute | Percent Who, Instead of Debit, Use Substitute: | |
|---|---|---|
| Substitute |
(Users=674): | (Non-Users=109): |
| Cash | 48.5 | 22.9 |
| Check | 31.9 | 31.2 |
| Credit | 19.4 | 55.1 |
| Indeterminate | 21.4 | 22.9 |
| Frequent | Infrequent | Debit | |
|---|---|---|---|
| Payment Method | Debit User |
Debit User | Non-User |
| Debit | 1 | 2 | 3 |
| Mentioned Substitute | 2 | 1 | 1 |
| Unmentioned Substitute | 3 | 2 | 2 |
| Payment Method | Electronic | Liquid | Time |
|---|---|---|---|
| Debit | 1 | 1 | 50.43 |
| Cash | 0 | 1 | 34.75 |
| Credit | 1 | 0 | 55.13 |
| Check | 0 | 1 | 77.53 |
| Demographic Characteristic | Electronic | Liquid | Time |
|---|---|---|---|
| Midwest | -.468 |
-.276 | .004 |
| (.178) | (.221) | (.006) | |
| Northeast | -.543 |
-.402 |
-.017 |
| (.191) | (.231) | (.006) | |
| South | -.193 | -.268 | -.003 |
| (.165) | (.205) | (.005) | |
| 25-34 yrs | .197 | -.032 | .009 |
| (.270) | (.351) | (.010) | |
| 35-44 yrs | -.120 | -.251 | .020 |
| (.276) | (.353) | (.010) | |
| 45-54 yrs | -.403 | -.402 | .025 |
| (.280) | (.358) | (.010) | |
| 55-64 yrs | -.595 |
-.753 |
.028 |
| (.297) | (.375) | (.010) | |
| 65 or older | -1.321 |
-1.845 |
.023 |
| (.324) | (.396) | (.010) | |
| Female | .198 | .416 |
.014 |
| (.124) | (.152) | (.004) | |
| Non-white | -.035 | -.074 | -.007 |
| (.157) | (.196) | (.005) | |
| Single | .044 | -.004 | -.016 |
| (.179) | (.214) | (.006) | |
| Divorced | .011 | .442 |
.012 |
| (.180) | (.230) | (.006) | |
| Some college | .186 | -.209 | .003 |
| (.163) | (.208) | (.005) | |
| Bachelors degree | -.014 | -.503 |
.0004 |
| (.181) | (.227) | (.006) | |
| Graduate degree | -.052 | -1.155 |
-.003 |
| (.207) | (.250) | (.006) | |
| Has one or more children | .047 | .103 | -.009 |
| (.142) | (.177) | (.005) | |
| $35,000-$59,999 | .079 | .172 | .002 |
| (.182) | (.227) | (.006) | |
| &60,000-$99,999 | .136 | .229 | .003 |
| (.188) | (.233) | (.006) | |
| $100,000 or more | .179 | .138 | .004 |
| (.212) | (.257) | (.007) | |
| Business phone in household | -.322 | -.228 | -.010 |
| (.206) | (.239) | (.006) | |
| Const. | -.052 | .788 |
-.030 |
| (.364) | (.459) | (.012) | |
| Obs. | 1208 | 1208 | 1208 |
**Significant at 5% level.
* Significant at 10% level.
Note: All predictions estimated on population of checking account holders (1,316 observations).
| Predicted for (N) | Payment Method Debit | Payment Method Cash | Payment Method Credit | Payment Method Check |
|---|---|---|---|---|
| Debit Card Holders (783) | 32.5 | 33.5 | 13.2 | 20.9 |
| Checking Account Holders (1,316) | 16.6 | 37.4 | 19.0 | 27.0 |
| All Consumers (1,501) | 14.4 | 45.7 | 16.5 | 23.4 |
| Predicted for (N) | Debit | Cash | Credit | Check |
|---|---|---|---|---|
| Region: West (251) | 20.9 | 33.1 | 20.0 | 26.0 |
| Region: Midwest (342) | 14.7 | 35.2 | 17.1 | 32.9 |
| Region: Northeast (253) | 13.0 | 47.6 | 18.8 | 20.6 |
| Region: South (470) | 17.7 | 35.9 | 20.0 | 26.5 |
| Age: 18-24 yrs (80) | 24.7 | 53.8 | 11.3 | 10.2 |
| Age: 25-34 yrs (180) | 27.3 | 40.0 | 17.3 | 15.3 |
| Age: 35-44 yrs (260) | 21.1 | 36.9 | 17.1 | 24.9 |
| Age: 45-54 yrs (292) | 15.6 | 34.8 | 16.8 | 32.8 |
| Age: 55-64 yrs (232) | 12.4 | 32.1 | 20.1 | 35.4 |
| Age: 65 and older (269) | 6.0 | 38.8 | 26.6 | 28.6 |
| Gender: Male (611) | 14.6 | 41.3 | 21.6 | 22.4 |
| Gender: Female (705) | 18.3 | 34.1 | 16.7 | 30.9 |
| Race: White (1,103) | 16.1 | 36.5 | 19.4 | 28.0 |
| Race: Non-white (213) | 19.4 | 41.9 | 16.9 | 21.8 |
| Marital Status: Married (775) | 16.6 | 35.6 | 20.1 | 27.7 |
| Marital Status: Single (340) | 16.9 | 46.6 | 19.6 | 16.9 |
| Marital Status: Divorced (199) | 16.3 | 29.3 | 13.6 | 40.8 |
| Education: Less than high school (420) | 15.0 | 41.4 | 14.4 | 29.3 |
| Education: Some college (382) | 19.7 | 35.3 | 16.7 | 28.3 |
| Education: Bachelors degree (302) | 17.5 | 37.1 | 19.2 | 26.2 |
| Education: Graduate degree (205) | 12.7 | 34.4 | 31.7 | 21.2 |
| Children: No children (877) | 14.1 | 35.9 | 20.5 | 29.4 |
| Children: One or more children (438) | 21.3 | 40.4 | 16.1 | 22.2 |
| Income: Less than $35,000 (325) | 14.5 | 39.5 | 18.3 | 27.7 |
| Income: $35,000 - $59,000 (304) | 17.6 | 36.5 | 16.9 | 29.0 |
| Income: $60,000 - $99,999 (332) | 18.3 | 36.9 | 18.7 | 26.1 |
| Income: $100,000 or more (254) | 15.9 | 36.6 | 22.8 | 24.7 |
| All checking account holders (1,316) | 16.6 | 37.4 | 19.0 | 27.0 |
| Payment Option Dropped | Market Share Debit | Market Share Cash | Market Share Credit | Market Share Check |
|---|---|---|---|---|
| Debit | 45.3 | 22.5 | 32.2 | |
| Debit diversion ratios | (47.6) | (21.1) | (31.3) | |
| Cash | 26.7 | 31.3 | 42.1 | |
| Cash diversion ratios | (27.0) | (32.9) | (40.4) | |
| Credit | 20.0 | 46.6 | 33.3 | |
| Credit diversion ratios | (17.9) | (48.4) | (33.2) | |
| Check | 22.5 | 51.1 | 26.4 | |
| Check diversion ratios | (21.9) | (50.7) | (27.4) | |
| Original shares | 16.6 | 37.4 | 19.0 | 27.0 |
| Payment Option Dropped | Counterfactual Market Shares Debit | Counterfactual Market Shares Cash | Counterfactual Market Shares Credit | Counterfactual Market Shares Check | Within-Sample Market Shares Debit | Within-Sample Market Shares Cash | Within-Sample Market Shares Credit | Within-Sample Market Shares Check |
|---|---|---|---|---|---|---|---|---|
| Age: 18-24 yrs | 50.3 | 28.4 | 21.3 | 24.7 | 53.8 | 11.3 | 10.2 | |
| Age: 25-34 yrs | 45.6 | 29.9 | 24.5 | 27.3 | 40.0 | 17.3 | 15.3 | |
| Age: 35-44 yrs | 36.2 | 27.3 | 36.5 | 21.1 | 36.9 | 17.1 | 24.9 | |
| Age: 45-54 yrs | 26.1 | 26.4 | 47.6 | 15.6 | 34.8 | 16.8 | 32.8 | |
| Age: 55-64 yrs | 21.5 | 29.8 | 48.7 | 12.4 | 32.1 | 20.1 | 35.4 | |
| Age: 65 and older | 14.6 | 41.0 | 44.4 | 6.0 | 38.8 | 26.6 | 28.6 | |
| Education: Less than high school diploma | 28.9 | 25.2 | 45.8 | 15.0 | 41.4 | 14.4 | 29.3 | |
| Education: Some college | 32.8 | 27.0 | 40.3 | 19.7 | 35.3 | 16.7 | 28.3 | |
| Education: Bachelors degree | 31.2 | 30.3 | 38.5 | 17.5 | 37.1 | 19.2 | 26.2 | |
| Education: Graduate degree | 22.0 | 47.5 | 30.5 | 12.7 | 34.4 | 31.7 | 21.2 | |
| Gender: Male | 28.3 | 36.2 | 35.5 | 14.6 | 41.3 | 21.6 | 22.4 | |
| Gender: Female | 30.5 | 25.6 | 43.9 | 18.3 | 34.1 | 16.7 | 30.9 |
| Payment Option Dropped | Counterfactual Market Shares Debit | Counterfactual Market Shares Cash | Counterfactual Market Shares Credit | Counterfactual Market Shares Check | Within-Sample Market Shares Debit | Within-Sample Market Shares Cash | Within-Sample Market Shares Credit | Within-Sample Market Shares Check |
|---|---|---|---|---|---|---|---|---|
| Age: 18-24 yrs | 29.4 | 59.1 | 11.5 | 24.7 | 53.8 | 11.3 | 10.2 | |
| Age: 25-34 yrs | 33.9 | 48.2 | 17.8 | 27.3 | 40.0 | 17.3 | 15.3 | |
| Age: 35-44 yrs | 28.1 | 43.8 | 28.1 | 21.1 | 36.9 | 17.1 | 24.9 | |
| Age: 45-54 yrs | 21.3 | 39.8 | 39.0 | 15.6 | 34.8 | 16.8 | 32.8 | |
| Age: 55-64 yrs | 18.0 | 41.3 | 40.7 | 12.4 | 32.1 | 20.1 | 35.4 | |
| Age: 65 and older | 12.2 | 50.2 | 37.7 | 6.0 | 38.8 | 26.6 | 28.6 | |
| Education: Less than high school diploma | 20.0 | 46.5 | 33.6 | 15.0 | 41.4 | 14.4 | 29.3 | |
| Education: Some college | 25.0 | 42.5 | 32.5 | 19.7 | 35.3 | 16.7 | 28.3 | |
| Education: Bachelors degree | 24.4 | 44.5 | 31.0 | 17.5 | 37.1 | 19.2 | 26.2 | |
| Education: Graduate degree | 21.2 | 48.7 | 30.1 | 12.7 | 34.4 | 31.7 | 21.2 | |
| Gender: Male | 21.3 | 50.9 | 27.8 | 14.6 | 41.3 | 21.6 | 22.4 | |
| Gender: Female | 23.9 | 40.3 | 35.8 | 18.3 | 34.1 | 16.7 | 30.9 |
| Payment Option Dropped | Counterfactual Market Shares Debit | Counterfactual Market Shares Cash | Counterfactual Market Shares Credit | Counterfactual Market Shares Check | Within-Sample Market Shares Debit | Within-Sample Market Shares Cash | Within-Sample Market Shares Credit | Within-Sample Market Shares Check |
|---|---|---|---|---|---|---|---|---|
| Age: 18-24 yrs | 28.6 | 57.1 | 14.3 | 24.7 | 53.8 | 11.3 | 10.2 | |
| Age: 25-34 yrs | 33.1 | 46.3 | 20.6 | 27.3 | 40.0 | 17.3 | 15.3 | |
| Age: 35-44 yrs | 30.9 | 47.1 | 22.0 | 21.1 | 36.9 | 17.1 | 24.9 | |
| Age: 45-54 yrs | 26.4 | 48.1 | 25.5 | 15.6 | 34.8 | 16.8 | 32.8 | |
| Age: 55-64 yrs | 22.0 | 49.0 | 29.0 | 12.4 | 32.1 | 20.1 | 35.4 | |
| Age: 65 and older | 12.8 | 51.7 | 35.5 | 6.0 | 38.8 | 26.6 | 28.6 | |
| Education: Less than high school diploma | 24.2 | 54.9 | 20.9 | 15.0 | 41.4 | 14.4 | 29.3 | |
| Education: Some college | 28.3 | 47.9 | 23.9 | 19.7 | 35.3 | 16.7 | 28.3 | |
| Education: Bachelors degree | 26.6 | 47.9 | 25.5 | 17.5 | 37.1 | 19.2 | 26.2 | |
| Education: Graduate degree | 18.8 | 41.7 | 39.6 | 12.7 | 34.4 | 31.7 | 21.2 | |
| Gender: Male | 21.5 | 50.7 | 27.8 | 14.6 | 41.3 | 21.6 | 22.4 | |
| Gender: Female | 28.3 | 47.5 | 24.2 | 18.3 | 34.1 | 16.7 | 30.9 | |
| All checking account holders | 16.6 | 37.4 | 19.0 | 27.0 |
Note: All predictions estimated on population of checking account holders.
| Characteristic | Market Share Flash | Market Share Cash | Market Share Credit | Market Share Check |
|---|---|---|---|---|
| Age: 18-24 yrs | 43.0 | 41.0 | 8.4 | 7.5 |
| Age: 25-34 yrs | 46.3 | 29.6 | 12.9 | 11.2 |
| Age: 35-44 yrs | 38.2 | 29.0 | 13.4 | 19.4 |
| Age: 45-54 yrs | 29.9 | 29.0 | 14.1 | 27.1 |
| Age: 55-64 yrs | 24.9 | 27.6 | 17.3 | 30.2 |
| Age: 65 and older | 13.2 | 35.8 | 24.6 | 26.4 |
| Education: Less than high school | 28.3 | 34.7 | 12.3 | 24.7 |
| Education: Some college | 35.2 | 28.1 | 13.6 | 23.1 |
| Education: Bachelors degree | 32.4 | 30.2 | 15.8 | 21.6 |
| Education: Graduate degree | 24.8 | 29.6 | 27.4 | 18.3 |
| Gender: Male | 27.8 | 34.7 | 18.4 | 19.1 |
| Gender: Female | 33.3 | 27.5 | 13.7 | 25.4 |
| All checking account holders | 30.8 | 30.8 | 15.9 | 22.5 |
| (-46.5) | (-21.8) | (-31.7) | ||
| Original shares | 16.6 | 37.4 | 19.0 | 27.0 |
| (Debit) |
| Market Share Debit | Market Share Cash | Market Share Credit | Market Share Check | |
|---|---|---|---|---|
| Age: 18-24 yrs | 24.7 | 53.8 | 11.3 | 10.2 |
| Age: 25-34 yrs | 24.2 | 48.6 | 14.2 | 13.0 |
| Age: 35-44 yrs | 26.3 | 40.5 | 16.3 | 16.9 |
| Age: 45-54 yrs | 19.3 | 35.0 | 17.8 | 27.9 |
| Age: 55-64 yrs | 15.2 | 34.6 | 17.3 | 32.9 |
| Age: 65 and older | 12.1 | 36.2 | 19.2 | 32.5 |
| Education: Less than high school diploma | 18.8 | 42.1 | 12.0 | 27.0 |
| Education: Some college | 22.8 | 37.4 | 14.8 | 25.1 |
| Education: Bachelors degree | 20.1 | 39.8 | 17.2 | 22.8 |
| Education: Graduate degree | 15.0 | 37.3 | 28.6 | 19.0 |
| Gender: Male | 17.5 | 43.2 | 19.1 | 20.2 |
| Gender: Female | 21.6 | 36.1 | 14.7 | 27.6 |
| Gender: All checking account holders | 19.7 | 39.4 | 16.7 | 24.2 |
| Gender: Original shares | 16.6 | 37.4 | 19.0 | 27.0 |
Bibliography
Federal Reserve Bank of Chicago working paper.
Working paper, De Nederlandsche Bank.
FEDS Working Paper no. 2006-16, Federal Reserve Board.
Federal Reserve Bank of Kansas City.
Debit, Credit, and Cash: Survey Evidence on Gasoline Purchases, Journal of Economics and Business 51(5): 409-422.
Working paper, De Nederlandsche Bank.
Prepared for presentation at the Annual Meetings of the Western Economic Association, Seattle, Washington.
Working paper, Federal Reserve Board.
Working paper, Free University of Brussels.
Working paper, Dartmouth University.
Footnotes
 |
(6) |
Return to Text