
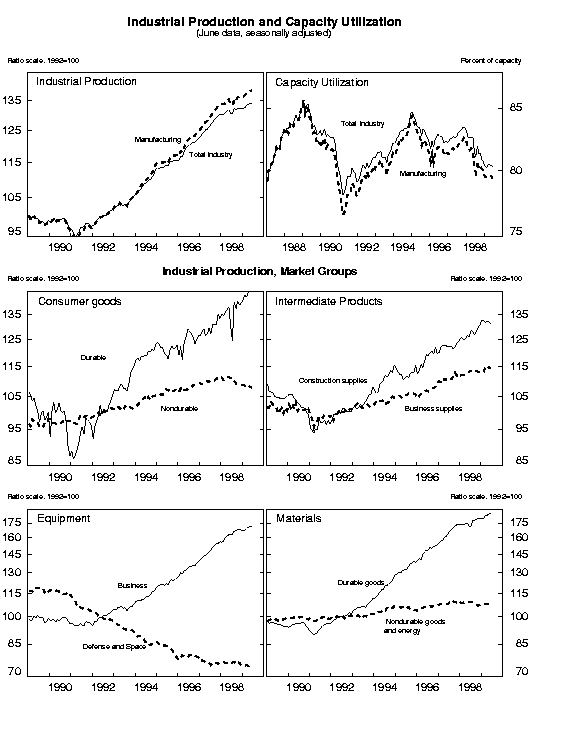
INDUSTRIAL PRODUCTION AND CAPACITY UTILIZATION
Industrial production rose 0.2 percent in June after gains of 0.2 percent in May and 0.3 percent in April. At 134.2 percent of its 1992 average, industrial production in June was 2.7 percent higher than in June 1998. For the second quarter as a whole, the total index increased at an annual rate of 3.9 percent, up from a first-quarter pace of 1.3 percent. At 80.3 percent in June, capacity utilization for total industry was little changed from the beginning of the year but was down 1.2 percentage points from June 1998.
 INDUSTRIAL PRODUCTION AND CAPACITY UTILIZATION:  SUMMARY
 Seasonally adjusted
                               |             Index, 1992=100             |                 Percent change
                               |     1999                                |   1999                          |  June 98 to
 Industrial Production         |     Mar.      Apr.       May      June  |   Mar.    Apr.     May    June  |   June 99
 ------------------------------------------------------------------------------------------------------------------------
                               |                                         |                                 |
  Total index                  |    133.3     133.7     134.0     134.2  |     .7      .3      .2      .2  |         2.7
     Previous estimates        |    133.3     133.8     134.1            |     .7      .4      .2          |
                               |                                         |                                 |
 Major market groups:          |                                         |                                 |
     Products, total           |    125.2     125.6     125.8     125.6  |     .5      .4      .1     -.1  |         1.6
        Consumer goods         |    115.3     115.6     115.6     115.6  |     .0      .3      .0      .0  |          .4
        Business equipment     |    169.3     170.7     171.7     171.9  |    1.0      .8      .6      .1  |         5.1
        Construction supplies  |    131.7     132.2     132.1     131.3  |    -.8      .4     -.1     -.6  |         4.1
     Materials                 |    146.7     146.9     147.4     148.2  |    1.0      .2      .3      .5  |         4.5
                               |                                         |                                 |
 Major industry groups:        |                                         |                                 |
     Manufacturing             |    137.5     138.0     138.4     138.6  |     .4      .4      .3      .1  |         3.6
        Durable                |    163.1     164.2     165.2     165.9  |     .9      .6      .6      .4  |         7.1
        Nondurable             |    111.7     111.8     111.6     111.3  |    -.2      .1     -.2     -.2  |         -.7
     Mining                    |     98.9      98.3      98.7      99.1  |     .1     -.6      .4      .4  |        -5.4
     Utilities                 |    116.7     116.3     114.3     114.7  |    4.9     -.4    -1.7      .4  |        -3.4
 ------------------------------------------------------------------------------------------------------------------------
                               |                                                                           |   Capacity
                               |                            Percent of Capacity                            |    Growth
                               |   Average      1982   1988-89     1998  |   1999                          |  June 98 to
 Capacity Utilization          |  1967-98        Low      High     June  |   Mar.    Apr.     May    June  |   June 99
 ------------------------------------------------------------------------------------------------------------------------
                               |                                         |                                 |
  Total industry               |     82.1      71.1      85.4      81.5  |   80.5    80.5    80.4    80.3  |         4.3
     Previous estimates        |                                         |   80.5    80.5    80.5          |
                               |                                         |                                 |
     Manufacturing             |     81.1      69.0      85.7      80.2  |   79.5    79.6    79.6    79.4  |         4.7
        Advanced processing    |     80.5      70.4      84.2      79.2  |   78.4    78.6    78.6    78.5  |         5.6
        Primary processing     |     82.4      66.2      88.9      83.3  |   82.7    82.5    82.4    82.2  |         2.4
     Mining                    |     87.5      80.3      88.0      87.3  |   81.8    81.2    81.4    81.7  |         1.1
     Utilities                 |     87.4      75.9      92.6      94.0  |   91.9    91.5    89.9    90.2  |          .7
 ------------------------------------------------------------------------------------------------------------------------
 Note:  Estimates for June are preliminary.  Estimates from March to May are revised.
Market Groups
The output of consumer goods was unchanged for a second month. The production of durable consumer goods decelerated to a 0.5 percent rate. The output of automotive products rose 1.8 percent while the production of other durable goods fell 0.5 percent, with declines in kitchen appliances, carpets, and other goods exceeding gains in home computing equipment and room air conditioners. For the second quarter, the output of durable consumer goods increased at an annual rate of 12.3 percent as assemblies of light vehicles rose to a seasonally adjusted annual rate of 12.7 million units, up from 12.3 million units in the first quarter. The production of nondurable consumer goods eased 0.2 percent in June; a small decrease in the production of non-energy goods was accompanied by a further decline in the production of energy goods as the output of fuels fell back. Over the past twelve months, the output of consumer nondurable goods fell 2.9 percent, with weakness in most major categories. A 0.1 percent gain in the output of business equipment followed monthly advances that averaged 0.8 percent from March to May. Further gains in the production of information processing equipment and in the assembly of business vehicles were counterbalanced by declines in the output of farm machinery and equipment, civilian aircraft, and industrial equipment, particularly construction and mining machinery. The output of defense and space equipment declined 0.6 percent, to a level 2 percent below that of June 1998. The production of both construction and business supplies eased for a second month. For the second quarter, the index for construction supplies fell at an annual rate of 1.2 percent after an increase of 8.3 percent in the first quarter, when mild weather contributed to strength in construction activity. The output of materials increased 0.5 percent. The output of durable goods materials, which, in terms of value added, accounts for more than half of industrial materials, increased 0.7 percent in June, as it had in May. The output of semiconductors and computer parts continued to rise appreciably. The production of nondurable goods materials and energy materials turned up a bit after declines in May; both of these indexes were more than 1 percent below their levels of June 1998.
Industry Groups
Output in manufacturing edged up 0.1 percent as an increase of 0.4 percent for durable goods was partly offset by a decrease of 0.2 percent for nondurables. The June rise in durables was the smallest since February; output over the second quarter rose at an annual rate of 7.7 percent. The gain in June, as well as for the second quarter, principally reflected significant gains at makers of high-technology goods, such as computers and semiconductors, and increases in the output of motor vehicles and parts. The output of stone, clay, and glass products also picked up in June. Production decreased notably in lumber and in miscellaneous manufacturing; output has also fallen in aerospace and miscellaneous transportation equipment because commercial aircraft production has been declining from the record levels of last year. The decrease in the production of nondurables continued the weakness of recent months; output edged down 0.3 percent at an annual rate in the second quarter after having increased only slightly during the previous two quarters. The output of petroleum products and of leather and products fell about 2 percent in June; the production of tobacco, textiles, and apparel fell about 1 percent; and the output of chemicals and products fell about 1/2 percent. However, increases in food and in paper and products restrained the overall drop in nondurables. The factory operating rate fell 0.2 percentage point, to 79.4 percent, with decreases in both advanced- and primary-processing industries. Capacity utilization in primary-processing industries, at 82.2 percent, dipped noticeably below its 1967-98 average for only the second month since mid-1992; utilization for advanced-processing industries has been below its long-run average since June 1998. The output indexes for both utilities and mining rose 0.4 percent in June. The operating rate at electric utilities, 93.6 percent, was about 4 percentage points above its long-run average. The operating rate for mining, 81.7 percent, was well below its long-run average; weakness in the oil fields accounted for much of the slack.
G.17 Release Tables: