
INDUSTRIAL PRODUCTION AND CAPACITY UTILIZATION
INDUSTRIAL PRODUCTION AND CAPACITY UTILIZATION
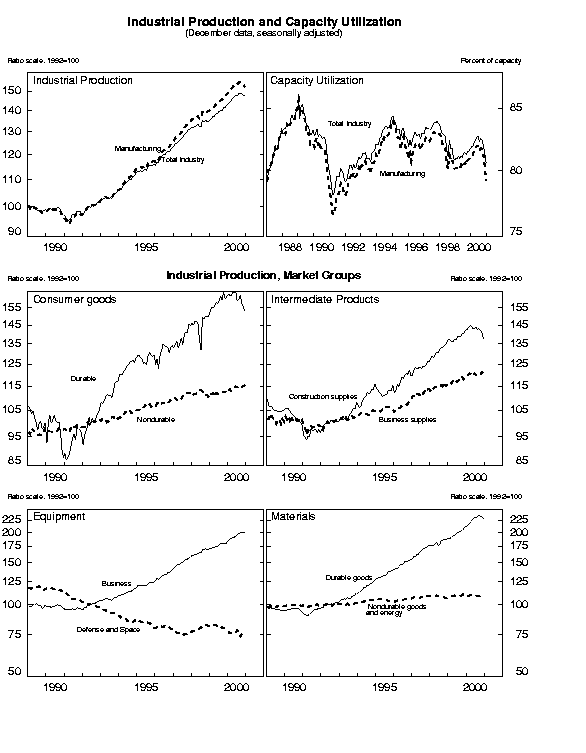
Industrial production fell 0.6 percent in December after two months of smaller losses. After having slowed in the third quarter, industrial output contracted at an annual rate of 1.1 percent in the fourth quarter, the first negative quarterly reading since 1991. Manufacturing output declined 1.1 percent in December, with cutbacks in many industries. Output at utilities surged 6.5 percent in response to extremely cold weather, and production in mining edged up 0.3 percent. At 147.3 percent of its 1992 average, industrial production was 3.1 percent higher than in December 1999. The rate of capacity utilization for total industry fell to 80.6 percent in December, a level 1-1/2 percentage points below its 1967-99 average.
 INDUSTRIAL PRODUCTION AND CAPACITY UTILIZATION:  SUMMARY
 Seasonally adjusted
                              |             Index, 1992=100             |                    Percent change
                              |     2000                                |   2000                          |        Dec. 99 to
 Industrial Production        |    Sept.      Oct.      Nov.      Dec.  |  Sept.    Oct.    Nov.    Dec.  |         Dec. 00
 -----------------------------------------------------------------------------------------------------------------------------
                              |                                         |                                 |
  Total index                 |    149.0     148.5     148.1     147.3  |     .2     -.3     -.3     -.6  |               3.1
     Previous estimates       |    149.1     148.9     148.6            |     .3     -.1     -.2          |
                              |                                         |                                 |
 Major market groups:         |                                         |                                 |
     Products, total          |    136.7     136.3     136.4     136.1  |     .0     -.3      .1     -.2  |               2.6
        Consumer goods        |    123.8     122.7     122.8     122.9  |     .0     -.8      .1      .0  |                .4
        Business equipment    |    199.5     200.2     200.3     199.4  |     .9      .3      .1     -.4  |              10.5
        Construction supplies |    143.1     142.2     140.7     137.7  |     .3     -.7    -1.1    -2.1  |              -3.1
     Materials                |    171.3     170.8     169.3     167.6  |     .5     -.3     -.9    -1.0  |               4.1
                              |                                         |                                 |
 Major industry groups:       |                                         |                                 |
     Manufacturing            |    155.1     154.8     153.9     152.2  |     .3     -.2     -.6    -1.1  |               2.6
        Durable               |    198.4     197.2     196.0     193.5  |     .8     -.6     -.6    -1.2  |               6.0
        Nondurable            |    116.0     116.4     115.8     114.7  |    -.3      .3     -.5     -.9  |              -1.6
     Mining                   |    100.4     100.4     100.3     100.6  |    -.6      .0     -.1      .3  |               1.9
     Utilities                |    121.7     119.4     123.9     132.0  |    -.3    -1.9     3.8     6.5  |              12.4
 -----------------------------------------------------------------------------------------------------------------------------
                               |                                                                           |    Capacity
                               |                            Percent of Capacity                            |     Growth
                               |   Average      1982   1988-89     1999  |   2000                          |    Dec. 99 to
 Capacity Utilization          |  1967-99        Low      High     Dec.  |  Sept.    Oct.    Nov.    Dec.  |     Dec. 00
 --------------------------------------------------------------------------------------------------------------------------
                               |                                         |                                 |
  Total industry               |     82.1      71.1      85.4      81.7  |   82.4    81.9    81.4    80.6  |           4.6
     Previous estimates        |                                         |   82.5    82.1    81.6          |
                               |                                         |                                 |
     Manufacturing             |     81.1      69.0      85.7      81.0  |   81.7    81.2    80.4    79.1  |           5.0
        Advanced processing    |     80.5      70.4      84.2      79.8  |   81.6    81.0    80.4    79.6  |           6.7
        Primary processing     |     82.5      66.2      88.9      85.0  |   83.0    82.6    81.5    79.2  |           1.6
     Mining                    |     87.4      80.3      88.0      84.5  |   86.4    86.5    86.5    86.9  |           -.9
     Utilities                 |     87.5      75.9      92.6      90.0  |   91.0    89.0    92.1    97.9  |           3.3
 --------------------------------------------------------------------------------------------------------------------------
 Note:  Estimates for December are preliminary.  Estimates from September to November are revised.
Market Groups
The index for consumer goods was unchanged in December, with decreases in many categories offset by a surge in the output of consumer energy products. The production of durable consumer goods fell 1.5 percent and was pulled down for a third month by a drop in the production of automotive products. The output of other durable goods also fell for a third month and was down at an annual rate of 4.0 percent in the fourth quarter. The production of nondurable consumer goods other than energy products ticked down 0.1 percent in December.
The output of business equipment fell 0.4 percent in December but increased at an annual rate of 5.2 percent in the fourth quarter. The production of both industrial and transit equipment fell about 1-1/2 percent in December. The output of transit equipment, particularly motor vehicles, dropped again and posted a substantial loss for the quarter. The output of computer and office equipment grew 0.6 percent in December, but growth during the quarter was noticeably slower than earlier in the year. Production of other business equipment increased 1.4 percent in December, lifted by a rebound in farm machinery.
The production of construction supplies fell sharply in December and was down at an annual rate of 8.2 percent in the fourth quarter. The output of materials contracted 1.0 percent in December following a similar decline in November. The indexes for durable and nondurable materials were down sharply and were offset only partly by an increase in the output of energy materials. Among durable materials industries, the consumer parts group was hit by another decline in the production of original equipment parts for motor vehicles. The output of semiconductors, printed circuit boards, and other electronic components increased 2.5 percent in December. Nonetheless, the fourth-quarter increase in this category was at an annual rate of 24.0 percent, a pace significantly below the average over the past two years. The 1.6 percent drop in the index for nondurable materials mainly reflected declines in the output of paper and chemicals.
Industry Groups
Manufacturing output dropped 1.1 percent in December, with a 1.2 percent decrease in the production of durable goods and a 0.9 percent decrease in nondurable goods. Among durable goods, the losses were widespread, with the largest declines in primary metals, fabricated metal products, and transportation equipment. The output of nondurables has declined, on balance, over the last six months, and losses in December were widespread. The petroleum products and paper and products industries suffered the largest drops.
The factory operating rate declined to 79.1 percent in December, 2-1/2 percentage points below its September level and the lowest level since 1993. In recent months, capacity utilization has fallen significantly in the transportation equipment and primary metals industries. The operating rate at electric utilities surged to 97.8 percent in December, a level 8.2 percentage points above its 1967-99 average. The operating rate for mining was 86.9 percent, a reading at the high end of its range for the year.
Revision of Industrial Production and Capacity Utilization
On December 5, the Federal Reserve Board published revisions to the index of industrial
production (IP), to the related measures of capacity and capacity utilization, and to the index of
industrial use of electric power. The updated measures reflect both the incorporation of newly
available, more comprehensive source data typical of annual revisions and, for some series, the
introduction of improved compilation methods. The revision also included a refinement of the
method used to aggregate the individual series in the production and capacity indexes. The new
source data are for recent years, primarily 1997 through 1999, and the modified methods affect
data from 1992 onward.
The updating of source data for IP included annual data from the following reports of the
Bureau of the Census: the 1997 Census of Manufactures, the 1998 Annual Survey of
Manufactures, and selected editions of its 1998 and 1999 Current Industrial Reports. Annual
data from the U.S. Geological Survey regarding metallic and nonmetallic minerals (except fuels)
for 1998 and 1999 also were introduced. The updating included revisions to the monthly
indicator for each industry (either physical product data, production-worker hours, or electric
power usage) and revised seasonal factors.
The revision to capacity and capacity utilization incorporated preliminary data from the
1999 Survey of Plant Capacity of the Bureau of the Census, which covers manufacturing, along
with other new data on capacity from the U.S. Geological Survey, the Department of Energy,
and other organizations. The statistics on the industrial use of electric power incorporated
additional information received from utilities for the past few years as well as data from the 1997
Census of Manufactures and 1998 Annual Survey of Manufactures.
Aggregate IP indexes are built as annually weighted chain-type indexes, beginning with
data for 1977. Previously, the weights changed at the middle of every year; with the revision,
the weights change every month beginning with data for 1992.
The revision is available on the Board's web site (www.federalreserve.gov/releases/g17).
The revised data are also available through the web site of the Department of Commerce.
Further information on these revisions is available from the Board's Industrial Output Section
(telephone 202-452-3197).
This statistical release, the G.17, will be redesigned beginning with the issue covering
data for January 2001. Special aggregates will be added; although some detailed industry data
will no longer be listed in the regular release, these series will continue to be available on the
Federal Reserve Board's public web site, along with a template of the redesigned tables.
G.17 Release Tables:
G.17: Release |Release dates |About |ASCII |PDF (199 KB) |Historical data