INDUSTRIAL PRODUCTION AND CAPACITY UTILIZATION
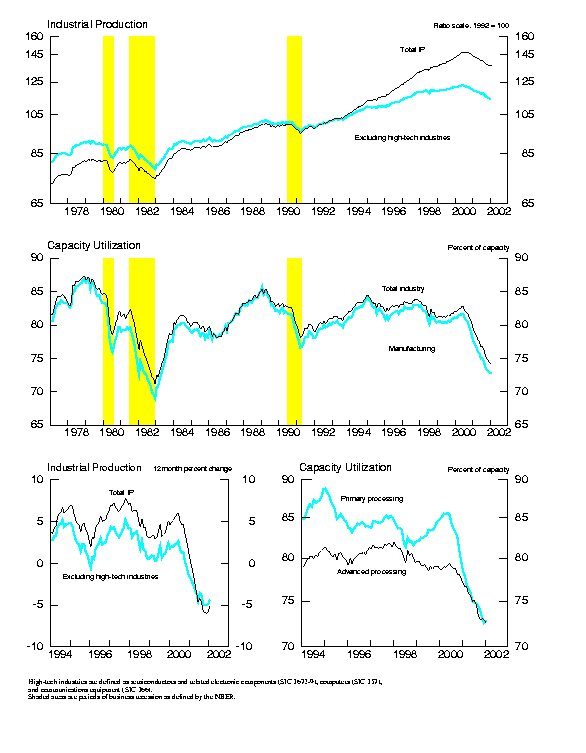
Industrial production declined 0.1 percent in January. Output fell 1/4 percent per month,
on average, in the three months from November through January after having dropped 0.5
percent per month over the preceding twelve months. At 136.5 percent of its 1992 average,
output in January was 5.2 percent below its level in January 2001. After decreases in fourteen of
the preceding fifteen months, manufacturing output was unchanged; one factor preventing
another drop in manufacturing was a substantial rebound in steel production after a large drop in
December. The output of utilities decreased 0.7 percent, as temperatures remained unseasonably
mild, and the output at mines declined 0.5 percent.
Capacity utilization for total industry edged down 0.2 percentage point in January, to
74.2 percent, a level well below its 1967-2001 average of 81.9 percent. Because investment is
expected to remain weak, capacity is projected to expand only 1.0 percent in 2002, the slowest
rate of increase for this statistic since it began in 1967.
 INDUSTRIAL PRODUCTION AND CAPACITY UTILIZATION:  SUMMARY
 Seasonally adjusted
 -----------------------------------------------------------------------------------------------------------------------------------
                               |                    1992=100                     |                  Percent change
                               | ----------------------------------------------- | -------------------------------------------------
                               |       2001                                2002  |   2001                    2002  |    Jan. '01 to
 Industrial production         |       Oct.        Nov.        Dec.        Jan.  |   Oct.    Nov.    Dec.    Jan.  |      Jan. '02
 -----------------------------------------------------------------------------------------------------------------------------------
                               |                                                 |                                 |
  Total index                  |      137.7       137.1       136.7       136.5  |    -.6     -.4     -.3     -.1  |           -5.2
     Previous estimates        |      137.5       136.9       136.7              |    -.7     -.4     -.1          |
                               |                                                 |                                 |
  Major market groups:         |                                                 |                                 |
  Products, total              |      126.8       126.7       126.6       126.2  |    -.7     -.1     -.2     -.3  |           -4.9
     Consumer goods            |      119.6       119.9       120.8       120.3  |    -.3      .3      .7     -.5  |            -.6
     Business equipment        |      166.9       166.9       164.1       164.7  |    -.9      .0    -1.7      .4  |          -12.7
     Construction supplies     |      134.6       134.3       135.2       134.2  |   -2.5     -.2      .7     -.7  |           -3.3
  Materials                    |      155.9       154.3       153.4       153.8  |    -.4    -1.0     -.6      .2  |           -5.5
                               |                                                 |                                 |
  Major industry groups:       |                                                 |                                 |
  Manufacturing                |      142.1       141.8       141.3       141.3  |    -.5     -.2     -.4      .0  |           -5.1
     Durable                   |      173.9       174.0       173.4       173.6  |   -1.3      .0     -.3      .1  |           -6.5
     Nondurable                |      110.8       110.3       109.8       109.6  |     .3     -.4     -.4     -.2  |           -3.5
  Mining                       |       99.5        98.8        97.4        96.9  |   -2.5     -.7    -1.4     -.5  |           -4.3
  Utilities                    |      119.4       115.9       117.2       116.5  |    1.1    -2.9     1.1     -.7  |           -7.0
 -----------------------------------------------------------------------------------------------------------------------------------
                               |                                                                                   |    Capacity
                               |                                Percent of capacity                                |     growth
                               | --------------------------------------------------------------------------------- | ---------------
                               |     Average        1982     1988-89       2001  |   2001                    2002  |    Jan. '01 to
 Capacity utilization          |  1967-2001          Low        High       Jan.  |   Oct.    Nov.    Dec.    Jan.  |      Jan. '02
 -----------------------------------------------------------------------------------------------------------------------------------
                               |                                                 |                                 |
  Total industry               |       81.9        71.1        85.4        79.3  |   75.0    74.7    74.4    74.2  |            1.3
     Previous estimates        |                                                 |   74.9    74.5    74.4          |
                               |                                                 |                                 |
  Manufacturing                |       80.9        69.0        85.7        77.6  |   73.3    73.1    72.8    72.7  |            1.2
     Advanced processing       |       80.3        71.0        84.2        77.0  |   72.9    73.0    72.9    72.6  |             .7
     Primary processing        |       82.0        65.7        88.3        78.4  |   73.9    73.1    72.6    72.9  |            2.0
  Mining                       |       87.6        80.3        88.0        90.5  |   88.4    87.7    86.3    85.9  |             .8
  Utilities                    |       87.6        75.9        92.6        93.4  |   85.7    82.9    83.4    82.6  |            5.2
 -----------------------------------------------------------------------------------------------------------------------------------
 Note:  Estimates for January are preliminary.  Estimates from October to December are revised.
Market Groups
The output of consumer goods fell 0.5 percent, thereby reversing about half of the gain
recorded over the preceding two months. The production index for appliances, furniture, and
carpeting advanced for a third month; the January reading was 1.5 percent above its level in
January 2001. However, output indexes for automotive products and for household audio and
video equipment fell after sharp year-end increases. Motor vehicle assemblies totaled 12.2
million units (annual rate) in January, just below the December level, but still substantially
above the levels achieved during much of last year. The output of consumer nondurables fell 0.4
percent. The output of food and tobacco dipped after several months of increases; also
contributing to the drop in nondurables was another substantial drop in production in the
category covering periodicals, books, and cards.
The production of business equipment advanced 0.4 percent; an increase in the
production of industrial and other equipment was mostly offset by a drop in transit equipment.
In the industrial and other equipment category, the output of farm machinery and construction
equipment rebounded, although their output indexes remained well below their year-ago levels.
The continued retrenchment in the production of commercial aircraft and related equipment led
the overall drop in the output of transit equipment. The output of information-processing
equipment was little changed; the production of communications equipment continued to
contract significantly, but the output of other equipment, including computers, moved up further.
The production of defense and space equipment climbed 1.2 percent, its fifth consecutive
monthly increase.
The production indexes for construction supplies and for business supplies dropped about
3/4 percent. The decline in construction supplies followed an increase of similar size in
December; output for this group has changed little, on net, since October. The output of
business supplies has fallen between 0.7 percent and 1.1 percent in each of the past three
months; it has dropped almost 0.7 percent per month, on average, over the past twelve months,
and decreases have been widespread among its components.
The 0.2 percent rise in the output of materials was only the second monthly increase for
the category since September 2000. The production of both durable and nondurable materials
advanced 0.3 percent in January, while the index for energy materials edged up 0.1 percent.
Among durables, a rebound in steel output and a gain in the manufacture of semiconductors were
partly offset by a decrease in the production of motor vehicle parts. The output of
semiconductors and related electronic components has risen more than 5 percent since its trough
in August 2001. An increase in chemical materials, which reversed just part of the sharp loss
posted over the preceding two months, contributed importantly to the gain in the output of
nondurable materials.
Industry Groups
Manufacturing output was unchanged as a 0.1 percent rise in the production of durables
was offset by a decrease of 0.2 percent in nondurables. In addition to the rebound in iron and
steel, other notable gains among durable goods industries occurred in furniture and fixtures;
stone, clay, and glass products; and industrial machinery and computer equipment. The output
of motor vehicles and parts fell 1.2 percent; even so, it is one of only two major durable goods
industries (along with lumber and products) with output indexes above their levels in January
2001. Among nondurables, the largest decreases in January were in printing and publishing,
textiles, and food. The output indexes for textiles and for printing and publishing have fallen
about 10 percent or more since January 2001; apparel and leather products have fallen by like
amounts.
Capacity utilization in manufacturing edged down 0.1 percentage point, to 72.7 percent, a
level about 8 percentage points below its 1967-2001 average. The operating rate for
advanced-processing industries decreased 0.3 percentage point, while the rate for
primary-processing industries increased 0.3 percentage point. Operating rates for all major
manufacturing industries with the exception of petroleum refining remain below their long-term
averages. The industry with the lowest operating rate is electrical machinery, which has had
steep declines in the output of communications equipment and of semiconductors and related
equipment since the beginning of 2001.
Relatively warm temperatures and the low levels of activity at factories have pushed the
operating rate for utilities about 5 percentage points below its long-term average. The operating
rate for mining has fallen about 6 percentage points since last spring, to a level 2 percentage
points below its long-term average.
G.17 Release Tables:
| Ascii | Screen reader | Summary: Industrial Production and Capacity Utilization |
Chart | | Chart 1: Industrial Production and Capacity Utilization | | Ascii | Screen reader | Table 1:Industrial Production: Market and Industry Groups (percent change) |
| Ascii | Screen reader | Table 2:Industrial Production: Special Aggregates and Selected Detail (percent change) |
| Ascii | Screen reader | Table 3: Motor Vehicle Assemblies |
| Ascii | Screen reader | Table 4: Industrial Production Indexes: Market and Industry Group Summary |
| Ascii | Screen reader | Table 5: Industrial Production Indexes: Special Aggregates |
| Ascii | Screen reader | Table 6: Capacity Utilization: Manufacturing, Mining, and Utilities |
| Ascii | Screen reader | Table 7: Industrial Capacity: Manufacturing, Mining, and Utilities (percent change) |
| Ascii | Screen reader | Table 8: Industrial Production: Gross Value of Products |
| Ascii | Screen reader | Table 9: Diffusion Indexes of Industrial Production |
| Ascii | Screen reader | Table 10: Electric Power Use: Manufacturing and Mining |
| Ascii | Screen reader | Table 11: Historical Statistics for IP, Capacity, and Utilization: Total Industry |
| Ascii | Screen reader | Table 12: Historical Statistics for IP, Capacity, and Utilization: Manufacturing |
| Ascii | Screen reader | Table 13: Historical Statistics for IP, Capacity, and Utilization: Total Industry excluding Selected High-Technology Industries |
| Ascii | Screen reader | Table 14: Historical Statistics for IP, Capacity, and Utilization: Manufacturing excluding Selected High-Technology Industries |
Home | Statistical releases
Accessibility
To comment on this site, please fill out our feedback form.
Last update: February 15, 2002, 9:15 AM
