
Release Date: February 14, 2003
Release dates | Historical data | Documentation
Current Monthly Release Other formats: ASCII | PDF (144 KB)
Supplemental Monthly Release Other formats: ASCII | PDF (144 KB)
Annual Revision Release Other formats: ASCII | PDF (150 KB)
INDUSTRIAL PRODUCTION AND CAPACITY UTILIZATION
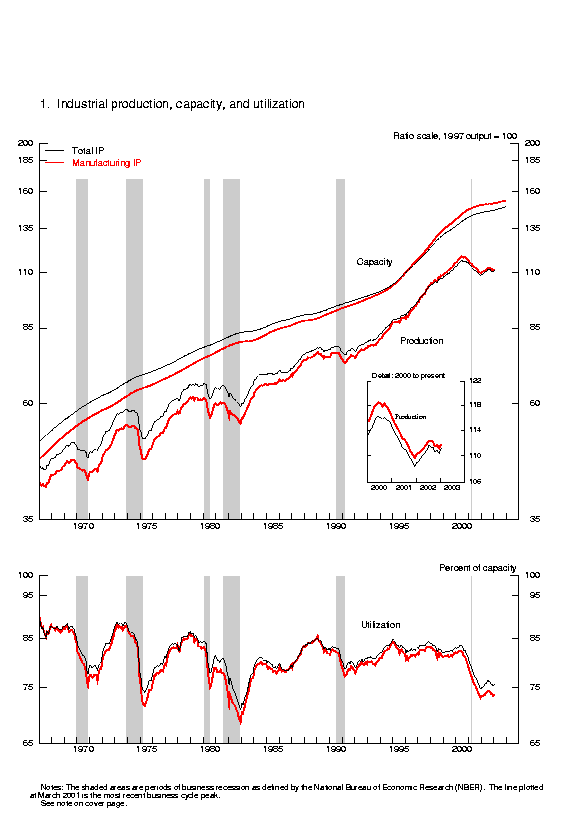
Industrial production rose 0.7 percent in January. The increase more than
reversed December's revised decline of 0.4 percent. At 111.1 percent of the 1997 average,
output was 2.0 percent above its level in January 2002. Manufacturing output and output at
utilities moved up noticeably, while mining output fell. Much of the gain in manufacturing
output in January reflected an increase in the production of motor vehicles. Excluding motor
vehicles and parts, manufacturing output ticked up 0.1 percent after having been unchanged in
December. Capacity utilization for total industry increased to 75.7 percent, a rate 0.7 percentage
point above that of January 2002 but 5.6 percentage points below its 1972-2002 average.
 INDUSTRIAL PRODUCTION AND CAPACITY UTILIZATION:  SUMMARY
 Seasonally adjusted
 --------------------------------------------------------------------------------------------------------------------------------------
                                  |                    1997=100                     |                  Percent change
                                  | ----------------------------------------------- | -------------------------------------------------
                                  |       2002                                2003  |   2002                    2003  |    Jan. '02 to
 Industrial production            |       Oct.        Nov.        Dec.        Jan.  |   Oct.    Nov.    Dec.    Jan.  |      Jan. '03
 --------------------------------------------------------------------------------------------------------------------------------------
                                  |                                                 |                                 |
  Total index                     |      110.6       110.8       110.3       111.1  |    -.6      .2     -.4      .7  |            2.0
     Previous estimates           |      110.7       110.8       110.6              |    -.5      .1     -.2          |
                                  |                                                 |                                 |
  Major market groups             |                                                 |                                 |
  Final Products                  |      106.6       107.0       106.2       107.3  |    -.7      .4     -.7     1.0  |             .6
     Consumer goods               |      107.0       107.7       106.9       107.9  |    -.8      .6     -.8     1.0  |            1.7
     Business equipment           |      106.0       106.0       104.7       105.7  |    -.8      .0    -1.3     1.0  |           -2.9
  Nonindustrial supplies          |      115.4       114.9       114.7       115.4  |    -.4     -.4     -.1      .6  |            2.6
     Construction                 |      104.2       103.6       103.4       103.5  |    -.4     -.5     -.2      .1  |             .9
  Materials                       |      112.8       113.1       112.8       113.4  |    -.5      .3     -.3      .6  |            3.2
                                  |                                                 |                                 |
  Major industry groups           |                                                 |                                 |
  Manufacturing (see note below)  |      111.4       111.6       111.1       111.7  |    -.6      .1     -.4      .5  |            1.3
     Previous estimates           |      111.6       111.7       111.5              |    -.4      .1     -.2          |
  Mining                          |       92.3        93.6        94.6        93.5  |     .1     1.4     1.0    -1.2  |            -.9
  Utilities                       |      112.1       112.1       110.5       114.9  |   -1.1      .0    -1.4     4.0  |           10.8
 --------------------------------------------------------------------------------------------------------------------------------------
                                  |                                                                                   |    Capacity
                                  |                                Percent of capacity                                |     growth
                                  | --------------------------------------------------------------------------------- | ---------------
                                  |     Average        1982     1988-89       2002  |   2002                    2003  |    Jan. '02 to
 Capacity utilization             |  1972-2002          Low        High       Jan.  |   Oct.    Nov.    Dec.    Jan.  |      Jan. '03
 --------------------------------------------------------------------------------------------------------------------------------------
                                  |                                                 |                                 |
  Total industry                  |       81.3        70.8        85.1        75.0  |   75.5    75.6    75.2    75.7  |            1.1
     Previous estimates           |                                                 |   75.6    75.6    75.4          |
                                  |                                                 |                                 |
  Manufacturing (see note below)  |       80.2        68.6        85.5        73.3  |   73.7    73.7    73.4    73.7  |             .8
     Previous estimates           |                                                 |   73.8    73.8    73.6          |
  Mining                          |       86.9        78.6        85.6        85.5  |   83.9    85.0    85.8    84.8  |            -.1
  Utilities                       |       86.7        77.2        92.6        84.4  |   86.9    86.4    84.8    87.8  |            6.5
                                  |                                                 |                                 |
  Stage-of-process groups         |                                                 |                                 |
  Crude                           |       86.4        77.2        88.6        82.5  |   82.5    82.9    83.5    82.8  |            -.5
  Primary and semifinished        |       82.2        67.9        86.2        76.2  |   78.2    78.2    77.8    78.5  |            1.6
  Finished                        |       78.5        71.3        83.1        71.9  |   70.7    70.9    70.2    70.7  |             .9
 --------------------------------------------------------------------------------------------------------------------------------------
 r  Revised.  p  Preliminary.
        The statistics in this release cover output, capacity, and capacity utilization in the
 industrial sector, which the Federal Reserve defines as manufacturing, mining, and electric and
 gas utilities.  Manufacturing consists of those industries included in the North American Industry
 Classification System, or NAICS, manufacturing plus those industries-logging and newspaper, periodical,
 book and directory publishing-that have traditionally been considered manufacturing and included
 in the industrial sector.
Market Groups
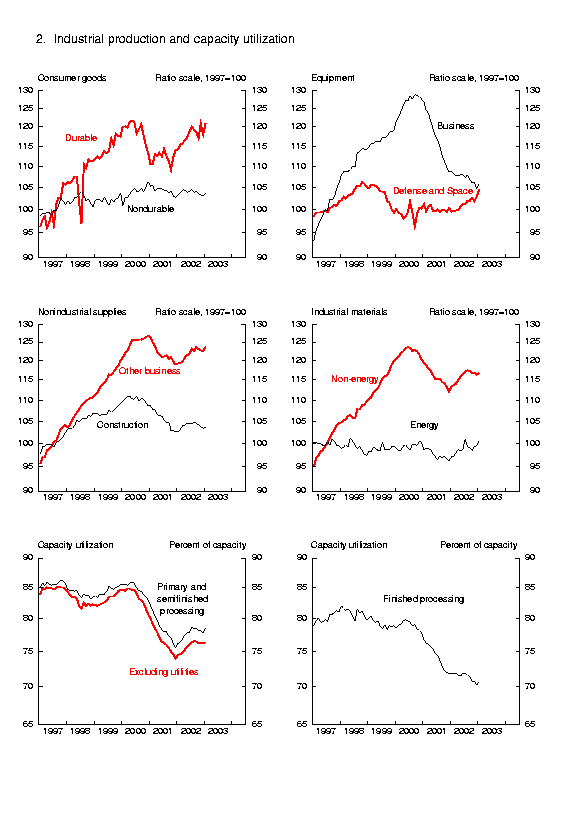
The output of consumer goods rose 1.0 percent in January. Within consumer durables, most of the gain resulted from the higher output of automotive products. The production of nondurables, which moved up 0.5 percent, was led by a sharp increase in residential electricity and gas usage associated with a return to more normal temperatures in January from an unseasonably warm December. However, the output of automotive gasoline dropped after two months of sizable gains, and the production of nondurable non-energy consumer goods, which include food, chemicals, and clothing, remained sluggish.
The output of business equipment picked up 1.0 percent in January, although the index for this category remained 2.9 percent below its level in January 2002. Gains in the production of business equipment were widespread. The output of transit equipment moved up, as higher assemblies of business autos and trucks more than offset continued declines in the production of commercial aircraft and related equipment. The output of information processing equipment expanded 1.2 percent in January; data that have been revised up now indicate that production in this group contracted at an annual rate of 0.7 percent in the fourth quarter. The production of industrial and other equipment rose 0.7 percent, a move that reversed most of the previous month's decline.
The output of construction supplies was little changed in December and January. The production of business supplies climbed 0.9 percent in January, an increase that largely reflected a jump in energy output for commercial use. The index for defense and space equipment rose 1.6 percent last month and was 4.9 percent above its level in January 2002.
The index of industrial materials moved up 0.6 percent in January, as a decline in the output of nondurable materials was more than offset by increases in durable materials and energy materials. The increase in durable materials mainly reflected gains in the production of parts for motor vehicles, while further declines in textiles and chemicals pulled down nondurable materials.
Industry Groups
Manufacturing output moved up 0.5 percent in January after a downward-revised decline of 0.4 percent in December. The overall factory operating rate edged up 0.3 percentage point, to 73.7 percent. The production of durable goods moved up 1.1 percent, and was led by gains in motor vehicles, machinery, and wood products; the only categories with significant declines were electrical equipment and miscellaneous manufactures. The production of nondurables ticked down 0.1 percent, its sixth consecutive monthly decline, with the most noticeable decreases occurring in the output of textiles and petroleum products. The production of other (non-NAICS) manufacturing industries (publishing and logging) ticked down 0.1 percent.
Output at mines fell 1.2 percent in January, and the utilization rate for mining dropped to 84.8 percent. In contrast, the output of utilities jumped 4.0 percent on gains in both electricity and natural gas. Capacity utilization for utilities, at 87.8 percent, was 1.1 percentage point above its 1972-2002 average.
By stage-of-processing groups, utilization fell 0.8 percentage point for industries in the crude category, increased 0.6 percentage point for operators at the primary and semifinished levels of processing, and rose 0.5 percentage point for processors of finished goods.
Note: The data in this release include preliminary estimates of industry capacity for 2003. Total industry capacity is projected to be increasing 1.6 percent, and manufacturing capacity is estimated to be rising 1.3 percent. Although the estimated increase in manufacturing capacity this year is a bit larger than the 0.9 percent gain in 2002, it represents the slowest two-year rate of change in the history of the series, which began in 1948. Capacity expansion at utilities in 2003, estimated to be 5.2 percent, is being boosted by another sizable increase in electricity generation capability.
G.17 Release Tables:
| Ascii | Screen reader | Summary: Industrial Production and Capacity Utilization | Chart | Chart 1: Industrial Production, Capacity, and Capacity Utilization | Chart | Chart 2: Industrial Production and Capacity Utilization | Chart | Chart 3: Industrial Production and Capacity Utilization, High Technology Industries |
| Ascii | Screen reader | Table 1:Industrial Production: Market and Industry Groups (percent change) |
| Ascii | Screen reader | Table 2:Industrial Production: Special Aggregates and Selected Detail (percent change) |
| Ascii | Screen reader | Table 3: Motor Vehicle Assemblies |
| Ascii | Screen reader | Table 4: Industrial Production Indexes: Market and Industry Group Summary |
| Ascii | Screen reader | Table 5: Industrial Production Indexes: Special Aggregates |
| Ascii | Screen reader | Table 6: Diffusion Indexes of Industrial Production |
| Ascii | Screen reader | Table 7: Capacity Utilization: Manufacturing, Mining, and Utilities |
| Ascii | Screen reader | Table 8: Industrial Capacity: Manufacturing, Mining, and Utilities (percent change) |
| Ascii | Screen reader | Table 9: Industrial Production: Gross Value of Products |
| Ascii | Screen reader | Table 10: Gross-Value-Weighted Industrial Production: Stage-of-Process Groups |
| Ascii | Screen reader | Table 11: Electric Power Use: Manufacturing and Mining |
| Ascii | Screen reader | Table 12: Historical Statistics for IP, Capacity, and Utilization: Total Industry |
| Ascii | Screen reader | Table 13: Historical Statistics for IP, Capacity, and Utilization: Manufacturing |
| Ascii | Screen reader | Table 14: Historical Statistics for IP, Capacity, and Utilization: Total Industry excluding Selected High-Technology Industries |
| Ascii | Screen reader | Table 15: Historical Statistics for IP, Capacity, and Utilization: Manufacturing excluding Selected High-Technology Industries |
Release dates | Historical data | Documentation
Current Monthly Release Other formats: ASCII | PDF (144 KB)
Supplemental Monthly Release Other formats: ASCII | PDF (144 KB)
Annual Revision Release Other formats: ASCII | PDF (150 KB)