
Release Date: October 16, 2003
Release dates | Historical data | Documentation
Current Monthly Release Other formats: ASCII | PDF (144 KB)
Supplemental Monthly Release Other formats: ASCII | PDF (144 KB)
Annual Revision Release Other formats: ASCII | PDF (150 KB)
INDUSTRIAL PRODUCTION AND CAPACITY UTILIZATION
[2003 Revision Notice Below]
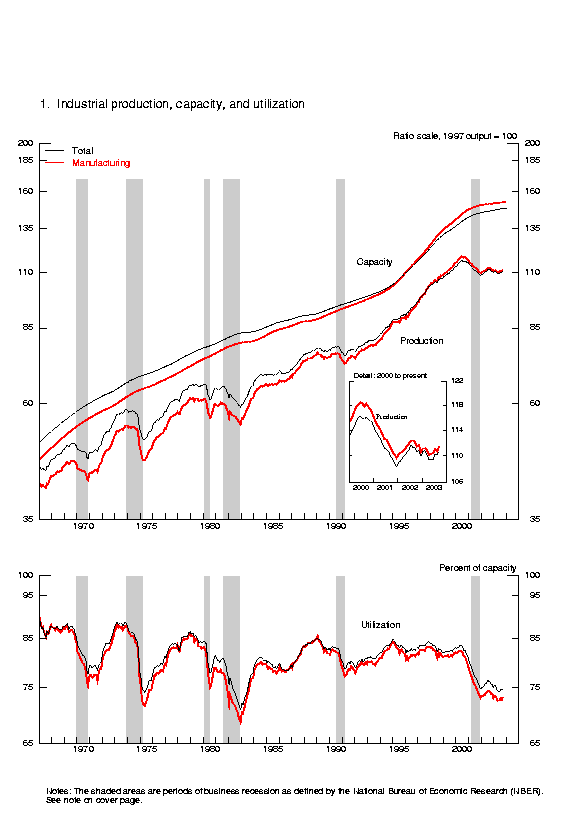
Industrial production rose 0.4 percent in September after having edged down 0.1 percent
in August. For the third quarter, total industrial production increased at an annual rate of 3.3
percent. Manufacturing output, led by an increase in motor vehicle production, climbed
0.7 percent in September and rose at an annual rate of 2.9 percent in the third quarter. The
output at utilities fell back 2.2 percent in September, and the output at mines was unchanged.
At 110.6 percent of its 1997 average, industrial production was 0.6 percent lower in
September than its year-earlier level. Capacity utilization for total industry increased to 74.7
percent but was still 1.3 percentage points below the rate in September 2002 and 6.6 percentage
points below its 1972-2002 average.
INDUSTRIAL PRODUCTION AND CAPACITY UTILIZATION: SUMMARY
Seasonally adjusted
| |
1997=100 |
Percent change |
| |
2003 |
|
|
|
2003 |
|
|
|
Sept. '02 to |
| Industrial production |
June |
July |
Aug. |
Sept. |
June |
July |
Aug. |
Sept. |
Sept. '03 |
| |
|
|
|
|
|
|
|
|
|
| Total index |
109.4 |
110.2 |
110.2 |
110.6 |
-.1 |
.8 |
-.1 |
.4 |
-.6 |
| Previous estimates |
109.3 |
110.1 |
110.2 |
|
-.1 |
.7 |
.1 |
|
|
| |
|
|
|
|
|
|
|
|
|
| Major market groups |
|
|
|
|
|
|
|
|
|
| Final Products |
106.3 |
106.9 |
106.8 |
107.4 |
.0 |
.6 |
-.1 |
.5 |
-.1 |
| Consumer goods |
106.5 |
107.2 |
106.8 |
107.4 |
-.2 |
.7 |
-.4 |
.6 |
-.5 |
| Business equipment |
105.5 |
105.8 |
106.5 |
107.0 |
.4 |
.3 |
.7 |
.4 |
.1 |
| Nonindustrial supplies |
112.9 |
113.6 |
113.8 |
113.7 |
-.4 |
.6 |
.2 |
-.1 |
-1.8 |
| Construction |
101.1 |
101.2 |
101.4 |
101.3 |
-.4 |
.1 |
.2 |
-.2 |
-3.1 |
| Materials |
111.1 |
112.3 |
112.2 |
112.7 |
.0 |
1.1 |
-.1 |
.4 |
-.6 |
| |
|
|
|
|
|
|
|
|
|
| Major industry groups |
|
|
|
|
|
|
|
|
|
| Manufacturing (see note below) |
110.4 |
111.0 |
110.6 |
111.4 |
.1 |
.5 |
-.3 |
.7 |
-.6 |
| Previous estimates |
110.4 |
110.9 |
110.7 |
|
.2 |
.4 |
-.1 |
|
|
| Mining |
93.5 |
93.5 |
93.9 |
93.9 |
.9 |
.0 |
.4 |
.0 |
1.8 |
| Utilities |
107.9 |
111.8 |
113.8 |
111.2 |
-2.8 |
3.5 |
1.8 |
-2.2 |
-1.9 |
| |
|
Capacity |
| |
Percent of capacity |
growth |
| |
Average |
1982 |
1988-89 |
2002 |
2003 |
|
|
|
Sept. '02 to |
| Capacity utilization |
1972-2002 |
Low |
High |
Sept. |
June |
July |
Aug. |
Sept. |
Sept. '03 |
| |
|
|
|
|
|
|
|
|
|
| Total industry |
81.3 |
70.8 |
85.1 |
76.0 |
74.1 |
74.6 |
74.5 |
74.7 |
1.1 |
| Previous estimates |
|
|
|
|
74.1 |
74.6 |
74.6 |
|
|
| |
|
|
|
|
|
|
|
|
|
| Manufacturing (see note below) |
80.2 |
68.6 |
85.6 |
74.1 |
72.6 |
72.9 |
72.7 |
73.1 |
.8 |
| Previous estimates |
|
|
|
|
72.6 |
72.9 |
72.7 |
|
|
| Mining |
86.9 |
78.6 |
85.6 |
83.8 |
84.7 |
84.7 |
85.0 |
84.9 |
.4 |
| Utilities |
86.7 |
77.2 |
92.6 |
88.4 |
80.8 |
83.4 |
84.5 |
82.4 |
5.3 |
| |
|
|
|
|
|
|
|
|
|
| Stage-of-process groups |
|
|
|
|
|
|
|
|
|
| Crude |
86.4 |
77.2 |
88.6 |
83.1 |
82.4 |
82.9 |
82.6 |
82.6 |
-.1 |
| Primary and semifinished |
82.2 |
67.9 |
86.2 |
78.6 |
75.8 |
76.5 |
76.6 |
76.6 |
1.5 |
| Finished |
78.5 |
71.3 |
83.1 |
71.3 |
70.4 |
70.6 |
70.3 |
70.9 |
.8 |
r Revised. p Preliminary.
Note: The statistics in this release cover output, capacity, and capacity utilization in the
industrial sector, which the Federal Reserve defines as manufacturing, mining, and electric and
gas utilities. Manufacturing comprises those industries included in the North American Industry
Classification System, or NAICS, manufacturing plus the logging and newspaper, periodical,
book and directory publishing industries that have traditionally been considered manufacturing and included
in the industrial sector.
Market Groups
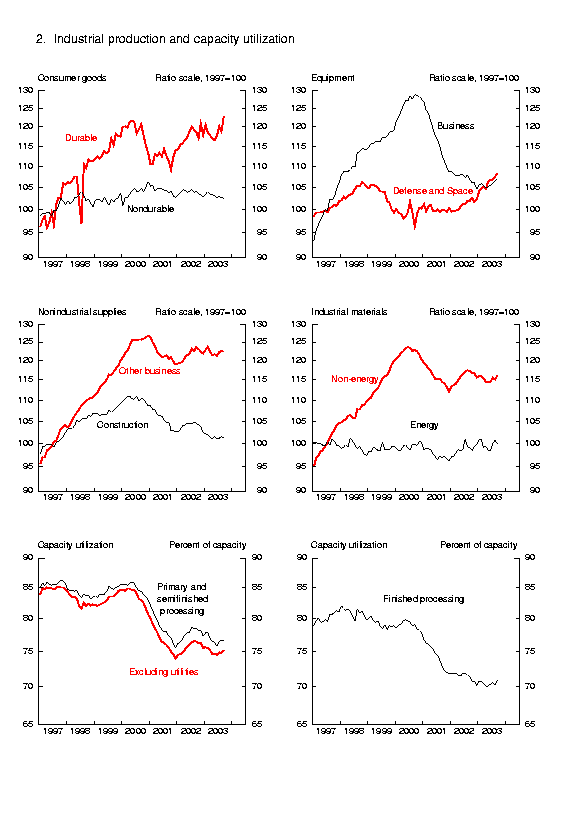
The output of consumer goods rose 0.6 percent in September and increased at an annual
rate of 1.9 percent in the third quarter. The gain in September was attributable primarily to a rise
of 6.3 percent in the index for automotive products, which had declined 2.0 percent in August.
All other categories of consumer durables posted declines. The output of non-energy
nondurables edged up 0.1 percent and was 2.1 percent below its level in September 2002. The
output of consumer energy products fell 2.1 percent, a decline that reversed a similarly sized
increase in August.
The index for business equipment moved up 0.4 percent in September, its fifth
consecutive monthly gain. In the third quarter, output in this category rose at an annual rate of
5.2 percent. Increases last month in the production of transit equipment, particularly motor
vehicles, and of information processing equipment more than offset a small decline in the output
of industrial and other equipment. Despite September's decline in the production of industrial
and other equipment, output for the category rose at an annual rate of 3.4 percent in the third
quarter.
The production of defense and space equipment rose 0.7 percent in September and was
6.2 percent higher than the level of a year earlier. The output of construction supplies decreased
0.2 percent, and the output of business supplies edged down 0.1 percent. The production of
materials rose 0.4 percent; increases in the indexes for durable and nondurable materials more
than offset a 0.8 percent drop in the index for energy materials.
Industry Groups
The 0.7 percent rise in manufacturing output in September reflected increases of
1.3 percent in the production of durables and 0.1 percent in nondurables. The factory operating
rate moved up 0.4 percentage point in September, to 73.1 percent, but remained 1 percentage
point below its year-earlier level. The output of durables rose at an annual rate of 7.7 percent in
the third quarter, but the output of nondurables declined 1.3 percent. Among durables, a 6.6
percent rise in the output of motor vehicles and parts in September more than reversed the
production decline in August. The continued weakness in steel production contributed to a
September decline of 0.3 percent in the index for primary metal products, which rose at an
annual rate of only 1.9 percent in the third quarter. The output for computers and electronic
products posted a 1.4 percent gain last month and was 10.9 percent above its year-earlier level.
Increases in the output indexes for chemicals and paper contributed to the net gain for the
nondurables category as a whole.
Despite the drop in the output at utilities in September, this index posted a net gain in the
third quarter of 7.1 percent at an annual rate. The operating rate at utilities fell 2.1 percentage
points in September, to 82.4 percent; the utilization rate at mines slipped to 84.9 percent.
By stage-of-process category, capacity utilization rates for industries in the crude stage
and in the primary and semifinished stage were unchanged in September. Utilization for
industries in the finished goods stage rose 0.6 percentage point, to 70.9 percent.
Revision of Industrial Production and Capacity Utilization
On the afternoon of November 10, 2003, the Federal Reserve Board will issue a revision
to the index of industrial production (IP), the related measures of capacity and capacity
utilization, and the data on industrial use of electric power. The updated measures will reflect
the incorporation of newly available, more comprehensive source data typical of annual
revisions. The updating of source data for IP in the 2003 annual revision will include annual
data from the Census Bureau's 2001 Annual Survey of Manufactures and from selected editions
of its 2001 and 2002 Current Industrial Reports. Annual data from the U.S. Geological Survey
regarding metallic and nonmetallic minerals (except fuels) for 2001 and 2002 will also be
introduced. The updating will include revisions to the monthly indicator for each industry
(either physical product data, production-worker hours, or electric power usage) and revisions to
seasonal factors.
Capacity and capacity utilization will be revised to incorporate preliminary data from the
2002 Survey of Plant Capacity of the Bureau of the Census, which covers manufacturing, along
with other new data on capacity from the U.S. Geological Survey, the Department of Energy,
and other organizations. The statistics on the industrial use of electric power will incorporate
additional information received from utilities for the past few years and will include some data
from the 2001 Annual Survey of Manufactures.
Once the revision is published, it will be made available on the Board's web site,
www.federalreserve.gov/releases/G17. The revised data will also be available through the web
site of the Department of Commerce. Further information on these revisions is available from
the Board's Industrial Output Section (telephone 202-452-3197).
G.17 Release Tables:
| Ascii |
Screen reader |
Summary: Industrial Production and Capacity Utilization |
Chart |
| Chart 1: Industrial Production, Capacity, and Capacity Utilization | Chart | | Chart 2: Industrial Production and Capacity Utilization | Chart | | Chart 3: Industrial Production and Capacity Utilization, High Technology Industries | | Ascii | Screen reader | Table 1:Industrial Production: Market and Industry Groups (percent change) | | Ascii | Screen reader | Table 2:Industrial Production: Special Aggregates and Selected Detail (percent change) | | Ascii | Screen reader | Table 3: Motor Vehicle Assemblies | | Ascii | Screen reader | Table 4: Industrial Production Indexes: Market and Industry Group Summary | | Ascii | Screen reader | Table 5: Industrial Production Indexes: Special Aggregates | | Ascii | Screen reader | Table 6: Diffusion Indexes of Industrial Production | | Ascii | Screen reader | Table 7: Capacity Utilization: Manufacturing, Mining, and Utilities | | Ascii | Screen reader | Table 8: Industrial Capacity: Manufacturing, Mining, and Utilities (percent change) | | Ascii | Screen reader | Table 9: Industrial Production: Gross Value of Products | | Ascii | Screen reader | Table 10: Gross-Value-Weighted Industrial Production: Stage-of-Process Groups | | Ascii | Screen reader | Table 11: Electric Power Use: Manufacturing and Mining | | Ascii | Screen reader | Table 12: Historical Statistics for IP, Capacity, and Utilization: Total Industry | | Ascii | Screen reader | Table 13: Historical Statistics for IP, Capacity, and Utilization: Manufacturing | | Ascii | Screen reader | Table 14: Historical Statistics for IP, Capacity, and Utilization: Total Industry excluding Selected High-Technology Industries | | Ascii | Screen reader | Table 15: Historical Statistics for IP, Capacity, and Utilization: Manufacturing excluding Selected High-Technology Industries |
Release dates | Historical data | Documentation
Current Monthly Release Other formats: ASCII | PDF (144 KB)
Supplemental Monthly Release Other formats: ASCII | PDF (144 KB)
Annual Revision Release Other formats: ASCII | PDF (150 KB) Statistical releases
|