
INDUSTRIAL PRODUCTION AND CAPACITY UTILIZATION
[2006 Revision Notice Below]
Industrial production increased 0.4 percent in July after a gain of 0.8 percent in June. Manufacturing output increased 0.1 percent in July; excluding motor vehicles and parts, manufacturing production rose 0.7 percent. With temperatures well above normal during July, the output of utilities rose 2.0 percent. Production at mines climbed 0.8 percent.
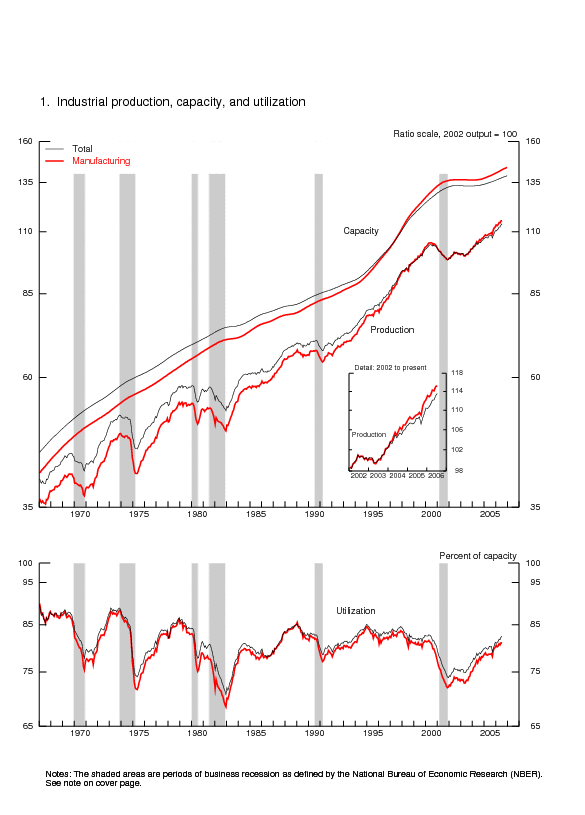
Capacity utilization for total industry rose to 82.4 percent in July; the utilization rate was 2.2
percentage points above its level in July 2005 and 1.4 percentage points above its 1972-2005 average.
| Industrial production |
2002=100 | Percent change | |||||||
|---|---|---|---|---|---|---|---|---|---|
| 2006 | 2006 | July '05 to July '06 |
|||||||
| Apr. | May | June | July | Apr. | May | June | July | ||
| Total index | 112.1 | 112.2 | 113.1 | 113.5 | .8 | .0 | .8 | .4 | 4.9 |
| Previous estimates | 112.2 | 112.3 | 113.2 | .8 | .1 | .8 | |||
| Major market groups | |||||||||
| Final Products | 113.7 | 113.5 | 114.7 | 114.7 | .6 | -.2 | 1.1 | .1 | 4.6 |
| Consumer goods | 106.5 | 106.2 | 107.4 | 107.1 | -.1 | -.3 | 1.1 | -.3 | 1.7 |
| Business equipment | 132.5 | 132.1 | 133.2 | 134.7 | 2.4 | -.3 | .8 | 1.1 | 12.2 |
| Nonindustrial supplies | 111.4 | 111.4 | 112.0 | 112.7 | .4 | .0 | .5 | .6 | 4.9 |
| Construction | 114.0 | 113.2 | 113.4 | 114.0 | .3 | -.6 | .1 | .5 | 6.0 |
| Materials | 110.7 | 111.1 | 111.9 | 112.6 | 1.1 | .3 | .7 | .6 | 5.0 |
| Major industry groups | |||||||||
| Manufacturing (see note below) | 114.3 | 114.1 | 115.1 | 115.2 | .9 | -.1 | .8 | .1 | 5.6 |
| Previous estimates | 114.2 | 114.3 | 115.2 | .8 | .1 | .7 | |||
| Mining | 100.0 | 100.3 | 101.4 | 102.1 | 1.7 | .3 | 1.1 | .8 | 2.4 |
| Utilities | 104.2 | 105.6 | 106.5 | 108.6 | -1.3 | 1.3 | .9 | 2.0 | .5 |
| Capacity utilization |
Percent of capacity |
Capacity growth July '05 to July '06 |
|||||||
|---|---|---|---|---|---|---|---|---|---|
| Average 1972-2005 |
1994-95 High |
2001-02 Low |
2005 July |
2006 | |||||
| Apr. | May | June | July | ||||||
| Total industry | 81.0 | 85.0 | 73.9 | 80.2 | 81.8 | 81.7 | 82.3 | 82.4 | 1.9 |
| Previous estimates | 81.9 | 81.8 | 82.4 | ||||||
| Manufacturing (see note below) | 79.8 | 84.5 | 72.0 | 78.6 | 80.9 | 80.6 | 81.1 | 81.0 | 2.5 |
| Previous estimates | 80.8 | 80.7 | 81.1 | ||||||
| Mining | 87.3 | 89.0 | 85.6 | 89.1 | 89.7 | 90.2 | 91.2 | 92.1 | -.9 |
| Utilities | 86.7 | 93.7 | 83.7 | 88.0 | 84.8 | 85.8 | 86.5 | 88.2 | .2 |
| Stage-of-process groups | |||||||||
| Crude | 86.4 | 89.4 | 83.2 | 87.5 | 87.7 | 88.1 | 88.9 | 89.4 | -.9 |
| Primary and semifinished | 82.1 | 88.1 | 74.6 | 81.6 | 82.5 | 82.7 | 83.3 | 83.7 | 2.4 |
| Finished | 77.9 | 80.5 | 70.8 | 76.8 | 79.9 | 79.3 | 79.8 | 79.5 | 2.2 |
Market Groups
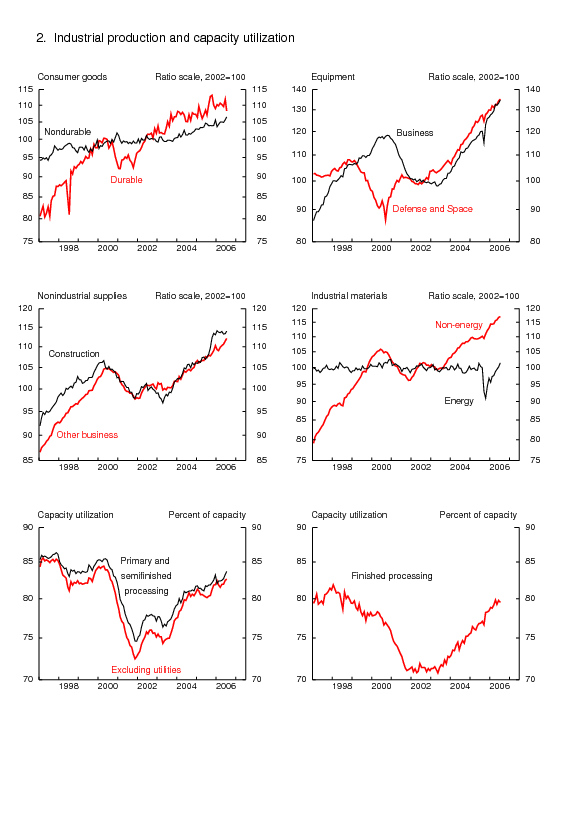
The output of consumer goods decreased 0.3 percent in July, as a decline in the output of consumer durable goods more than offset an increase in the production of nondurable consumer goods. Within consumer durable goods, a drop of 6.2 percent in the output of automotive products was due mostly to a decrease in the production of autos and light trucks. Assemblies of light vehicles dropped from an annual rate of 11.2 million units in June to 10.2 million units in July. The index for appliances, furniture, and carpeting decreased 0.7 percent, whereas the indexes for both home electronics and miscellaneous goods registered gains. The production of consumer nondurable goods rose 0.8 percent for a second consecutive month. In July, the index for non-energy nondurable consumer goods increased 0.6 percent, and gains in the sector were widespread. The production of consumer energy products advanced 1.6 percent but was down 0.6 percent from its year-ago level.
The production of business equipment moved up 1.1 percent in July and was up 12.2 percent from its year-ago level. Increases in the production of information processing equipment and of industrial and other equipment more than offset a drop in the output of transit equipment. The production of defense and space equipment moved up 0.7 percent. The output of construction supplies rose 0.5 percent in July and was up 6 percent from its year-ago level. The index for business supplies advanced 0.6 percent, its fifth consecutive monthly gain.
The output of materials gained 0.6 percent in July. The index for energy materials rose 1.2 percent, while the index for non-energy materials was up 0.3 percent. Continued increases in the output of equipment parts boosted the index for durable goods materials, which rose 0.4 percent. Within nondurable materials, the production of textiles edged up, and the output of paper materials and of chemical materials declined.
Industry Groups
Manufacturing production increased 0.1 percent in July. The output of nondurable manufacturers was up 0.3 percent, while the production of durable manufacturers was unchanged. Excluding motor vehicles and parts, the output of durable goods advanced 1.0 percent. Capacity utilization in manufacturing edged down to 81.0 percent, a rate 2.4 percentage points above its year-ago level and 1.2 percentage points above its 1972-2005 average.
Within durable goods manufacturing, the production of motor vehicles and parts dropped 5.4 percent. The decline more than reversed its June increase. The index for furniture and related products also registered a decline, but production for all other major categories of durables remained unchanged or increased. The index for computer and electronic products increased 0.8 percent and stood 18.6 percent above its year-ago level. The production of wood products turned up 1.1 percent after having decreased for seven consecutive months. The index for miscellaneous manufacturing moved up 1.6 percent.
Among the major categories of nondurable manufacturing, the indexes for paper and for printing and support declined, and the indexes for chemicals and for petroleum and coal products did not change. The production of food, beverage, and tobacco products; textile and product mills; apparel and leather; and plastics and rubber products all registered gains. The output of non-NAICS manufacturing industries (publishing and logging) increased 0.5 percent.
The output of utilities jumped 2.0 percent in July, and capacity utilization for this category rose to 88.2 percent. Mining output increased 0.8 percent, its fourth consecutive monthly gain. Capacity utilization in mining moved up to 92.1 percent, its highest rate in five years.
By stage of process, capacity utilization for industries in the crude stage increased 0.5
percentage point, to 89.4 percent. For industries in the primary and semifinished stages, the operating
rate rose 0.4 percentage point, to 83.7 percent; for industries in the finished stage, the utilization rate
decreased 0.3 percentage point, to 79.5 percent.
Notice
| Ascii | Screen reader | Summary: Industrial Production and Capacity Utilization | Chart | Chart 1: Industrial Production, Capacity, and Capacity Utilization | Chart | Chart 2: Industrial Production and Capacity Utilization | Chart | Chart 3: Industrial Production and Capacity Utilization, High Technology Industries |
| Ascii | Screen reader | Table 1: Industrial Production: Market and Industry Groups (percent change) |
| Ascii | Screen reader | Table 2: Industrial Production: Special Aggregates and Selected Detail (percent change) |
| Ascii | Screen reader | Table 3: Motor Vehicle Assemblies |
| Ascii | Screen reader | Table 4: Industrial Production Indexes: Market and Industry Group Summary |
| Ascii | Screen reader | Table 5: Industrial Production Indexes: Special Aggregates |
| Ascii | Screen reader | Table 6: Diffusion Indexes of Industrial Production |
| Ascii | Screen reader | Table 7: Capacity Utilization: Manufacturing, Mining, and Utilities |
| Ascii | Screen reader | Table 8: Industrial Capacity: Manufacturing, Mining, and Utilities (percent change) |
| Ascii | Screen reader | Table 9: Industrial Production: Gross Value of Products and Nonindustrial Supplies |
| Ascii | Screen reader | Table 10: Gross-Value-Weighted Industrial Production: Stage-of-Process Groups |
| Ascii | Screen reader | Table 11: Historical Statistics for IP, Capacity, and Utilization: Total Industry |
| Ascii | Screen reader | Table 12: Historical Statistics for IP, Capacity, and Utilization: Manufacturing |
| Ascii | Screen reader | Table 13: Historical Statistics for IP, Capacity, and Utilization: Total Industry excluding Selected High-Technology Industries |
| Ascii | Screen reader | Table 14: Historical Statistics for IP, Capacity, and Utilization: Manufacturing excluding Selected High-Technology Industries |
Release dates | Historical data | Data Download |Documentation
Current Monthly Release Other formats: ASCII | PDF (144 KB)
Supplemental Monthly Release Other formats: ASCII | PDF (144 KB)
Annual Revision Release Other formats: ASCII | PDF (150 KB)