
INDUSTRIAL PRODUCTION AND CAPACITY UTILIZATION
[2006 Revision Notice Below]
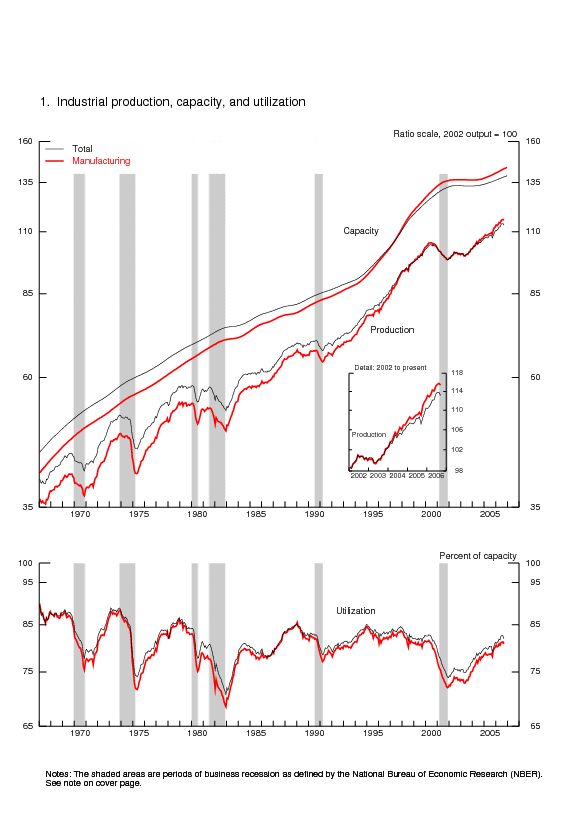
Industrial production decreased 0.6 percent in September after having been unchanged in August. For the third quarter as a whole, industrial production rose at an annual rate of 3.6 percent, down from the rapid pace of gains in the previous three quarters. Nonetheless, production at the end of the quarter was about 5-1/2 percent above its year-earlier level. Output in the manufacturing sector declined 0.3 percent in September, a decrease that slightly more than reversed its upwardly revised gain of 0.2 percent in August. The output of utilities plunged 4.4 percent in September, while the output at mines expanded 0.7 percent.
Capacity utilization for total industry declined 0.6 percentage point, to 81.9 percent. Even so,
this rate of capacity utilization was higher than the rates recorded from mid-2000 to early 2006.
| Industrial production |
2002=100 | Percent change | |||||||
|---|---|---|---|---|---|---|---|---|---|
| 2006 | 2006 | Sept. '05 to Sept. '06 |
|||||||
| June | July | Aug. | Sept. | June | July | Aug. | Sept. | ||
| Total index | 113.4 | 113.8 | 113.8 | 113.1 | 1.1 | .3 | .0 | -.6 | 5.6 |
| Previous estimates | 113.4 | 113.9 | 113.7 | 1.1 | .4 | -.1 | |||
| Major market groups | |||||||||
| Final Products | 115.1 | 115.3 | 115.7 | 114.9 | 1.4 | .2 | .3 | -.7 | 5.1 |
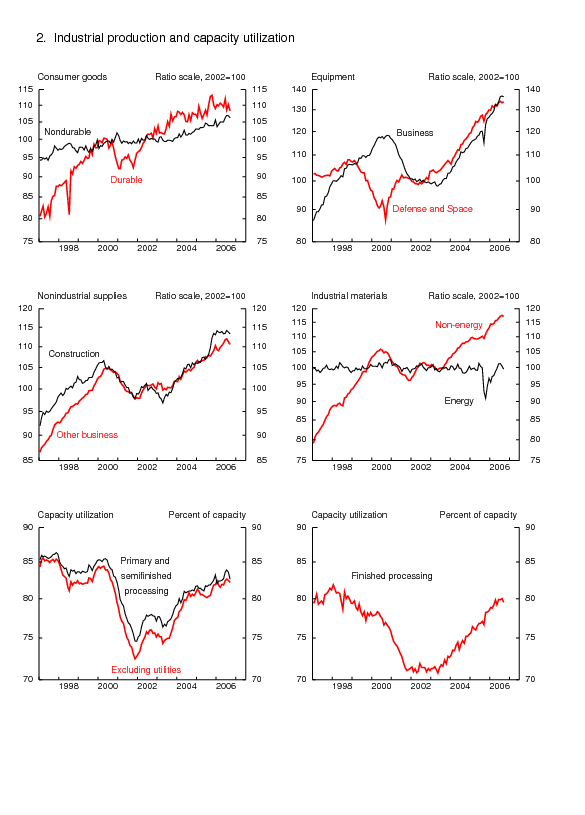
| Consumer goods | 107.9 | 107.5 | 107.9 | 106.9 | 1.5 | -.4 | .3 | -.9 | .4 |
| Business equipment | 133.7 | 136.4 | 136.7 | 136.4 | 1.3 | 2.0 | .2 | -.2 | 18.5 |
| Nonindustrial supplies | 112.3 | 112.7 | 112.0 | 111.4 | .6 | .3 | -.5 | -.6 | 2.8 |
| Construction | 113.4 | 114.1 | 113.8 | 113.3 | .1 | .6 | -.3 | -.4 | 3.2 |
| Materials | 112.1 | 112.5 | 112.5 | 111.9 | .9 | .4 | .0 | -.5 | 7.1 |
| Major industry groups | |||||||||
| Manufacturing (see note below) | 115.1 | 115.5 | 115.8 | 115.4 | .9 | .4 | .2 | -.3 | 5.9 |
| Previous estimates | 115.1 | 115.5 | 115.5 | .9 | .4 | .0 | |||
| Mining | 101.3 | 101.1 | 100.6 | 101.3 | .9 | -.2 | -.5 | .7 | 12.2 |
| Utilities | 109.2 | 109.9 | 108.9 | 104.1 | 2.9 | .6 | -.9 | -4.4 | -3.6 |
| Capacity utilization |
Percent of capacity |
Capacity growth Sept. '05 to Sept. '06 |
|||||||
|---|---|---|---|---|---|---|---|---|---|
| Average 1972-2005 |
1994-95 High |
2001-02 Low |
2005 Sept. |
2006 | |||||
| June | July | Aug. | Sept. | ||||||
| Total industry | 81.0 | 85.0 | 73.9 | 79.1 | 82.5 | 82.6 | 82.5 | 81.9 | 2.0 |
| Previous estimates | 82.5 | 82.7 | 82.4 | ||||||
| Manufacturing (see note below) | 79.8 | 84.5 | 72.0 | 78.2 | 81.1 | 81.2 | 81.2 | 80.8 | 2.5 |
| Previous estimates | 81.1 | 81.2 | 81.0 | ||||||
| Mining | 87.3 | 89.0 | 85.6 | 80.7 | 91.2 | 91.2 | 90.9 | 91.6 | -1.2 |
| Utilities | 86.7 | 93.7 | 83.7 | 88.0 | 88.7 | 89.2 | 88.3 | 84.4 | .5 |
| Stage-of-process groups | |||||||||
| Crude | 86.4 | 89.4 | 83.2 | 78.2 | 88.8 | 88.9 | 88.8 | 89.0 | -1.0 |
| Primary and semifinished | 82.1 | 88.1 | 74.6 | 81.9 | 83.6 | 83.9 | 83.6 | 82.6 | 2.2 |
| Finished | 77.9 | 80.5 | 70.8 | 76.6 | 79.9 | 79.9 | 80.0 | 79.6 | 2.5 |
Market Groups
Production in all major market groups declined between August and September. The output of consumer goods fell 0.9 percent; the decrease was led by a weather-related pullback in the output of consumer energy products and by a drop of 1.8 percent in the output of consumer durables. Among durable consumer goods, the production indexes for automotive products and for appliances, furniture, and carpeting both fell about 2-1/2 percent. The production of miscellaneous durable goods edged down, while the output of home electronics rose 1.0 percent. The output of non-energy nondurable consumer goods posted a small gain, as a step-up in the production of foods and tobacco slightly more than offset lower output of chemical products and a second month of declines in the output of clothing and of paper products.
The output of business equipment slipped 0.2 percent in September. The production of industrial and other equipment fell 1.2 percent, which more than offset increases in the output of transit equipment and of information processing equipment. For the third quarter as a whole, business equipment rose 11.7 percent (annual rate), the fourth consecutive quarterly gain in excess of 10 percent. The output of defense and space equipment moved higher in September, but the increase for the quarter--a gain of 3.9 percent (annual rate)--marked a third quarter of decelerating production.
The output of construction supplies declined for a second month, to a level about the same as that of four months earlier. The production of business supplies also moved lower for a second month. Materials output turned down in September after having been unchanged in August; outside of equipment parts, which continued to climb steeply, all major categories of materials declined.
Industry Groups
The declines in manufacturing production during September were broadly based. Durable manufacturing production decreased 0.4 percent. Industries for which output fell 1 percent or more included wood products, nonmetallic mineral products, machinery, motor vehicles and parts, furniture and related products, and electrical equipment, appliances, and components. Primary metals declined 0.5 percent, and fabricated metal products edged down 0.1 percent. In contrast, the output of computer and electronic products increased 1.1 percent, and the output indexes for aerospace and miscellaneous transportation equipment and for miscellaneous manufacturing both posted gains of 0.5 percent. Nondurable manufacturing edged down 0.2 percent, as the output of chemicals, plastics and rubber products, textile and product mills, and apparel and leather all decreased significantly. However, the output of petroleum and coal products turned up sharply, and the production of food, beverage, and tobacco products advanced.
Mining output also turned up in September and increased 1.8 percent (annual rate) for the third quarter as a whole. The increase in September reflected a higher rate of crude oil extraction as well as a pickup in mined construction supplies, such as stone, sand, and gravel.
In September, the manufacturing utilization rate declined 0.4 percentage point, to 80.8 percent, a rate
that is 1 percentage point above its 1972-2005 average. By stage of process, the operating rate for
industries at the crude stage climbed 0.2 percentage point, to 89.0 percent. In contrast, the operating
rate for industries at the primary and semifinished stages fell 1 percentage point, to 82.6 percent, just
0.5 percentage point above the long-run average for this group. The operating rate for industries at the
finished stage moved down 0.4 percentage point, to 79.6 percent.
Notice
| Ascii | Screen reader | Summary: Industrial Production and Capacity Utilization | Chart | Chart 1: Industrial Production, Capacity, and Capacity Utilization | Chart | Chart 2: Industrial Production and Capacity Utilization | Chart | Chart 3: Industrial Production and Capacity Utilization, High Technology Industries |
| Ascii | Screen reader | Table 1: Industrial Production: Market and Industry Groups (percent change) |
| Ascii | Screen reader | Table 2: Industrial Production: Special Aggregates and Selected Detail (percent change) |
| Ascii | Screen reader | Table 3: Motor Vehicle Assemblies |
| Ascii | Screen reader | Table 4: Industrial Production Indexes: Market and Industry Group Summary |
| Ascii | Screen reader | Table 5: Industrial Production Indexes: Special Aggregates |
| Ascii | Screen reader | Table 6: Diffusion Indexes of Industrial Production |
| Ascii | Screen reader | Table 7: Capacity Utilization: Manufacturing, Mining, and Utilities |
| Ascii | Screen reader | Table 8: Industrial Capacity: Manufacturing, Mining, and Utilities (percent change) |
| Ascii | Screen reader | Table 9: Industrial Production: Gross Value of Products and Nonindustrial Supplies |
| Ascii | Screen reader | Table 10: Gross-Value-Weighted Industrial Production: Stage-of-Process Groups |
| Ascii | Screen reader | Table 11: Historical Statistics for IP, Capacity, and Utilization: Total Industry |
| Ascii | Screen reader | Table 12: Historical Statistics for IP, Capacity, and Utilization: Manufacturing |
| Ascii | Screen reader | Table 13: Historical Statistics for IP, Capacity, and Utilization: Total Industry excluding Selected High-Technology Industries |
| Ascii | Screen reader | Table 14: Historical Statistics for IP, Capacity, and Utilization: Manufacturing excluding Selected High-Technology Industries |
Release dates | Historical data | Data Download |Documentation
Current Monthly Release Other formats: ASCII | PDF (144 KB)
Supplemental Monthly Release Other formats: ASCII | PDF (144 KB)
Annual Revision Release Other formats: ASCII | PDF (150 KB)