
INDUSTRIAL PRODUCTION AND CAPACITY UTILIZATION
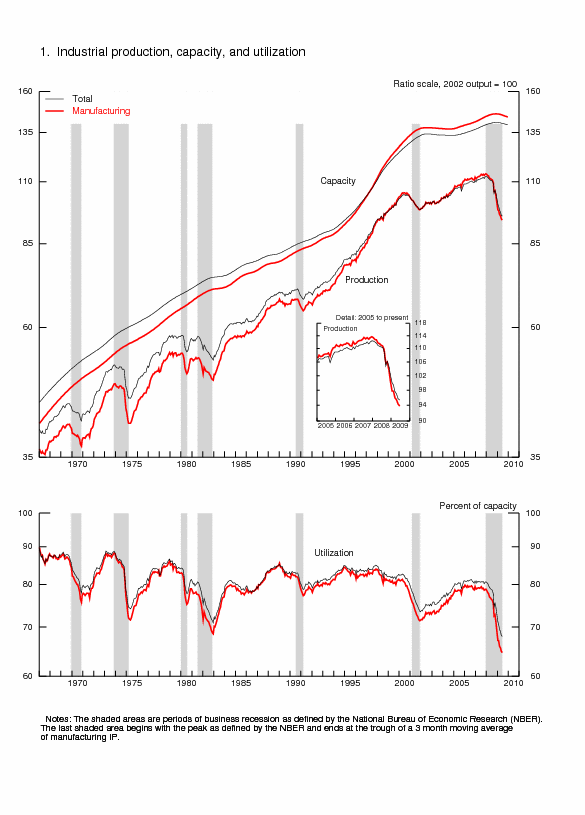
Industrial production decreased 0.4 percent in June after having fallen 1.2 percent in May. For the
second quarter as a whole, output fell at an annual rate of 11.6 percent, a more moderate contraction than
in the first quarter, when output fell 19.1 percent. Manufacturing output moved down 0.6 percent in June,
with declines at both durable and nondurable goods producers. Outside of manufacturing, the output of
mines fell 0.5 percent in June, and the output of utilities increased 0.8 percent. The rate of capacity
utilization for total industry declined in June to 68.0 percent, a level 12.9 percentage points below its
average for 1972-2008. Prior to the current recession, the low over the history of this series, which
begins in 1967, was 70.9 percent in December 1982.
| Industrial production |
2002=100 | Percent change | |||||||||||
|---|---|---|---|---|---|---|---|---|---|---|---|---|---|
| 2009 | 2009 | June '08 to June '09 |
|||||||||||
| Jan.[r] | Feb.[r] | Mar.[r] | Apr.[r] | May[r] | June[p] | Jan.[r] | Feb.[r] | Mar.[r] | Apr.[r] | May[r] | June[p] | ||
| Total index | 100.1 | 99.4 | 97.7 | 96.9 | 95.8 | 95.4 | -2.2 | -.8 | -1.7 | -.7 | -1.2 | -.4 | -13.6 |
| Previous estimates | 100.2 | 99.4 | 97.6 | 96.9 | 95.8 | -2.1 | -.8 | -1.8 | -.7 | -1.1 | |||
| Major market groups | |||||||||||||
| Final Products | 103.4 | 102.8 | 101.6 | 100.6 | 99.4 | 99.0 | -2.6 | -.6 | -1.2 | -.9 | -1.2 | -.4 | -10.7 |
| Consumer goods | 98.6 | 98.7 | 98.3 | 97.8 | 96.8 | 96.5 | -2.0 | .1 | -.4 | -.5 | -1.1 | -.3 | -7.9 |
| Business equipment | 115.7 | 113.8 | 110.4 | 108.3 | 106.2 | 105.4 | -4.2 | -1.7 | -3.0 | -1.9 | -1.9 | -.8 | -17.8 |
| Nonindustrial supplies | 94.7 | 93.2 | 91.3 | 90.5 | 89.7 | 89.7 | -1.9 | -1.5 | -2.0 | -.9 | -.9 | .0 | -15.1 |
| Construction | 85.8 | 84.7 | 82.4 | 81.1 | 80.8 | 80.7 | -3.7 | -1.4 | -2.7 | -1.5 | -.4 | -.2 | -20.7 |
| Materials | 99.0 | 98.4 | 96.3 | 95.9 | 94.6 | 94.0 | -1.9 | -.6 | -2.1 | -.5 | -1.3 | -.6 | -15.8 |
| Major industry groups | |||||||||||||
| Manufacturing (see note below) | 97.8 | 97.7 | 96.0 | 95.4 | 94.3 | 93.8 | -2.8 | -.1 | -1.8 | -.6 | -1.1 | -.6 | -15.5 |
| Previous estimates | 97.9 | 97.8 | 96.0 | 95.4 | 94.4 | -2.7 | -.1 | -1.9 | -.6 | -1.0 | |||
| Mining | 102.8 | 101.1 | 98.4 | 96.3 | 94.4 | 94.0 | -.6 | -1.6 | -2.7 | -2.1 | -1.9 | -.5 | -10.4 |
| Utilities | 111.5 | 106.4 | 106.1 | 105.8 | 104.4 | 105.1 | .2 | -4.5 | -.3 | -.3 | -1.3 | .8 | -3.9 |
| Capacity utilization |
Percent of capacity |
Capacity growth |
|||||||||||
|---|---|---|---|---|---|---|---|---|---|---|---|---|---|
| Average 1972- 2008 |
1988- 89 high |
1990- 91 low |
1994- 95 high |
2001- 02 low |
2008 June |
||||||||
| 2009 | June '08 to June '09 |
||||||||||||
| Jan.[r] | Feb.[r] | Mar.[r] | Apr.[r] | May[r] | June[p] | ||||||||
| Total industry | 80.9 | 85.1 | 78.7 | 84.9 | 73.5 | 78.7 | 71.1 | 70.6 | 69.5 | 69.0 | 68.2 | 68.0 | -.1 |
| Previous estimates | 71.2 | 70.7 | 69.4 | 69.0 | 68.3 | ||||||||
| Manufacturing (see note below) | 79.6 | 85.4 | 77.2 | 84.5 | 71.4 | 76.3 | 67.1 | 67.1 | 65.9 | 65.6 | 64.9 | 64.6 | -.2 |
| Previous estimates | 67.1 | 67.1 | 65.9 | 65.6 | 65.0 | ||||||||
| Mining | 87.6 | 86.5 | 83.8 | 89.1 | 84.9 | 90.7 | 88.4 | 86.9 | 84.6 | 82.9 | 81.3 | 81.0 | .3 |
| Utilities | 86.8 | 92.8 | 84.2 | 93.3 | 84.2 | 84.4 | 85.1 | 81.1 | 80.8 | 80.4 | 79.2 | 79.7 | 1.9 |
| Stage-of-process groups | |||||||||||||
| Crude | 86.6 | 88.3 | 84.7 | 89.9 | 81.7 | 87.6 | 81.5 | 81.5 | 79.2 | 78.8 | 78.1 | 77.5 | -.1 |
| Primary and semifinished | 82.0 | 86.5 | 77.9 | 87.9 | 74.3 | 78.7 | 69.7 | 68.5 | 67.1 | 66.8 | 65.7 | 65.8 | -.4 |
| Finished | 77.7 | 83.0 | 77.2 | 80.3 | 70.0 | 74.9 | 68.5 | 68.6 | 68.1 | 67.5 | 67.0 | 66.6 | .4 |
Market Groups
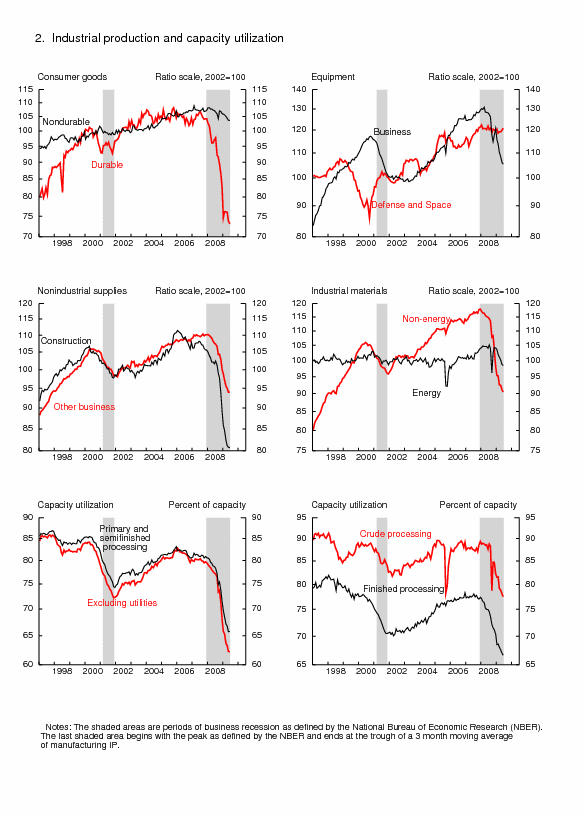
The production of consumer goods declined 0.3 percent in June. The output of consumer durables fell 1.0 percent; this index decreased 6.8 percent (annual rate) in the second quarter, a substantially smaller decline than the decrease of 40.7 percent in the first quarter. Within consumer durables, the indexes for automotive products; appliances, furniture, and carpeting; and home electronics all fell in June; the index for miscellaneous durable goods posted a small increase. The output of consumer nondurable goods edged down 0.1 percent: Higher production of energy products was more than offset by widespread declines in the output of other products. For the second quarter as a whole, the output of non-energy nondurable goods decreased 3.4 percent (annual rate) after having fallen 5.6 percent (annual rate) in the first quarter.
The output of business equipment fell 0.8 percent in June. The production of industrial and other equipment and of information processing equipment declined, while the output of transit equipment was unchanged. In the second quarter, industrial and other equipment and information processing equipment both declined at rates similar to those posted in the first quarter. Transit equipment fell in the second quarter after having increased substantially in the first quarter, when the output of aircraft rebounded from a strike. The output of defense and space equipment increased 0.8 percent in June, and the index rose at an annual rate of 2.0 percent for the second quarter as a whole.
The production of construction supplies edged down 0.2 percent in June; this index fell 15.3 percent (annual rate) in the second quarter after having dropped 34.0 percent (annual rate) in the first quarter. The output of business supplies rose 0.1 percent in June but declined 11.3 percent (annual rate) for the second quarter as a whole. The output of materials fell 0.6 percent in June, and each of its major components--durable, nondurable, and energy materials--registered declines. Among durable materials, output dropped for consumer parts and equipment parts, while among nondurables, the indexes for both paper materials and chemical materials decreased.
Industry Groups
Production in manufacturing fell 0.6 percent in June after having dropped 1.1 percent in May. The factory operating rate declined further in June to a historical low of 64.6 percent; prior to this recession, the low for this series, which begins in 1948, was 68.6 percent in December 1982. For the second quarter as a whole, manufacturing output fell at an annual rate of 10.5 percent, a decline that was about one-half the rate of decrease recorded in the first quarter. Production of durable goods fell 0.7 percent in June: The indexes for machinery; computer and electronic products; electrical equipment, appliances, and components; and motor vehicles and parts all posted decreases of more than 1 percent. Output increased for several industries, most notably for wood products, primary metals, and miscellaneous manufacturing. The gain of 1.7 percent for primary metals follows 10 consecutive monthly decreases for the industry. The output of nondurable goods fell 0.4 percent: Declines in the indexes for food, beverage, and tobacco products; apparel and leather; paper; and chemicals were only partly offset by increases in the indexes for printing and support, petroleum and coal products, and plastics and rubber products.
The index for other manufacturing industries (non-NAICS), which consists of publishing and logging, decreased 0.5 percent in June.
The output of electric and gas utilities increased 0.8 percent in June, and the operating rate for utilities moved up 0.5 percentage point, to 79.7 percent. Mining production fell 0.5 percent, and capacity utilization in this industry edged down to 81.0 percent, a rate 6.6 percentage points below its 1972-2008 average.
Capacity utilization rates in June at industries grouped by stage of process were as follows: At the crude stage, utilization fell 0.6 percentage point, to 77.5 percent, a rate 9.1 percentage points below its 1972-2008 average; at the primary and semifinished stages, utilization increased 0.1 percentage point, to 65.8 percent, a rate 16.2 percentage points below its long-run average; and at the finished stage, utilization decreased 0.4 percentage point, to 66.6 percent, a rate 11.1 percentage points below its long-run average.
Note. The statistics in this release cover output, capacity, and capacity utilization in the
U.S. industrial sector, which is defined by the Federal Reserve to comprise manufacturing,
mining, and electric and gas utilities. Mining is defined as all industries in sector 21 of the
North American Industry Classification System (NAICS); electric and gas utilities are those in
NAICS sectors 2211 and 2212. Manufacturing comprises NAICS manufacturing industries (sector 31-33)
plus the logging industry and the newspaper, periodical, book, and directory publishing industries.
Logging and publishing are classified elsewhere in NAICS (under agriculture and information
respectively), but historically they were considered to be manufacturing and were included in
the industrial sector under the Standard Industrial Classification (SIC) system. In December 2002
the Federal Reserve reclassified all its industrial output data from the SIC system to NAICS.
G.17 Release Tables:
| Ascii | Screen reader | Summary: Industrial Production and Capacity Utilization | Chart | Chart 1: Industrial Production, Capacity, and Capacity Utilization | Chart | Chart 2: Industrial Production and Capacity Utilization | Chart | Chart 3: Industrial Production and Capacity Utilization, High Technology Industries |
| Ascii | Screen reader | Table 1: Industrial Production: Market and Industry Groups (percent change) |
| Ascii | Screen reader | Table 2: Industrial Production: Special Aggregates and Selected Detail (percent change) |
| Ascii | Screen reader | Table 3: Motor Vehicle Assemblies |
| Ascii | Screen reader | Table 4: Industrial Production Indexes: Market and Industry Group Summary |
| Ascii | Screen reader | Table 5: Industrial Production Indexes: Special Aggregates |
| Ascii | Screen reader | Table 6: Diffusion Indexes of Industrial Production |
| Ascii | Screen reader | Table 7: Capacity Utilization: Manufacturing, Mining, and Utilities |
| Ascii | Screen reader | Table 8: Industrial Capacity: Manufacturing, Mining, and Utilities (percent change) |
| Ascii | Screen reader | Table 9: Industrial Production: Gross Value of Products and Nonindustrial Supplies |
| Ascii | Screen reader | Table 10: Gross-Value-Weighted Industrial Production: Stage-of-Process Groups |
| Ascii | Screen reader | Table 11: Historical Statistics for IP, Capacity, and Utilization: Total Industry |
| Ascii | Screen reader | Table 12: Historical Statistics for IP, Capacity, and Utilization: Manufacturing |
| Ascii | Screen reader | Table 13: Historical Statistics for IP, Capacity, and Utilization: Total Industry excluding Selected High-Technology Industries |
| Ascii | Screen reader | Table 14: Historical Statistics for IP, Capacity, and Utilization: Manufacturing excluding Selected High-Technology Industries |