
INDUSTRIAL PRODUCTION AND CAPACITY UTILIZATION
[Annual Revision Notice Below]
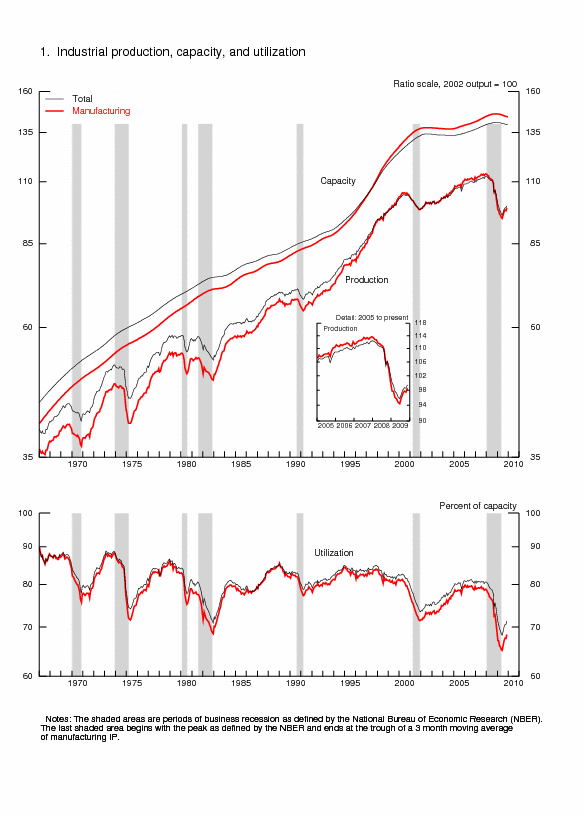
Industrial production increased 0.8 percent in November after having been unchanged in October. Manufacturing production advanced 1.1 percent, with broad-based gains among both durables and nondurables. The output of mines climbed 2.1 percent, but the index for utilities fell 1.8 percent, primarily as a result of lower output of gas utilities--temperatures in November were unseasonably mild and reduced the need for heating. At 99.4 percent of its 2002 average, total industrial production was 5.1 percent below its level of a year earlier. Capacity utilization for total industry moved up 0.7 percentage point to 71.3 percent, a rate 9.6 percentage points below its average for the period from 1972 through 2008.
| Industrial production |
2002=100 | Percent change | |||||||||||
|---|---|---|---|---|---|---|---|---|---|---|---|---|---|
| 2009 | 2009 | Nov. '08 to Nov. '09 |
|||||||||||
| June[r] | July[r] | Aug.[r] | Sept.[r] | Oct.[r] | Nov.[p] | June[r] | July[r] | Aug.[r] | Sept.[r] | Oct.[r] | Nov.[p] | ||
| Total index | 95.8 | 96.8 | 98.1 | 98.6 | 98.6 | 99.4 | -.5 | 1.1 | 1.3 | .6 | .0 | .8 | -5.1 |
| Previous estimates | 95.8 | 96.7 | 97.9 | 98.6 | 98.6 | -.4 | .9 | 1.3 | .6 | .1 | |||
| Major market groups | |||||||||||||
| Final Products | 98.9 | 100.0 | 101.4 | 102.2 | 102.1 | 102.5 | -.6 | 1.1 | 1.4 | .8 | -.1 | .4 | -4.0 |
| Consumer goods | 96.3 | 97.3 | 98.7 | 99.7 | 99.8 | 100.1 | -.6 | 1.0 | 1.4 | 1.0 | .1 | .3 | -1.9 |
| Business equipment | 105.8 | 106.9 | 108.3 | 107.9 | 107.6 | 108.1 | -.4 | 1.0 | 1.3 | -.3 | -.3 | .4 | -8.1 |
| Nonindustrial supplies | 90.5 | 90.5 | 91.0 | 90.6 | 90.4 | 91.3 | .1 | .0 | .5 | -.4 | -.3 | 1.0 | -8.6 |
| Construction | 82.1 | 82.5 | 82.9 | 81.9 | 80.6 | 81.9 | .0 | .5 | .5 | -1.3 | -1.5 | 1.6 | -12.6 |
| Materials | 94.7 | 96.2 | 97.7 | 98.4 | 98.5 | 99.7 | -.6 | 1.6 | 1.6 | .7 | .1 | 1.3 | -4.8 |
| Major industry groups | |||||||||||||
| Manufacturing (see note below) | 94.4 | 95.8 | 97.1 | 97.7 | 97.5 | 98.6 | -.4 | 1.4 | 1.4 | .7 | -.2 | 1.1 | -4.9 |
| Previous estimates | 94.5 | 95.6 | 97.0 | 97.7 | 97.6 | -.3 | 1.2 | 1.4 | .8 | -.1 | |||
| Mining | 93.7 | 94.8 | 96.5 | 96.4 | 96.2 | 98.2 | -1.5 | 1.2 | 1.7 | -.1 | -.2 | 2.1 | -6.8 |
| Utilities | 103.8 | 102.6 | 103.4 | 103.7 | 105.4 | 103.5 | -.5 | -1.2 | .8 | .2 | 1.7 | -1.8 | -5.1 |
| Capacity utilization |
Percent of capacity |
Capacity growth |
|||||||||||
|---|---|---|---|---|---|---|---|---|---|---|---|---|---|
| Average 1972- 2008 |
1988- 89 high |
1990- 91 low |
1994- 95 high |
2001- 02 low |
2008 Nov. |
||||||||
| 2009 | Nov. '08 to Nov. '09 |
||||||||||||
| June[r] | July[r] | Aug.[r] | Sept.[r] | Oct.[r] | Nov.[p] | ||||||||
| Total industry | 80.9 | 85.1 | 78.7 | 84.9 | 73.5 | 74.4 | 68.3 | 69.1 | 70.1 | 70.6 | 70.6 | 71.3 | -.9 |
| Previous estimates | 68.3 | 69.0 | 70.0 | 70.5 | 70.7 | ||||||||
| Manufacturing (see note below) | 79.6 | 85.4 | 77.2 | 84.5 | 71.4 | 71.1 | 65.1 | 66.1 | 67.1 | 67.6 | 67.6 | 68.4 | -1.2 |
| Previous estimates | 65.1 | 66.0 | 67.0 | 67.6 | 67.6 | ||||||||
| Mining | 87.6 | 86.5 | 83.8 | 89.1 | 84.9 | 90.7 | 80.7 | 81.8 | 83.3 | 83.4 | 83.3 | 85.2 | -.7 |
| Utilities | 86.8 | 92.8 | 84.2 | 93.3 | 84.2 | 83.5 | 78.7 | 77.6 | 78.2 | 78.2 | 79.4 | 77.9 | 1.8 |
| Stage-of-process groups | |||||||||||||
| Crude | 86.6 | 88.3 | 84.7 | 89.9 | 81.7 | 84.7 | 79.5 | 80.7 | 82.1 | 83.3 | 83.4 | 85.2 | -1.2 |
| Primary and semifinished | 82.0 | 86.5 | 77.9 | 87.9 | 74.3 | 73.5 | 65.8 | 66.4 | 67.1 | 67.3 | 67.4 | 67.8 | -1.0 |
| Finished | 77.7 | 83.0 | 77.2 | 80.3 | 70.0 | 71.2 | 66.6 | 67.6 | 68.8 | 69.3 | 69.4 | 70.0 | -.6 |
Market Groups
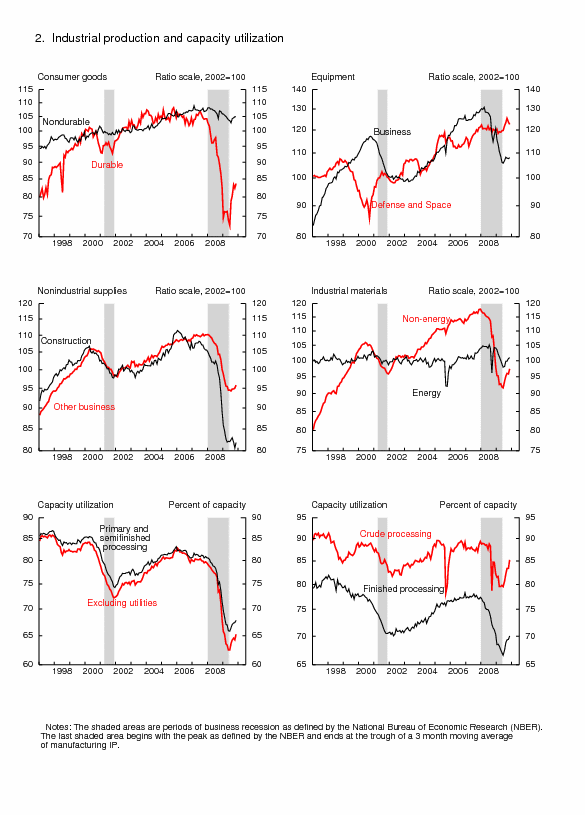
The production of consumer goods moved up 0.3 percent in November, a gain that reflected an increase in the output of durable goods. Among consumer durables, the indexes for automotive products and for appliances, furniture, and carpeting moved up, while the index for home electronics fell for the 10th month in a row. The production of consumer nondurables was unchanged in November; an increase in non-energy nondurables offset a decrease in consumer energy products. The advance in the production of non-energy nondurable goods resulted from sizable gains in paper products and in chemical products, but declines in the output of clothing and of food and tobacco products limited the increase in this category. The decrease in consumer energy products reflected the drop in utilities, and the output of fuels advanced.
The index for business equipment rose 0.4 percent in November. Results for its major components were mixed: The output of industrial and other equipment rose 0.9 percent, the output of information processing equipment was unchanged, and the output of transit equipment declined. The production of defense and space equipment fell for a second month; these decreases, which averaged just more than 1 percent per month, retraced nearly half of the gains accumulated over the three previous months.
Within nonindustrial supplies, the production of construction supplies increased 1.6 percent in November after having fallen in each of the previous two months. The output of business supplies rose 0.7 percent last month; an increase in general business supplies more than offset a decline in commercial energy products.
The production of materials moved up 1.3 percent in November. The index for non-energy materials jumped 1.7 percent, and the index for energy materials increased 0.3 percent. Among non-energy materials, both the durable and nondurable materials categories recorded substantial gains. Within durables, output in the consumer parts category decreased 0.3 percent; however, the output of equipment parts gained 1.1 percent, and the output of other durable materials advanced 2.2 percent. Production for all major categories of nondurable materials moved up, and the largest gain, 2.9 percent, was in chemical materials. The small rise in energy materials came as increases in crude oil extraction and support activities for oil and gas well drilling offset a decrease in utilities.
Industry Groups
Manufacturing output increased 1.1 percent in November after having edged down 0.2 percent in October, and capacity utilization for manufacturing increased 0.8 percentage point to 68.4 percent. The index for durable goods increased 1.0 percent, and robust gains were posted for nonmetallic mineral products, primary metals, motor vehicles and parts, and furniture and related products. Assemblies of motor vehicles moved up 200,000 units in November to 7.2 million units (annual rate). Among other durable goods categories, production of wood products, machinery, computer and electronic products, and miscellaneous goods also increased in November, while production of fabricated metal products; electrical equipment, appliances, and components; and aerospace and miscellaneous transportation equipment decreased.
The production of nondurable goods rose 1.1 percent in November. Gains of more than 1 percent were registered for the majority of nondurable goods categories, including textile and product mills, paper, printing and support, petroleum and coal products, chemicals, and plastics and rubber products. Production of food, beverage, and tobacco products slipped 0.2 percent, and the output of apparel and leather edged up 0.1 percent. Production in the non-NAICS manufacturing industries (logging and publishing) rose 2.1 percent.
The output of mines increased 2.1 percent in November after two months of small declines, and the capacity utilization rate for mining moved up 1.9 percentage points to 85.2 percent. The gains in mining primarily reflected advances in oil and gas well drilling; related support activity; and stone, sand, and gravel mining. The output of utilities fell 1.8 percent, and the operating rate for utilities fell back 1.5 percentage points to 77.9 percent. The output of natural gas utilities dropped 8.1 percent, and the output of electric utilities fell 0.6 percent.
Capacity utilization at industries grouped by stage of process changed as follows: For the crude stage, utilization rose 1.8 percentage points to 85.2 percent, a rate 1.4 percentage points below its 1972-2008 average; for the primary and semifinished stages, utilization moved up 0.4 percentage point to 67.8 percent, a rate 14.2 percentage points below its long-run average; and for the finished stage, utilization increased 0.6 percentage point to 70.0 percent, a rate 7.7 percentage points below its long-run average.
| Ascii | Screen reader | Summary: Industrial Production and Capacity Utilization | Chart | Chart 1: Industrial Production, Capacity, and Capacity Utilization | Chart | Chart 2: Industrial Production and Capacity Utilization | Chart | Chart 3: Industrial Production and Capacity Utilization, High Technology Industries |
| Ascii | Screen reader | Table 1: Industrial Production: Market and Industry Groups (percent change) |
| Ascii | Screen reader | Table 2: Industrial Production: Special Aggregates and Selected Detail (percent change) |
| Ascii | Screen reader | Table 3: Motor Vehicle Assemblies |
| Ascii | Screen reader | Table 4: Industrial Production Indexes: Market and Industry Group Summary |
| Ascii | Screen reader | Table 5: Industrial Production Indexes: Special Aggregates |
| Ascii | Screen reader | Table 6: Diffusion Indexes of Industrial Production |
| Ascii | Screen reader | Table 7: Capacity Utilization: Manufacturing, Mining, and Utilities |
| Ascii | Screen reader | Table 8: Industrial Capacity: Manufacturing, Mining, and Utilities (percent change) |
| Ascii | Screen reader | Table 9: Industrial Production: Gross Value of Products and Nonindustrial Supplies |
| Ascii | Screen reader | Table 10: Gross-Value-Weighted Industrial Production: Stage-of-Process Groups |
| Ascii | Screen reader | Table 11: Historical Statistics for IP, Capacity, and Utilization: Total Industry |
| Ascii | Screen reader | Table 12: Historical Statistics for IP, Capacity, and Utilization: Manufacturing |
| Ascii | Screen reader | Table 13: Historical Statistics for IP, Capacity, and Utilization: Total Industry excluding Selected High-Technology Industries |
| Ascii | Screen reader | Table 14: Historical Statistics for IP, Capacity, and Utilization: Manufacturing excluding Selected High-Technology Industries |