
INDUSTRIAL PRODUCTION AND CAPACITY UTILIZATION
[Annual Revision Notice Below]
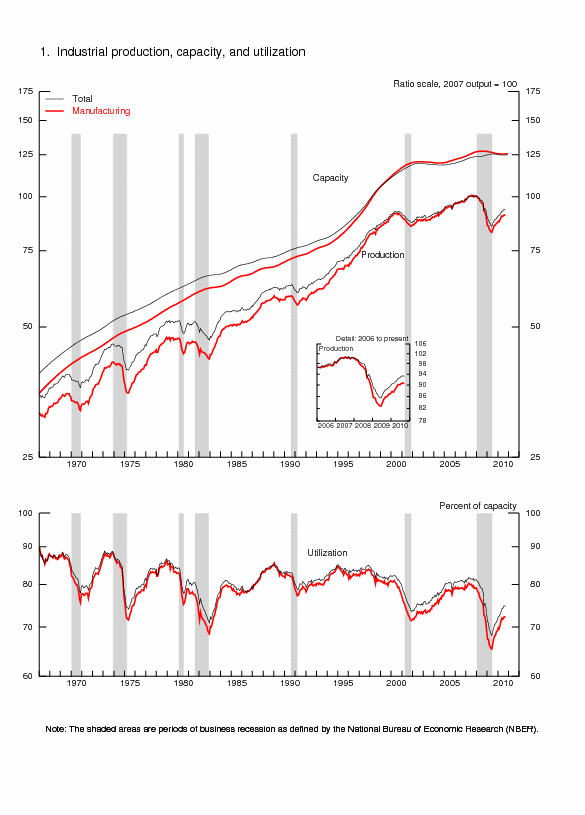
Industrial production was unchanged in October after having fallen 0.2 percent in September. For the manufacturing sector, output gained 0.5 percent in October after having risen 0.1 percent in September. Factory production in September was initially reported to have decreased 0.2 percent, but incoming data on steel, fabricated metal products, machinery, and chemicals helped boost the index. The output of utilities dropped 3.4 percent in October, as unseasonably warm temperatures reduced demand for heating. Production at mines fell 0.1 percent. At 93.4 percent of its 2007 average, total industrial production in October was 5.3 percent above its year-earlier level. The capacity utilization rate for total industry was flat at 74.8 percent, a rate 6.6 percentage points above the low in June 2009 and 5.8 percentage points below its average from 1972 to 2009.
| Industrial production |
2007=100 | Percent change | |||||||||||
|---|---|---|---|---|---|---|---|---|---|---|---|---|---|
| 2010 | 2010 | Oct. '09 to Oct. '10 |
|||||||||||
| May[r] | June[r] | July[r] | Aug.[r] | Sept.[r] | Oct.[p] | May[r] | June[r] | July[r] | Aug.[r] | Sept.[r] | Oct.[p] | ||
| Total index | 92.6 | 92.6 | 93.3 | 93.5 | 93.4 | 93.4 | 1.2 | .0 | .8 | .2 | -.2 | .0 | 5.3 |
| Previous estimates | 92.5 | 92.6 | 93.2 | 93.4 | 93.2 | 1.1 | .1 | .7 | .2 | -.2 | |||
| Major market groups | |||||||||||||
| Final Products | 94.4 | 94.4 | 95.5 | 95.1 | 94.9 | 95.2 | 2.0 | .1 | 1.1 | -.3 | -.2 | .4 | 4.9 |
| Consumer goods | 94.4 | 94.4 | 95.5 | 95.0 | 94.6 | 94.6 | 2.3 | .0 | 1.2 | -.5 | -.5 | .0 | 2.6 |
| Business equipment | 93.0 | 93.6 | 94.3 | 94.5 | 94.7 | 95.8 | 2.0 | .6 | .7 | .2 | .3 | 1.1 | 10.4 |
| Nonindustrial supplies | 85.2 | 85.2 | 85.2 | 85.5 | 84.7 | 84.3 | .6 | .0 | .0 | .3 | -.9 | -.5 | 2.7 |
| Construction | 79.3 | 79.3 | 78.8 | 79.6 | 79.3 | 79.4 | -.1 | .0 | -.6 | 1.0 | -.4 | .2 | 7.7 |
| Materials | 93.5 | 93.5 | 94.2 | 94.8 | 95.0 | 94.9 | .6 | .0 | .7 | .7 | .2 | -.1 | 6.7 |
| Major industry groups | |||||||||||||
| Manufacturing (see note below) | 90.3 | 90.0 | 90.7 | 90.7 | 90.8 | 91.3 | 1.2 | -.3 | .7 | .0 | .1 | .5 | 6.1 |
| Previous estimates | 90.2 | 90.0 | 90.6 | 90.7 | 90.6 | 1.1 | -.3 | .6 | .1 | -.2 | |||
| Mining | 100.0 | 99.8 | 100.8 | 103.1 | 103.2 | 103.2 | -.8 | -.2 | 1.0 | 2.3 | .1 | -.1 | 7.5 |
| Utilities | 99.2 | 101.6 | 102.5 | 101.5 | 99.3 | 95.9 | 4.1 | 2.5 | .9 | -1.0 | -2.2 | -3.4 | -2.6 |
| Capacity utilization |
Percent of capacity |
Capacity growth |
|||||||||||
|---|---|---|---|---|---|---|---|---|---|---|---|---|---|
| Average 1972- 2009 |
1988- 89 high |
1990- 91 low |
1994- 95 high |
2008- 09 low |
2009 Oct. |
||||||||
| 2010 | Oct. '09 to Oct. '10 |
||||||||||||
| May[r] | June[r] | July[r] | Aug.[r] | Sept.[r] | Oct.[p] | ||||||||
| Total industry | 80.6 | 85.2 | 78.7 | 85.1 | 68.2 | 70.7 | 74.2 | 74.2 | 74.8 | 74.9 | 74.8 | 74.8 | -.4 |
| Previous estimates | 74.1 | 74.2 | 74.7 | 74.8 | 74.7 | ||||||||
| Manufacturing (see note below) | 79.2 | 85.6 | 77.2 | 84.6 | 65.4 | 68.2 | 72.0 | 71.7 | 72.2 | 72.2 | 72.3 | 72.7 | -.3 |
| Previous estimates | 71.9 | 71.7 | 72.2 | 72.3 | 72.2 | ||||||||
| Mining | 87.4 | 86.4 | 83.6 | 88.9 | 79.6 | 81.8 | 85.4 | 85.2 | 86.1 | 88.0 | 88.0 | 87.9 | .0 |
| Utilities | 86.7 | 92.9 | 84.3 | 93.3 | 77.6 | 79.9 | 79.6 | 81.5 | 82.1 | 81.3 | 79.4 | 76.6 | 1.6 |
| Stage-of-process groups | |||||||||||||
| Crude | 86.5 | 87.8 | 84.2 | 90.0 | 78.3 | 81.2 | 84.6 | 84.5 | 85.2 | 86.6 | 87.2 | 87.3 | -.8 |
| Primary and semifinished | 81.6 | 86.6 | 77.9 | 87.9 | 65.7 | 67.9 | 71.6 | 71.9 | 72.2 | 72.1 | 71.5 | 71.0 | -.6 |
| Finished | 77.5 | 83.4 | 77.3 | 80.5 | 67.5 | 70.7 | 73.5 | 73.2 | 73.9 | 73.9 | 74.0 | 74.5 | .7 |
Market Groups
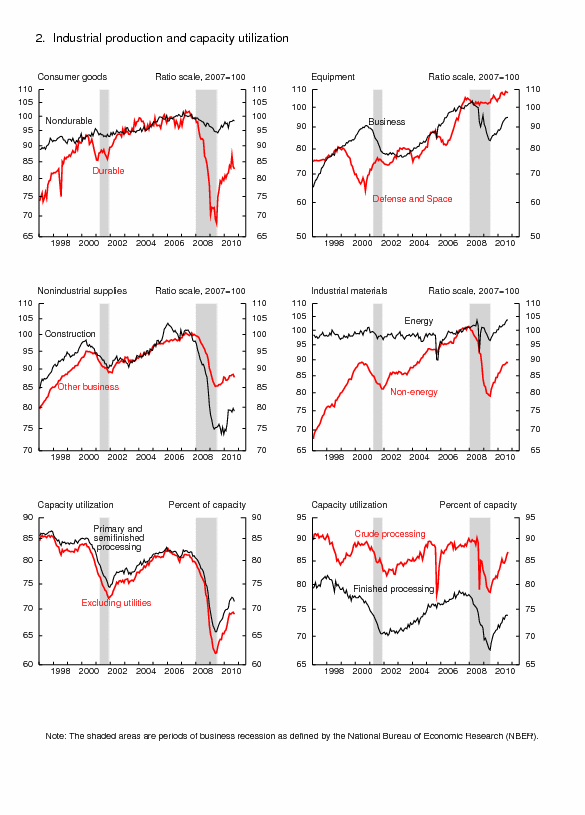
The output of consumer goods was unchanged in October. The production of consumer durables rose 0.8 percent. Within durables, the indexes for automotive products and for appliances, furniture, and carpeting each increased 1.1 percent. Gains in the production of miscellaneous goods and of home electronics were smaller, at 0.2 percent and 0.3 percent, respectively. The production of nondurable consumer goods declined 0.2 percent; a fall of 3.2 percent for the energy category, which primarily resulted from a decrease in the index for residential utilities, more than offset an increase of 0.7 percent for the non-energy category. Within non-energy nondurables, the index for clothing advanced 2.0 percent, and the indexes for foods and tobacco and for chemical products moved up at lesser rates; the index for paper products moved down.
The output of business equipment moved up 1.1 percent in October; it was 10.4 percent above its year-earlier level. The indexes for information processing equipment and for industrial and other equipment each advanced 1.2 percent, while the index for transit equipment rose 0.7 percent after two months of small declines.
In October, the index for defense and space equipment increased 0.7 percent and retraced most of its losses of the previous two months.
The production of construction supplies moved up 0.2 percent in October after having declined 0.4 percent in September. The index for business supplies decreased 0.8 percent in October; a decline of 3.2 percent in commercial energy products was partly offset by a gain of 0.2 percent in non-energy supplies.
The production of materials fell 0.1 percent in October. An increase in the output of durable materials, for which all major categories advanced, was offset by a small decline for nondurable materials and a somewhat larger decrease for energy materials. Within nondurable materials, the indexes for textiles and chemicals declined, and the index for paper advanced.
Industry Groups
Production in manufacturing rose 0.5 percent in October, and the factory operating rate moved up to 72.7 percent, a rate 6.5 percentage points below its average from 1972 to 2009. The output of durable goods increased 0.9 percent, with increases in most major categories. After having declined the previous four months, the output of wood products jumped 2.5 percent; the indexes for nonmetallic mineral products and for electrical equipment, appliances, and components also increased by 2.0 percent or more. Within durable manufacturing, only the index for primary metals fell, at a rate of 0.4 percent.
The production of nondurable goods moved up 0.2 percent in October after having risen 0.4 percent in September. The output of apparel and leather increased by the largest proportion, and the production of food, beverage, and tobacco products, of paper, and of plastics and rubber products also rose. The indexes for printing, for petroleum and coal products, and for chemicals declined. The index for other manufacturing (non-NAICS), which consists of publishing and logging, was unchanged after having declined in the previous four months.
Mining production edged down 0.1 percent in October, and its utilization rate fell to 87.9 percent, a rate 0.5 percentage point above its average from 1972 to 2009. The index for utilities dropped 3.4 percent; the output of electric utilities declined for a third consecutive month, while the output of natural gas utilities fell for a second month in a row. The operating rate for utilities decreased 2.8 percentage points, to 76.6 percent.
In October, capacity utilization rates at industries grouped by stage of process were as follows: For the crude stage, the operating rate increased 0.1 percentage point, to 87.3 percent, a rate that was 0.8 percentage point above its average from 1972 to 2009; for the primary and semifinished stages, utilization declined 0.5 percentage point, to 71.0 percent, a rate 10.6 percentage points below its long-run average; and for the finished stage, utilization increased 0.5 percentage point, to 74.5 percent, a rate 3.0 percentage points below its long-run average.
| Ascii | Screen reader | Summary: Industrial Production and Capacity Utilization | Chart | Chart 1: Industrial Production, Capacity, and Capacity Utilization | Chart | Chart 2: Industrial Production and Capacity Utilization | Chart | Chart 3: Industrial Production and Capacity Utilization, High Technology Industries |
| Ascii | Screen reader | Table 1: Industrial Production: Market and Industry Groups (percent change) |
| Ascii | Screen reader | Table 2: Industrial Production: Special Aggregates and Selected Detail (percent change) |
| Ascii | Screen reader | Table 3: Motor Vehicle Assemblies |
| Ascii | Screen reader | Table 4: Industrial Production Indexes: Market and Industry Group Summary |
| Ascii | Screen reader | Table 5: Industrial Production Indexes: Special Aggregates |
| Ascii | Screen reader | Table 6: Diffusion Indexes of Industrial Production |
| Ascii | Screen reader | Table 7: Capacity Utilization: Manufacturing, Mining, and Utilities |
| Ascii | Screen reader | Table 8: Industrial Capacity: Manufacturing, Mining, and Utilities (percent change) |
| Ascii | Screen reader | Table 9: Industrial Production: Gross Value of Products and Nonindustrial Supplies |
| Ascii | Screen reader | Table 10: Gross-Value-Weighted Industrial Production: Stage-of-Process Groups |
| Ascii | Screen reader | Table 11: Historical Statistics for IP, Capacity, and Utilization: Total Industry |
| Ascii | Screen reader | Table 12: Historical Statistics for IP, Capacity, and Utilization: Manufacturing |
| Ascii | Screen reader | Table 13: Historical Statistics for IP, Capacity, and Utilization: Total Industry excluding Selected High-Technology Industries |
| Ascii | Screen reader | Table 14: Historical Statistics for IP, Capacity, and Utilization: Manufacturing excluding Selected High-Technology Industries |