
Release Date: December 22, 2004
Release dates | Historical data | Documentation
Current Monthly Release Other formats: ASCII | PDF (144 KB)
Supplemental Monthly Release Other formats: ASCII | PDF (144 KB)
Annual Revision Release Other formats: ASCII | PDF (150 KB)
INDUSTRIAL PRODUCTION AND CAPACITY UTILIZATION: THE 2004 ANNUAL REVISION
The Federal Reserve has revised the index of industrial production (IP) and the related measures of capacity and capacity utilization for the period from January 1972 to November 2004. Overall, the changes to total industrial production are small. Measured from the fourth quarter of 2002 to the third quarter of 2004, industrial output is now reported to have increased a little less than shown previously. Production expanded more slowly in 2000 than indicated in the earlier estimates, while the contraction in 2001 was a little less steep. The rise in output in 2002 was slightly stronger than reported earlier.
Although the level of IP was a bit lower in the third quarter of 2004 than previously reported, the rate of industrial capacity utilization--the ratio of production to capacity--was revised upward. At 78.2 percent, the utilization rate for total industry is 0.9 percentage point higher than previously reported but still 2.9 percentage points below its 1972-2003 average. The current figures place the operating rate in manufacturing for the fourth quarter of 2003 and the third quarter of 2004 about 1/2 percentage point above their earlier estimates. Excluding selected high-technology industries, capacity utilization in manufacturing in 2003 and 2004 was little revised on balance. Capacity utilization rates at mines and utilities for the third quarter of 2004 are now about 2 percentage points higher than reported earlier.
The revision indicates that industrial capacity expanded at a slower rate in 2002 and 2004 than estimated previously. Capacity is now reported to have declined a bit in 2003; previously, a small increase had been reported. The current figures for capacity in 2000 and 2001 indicate a slightly stronger rate of increase than the earlier estimates.
The updated measures incorporate newly available and more comprehensive source data. In addition, the revision introduced improved methods for compiling sixteen monthly production series and one new capacity series. The annual source data are generally for 2002 and 2003, and the modified methods affect indexes largely from 1972 forward.
The main data source introduced in this year's annual IP revision is the U.S. Census Bureau's recently issued 2002 Census of Manufactures. Data introduced from other Census Bureau publications include the 2002 Census of Services and the 2003 Services Annual Survey (for publishing) and selected 2003 Current Industrial Reports. Additional government source data include new annual data on minerals for 2002 and 2003 from the U.S. Geological Survey (USGS) and updated deflators from the Bureau of Economic Analysis (BEA). In addition, the new monthly production estimates reflect updated seasonal factors and the inclusion of monthly source data that became available (or were revised) after the closing of the regular four-month reporting window.
The capacity indexes and capacity utilization rates were calculated using the revised production indexes; results from the Census Bureau's 2003 Survey of Plant Capacity (SPC) for the fourth quarter of the year; and newly available data on industrial capacity from the USGS, the Energy Information Agency of the Department of Energy, and other organizations.
Results of the Revision
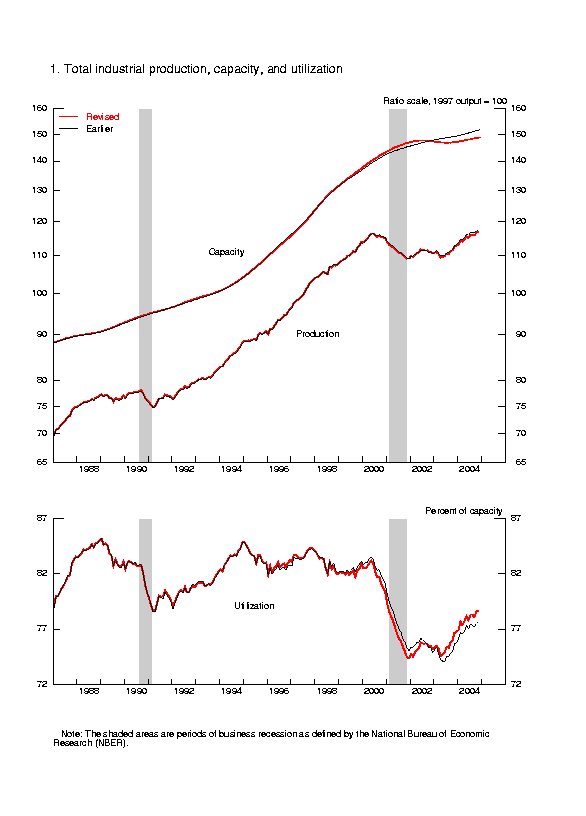
Total industrial production for the third quarter of 2004 is currently reported to be 115.9 percent of output in 1997 (table 1A), and the capacity index now stands at 148.2 percent of output in 1997 (table 1B); both indexes are lower than reported previously (chart 1). However, because of the larger downward revision to capacity than to production, the utilization rate for total industry in the third quarter of 2004 was higher than earlier reports suggested.
Tables 2 and 3 show the revised rates of change of industrial production for market groups, industry groups, special aggregates, and selected detail for the years 2000 through 2004. Tables 4, 5, and 6 show the revised figures for capacity utilization, capacity, and electric power use. The tables also show the difference between the revised and earlier rates of change. For capacity utilization, the tables show the difference between revised and previous rates for the final quarter of the year (the third quarter was used for 2004). Tables 7, 8, and 9 report the revised production, capacity, and utilization series for manufacturing, for total industry excluding selected high-technology industries, and for manufacturing excluding selected high-technology industries.
Industrial Production
The revision indicates that the overall path of industrial production is much the same as stated earlier. The most significant feature of this revision, the incorporation of the 2002 Census of Manufactures, had little effect on the top-line estimates.
Relative to earlier reports, the current estimates for manufacturing IP indicate a more moderate upward trajectory for 2003 and 2004. Like the revisions to total industrial production, the revisions to manufacturing output in earlier years were very small.
Across industry groups, the revision path indicates that the output of durable goods manufacturers followed a generally lower trajectory in recent years than the previous estimates suggested. Downward revisions to the indexes for the computer and electronic products industry, the miscellaneous manufacturing industry, the fabricated metal products industry, the machinery industry, and the wood products industry contributed to the downward revision in 2003 and 2004.
Overall, the index for nondurable manufacturing is little changed from the previous estimates. In 2004, lower indexes for printing and support; chemicals; plastics and rubber products; and apparel and leather outweighed upward revisions to the indexes for petroleum and coal products; food, beverage, and tobacco products; textile and product mills; and paper.
The current revision indicates lower output in recent years for the industries that have historically been defined as manufacturers (namely publishing and logging) but are classified elsewhere under NAICS (North American Industry Classification System). In 2003 and 2004, the rates of change are about 4 percentage points lower than previously published.
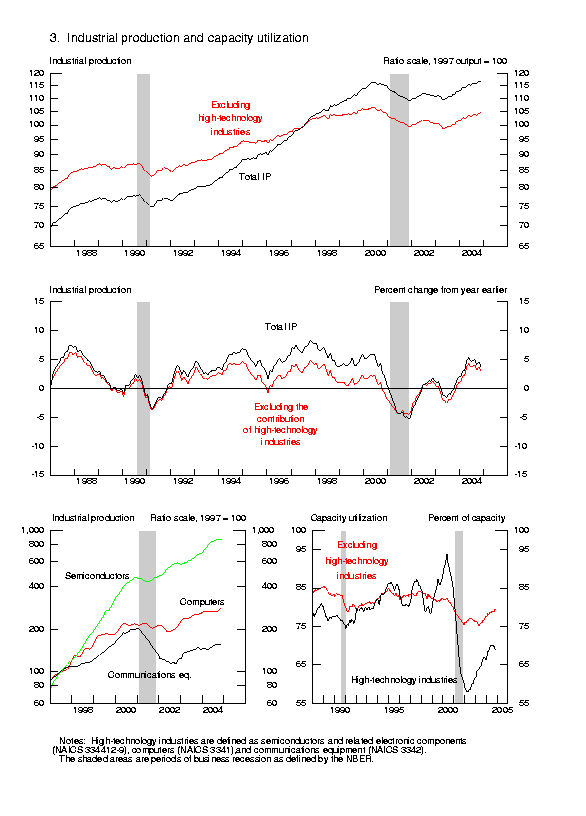
Regarding a few special aggregates (table 3), the output of selected high-technology industries--computers and peripheral equipment, communications equipment, and semiconductors and related components--is now lower in recent years than previously estimated. Production is reported to have fallen somewhat more steeply in 2001 and to have risen somewhat less in 2002, 2003, and 2004. Relative to earlier estimates, the output of computers is now estimated to have increased much more slowly in 2002 and 2004 and more quickly in 2003. The index for communications equipment is currently reported to have declined at a faster pace in 2002 than was reported earlier; the rebound in 2003 is now shown to be markedly stronger. The expansion of semiconductor output is now estimated to have been much more moderate in 2003 and somewhat stronger in 2004 than earlier estimates suggested.
The current revision finds the overall swings in the output of motor vehicles and parts in recent years to have been a little wider than in earlier reports. Relative to earlier estimates, the index for motor vehicles and parts is now reported to have risen somewhat more in 2002 and 2003 and to have declined a bit more in 2000 and in 2004; industry output is now reported to have declined less in 2001 than recorded earlier.
Production by Market Groups
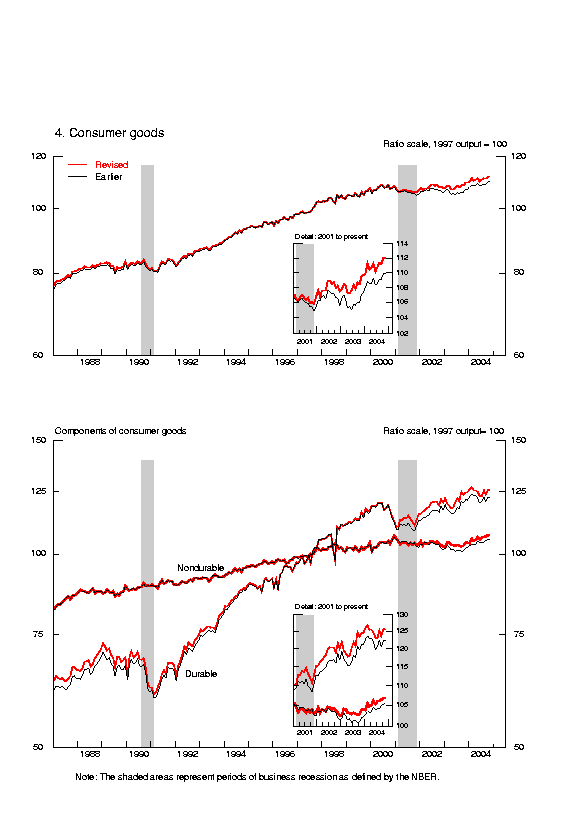
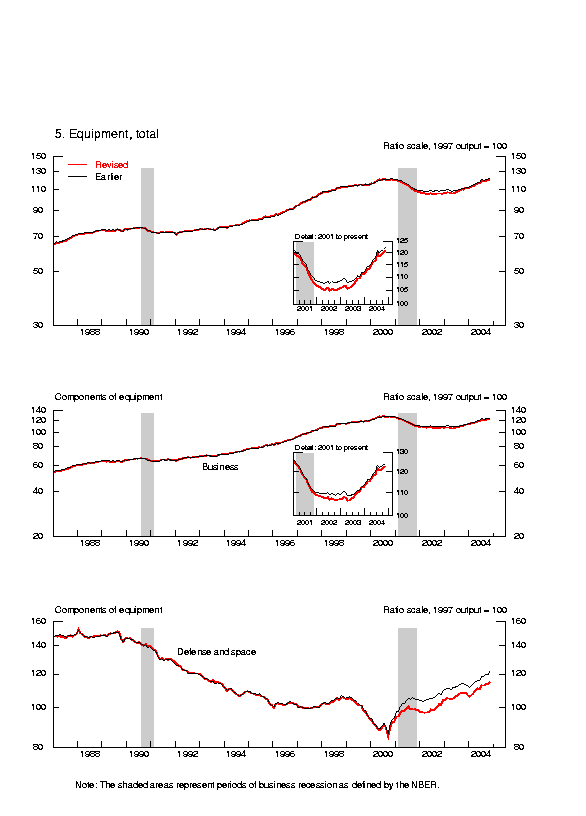
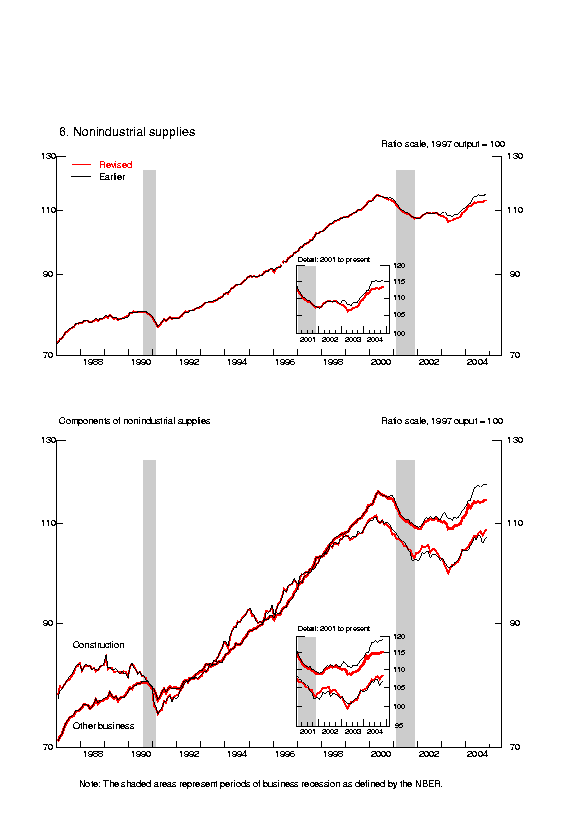
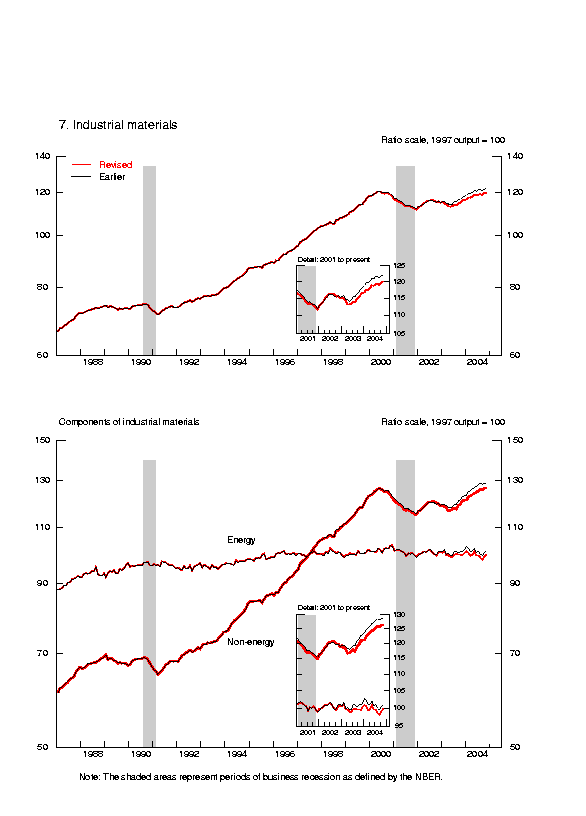
Among major market groups, the production index for final products and nonindustrial supplies is little changed from earlier estimates for recent years. The overall path of this index shows a rise in 2000, a dropback in 2001, and then increasingly large gains in the subsequent years. This revision places the output of consumer goods in recent years generally close to their earlier estimates; the decline in output in 2001 is now estimated to be 0.7 percentage point less than previously reported; a large upward revision to the index for home electronics is partly responsible. The production of business equipment is now reported to be somewhat weaker in the 2000-04 period, on balance, than in the earlier estimates. Production of defense and space equipment is now reported to have risen a bit less in 2001 than earlier reports suggested, but the overall contour of the index still shows solid gains since 2001. On balance since 2000, the index for construction supplies is a little stronger than reported earlier. However, the index for business supplies is weaker over the same time period. Because of downward revisions to the production in both the energy and non-energy categories, the current revision indicates weaker output of materials in recent years, particularly in 2003 and 2004, than was reported earlier.
Capacity
The general contour of manufacturing capacity shows a slightly more rapid acceleration during the second half of the 1990s and a sharper deceleration since then. The revised capacity indexes for durable goods industries are the principal contributors to the changes in the contour of manufacturing capacity. The current estimates for nondurable manufactures over the same time period are, on balance, little changed from earlier reports.
Among selected high-technology industries, the overall picture of rapidly expanding capacity in the late 1990s followed by more-moderate increases still remains. However, the revision suggests a slower path of expansion in the 2000-04 period than indicated previously. Excluding high-technology industries, manufacturing capacity contracted slightly in 2002 and 2003; the estimate for 2004 was revised little.
Capacity at mines is now estimated to have decreased in four of the past five years and has declined, on balance, more than previously estimated. In contrast, capacity at electric and gas utilities accelerated sharply from 2000 to 2003, although the current measures show, on balance, a slower rate of expansion than previous estimates. For 2004, the increase in capacity at utilities moderated a bit from the pace seen over the preceding four years.
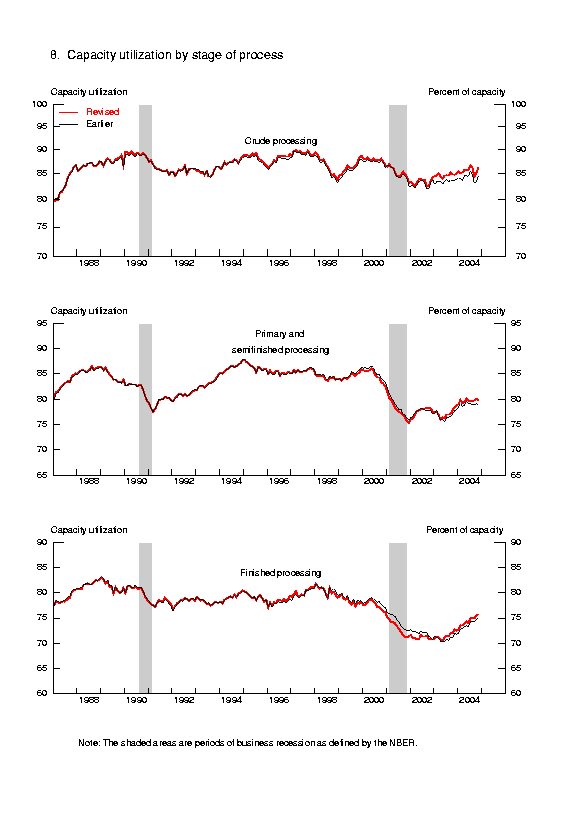
The revisions to the capacity estimates for stage-of-process groups occurred across all groups but were most pronounced in the category for primary and semifinished goods. For 2002 through 2004, the current capacity measures reflect lower rates of change than previously reported for each stage-of-process group.
Capacity Utilization
The revised rates of capacity utilization are somewhat higher than the previous estimates for recent years, owing mainly to the downward revision to capacity. For the fourth quarter of 2003 and the third quarter of 2004, the revised utilization rates for total industry are about 1 percentage point higher than earlier estimates. About one-half of this increase is accounted for by revisions to the factory operating rate, which is now estimated to be 77.0 percent in the third quarter of 2004. Higher utilization rates for selected high-technology industries in 2004 contributed heavily to the upward revision in manufacturing. The factory operating rate remains about 3 percentage points below its 1972-2003 average even though it rose 4.4 percentage points between its trough in the final quarter of 2001 and the third quarter of 2004.
Within manufacturing, the current estimates for durable and nondurable manufacturers in 2003 and 2004 are higher than stated previously. Over the same period, the utilization rates for other (non-NAICS) manufacturers are lower, particularly in 2004, than earlier estimates suggested.
The operating rate among the selected high-technology industries was 69.9 percent in the third quarter of 2004--1.8 percentage points above the previously reported pace and 11.6 percentage points above its trough in the second quarter of 2002. On balance for recent years, the current revision places utilization in the semiconductor industry at a higher rate than reported earlier but indicates a lower rate for communications equipment. On balance, operating rates in the computer industry are not much changed.
For recent years, the current revision places the utilization rates for mines and for gas and electric utilities at higher levels than reported earlier. The upward revisions to the utilization rates for utilities reflect downward revisions to the capacity estimates for electricity generation. For the third quarter of 2004, the utilization rate at mines was 86.3 percent, and the utilization rate at gas and electric utilities was 84.0 percent. Both measures are below their 1972-2003 averages.
Technical Aspects of the Revision
The revision incorporates updated comprehensive annual data and revised monthly source data used in the estimation of production, capacity, and utilization. As noted earlier, this revision includes information drawn from the recently released 2002 Census of Manufactures. Additionally, this revision incorporates the 2003 Survey of Plant Capacity, other annual industry reports, recent information on prices, and revised monthly source data on physical products and on labor and electricity inputs. Along with the individual production series and seasonal factors, the annual value-added weights used in aggregating the indexes to market and industry groups were also updated.
Changes to Benchmark Indexes
The benchmark indexes for manufacturing--defined for each six-digit NAICS industry as nominal gross output divided by a price index--were modified in this revision. The principal change to the indexes was the inclusion of new information from the 2002 Census of Manufactures and revisions to the estimates from the 2001 Annual Survey of Manufactures. In addition, the benchmark indexes incorporated newly available price indexes on a NAICS basis from the BEA. The new price data were not significantly different from the estimates that had been used previously. The calculation of nominal gross output for benchmark index was also revised for 1997 to the present. Previously, nominal gross output for an industry was defined to equal cost of materials plus value added. The updated methodology subtracts from that figure the cost of resold goods (those goods purchased by a manufacturer and then resold without any material transformation).
Changes to Individual Production Series
With this revision, the monthly production indicators for some series have changed. The source data for production indexes for the following eleven industries, which constituted 6.6 percent of IP in 2003, have been changed over their histories from electric power use to production-worker hours.
(1) Other animal food (NAICS 311119)
(2) Soft drink and ice (31211)
(3) Wood container and pallet (32192)
(4) Paving, roofing, and other petroleum and coal products (32412,9)
(5) Pesticide and other agricultural chemicals (32532)
(6) Concrete and product (32732-9)
(7) Forging and stamping (3321)
(8) Coating, engraving, heat treating, and allied activities (3328)
(9) Motor vehicle metal stamping (33637)
(10) Household and institutional furniture and kitchen cabinet (3371)
(11) Medical equipment and supplies (3391)
The decision to switch the monthly indicators for these series, listed below, resulted from a deterioration in the sample of utilities that report for these industries as well as a review of the historical annual relationships between the output benchmarks and the two corresponding inputs to production.
This revision also incorporates new physical product indicators for five industries.
(1) Aluminum foundries (NAICS 331521,4)
(2) Machine tools (333512,3)
(3) Engine manufacturing (333618)
(4) Mattress manufacturing (33791)
(5) Book publishing (51113)
Previously, these industries were combined with other industries in single IP indexes and then estimated from production-worker hours. The additional series raise the total number of individual output indexes that make up industrial production to 300.
Aluminum foundries (NAICS 331521,4) were formerly grouped with other nonferrous foundries in a single IP index based on production-worker hours. For 1992 and forward, this revision establishes separate indexes for aluminum foundries and for other nonferrous foundries. The production indicator for the new index for aluminum foundries is a value-weighted aggregate of quarterly shipments of dies, permanent molds, sand castings, and other castings, for which the underlying data are obtained from the Aluminum Association. These data are available from 1994 forward; the indexes for 1992 and 1993 are estimated based on hours. Other nonferrous foundries (331522, 5, 8) is now a separate index based on production-worker hours.
Machine tools (metal cutting and forming machinery, NAICS 333512,3) were formerly grouped with other metalworking machinery in a single IP index based on production-worker hours. For 1992 and forward, this revision introduces a new index for the machine tool industry that is based on quarterly shipments data from the Census Bureau's Current Industrial Report on Metalworking Machinery (MQ333W). This report covers a variety of machine tools, including boring and drilling machines; gear-cutting machines; grinding and polishing machines; lathes; milling machines; machining centers; punching, shearing, bending, and forming machines; and presses. Both unit and revenue measures for shipments are used to construct a Fisher index of real shipments. An estimate of the change in inventories is then added to the shipments index to compute a production index. Manufacturers are assumed to want to hold inventories proportional to their expected shipments. The estimate of inventory change is computed as the sum of three components: a trend rate of stockbuilding; a portion of the adjustment to inventories that a manufacturer would need to make in order to reach a desired inventory level; and the impact on stocks of shipments not equaling expected shipments. Other metalworking machinery (333511, 4, 5, 6, 8) is now a separate index based on production-worker hours.
Engines (NAICS 333618) were formerly grouped with power transmission equipment in a single IP index based on production-worker hours. For 1992 and forward, engines and power transmission equipment are separate indexes. The production indicator for the new index for engines is monthly diesel engine assemblies from Stark Communications, Inc. The remainder of the previous grouping--speed changers, drives, gears, and power transmission equipment (NAICS 333612,3)--is now a separate index and is still based on production-worker hours.
Mattresses (NAICS 33791) were formerly grouped with blinds and shades (33792) in a single IP index called "Other furniture related product," and estimates were based on production-worker hours. Under the current revision, mattress production for 1987 and forward is based on monthly unit sales data for mattresses and foundations from the International Sleep Products Association. The blinds and shades index continues to be based on production-worker hours.
Book publishing (NAICS 51113) was formerly grouped with other publishing operations except newspapers (51112, 4, 9) in a single index called "Periodical, book and other publishers." For 1987 and forward, book publishing is estimated separately from the other publishing operations. A Fisher index of real sales is constructed from sixteen separate categories of books and used as the indicator for the book publishing series. The underlying data, monthly gross revenue for book sales from the Association of American Publishers, are deflated by detailed producer price indexes from the Bureau of Labor Statistics. The new index for periodicals and other publishers is based on production-worker hours.
The new physical-product-based production indexes constituted 1.4 percent of IP in 2003. The table below summarizes the type of data (measured as a percent of value added in 2003) available in each month of the four-month IP publication window.
| Month of estimate | ||||
|---|---|---|---|---|
| Type of Data |
1st | 2nd | ||
| 3rd | 4th | |||
| Physical product | 26.1 | 40.8 | 49.9 | 50.1 |
| Production-worker hours | 34.7 | 34.7 | 34.7 | 34.7 |
| Electric Power Use | 0.0 | 11.7 | 11.7 | 11.7 |
| IP data received | 60.8 | 87.2 | 96.4 | 96.6 |
| IP data estimated | 39.2 | 12.8 | 3.6 | 3.4 |
The first estimate of output for a month is preliminary and is subject to revision in each of the subsequent three months as new source data become available. As the table indicates, by the third revision (fourth month of estimate), the physical product content of IP is 50.1 percent.
The revision incorporates refined methods for a few series. The coverage was broadened for some of the motor vehicles parts series to include more information for engines, brakes, transmissions, and axles. This revision also includes new methods for the production indicator for electronic computers; the new estimates incorporate a refined concordance between trade data from the Census Bureau and the source data for computer sales.
LAN Equipment
The 2000 revision introduced a new IP series for the production of local area network (LAN) equipment (routers, switches, and hubs). The series is not published in the monthly statistical release, but it is included in the broader IP aggregate for communications equipment and updated on an ongoing basis (see the March 2001 Bulletin article). The table below updates the results for LAN equipment.
| Production | Price | Value of Production | |
|---|---|---|---|
| Period | Index | Index | Millions of dollars |
| Annual Estimates. Indexes are 1997=100 |
|||
| 1997 | 100.0 | 100.0 | 12,935.4 |
| 1998 | 153.2 | 72.2 | 14,329.5 |
| 1999 | 223.0 | 59.1 | 17,138.9 |
| 2000 | 303.5 | 52.5 | 20,732.7 |
| 2001 | 357.9 | 41.2 | 19,205.4 |
| 2002 | 366.6 | 32.8 | 15,635.1 |
| 2003 | 412.5 | 25.4 | 13,549.1 |
| Quarterly Estimates. Indexes are 1997=100 |
|||
| 1997:Q1 | 77.7 | 108.0 | 10,767.2 |
| 1997:Q2 | 88.8 | 97.4 | 11,634.7 |
| 1997:Q3 | 109.2 | 97.5 | 13,824.5 |
| 1997:Q4 | 124.3 | 97.9 | 15,423.2 |
| 1998:Q1 | 136.7 | 80.2 | 14,120.6 |
| 1998:Q2 | 154.8 | 71.1 | 15,041.5 |
| 1998:Q3 | 160.7 | 67.6 | 14,009.2 |
| 1998:Q4 | 160.7 | 69.7 | 14,191.5 |
| 1999:Q1 | 212.4 | 61.6 | 16,984.3 |
| 1999:Q2 | 225.2 | 56.3 | 17,383.2 |
| 1999:Q3 | 224.4 | 59.8 | 17,086.5 |
| 1999:Q4 | 229.8 | 58.6 | 17,138.6 |
| 2000:Q1 | 262.8 | 54.4 | 18,692.5 |
| 2000:Q2 | 304.4 | 49.8 | 20,542.1 |
| 2000:Q3 | 322.9 | 53.5 | 21,751.7 |
| 2000:Q4 | 323.8 | 52.7 | 21,853.8 |
| 2001:Q1 | 391.3 | 43.1 | 22,253.4 |
| 2001:Q2 | 336.8 | 42.2 | 18,933.4 |
| 2001:Q3 | 340.3 | 41.6 | 17,741.7 |
| 2001:Q4 | 363.4 | 38.0 | 17,938.4 |
| 2002:Q1 | 353.9 | 34.5 | 16,381.3 |
| 2002:Q2 | 360.0 | 33.5 | 16,034.4 |
| 2002:Q3 | 382.2 | 33.1 | 15,683.9 |
| 2002:Q4 | 370.2 | 30.2 | 14,438.5 |
| 2003:Q1 | 374.3 | 26.5 | 13,514.5 |
| 2003:Q2 | 400.6 | 27.0 | 14,365.4 |
| 2003:Q3 | 434.5 | 26.2 | 13,993.9 |
| 2003:Q4 | 440.7 | 21.7 | 12,336.1 |
Changes to Individual Capacity Series
The revision to the capacity indexes employs updated information for the publishing industry, for which there had been a gap in the collection of operating rates. Through 1998, the Survey of Plant Capacity (SPC), which covers the manufacturing sector, was conducted under the Standard Industrial Classification (SIC) system. The SIC system included the publishing industry in the manufacturing sector. In 1999, the SPC began to be conducted under NAICS, which excludes the publishing industry from the manufacturing sector. In 2002, the Census Bureau recommenced collection of publishing industry data under the SPC. The release of the 2003 SPC provided the Federal Reserve Board with two consecutive data points for the publishing industry and enabled the interpolation of industry information for the missing years 1999-2001.
The revisions to the capacity indexes also incorporate the Bureau of Economic Analysis's capital flow table for 1997. This table provides a detailed breakdown of the asset composition of industry investment. The Federal Reserve uses the capital flow table to estimate annual asset-by-industry investment flows--which is the first step in constructing measures of industry capital input. Before the current revision, the Federal Reserve used data for thirty-five asset categories; this revision adds a thirty-sixth, software investment.
Finally, the capacity series for semiconductors was split into two components. One covers microprocessor units (MPUs) and the other covers non-MPU semiconductors, such as memory, logic, and integrated circuit chips.
Weights for Aggregation
The IP index is an annually weighted Fisher index. This revision uses information from the Census of Manufactures to obtain updated estimates of the industry value-added weights used in the aggregation of IP indexes and capacity utilization rates. The Federal Reserve derives estimates of value added for the electric and gas utility industries from annual revenue and expense data issued by other organizations. The weights for aggregation, expressed as unit value added, were estimated using the latest data on producer prices. Table 10 shows the annual value-added proportions incorporated in the IP index from 1996 through 2003.
Revised Monthly Data
This revision incorporates product data that become available after the regular four-month reporting window for monthly IP has closed. One example is the data on wine and tobacco issued by the Department of the Treasury's Alcohol and Tobacco Tax and Trade Bureau. These data are released with too great a lag to be published with monthly IP estimates; however, the data are available for inclusion in the annual revision.
Revised Seasonal Factors
Seasonal factors for all series were reestimated using data that extend into 2004. Factors for production-worker hours, which adjust for timing, holiday, and monthly seasonal patterns, were updated with data through September 2004 and were prorated to correspond with the seasonal factors for hours aggregated to the three-digit NAICS level. Factors for the electric power series were reestimated using data through June 2004. The updated factors for the physical product series, which include adjustments for holiday and workday patterns, used data through at least September 2004. Seasonal factors for unit motor vehicle assemblies have been updated, and projections through June 2005 are on the Board's web site.
G.17 Revision Release Tables:
| Chart 1 | Total industrial production, capacity, and utilization | |
| Chart 2 | Manufacturing industrial production, capacity, and utilization | |
| Chart 3 | Industrial production and capacity utilization | |
| Chart 4 | Consumer goods | |
| Chart 5 | Equipment, total | |
| Chart 6 | Nonindustrial supplies | |
| Chart 7 | Industrial materials | |
| Chart 8 | Capacity utilization by stage of process | |
| Ascii | Screen reader | Table 1A:Industrial Production: Total |
| Ascii | Screen reader | Table 1B: Capacity and Utilization: Total |
| Ascii | Screen reader | Table 2:Rates of Change in Industrial Production, Market and Industry Group Summary: 2000-2004 |
| Ascii | Screen reader | Table 3:Rates of Change in Industrial Production, Special Aggregates and Selected Detail:2000-2004 |
| Ascii | Screen reader | Table 4:Revised and Earlier Capacity Utilization Rates, By Industry Groups |
| Ascii | Screen reader | Table 5: Rates of Change in Capacity, By Industry Groups: 2000 to 2004 |
| Ascii | Screen reader | Table 6: Rates of Change in Electric Power Use: 2000 to 2004 |
| Ascii | Screen reader | Table 7A: Industrial Production: Manufacturing |
| Ascii | Screen reader | Table 7B: Capacity and Utilization: Manufacturing |
| Ascii | Screen reader | Table 8A: Industrial Production: Total Industry Excluding Selected High-Technology Industries |
| Ascii | Screen reader | Table 8B: Capacity and Utilization: Total Industry Excluding Selected High-Technology Industries |
| Ascii | Screen reader | Table 9A: Industrial Production: Manufacturing Excluding Selected High-Technology Industries |
| Ascii | Screen reader | Table 9B: Capacity and Utilization: Manufacturing Excluding Selected High-Technology Industries |
| Ascii | Screen reader | Table 10: Annual Proportion in Industrial Production, Market and Industry Group Summary |
Release dates | Historical data | Documentation
Current Monthly Release Other formats: ASCII | PDF (144 KB)
Supplemental Monthly Release Other formats: ASCII | PDF (144 KB)
Annual Revision Release Other formats: ASCII | PDF (150 KB)