Credit Line Use and Availability in the Financial Crisis: The Importance of Hedging*
Keywords: Credit lines, financial crisis, liquidity management, hedging.
Abstract:
1 Introduction
Credit lines are the most common source of bank lending and liquidity management for many corporations. In the recent financial crisis firms became increasingly wary of banks' ability to honor credit line agreements. One possible response of firms with credit lines to such doubts was to draw on credit lines and hoard cash to be able to capitalize on investment opportunities. Aggregate figures and anecdotal evidence suggest that some firms drew down their credit lines though little is known about who the credit line users during the financial crisis were. A common challenge in identifying the effect of credit market conditions on credit line drawdowns is that observed decreases in unused commitments may be the result of supply or demand factors. For example, bank level data from Call Reports are insufficient to estimate the decline in credit availability because a reduction in unused commitments reported by banks can either indicate a credit line drawdown or a credit line cancelation. To fully grasp credit demand during the crisis, one also has to understand the extent to which firms decide not to use their credit facilities, for instance, to avoid paying soaring interest rates on floating interest rate debt. Another possibility for a reduction in firm credit is a restricted access to credit facilities due to the breach of debt covenants, such as cash flow or leverage restrictions. The impact of such covenants and the extent to which they restricted the availability of credit lines during the last financial crisis is still unknown.
Regarding policy implications, disentangling supply and demand effects of corporate credit line use is relevant in the context of new liquidity requirements for banks under Basel III, and for designing appropriate weights for unused credit line commitments in capital regulation. Furthermore, understanding credit line behavior is important in assessing the effectiveness of policy responses to the crisis as such an analysis sheds light on firms' credit constraints and thereby on the reasons for missed investment opportunities during the crisis.
This paper uses detailed quarterly firm level data that allow us to separate supply and demand effects of credit line usage during the financial crisis. The paper makes several contributions to the literature on corporate credit lines: First, we document new facts about the use of credit lines during the recent crisis. Second, to capture supply effects, we distinguish the unused portion of credit line commitments, which is reported in bank balance sheets and commonly used as a measure of bank lending capacity, from the available portion of the credit line--the maximum a firm can draw down-- which can be lower than the unused portion due to debt covenants. We call this reduction in credit line availability the "covenant channel" and study its magnitude, and the type of firms that were affected by it. Third, we turn to credit demand and ask what determined credit line use during the crisis. In particular, since credit lines have floating interest rates, we assess the importance of the "interest rate risk channel"--that is, the cost of credit line use that varies due to floating interest rates--by studying whether firms that hedged credit line interest rate risk prior to the crisis were more likely to draw on their credit lines during the crisis. Last, we test whether hedging credit line interest rate risk mitigates covenant-induced available credit line reductions.
We are not the first to look at credit lines or their usage during the financial crisis of 2007-09. However, our data and approach are different. Rather than relying on survey data or anecdotal information on credit line use, we employ information from regulatory filings. Recent work by Ivashina and Scharfstein (2010) documents the behavior of corporate credit during the financial crisis and provides anecdotal evidence from firms that drew on their credit lines due to their concerns about banks' ability to provide liquidity in the future. Another study on credit line drawdowns during the crisis, which relies on survey data is Campello, Giambona, Graham and Harvey (2011). These author find that "constrained" firms were more likely to draw on their credit lines in the recent financial crisis. In a previous paper, Campello, Graham, and Harvey (2010), using the same survey, find a strong effect of financing constraints tied to credit lines on investment.
In contrast to these studies, which could be affected by selective reporting or survey response biases, we construct a comprehensive panel of 600 randomly sampled COMPUSTAT firms. We use quarterly data from 2006:Q1 to 2011:Q1. In other words, our dataset spans the pre-crisis, the crisis, and the post-crisis periods. Moreover, to our knowledge, we are the first to use hand-collected data from firms' regulatory filings to quantify the covenant channel, the interest rate risk channel and the extent to which each channel can explain credit line usage. Regulatory filings (10-Ks and 10-Qs) generally include information on credit contracts, such as terms of credit, total amount of credit lines, and the used, unused and the available portion of credit facilities. When a firm violates a debt covenant, it sees an immediate reduction of their available portion, and must disclose this information and report the amount available. Therefore, our dataset contains firms that have a credit line but are not able to fully access it.
A specific example helps to clarify the difference between unused and available portion of a credit line. The 2007 10-K of IEC Electronics Corp. states that: "..., IEC has a line of credit with a maximum borrowing limit up to $6.0 mill based upon advances on eligible accounts receivable and inventory." Hence, the unused portion is $6 mill less the used portion. However, according to IEC's 10-K, the base formula for the available portion is the minimum of (1) $6 mill less the used portion and (2) 0.85*accounts receivable+0.35*inventory less the used portion. Cash flow and leverage based formulas are also common. In other cases, the available portion is reduced by outstanding letters of credit or by the use of commerical paper facilities.
Another advantage of using regulatory filings over what is commonly used in the literature, Dealscan data, is that we can keep track of drawdowns or reductions in credit line availability due to covenant restrictions. This is not possible with the Dealscan database because it provides information on loan originations but not on credit line use or availability.1 We also collect information from regulatory filings on whether a firm uses derivative instruments--such as interest rate swaps--to fix the floating interest rate on the used part of its credit line. To be precise, we only look at a very specific subset of all possible derivative contracts a firm may utilize. The criterion that we employ to identify differences in the cost of credit line use is whether a firm states explicitly that it holds the derivative to hedge the credit line interest rate risk.
It seems clear then that credit lines are not fully committed but rather contingent as debt covenants can restrict access to them. Firms attempt to avoid covenant violations, at least those tied to cash flows, by using cash flow hedging (Holmström and Tirole, 2000). More recently, Disatnik, Duchin, and Schmidt (2010) argued that by smoothing cash flows, and therefore, by reducing the likelihood of covenant violations, cashflow hedging increases the firm's reliance on credit lines. We study the magnitude of this covenant channel during the crisis by distinguishing the unused portion of a credit line from the available portion. Our main point, however, differs. We argue that a crucial mechanism driving credit line usage during the crisis is the interest rate risk channel. To quantify our proposed channel, we focus on firms that specifically hedged credit line interest rate risk prior to the crisis. During the crisis, hedged firms faced significantly less uncertainty about the cost of credit line use. Relative to unhedged firms, hedged firms were able to meet their interest rate payments for higher realization of the indexed interest rate, typically the LIBOR, in the (near) future. Hence, theory suggests that hedged firms were more likely to make use of their credit facilities in uncertain interest rate environments.
Using our dataset, we confirm previous work documenting significant drawdowns after the failure of Lehman and AIG. Beyond that, we establish a novel fact: firms had already started to draw on their credit lines more intensely in 2007, when funding pressures for banks increased.2 These early drawdowns were not driven by firms that substituted away from commercial paper issuance. In fact, we do not find significant drawdowns from credit lines that back up commercial paper facilities. We also find that, during the crisis, credit supply--measured as credit line availability--exhibits only a small decline. This decline is concentrated in firms that entered the crisis with weak financing prospects. Consistent with the covenant channel proposed by Disatnik, Duchin, and Schmidt (2010), our results indicate that covenants are less likely to bind for firms that hedged their credit facility interest rate risk. However, the effect, which accounts for 11.1 percentage points of the credit line at the 10th percentile of the credit line availability distribution, is economically small when considering the full sample.
On the demand side, our regression analysis confirms that smaller firms, and non-investment grade firms are more likely to draw on their credit lines. Similarly, firms with more cash, higher cash-flows, and higher market-to-book values are less likely to draw on their credit lines. Firms that hedged their credit facility interest rate risk exhibit significantly higher use of their credit lines. During the crisis period, having an interest rate swap for the credit facility accounts for an additional drawdown of up to 6.4 percentage points, which we attribute to uncertainty about the future cost of funding--the interest rate risk channel--during bad economic times. Our evidence suggests that, among hedged firms, highly-rated firms were more likely to draw down their credit lines in the crisis period. We estimate that highly-rated firms' additional drawdowns due to hedging are up to 20.8 percentage points of the total credit line. We also study firms that changed their hedging activity status and became swap users during our sample period. For those firms, we find that the change in credit line use is particularly pronounced. Therefore, hedging interest rate risk exposure associated with credit facility has benefits beyond the reasons previously suggested in the literature.
The paper is organized as follows. Section 2 briefly reviews the literature on credit lines and hedging. In section 3 we describe the data collection process. Next, we present summary statistics and report stylized facts in section 4. The regression framework and the main results are presented in section 5. Section 6 concludes.
2 Credit Line Use and Hedging
This section provides a brief review of the theoretical and empirical literature that motivates our analysis. We first discuss credit lines and then focus on hedging in the context of credit lines.
2.1 Credit Lines - Theory and Evidence
The key rationale for firms to have credit lines in the theoretical literature is the ability to insure against liquidity shocks. Specifically, a firm may need liquidity in states of the world in which a firm has insufficient cash flow either to continue a current project--for instance, the firm is unable to pay for intermediate goods or the wage bill--or to realize new investment opportunities. In such an environment, credit lines can be efficient (Boot, Thakor, and Udell (1987), Holmström and Tirole (1998), and Thakor (2005)).3
The insurance motif was formalized by Boot, Thakor, and Udell (1987) who model credit lines as a fixed interest rate liquidity put. In this model, firms in need of liquidity can "hedge" against high interest rates by having a fixed interest rate credit line for which they pay banks an upfront commitment fee. More recently, Thakor (2005) and Acharya, Almeida, and Campello (2010) have proposed models in which a large portion of firms draw on their credit lines simultaneously. Thakor (2005) argues that credit lines insure against credit contractions and that overlending may occur in times when debt covenants are not binding. Archarya, Almeida, and Campello (2010) study the trade-off between holding cash and having a credit line. They argue that "systematic" firms, which all demand liquidity at the same time, are more likely to hold cash as banks would not be able to provide sufficient liquidity for all of them simultaneously. This second mechanism then gives a rationale for companies to hold cash. Demiroglu and James (2011) provide a review of the evidence on the importance of credit lines on liquidity management.4
The empirical evidence suggests that credit lines are widely used by firms to manage their liquidity needs. For instance, Shockley and Thakor (1997) document that most of the U.S. commercial bank lending to corporations is done via bank loan commitments. More recently, the literature has focused on the determinants of credit line use. Mian and Santos (2011), using data from the Shared National Credit program, document the cyclical behavior of credit line use and refinancing decisions. Sufi (2009) argues that while lines of credit are a liquidity substitute for firms with high cash flow, low cash flow firms rely more on cash as credit lines covenants are tied to cash flow. Demiroglu, James, and Kizilaslan (2009), collecting data on bank lines of private firms and using Sufi's sample of publicly listed companies as comparison, show that tight credit conditions reduce access to credit more for privately held firms. Campello, Graham, and Harvey (2010) use a CFO survey with responses from 31 countries. They assess the effect of financing constraints on investment, where credit constraints are dummy variables constructed from firms reporting being affected by quantity constraints or price constraints. Their results indicate a strong effect of financing constraints on investment. Campello et al. (2011) and Campello et al. (2012), using the same survey, find that "constrained" firms (small, private, non-investment grade, and unprofitable) were more likely to draw on their credit lines in the recent financial crisis. This study, which relies on firm information at two points in time, also concludes that constrained firms faced somewhat less favorable conditions for credit line renewal. Montoriol-Garriga and Sekeris (2009) and Huang (2010) exploit the Federal Reserve's Survey of Terms of Business Loans to argue that there was a run on credit lines in the financial crisis.
2.2 Hedging and Credit Lines
There is a large body of theoretical and empirical literature that studies why firms hedge. On the theory side, Stulz (1984) and Smith and Stulz (1985) suggest that hedging helps corporations reduce bankruptcy costs. Hedging may also help reduce underinvestment costs when external funds are costly, by providing capital during low cash flow states (Froot, Scharfstein and Stein, 1993). The empirical literature generally finds positive effects of hedging on risk management and debt capacity (for example, Graham and Rogers (2002) and Guay and Kothari (2003)). Unlike the vast corporate hedging literature, there are very few studies on the effects of interest rate risk hedging on the use and availability of credit lines. So far, this literature has focused on cash flow hedging because debt covenants featuring cash flow targets may restrict the use of a firm's credit line. The possibility of cash flow hedging in the context of liquidity provision was first been studied by Holmström and Tirole (2000). More recently Disatnik, Duchin, and Schmidt (2010) model the fact that credit lines are not fully committed but rather contingent as debt covenants, such as cash flow or leverage restrictions, can reduce the access to credit lines (Nini, Smith, and Sufi (2009), Sufi (2009) and Huang (2010)).5 They argue that firms hedge their cash flow to maintain access to their credit line. In other words, firms hedge to render the covenant channel irrelevant. Their empirical analysis shows that cash flow hedging firms rely more on credit lines, measured as total credit line size, and less on cash.
To our knowledge, there is no empirical evidence on our proposed interest rate risk channel. Campello, Graham, and Harvey (2010) provide survey evidence that the surging interest rates were a constraint in the crisis, but they do not assess this channel separate from quantity constraints or renewals. An early formalization of the interest rate risk channel can be found in Boot, Thakor, and Udell (1987). However, contrary to the empirical evidence, Boot, Thakor, and Udell (1987) assumed that credit lines bear a fixed interest rate and not a floating rate.
3 Data
This section first describes the sampling methods and data sources. We then provide a discussion of the sample properties and summary statistics.
3.1 Data Collection Process
We use two data sources: COMPUSTAT and regulatory filings (10-Ks and 10-Qs). The selection criterion for the universe of COMPUSTAT firms is that the firm was in operation in 2006:Q1 and in 2008:Q3 and was not an agricultural, utility, or financial service company. We stratify the remaining firms by industry and size to ensure proportionality of our sample. We then randomly sample a total of 600 firms in 75 strata. We use the company's name and tax number to obtain the 10-Ks and 10-Qs for each firm from 2006:Q1 to 2011:Q1.
To identify credit line users, we conduct a key word search in the regulatory filings. Specifically, we search for"credit facility," "credit facilities," "credit line," "credit lines," "line of credit," "lines of credit," "loan facility," "loan facilities," "revolving facility," "term loan," and "term loans." We then read the respective paragraphs to extract the relevant information on credit lines and their use.6 Firms incur fees on the unused portion of their facility or on the total commitment. Some firms will incur a fee if they terminate the agreement prior to the maturity date.
A typical credit line contract includes debt covenants in the form of requirements on maximum leverage, minimum profitability and quality of collateral (the most common being receivables and inventories). In some cases, there are also material adverse change (MAC) provisions allowing the lender to terminate the loan agreement if the borrower experiences material changes in its financial conditions. These provisions are subject to legal interpretation, and invoking them usually leads to litigation.7
The most common interest rates on credit lines are a bank's prime rate or the 1 or 3 month LIBOR. Margins on LIBOR are higher than margins on prime rates. After the crisis, many (re-)negotiated lines have minimum interest rates or LIBOR/prime floors. The most common covenant violations are failure to submit the SEC filings on time, minimum EBITDA violations, collateral and cash flow violations, and leverage ratio violations. Generally, after a violation of covenant(s), firms also experience an increase in the LIBOR/prime margin, and the banks will waive the violation and modify the covenants. If a firm experiences violations over several quarters, they will either enter into a Forbearance agreement and negotiate another line, possibly with another bank, or stop borrowing from existing credit lines. There are times when a company will not violate a covenant, but if they exceed a maximum ratio or fall below a minimum, restrictive covenants will become binding and limit their borrowing capacity.
The firm level data extracted from regulatory filings consists of the total amount of the credit facility, the amount drawn, the remaining unused amount, the amount available, and covenant violations as well as the terms of credit described above (interest rate, maturity, unused commitment fees, and, in some cases, the lender).
Next, to identify credit line interest rate hedgers we extend our key word search. We require that one of the following strings appears within 1,500 characters around one of the key words in the paragraph above: "interest rate agreement," "interest rate agreements," "interest rate exchange agreement," "interest rate exchange agreements," "interest rate hedge," "interest rate hedges," "interest rate swap," or "interest rate swaps." We then again read the respective paragraphs to ensure that the firm explicitly states that the hedging activity is related to the credit facility. We note that the number of firms that are engaged in some hedging activity is significantly higher than the number of firms hedging credit line interest rate risk. In fact, the proximity requirement reduces the number of firms with positive search results on the hedging key words by about 70 percent. For the purpose of identifying the interest rate risk channel of credit demand, measured as credit line usage, only credit line interest rate hedges are relevant. In our sample, 110 firms state hedging activity related to their credit lines. In 12 cases, interest rates swaps were a requirement of the original credit agreement (mandatory hedging).
We complement our database with variables from COMPUSTAT. As additional controls in our analysis we add cash, cash and short term investments, credit ratings, long and short term debt measures, equity, total assets, total debt, total expenses, total revenue, and working capital.
3.2 Sample Summary Statistics
Table 1 summarizes the firm characteristics we use in our empirical analysis and the firm characteristics in the whole COMPUSTAT uniserve. Such firm characteristics include size, leverage, cash holdings, cash flows, profits, and asset tangibility. We measure firm size using both, total assets and total revenues, in millions of dollars. Comparing our sample, shown in the top panel of table 1, with the COMPUSTAT universe in the bottom panel, we find that our sample is representative. Total assets for the average firm are about $3.4 billion, whereas total assets for the median are less than $500 million. Firm leverage is measured by the ratio of total debt to total assets. Consistent with previous work using COMPUSTAT data, on average, firms in our sample have a leverage ratio of about 20 percent, and a market-to-book ratio (defined as book value of liabilities plus market value of equity divided by book value of liabilities plus book value of assets) of about 1.91. Table 1 also shows a widespread use of credit lines for firms in our sample. About 75 percent of firms in our sample have a credit line. On average, the ratio of credit line to total assets is 20 percent, relatively similar to the cash ratio, and larger than the cash flow ratio.8
4 Credit Line Usage of Non-financial Firms during the Crisis
This section presents novel facts about credit line drawdowns during the crisis. First, we examine whether there are differences by firm size. We then provide evidence that disruptions in the asset-backed commercial paper market did not affect credit line usage by non-financial firms. Last, we document credit line usage by firms' hedging decisions.
4.1 Drawdown Patterns
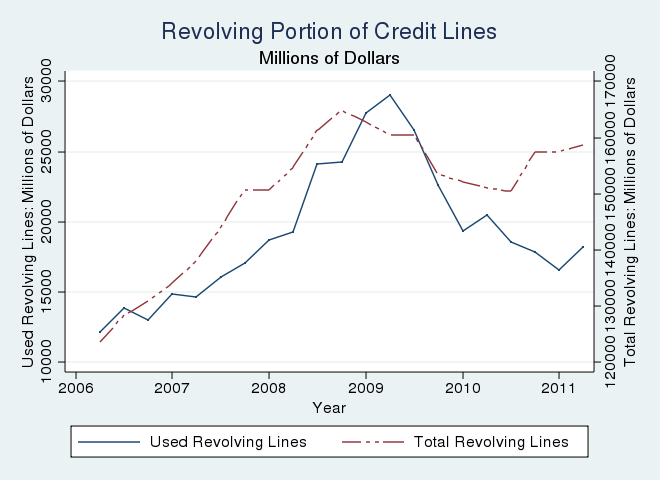
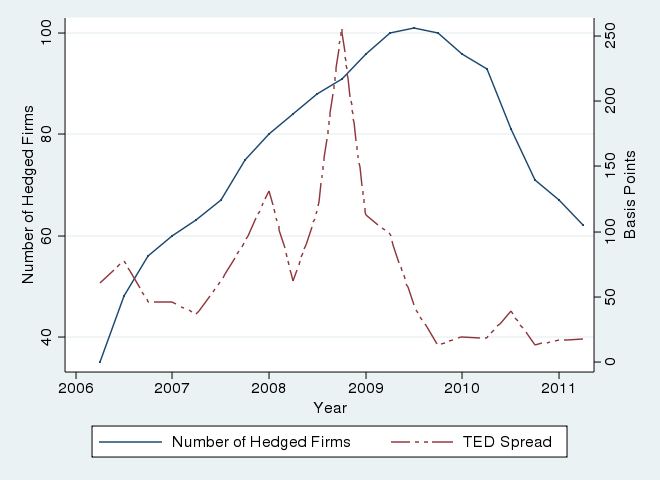
Figure 1 shows the revolving portion of credit lines over all firms in our sample.9 The revolving potion of credit lines refers to the amount that firms can draw down, repay and continue drawing down during the term of the facility. Most of the credit lines in our sample are composed of revolving lines. As previously documented in the literature, there was a significant increase in the usage of revolving lines of credit during the financial crisis. More specifically, as shown in the upper panel of figure 1, credit line usage (the blue line) increased significantly after the Bear Sterns failure in March 2008, spiked after the collapse of Lehman, and reached a peak during the first quarter of 2009, right before the results of the stress tests for large BHCs were announced. Interestingly, however, our data suggest that significant drawdowns occurred earlier. Firms started to tap their revolving credit lines during the first half of 2007 and continued to increase credit line usage after the beginning of the financial panic in short-term funding markets (August 2007). Credit line usage in our sample increased about $14 billion, an increase by almost 100 percent, between 2007 and mid-2009. Total revolving lines of credit (red line) followed a similar pattern. They went up by $35 billion during the same period, with almost all of the increase occurring in 2007.
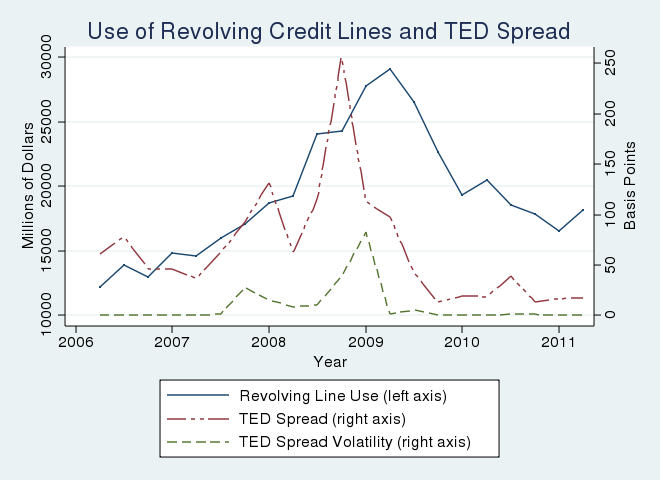
The lower panel of figure 1 compares revolving credit line usage with a common measure of funding pressures on banks, the TED spread (difference in yield between LIBOR and a Treasury Bill of similar maturity) and its 3-month standard deviation. There is a strong and positive correlation between drawdowns and both measures of uncertainty in the bank funding market (a correlation coefficient of 0.37 with TED spread and 0.48 with the 3-month standard deviation of the TED Spread). Moreover, the increase in the TED spread and its volatility seems to predate the use of revolving lines of credit, which suggests that firms decided to draw on their revolving credit lines in response to the uncertainty created by disruptions in short-term funding markets for banks. This fact is consistent with the anecdotal evidence in Ivashina and Scharfstein (2010), which shows that at least some firms drew on their credit lines in anticipation of potential inability of banks to fund their commitments. After policy interventions, the TED spread returned to pre-crisis levels, reducing uncertainty about its future behavior. The sucess of policy intervention in reducing uncertainty about future bank funding may explain why many firms appear to have paid off their revolving credit lines, as indicated by the sharp contraction in credit line usage after 2009:Q2.
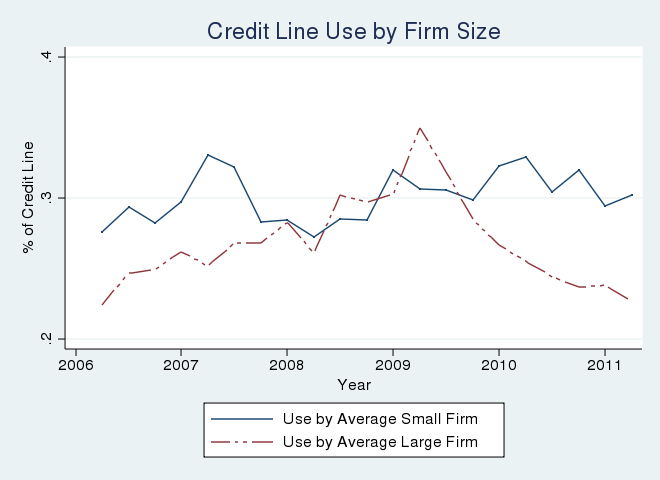
Figure 2 shows credit line use and availability by firm size. Small and large firms exhibit different patterns in the use of credit lines (upper panel). Throughout most of the sample period, on average, large firms use less of their credit lines (24 percent) compared with small firms (29 percent). Credit line use increased for both types of firms during the financial crisis, though the rise is more pronounced for large firms. Large firms accelerated drawdowns of their credit lines and the share of drawn commitments increased from about 24 percent during 2008:Q1 to about 30 percent in the fall of 2008, when financial markets experienced a severe disruption following the failures of Lehman and AIG, and the conservatorship of the Government-Sponsored Enterprises (GSEs). The use of credit lines for large firms reached a peak of 32 percent in the first quarter of 2009, and then declined steadily. In contrast, small firms continued drawing down funds from their existing lines even after the end of the recession (2009:Q2) and their use reached a peak of 32 percent by the end of 2009.
This evidence is consistent with previous findings on the use of credit lines during the recent financial crisis. First, corporations were increasingly drawing down funds from their committed credit lines, especially after September 2008 (Ivashina and Scharfstein, 2010). Second, constrained firms (small, private, non-investment grade, and unprofitable) are more likely to draw down their credit lines in general (Campello et al., 2011). However, in contrast with Campello et al. (2011), in the crisis we see increased use by large firms. A possible explanation for this distinct behavior is that compared with large firms, small ones faced harder liquidity pressures and higher constraints. Larger firms may have been in a better financial position to repay their credit lines soon after interest rates plunged and bond markets returned to normality, providing alternative funding sources again.10
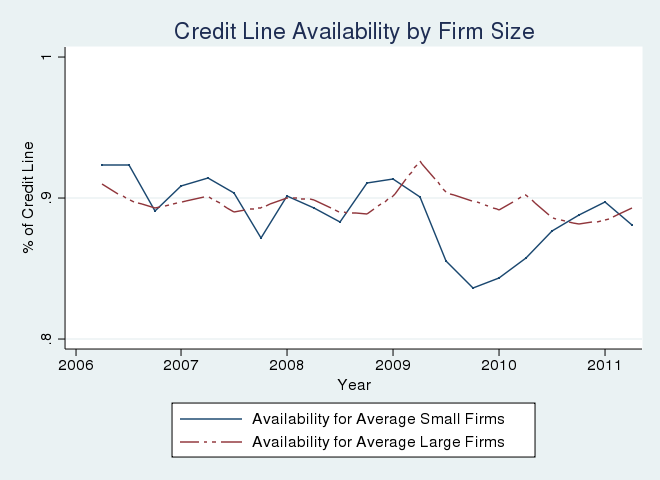
In fact, small firms appear to have been more constrained than large firms, as measured by the credit line availability to total credit line ratio (figure 2, lower panel). Large firms had higher availability, even at the height of the financial crisis (90 percent on average), whereas small firms faced tighter restrictions as their availability dropped from 90 percent before the crisis to 83 percent after the crisis. In sum, we find increased credit line use by large firms and tighter constraints for small firms.
4.2 The Usage of Commercial Paper Facility Back up Lines
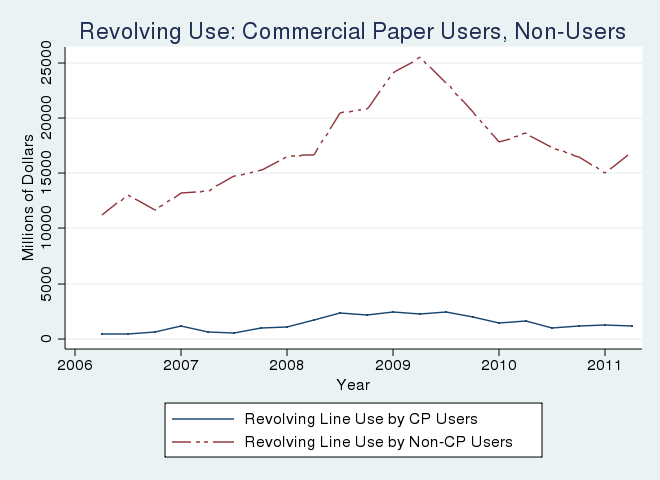
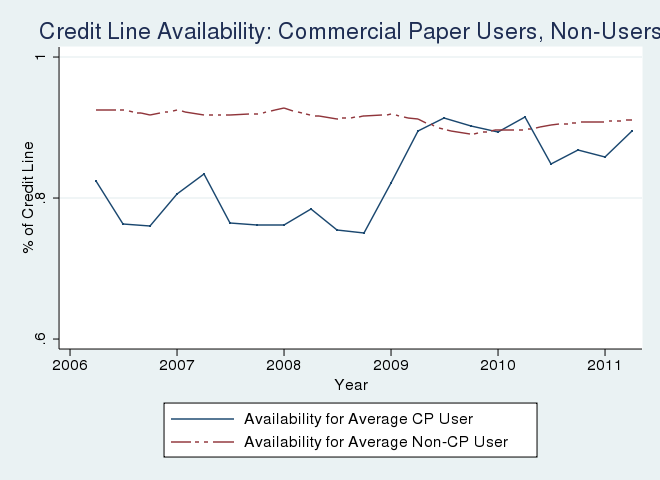
One possible explanation for the drawdown behavior, especially of large firms, is that the disruption of the asset-backed commercial paper (ABCP) market, which is dominated by financial firms, affected non-financial firms' ability to issue commercial paper.11 Gatev and Strahan (2006) suggest that in such a case firms substitute away from commercial paper to drawing on the credit lines that back up commercial paper facilities. If disturbances in the commercial paper market reduced the ability of firms to issue commercial paper and firms therefore tapped their credit lines, we should see an increase in credit line usage and availability for commercial paper issuing firms. However, the upper panel of figure 3 shows that non-financial firms with commercial paper programms did not significantly increase drawdowns during the crisis.12
Issuing commercial paper reduces credit line availability, in most cases exactly by the amount of commercial paper issuance. The lower panel of figure 3 shows that credit line availability increased for firms with commercial paper programs after the Lehman failure, suggesting that they were either not able or not willing to roll over their short-term commercial paper. Despite this increased availability, the fact that there was not a significant increase in the credit line use of commercial paper issuing firms suggests that these firms reduced their demand for commercial paper. Such lower demand seemed to have occurred in the context of a recession, and even when interest rates were historically low. In sum, both panels together suggest that despite the increased availability of credit lines for commercial paper issuing firms, there was no run on commerical paper facility back up lines by non-financial firms. In fact, firms without commercial paper facilities account for most of the credit line drawdowns during the crisis.
4.3 Credit Line Use, Credit Line Availability, and Interest Rate Hedging
Table 2 reports some descriptive statistics for the firms in our sample grouped by their decision to hedge their interest rate exposure. A univariate comparison of key firm characteristics between hedgers and non-hedgers shows some obvious differences between the two groups.13 Hedged firms are much larger in terms of their total assets and their total revenues. The total assets of the median hedged firm ($1,336 million) are almost three times that of the non-hedged firm ($489 million). The median hedged firm's revenue ($268 million) is more than double that of the non-hedged firm ($113 million). Hedged firms are more levered than their non-hedged counterparts. Leverage for the median hedged firm (40 percent) is twice as large as the leverage of the non-hedged firm (21 percent). Hedging activity is concentrated in a few sectors. In particular, more than 10 percent of firms in mining, manufacturing, retail trade, and specialized services hedged credit line interest rate risk.
Using the comparison between the hedged and non-hedged firms, table 2 also confirms previous findings in the literature on the trade-off between cash holdings and the use of credit lines in the presence of hedging. Having access to more funds from credit facilities, hedged firms also depend less on cash holdings. The cash-to-assets ratio is only 4 percent for the median hedged firm relative to the ratio of 13 percent for the median non-hedged firms. The differences in size, leverage, credit line use and availability, and cash holdings are all significant at the 1 percent level.
We also examine the differences in asset tangibility and the market-to-book ratio across the median firms in both groups. The univariate comparison shows that the ratio of tangible assets to total assets and the market-to-book ratio of assets are larger for non-hedged firms (80 percent versus 90 percent for tangible assets and 1.64 versus 1.36 for the market-to-book ratio, respectively).
The differences between hedged and non-hedged firms in cash holdings and available credit line are consistent with the effect of financing constraints stemming from debt covenants in credit line contracts. However, our data allow us to contribute to the literature by examining the strength and relevance of the covenant and the interest rate risk channel in explaining the availability and use of credit lines when firms mitigate the effects of the interest rate risk through the use of interest rate derivatives (mostly swaps).
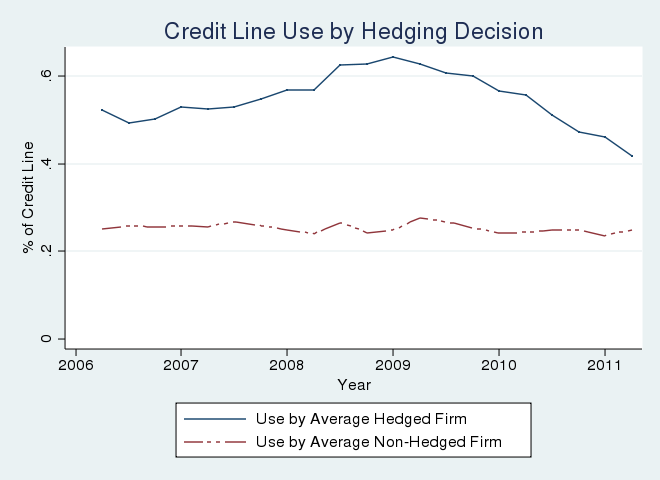
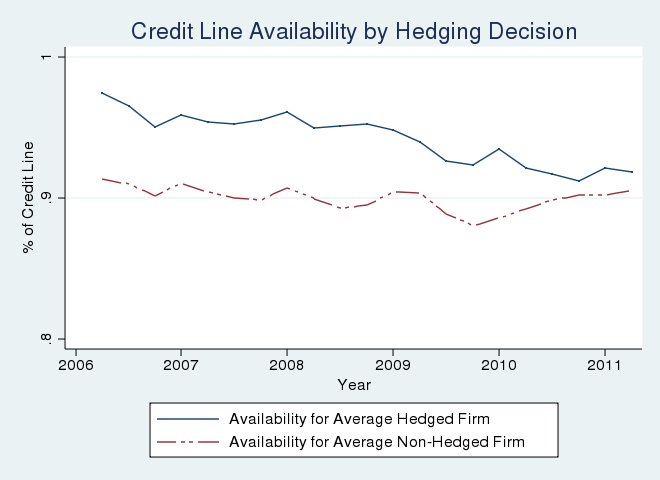
To illustrate the difference in use of credit facilities and access to credit facilities between interest rate swap users and non-users, figure 4 depicts the use (top panel) and availability of credit lines (bottom panel) for the two types of firms. Hedged firms have greater availability and use disproportionally more of their credit lines than their non-hedged counterparts. The median hedged firm has a ratio of credit lines to total assets (34 percent) that almost three times larger than the ratio of their non-hedged counterpart (12 percent). Moreover, the use of credit lines as a percentage of total assets is much larger for hedged firms (63 percent versus 7 percent).
Although there is only a small difference in the availability ratio between the two groups, the differences are striking when looking at the use of credit lines. Derivative users drew down their credit lines significantly more than non-users during the months leading to the financial crisis. The used portion increased from 50 percent before 2008 to 65 percent during the fall of 2008. This behavior notably contrasts with credit lines use by non-hedged firms. Non-hedged firms kept their credit line use almost constant at 25 percent even during the financial crisis.
Table 3 reports the correlations of the main variables of interest. Credit line size, credit line use, and hedging activity are all positively correlated. Cash holdings and credit line use are negatively correlated, so are cash holdings and hedging activity. Non-investment grade firms tend to use the credit line more intensively and have a higher likelihood of being hedged while firms without a bond rating tend to hold more cash.
In short, our univariate results show that hedged firms are larger and more levered than non-hedged firms. They also have more access to credit lines, draw down more funds from those credit lines, and depend less on cash than their non-hedged counterparts. Non-hedged firms, however, have more tangible assets and a higher market-to-book value of assets.
4.4 Credit Line Usage for firms that switched from not hedging to hedging
So far we have examined the impact of interest rate hedging associated with existing credit lines by comparing the behavior of hedged and non-hedged firms. We provide further evidence of the impact of hedging on the use of credit lines by investigating whether firms that switched to being hedged throughout our sample period drew down more funds after hedging.
In our sample the number of hedgers increased from 35 firms in 2006 to 62 firms by 2011:Q1. However, the number of hedged firms peaked at 102 firms in the third quarter of 2009. We note that the reduction in the number of hedgers through the end of the sample reflects firms settling their interest rate swaps. In total, we observe 132 hedging-status switches of 104 firms in our sample. Figure 5 plots the number of hedged firms and the TED spread over the sample period. Uncertainty in bank funding markets and the number of hedged firms increased on the onset of and during the crisis. After policy interventions, the TED spread fell to the lowest levels in the sample period. The fall in the TED spread was followed by a decline in the number of firms that hedged their credit line interest rate risk.
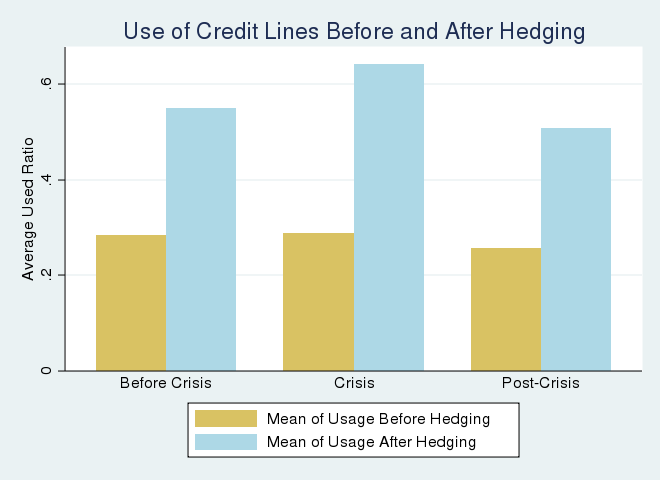
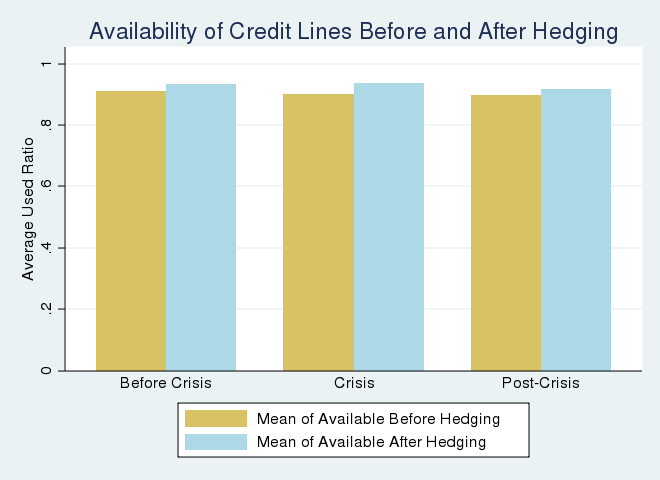
To investigate the credit line use behavior by hedging status further, figure 6 shows the credit line information for before, during, and after the crisis. Firms that switched their hedge-status drew down more from their existing lines after they hedged (the top panel). On average, the use of credit lines for switching firms also increased significantly, especially during the crisis period. During this time, the use of credit lines went up by almost 30 percentage points on average. The bottom panel of figure 6 show credit line availability for firms before and after hedging. The graph suggests that while there are differences between hedged and unhedged firms (on average, 94 percent versus 90 percent), hedging does not have an economically large effect on credit line availability.
5 Econometric Analysis
To formally isolate the effects of interest rate hedging on credit line use we have to control for other known determinants of the decision to have a credit line, and also the use and the availability of credit lines. This section proceeds as follows. First, we study the firm's determinants of the decision to have a credit line. Second, we study the key drivers in the decision to hedge interest rate risk associated with credit lines, and then we evaluate the effects of hedging on a firm's ability to draw on its credit line and on its credit availability. Last, we describe how credit line usage changes when a firm changes its hedging activities.
5.1 Determinants of the Credit Line Decision
Following Distanik, Duchin, and Schmidt (2010), we expect that large cash holdings reduce the likelihood of having a credit line, and conditional on having a credit line, cash holdings and cash flow should reduce the likelihood of hedging interest rate risk. In addition, we expect that firms with large exposure to interest rate risk -- that is, firms with large credit lines relative to assets -- are more likely to hedge.
Table 4 reports the results of a probit regression on a credit line dummy. Controlling for firm characteristics, we find that firms with large cash holding are less likely to have a credit line. This result holds for all subgroups: investment grade firms, non-investment grade firms, and firms without a bond rating (columns 2 through 4). These results are consistent with previous findings in the literature documenting the substitution between cash holdings and credit lines. We find no significant differences on the credit line decision across firms based on their bond ratings.
5.2 Determinants of the Interest Rate Hedging Decision
In the subsample of firms with existing credit lines, we study the determinants of the use of an interest rate swap to hedge the interest rate risk on their credit facilities. Table 5 summarizes the probit regression results for firms that have a credit line. Consistent with previous results in the literature, firms with more cash holding are less likely to hedge. The probability of hedging is higher for larger firms, and firms with larger credit lines. We find that non-investment grade firms are significantly more likely to hedge. In this subgroup, firms with a large share of tangible assets are less likely to hedge, perhaps because relatively more collateral allows these firms to finance themselves with senior secured debt on the bond market.
5.3 Impact of Hedging on Credit Line Size
We start by examining the determinants of credit line size relative to total assets. An important assumption in our analysis is that the size of the firm's credit line-a measure of its exposure to interest rate fluctuations-determines the decision to hedge such exposure. Once the credit line of a given size is contracted, the amount the firm is able to draw down from the existing line depends on whether the firm is hedged or not. Of course, the firm's decision to hedge interest risk from the used portion of its credit line is endogenous. Our first attempt to address this endogeneity issue is to use a variable called mandatory swap--which indicates whether the interest rate swap is a credit line contract feature. Our view is that mandatory hedging is arguably an exogenous constraint for the firm when negotiating the size of its credit facility with the lender. Following previous work in the literature of corporate credit lines, we study the effects of hedging on a firm's size using the following empirical specification:
| (1) |
In this regression specification, our dependent variable the size of credit lines to total assets. Note that the credit line size variable is censored at zero for firms with no lines. Therefore, we employ a Tobit specification to address the censoring issue. In addition, we estimate fixed effect panel regressions to control for unobserved firm characteristics.
Our variable of interest, the ![]()
![]() variable, is a dummy variable that
takes the value of 1 for firms that hedge the interest rate associated with the used portion of their credit lines. We also include a vector
variable, is a dummy variable that
takes the value of 1 for firms that hedge the interest rate associated with the used portion of their credit lines. We also include a vector ![]() of lagged firm characteristics that
likely influence the firm's decision to use credit lines such as firm size (log of total assets), cash holdings, asset tangibility, the market to book ratio of assets and firms' credit ratings (investment grade, non-investment grade and no bond rating). We expect the coefficient on the
of lagged firm characteristics that
likely influence the firm's decision to use credit lines such as firm size (log of total assets), cash holdings, asset tangibility, the market to book ratio of assets and firms' credit ratings (investment grade, non-investment grade and no bond rating). We expect the coefficient on the ![]()
![]() variable to be positive and statistically significant (
variable to be positive and statistically significant (![]() ), consistent with the hypothesis that hedged firms are able to increase the size, use and availability of committed credit lines, compared with non-hedged firms.
), consistent with the hypothesis that hedged firms are able to increase the size, use and availability of committed credit lines, compared with non-hedged firms.
The measure of credit line ratio in this section is the ratio of used lines of credit to total credit lines. Motivated by previous empirical work highlighting the interaction between credit lines, drawdowns, and cash holdings on a firm's liquidity management, we consider the cash-to-assets ratio to control for alternative sources of firm liquidity. Given the documented trade-off between cash and credit lines, we would expect a negative and significant coefficient on the cash-to-assets ratio in our regression. To account for the relationship between internal and external sources of liquidity, we also include the ratio of cash flow to total assets.14
Finally, we control for industry and time fixed effects. Based on 2-digit NAICS industry dummies, we group the firms in our sample into 21 industry groups and include dummies for each of these groups in our model. We expect that industry affiliation would capture a large portion of a firm's growth opportunities and its cost of capital. Quarterly dummies control for changes in the macroeconomic environment such as output growth, interest rates and aggregate measures of credit and liquidity risk.
Table 6 shows our results. The first two columns provide our pooled and panel Tobit estimates and the last two columns show estimates using fixed-effect regressions. Our results are consistent with previous findings in the literature on liquidity and credit lines. In all four regressions, the ratio of credit lines to total assets declines with the size of the firm. This negative coefficient seems to suggest that by having access to other types of funding, larger firms rely proportionally less on credit facilities to finance their operations. We confirm the negative relationship between cash holdings and credit lines, which highlights the substitution between cash holdings and credit lines and indicates that corporations with small cash holdings depend more on credit lines. The substitution seems to also be present in the relationship between the size of credit lines and the use of internal cash flows. Our results suggest that firms that rely more on internally generated funds negotiate smaller credit lines, though this evidence is slightly weaker. We also find a significant role for the credit rating variable as a determinant of the credit line ratio. Non-investment grade firms tend to have larger credit line to asset ratios. There is only weak evidence that tangible assets and investment growth prospects--proxied by the market to book ratio of assets--are positively related to the size of credit lines. Finally, we add to the literature by controlling for an additional contract feature, the mandatory interest rate hedge. The impact of the mandatory use of interest rate hedges in debt covenants has been unexplored thus far in the literature on credit lines. Our results indicate that firms with a mandatory swap to hedge their interest rate risk exposure on the credit facility have credit lines that are 26 percentage points larger relative to assets.
To control for the possibility of an omitted variable bias due to firm unobservable characteristics (e.g. managerial skills) that may explain our results, we estimate firm fixed effect regressions. Column 3 of Table 6 shows the results of the fixed effect model for all firms, and column 4 shows the results of the fixed effect model for firms with credit lines only. As before, cash holdings and internal cash flows are negatively associated with the size of credit lines. The coefficient on the mandatory swap dummy variable is close to that in our Tobit estimates.
Overall, we find evidence that the size of credit lines increases when firms are required to have interest rate swaps. In addition, our findings also confirm the documented trade-off between credit lines and cash holdings and internal cash flows. However, our evidence on the importance of tangible assets and firm growth prospects on increasing the size of credit lines is weak.
5.4 Impact of Hedging on Credit Line Usage
When looking at credit line usage and availability, we augment our previous regression specification (equation (1)) by including a dummy variable to control for the crisis period (2008:Q3 through 2009:Q2). Since hedging incurs a fixed cost, not all firms are able to hedge, and those that are
able to hedge decide whether to engage in interest rate risk hedging or not. We will deal with potential biases due to different hedging abilities and different hedging likelihoods in section 5.6. Here, our most preferred specification includes interaction terms of our
swap dummy, the crisis dummy and firms' credit ratings (indexed by ![]() investment grade, non-investment grade, and no bond rating). In other words, we include these interaction terms to study
which firms, grouped by their credit ratings, were able to draw down their credit lines during difficult economic times. The augmented regression equation is
investment grade, non-investment grade, and no bond rating). In other words, we include these interaction terms to study
which firms, grouped by their credit ratings, were able to draw down their credit lines during difficult economic times. The augmented regression equation is
|
(2) |
Note that all interaction terms are interactions of dummy variables, and hence we omit either an interaction with one rating group or a double interaction term. Table 7 shows the estimation results of equation (2) when the dependent variable is the used credit line to total credit line ratio. We we present the results for three different specifications. The first specification (columns 1 and 2) uses a pooled Tobit estimation with clustered, robust standard errors to address potential bias due to censoring since the usage variable is bounded by 0 from below and by 1 from above. We also include time and industry fixed effects in this regression. Our second specification is a random effects Tobit regression (table 7, columns 3 and 4). Although this latter regression assumes normally distributed random effects, it provides a better fit than the pooled Tobit regression as it controls for firm heterogeneity in the context of an nonlinear panel model. To control for unobserved firm characteristics we use a linear fixed effect model as a third specification (table 7, columns 5 and 6).
The coefficient on the Swap dummy is positive and significant across all specifications. This result indicates that hedged corporations are able to draw down their credit lines more than their non-hedged counterparts. In terms of economic significance, this finding suggests that firms that hedge their interest rate risk with swap contracts have drawdowns from committed lines that are 32 percentage points larger. This is consistent with the summary statistics shown in table 2. Compared to the 25 percent ratio of used credit lines to total credit lines of the average non-hedged firm, a hedged firm exhibits a significantly larger ratio of used credit lines to total credit lines (about 56 percent).
Credit lines have floating interest rates. The credit line interest rate is usually the LIBOR plus some margin. During the crisis, the LIBOR spiked due to disruptions in interbank markets. Firms that hedged the interest rate risk associated with their credit lines faced less uncertainty about the cost of credit line use and hence were more likely to make use of their credit facilities. The firm fixed effect model shows a much smaller coefficient than the pooled Tobit estimates, but this is to be expected because in the firm fixed effect regression the identification comes from firms that switch their hedging status (section 4.4). Being hedged accounts for about 7 percentage points of drawdowns in the fixed effect regression. The random effects tobit estimation shows a coefficient of hedging closer to the linear fixed effect model (about 10 percent), which suggestst that the firm-specific unobserved characteristics contribute significantly to the pooled Tobit estimates. Moreover, by controlling by various unobservable factors, we are closer to a causal link from interest rate hedging to credit line usage.
Regarding the role of firm characteristics, our results also indicate that in general non-investment grade firms draw down more funds than investment grade firms. Consistent with the evidence presented in section 4.2, the regression analysis confirms that commercial paper issuance reduces credit line use. Our results from the panel tobit estimation indicate that, on average, firms issuing commercial paper reduce their credit line use by about 33 percentage points.
We also find evidence of the trade-off between cash and credit lines. Firms with large cash holdings and large internal cash flows reduce their use of credit lines. Although we interpret this result as suggesting that the causality runs from changes in cash holdings and internal cash flows to changes in the use of credit lines, one could argue that the results may also suggest a reverse causality.15
Our estimates on the interaction of the swap and the crisis dummies are significant across all specifications and suggest that hedged firms increased their drawdowns more than their non-hedged counterparts during the financial crisis (between 2008:Q3 and 2009:Q2). To further investigate the type of firms that were able to increase drawdowns during the crisis, tables 8 through 10 presents several specifications with different interactions between our hedging, crisis, and credit rating dummy variables, across our three models (pooled Tobit, linear fixed effects, and random effects Tobit). For example, the second specification explores which type of firms, indexed by their credit ratings, were able to draw more on their lines during the financial crisis; whereas the third specification shows whether hedging allowed a particular group of firms increase their credit line usage. The last specification includes all the interaction terms to disaggregate the combined effects even further.
Our results in tables 8 thorugh 10 indicate that having a credit rating allowed corporations to increase their credit line use during the financial turmoil. The linear fixed effect and the panel Tobit estimates suggest that both non-investment grade and investment grade firms were able to increase their drawdowns during the crisis. Interestingly, the coefficients on the triple interaction terms in our fourth specification suggest that, although having a credit rating and hedging allowed corporations to draw down more funds during the financial crisis, hedged investment grade firms drew down significantly more than hedged non-investment grade firms. However, this evidence is relatively weak. This can be seen in the fifth column in all three tables. Estimates from our last specification show that rated firms increased credit line drawdowns during the crisis regardless of whether they were hedged or not. In other words, when the regression includes both the double interactions between the crisis dummy and the credit ratings dummy, the coefficients of the triple interaction between hedging, crisis and rating (for both investment-grade and non-investment grade firms) turned out to be insignificant (and in some cases, they switched signs). Interestingly, the linear fixed effect model seems to indicate that hedging was beneficial only for firms without credit ratings. This result seems reasonable and is consistent with the idea that in the face of more restricted access to bond or equity markets, unrated firms could have resorted to interest rate hedging to be able to drawdown more from their credit lines during the crisis. However, we have to consider that out of the approximately 100 firms that hedge their interest rate risk in our sample, only about half of them were hedged and had a credit rating. The use of multiple interaction terms aimed at identifying different effects simultaneously is thus restricted by a small number of observations in our sample. In particular, the economic effects of hedging on credit line use are largest for investment grade firms, but they are estimated with considerable sample uncertainty. Therefore, we must interpret this result with caution.
5.5 Impact of Hedging on Availability
Finally, we address the question of whether hedging allows more access to credit lines by alleviating potential covenant restrictions. Covenant restrictions can prevent firms from drawing down from existing credit lines (Sufi (2009), Huang (2010). Since the likelihood of covenant violations increases during bad economic times, the available credit dropped during the financial crisis. Disatnik, Duchin, and Schmidt (2010) argue that cash flow hedging becomes a valuable corporate strategy because it reduces the probability of covenant violations and therefore maintains credit availability. To test the validity of this argument, we examine the ratio of available lines to total credit lines for the firms in our sample. As mentioned above, firms are required to disclose when a violation of the covenant associated with their credit lines occurs. Covenant violations automatically restrict the availability of credit lines. In other words, when a covenant violation occurs, a firm can only use a portion of the total amount of their existing lines. Therefore, we expect that the line availability ratio, defined here as the sum of used and remaining available unused credit line portion, measures the extent to which firms face binding borrowing constraints due to covenant breaches.
Table 11 depicts the ratio of available lines to total credit lines (line availability ratio) for hedged and non-hedged firms before, during and after the crisis. The table shows that for different firms within the distribution of the line availability ratio, credit lines became less available after the crisis. This information is consistent with previous empirical evidence suggesting that during bad economic times banks tighten their lending standards and become tougher in negotiating their credit commitments.
To further investigate how significant the differences are in credit line availability between hedged and non-hedged firms, we employ an additional regression analysis. If by smoothing future cash flows interest rate hedging helps corporations ameliorate the possibility of covenant breaching, then we would expect a positive relationship between hedging and line availability. We estimate equation (2) with line availability ratio as the dependent variable to test whether hedging increases the firm's access to credit lines.
Table 12 shows the results. In addition to our Tobit regressions, we present quantile regressions for the 10th, 25th, and 40th percentiles of the distribution. The results confirm the findings in Table 11. Consistent with the prevalence of debt covenants on leverage and cash flow, higher leverage reduces the available share of the credit line while higher cash flow increases it. In the Tobit regressions, the coefficient on the interest rate swap is small (1 percentage point) and insignificant for the average firm. The coefficient is larger and statistically significant for firms in the lowest percentiles. The effect is largest in the group that is most constrained--the 10th percentile--and declines the less constrained firms are. However, consistent with figure 6, the effect of hedging on credit line availability, which accounts for 11.1 percentage points of the total line at the 10th percentile, is economically small when we look at the whole sample.
Overall, our findings suggest that interest rate hedging alleviates the impact of automatic covenant restrictions only for a small number of firms. In other words, we find only partial evidence for the existence of the covenant channel. A possible interpretation of this result, given that we examine the hedging decision against a very specific type of risk related to the use of credit lines, is that the benefits of hedging are transmitted through a different channel. As we argue above, interest rate swaps effectively convert floating rates on the used portion of the credit lines into fixed rates. By doing so, interest rate hedging effectively reduces the uncertainty about the cost of credit and allows corporations to draw down more funds from their lines.
5.6 Regression Model with Hedging Propensity
One potential issue in measuring the effect of hedging on credit lines is that we may need to distinguish firms that were unable to hedge (for instance, because the amount to be hedged is too small), firms that were able to hedge and chose not to, and firms that hedged. Therefore, following
Faulkender and Petersen (2011), we expand our previous empirical specification for the credit line ratio and replace our swap dummy with two new variables of interest--the propensity that a firm uses swap contracts to hedge their interest rate risk associated with the credit line
![]() , the unexplained (residual) component of hedging
, the unexplained (residual) component of hedging
![]() -- in addition to the set of controls for firm-specific characteristics. By separating the explainable component of being hedged from the residual component, the
specification allows us to separate likely and unlikely hedge users and, conditional on being likely to hedge, users and non-users. While the first distinction addresses the endogeneity concerns on the decision to hedge, the second distiction identifies the effect of hedging.16
-- in addition to the set of controls for firm-specific characteristics. By separating the explainable component of being hedged from the residual component, the
specification allows us to separate likely and unlikely hedge users and, conditional on being likely to hedge, users and non-users. While the first distinction addresses the endogeneity concerns on the decision to hedge, the second distiction identifies the effect of hedging.16
![\begin{displaymath}\begin{split}Credit~Line~ratio_{i,t}\!=& ~ c_{i}\!+\!\tau_{t}\!+\!\beta_1\widehat{Swap_{i,t}}\!+\beta_2\left[Swap_{i,t}-\widehat{Swap_{i,t}}\!\right] +\beta_3~Crisis_{i,t}\\ &+\beta_4~Swap_{i,t}\!\cdot\!Crisis_{i,t}+\sum\limits_{j} \alpha_j\!\cdot\!Crisis_{i,t}\!\cdot\!Rating^j_{i,t}\\ &+\sum\limits_{j} \delta_j\!\cdot\! Swap_{i,t}\!\cdot\!Crisis_{i,t}\!\cdot\!Rating^j_{i,t} +\!\gamma\!\cdot\!X_{i,t-1}\!+ \!\epsilon_{i,t} \end{split}\end{displaymath}](img11.gif)
|
(3) |
In this specification, the effect of interest rate hedging is measured by the coefficient ![]() , while the total effect of hedging propensity is given by
, while the total effect of hedging propensity is given by
![]() . We take
. We take
![]() as the predicted value from the regression in the first column of table 5. As before, we provide estimates for three models (1) pooled Tobit regressions
with firm-level clustered standard errors, industry and time fixed-effects, (2) a random effects Tobit regression to control for unobserved heterogeneity in the context of a panel model and (3) linear fixed-effect regressions with time effects.
as the predicted value from the regression in the first column of table 5. As before, we provide estimates for three models (1) pooled Tobit regressions
with firm-level clustered standard errors, industry and time fixed-effects, (2) a random effects Tobit regression to control for unobserved heterogeneity in the context of a panel model and (3) linear fixed-effect regressions with time effects.
Table 13 shows the estimation results of equation (3) when our dependent variable is the ratio of used lines to total credit lines. As before, we present the results for two different specifications in each model. The coefficient on hedging propensity is positive and significant in all specifications. This result confirms our findings in section 5.4 that hedged corporations are able to draw down their credit lines more than non-hedged firms. Estimates of the pooled Tobit model (table 13, columns 1 and 2) show that firms that hedge their interest rate risk with swap contracts have drawdowns from committed lines that are 22 percentage points larger. This estimate is smaller than the estimated effect (32 percentage points) when using only a swap dummy variable.
As before, both the random effects Tobit models (table 13, columns 2 and 4) and the firm fixed effect model (table 13, columns 5 and 6), which control for unobserved firm characteristics, show a positive and significant effect of interest rate hedging on credit line usage, though, as expected, the coefficients are much smaller than the Tobit estimates (between 5 and 7 percentage points). Firms without bond ratings and high-yield firms draw more on their credit lines than investment grade firms, and firms issuing commercial paper draw down less than non-users of commercial paper. These results, however, are significant only in the random effects tobit model.
As we did in tables 8 through 10, we show the estimation
results of equation (3) for several specifications that include different interactions between the hedging, crisis and credit rating dummy variables in tables 14 through
16. The interaction between our ![]() and
and ![]() dummies is significant in almost all specifications, indicating that hedged firms were capable of drawing on their credit lines more than unhedged firms during the financial crisis. The
coefficients on the triple interaction terms in the fourth specification confirm that hedged investment grade firms were able to draw down more funds during the times of financial distress. The linear fixed effect model suggests that hedging was also beneficial for firms without a credit rating,
though as before, we have to be cautious when interpreting this result.
dummies is significant in almost all specifications, indicating that hedged firms were capable of drawing on their credit lines more than unhedged firms during the financial crisis. The
coefficients on the triple interaction terms in the fourth specification confirm that hedged investment grade firms were able to draw down more funds during the times of financial distress. The linear fixed effect model suggests that hedging was also beneficial for firms without a credit rating,
though as before, we have to be cautious when interpreting this result.
Next, we estimate equation (3) with the credit line availability ratio as dependent variable. Table 17 shows the results. Again, we employ Tobit regressions and quantile
regressions for the 10th, 25th, and 40th percentiles of the distribution. The results confirm the findings in section 5.5. After controlling for firm specific characteristics, the coefficient on the interest rate swap, ![]() , is basically zero for the average firm. As before, the coefficient is larger and statistically significant for firms in the lowest percentiles, accounting for 10.5 percentage points of the total line at the 10th percentile.
, is basically zero for the average firm. As before, the coefficient is larger and statistically significant for firms in the lowest percentiles, accounting for 10.5 percentage points of the total line at the 10th percentile.
In short, our results in this section confirm that, compared to non-hedged firms, hedged firms draw down more funds from credit lines, particularly during the difficult times further of the financial crisis. We also confirm that hedged firms have a somewhat higher credit line availability. However, the effect of hedging on credit line availability is economically small. This finding cast doubt on the covenant channel being the main channel through which hedging affects firm behavior. The drawdown patterns during the crisis are consistent with the interest rate risk channel.
6 Conclusion
We study credit supply and demand effects determining the use and availability of credit lines during the recent financial crisis. We document that credit line usage had already increased in 2007 when bank funding markets become more volatile. However, we do not find evidence that disruptions in the commmercial paper market explain credit line drawndowns. Moreover, we consider the role of interest rate hedging on the access, use and availability of credit lines. Using firm level data that allow us to distinguish between unused and available portions of credit lines, we find that credit supply--measured as credit available to firms--exhibits only a small decline during the crisis. This decline is concentrated in firms that entered the crisis with weak financing prospects. Consistent with the covenant channel proposed by Disatnik, Duchin, and Schmidt (2010), we find that covenants are less likely to bind for firms that hedged credit facility interest rate risk. Our results indicate that this effect is large for (severely) constrained firms but is economically small when looking at the full sample. On the demand side, our findings confirm that smaller and non-investment grade firms are more likely to draw on their credit lines. Firms with more cash, higher cash-flows, and higher market-to-book values were less likely to draw on their credit lines.
Firms hedging their interest rate exposure on credit facilities drew down significantly more funds than non-hedged firms. Moreover, among hedged firms, investment-grade firms were more likely to draw down their credit lines. During the crisis, having an interest rate swap for the credit facility accounts, on average, for additional drawdowns of up to 6.4 percentage points. This effect is economically large and robust to several specifications. We attribute the significance of our result to the uncertainty associated with the cost of funding--the interest rate risk channel--during bad economic times. Our results suggest that the effects are even larger for investment-grade firms. Finally, we study firms that changed their hedging activity status and became swap users during our sample period. We find that the effect of hedging on credit line use is particularly pronounced for this group. We interpret our findings as indicating that hedging interest rate risk exposure on credit facility has benefits beyond the reasons previously suggested in the literature.
Finally, there are two caveats to our analysis. First, we only study publicly traded firms, which tend to be larger and less financially constrained than privately held firms. Hence, we may overstate credit availability and understate the covenant channel. Second, we assume that firms' hedging behavior is explainable by firm characteristics. However, the anticipation of future drawdowns may cause firms to hedge their interest rate risk, reversing the causality of our findings.
| Variable | N | Mean | Std. Dev. | Min. | 25% | Median | 75% | Max |
| Total Asset (in mill.) | 11,804 | 2,304.35 | 5,753.56 | 0.00 | 102.90 | 507.52 | 1,862.17 | 68,647.00 |
| Total Reveue (in mill.) | 11,798 | 583.86 | 1,991.86 | 0.00 | 21.95 | 115.68 | 423.87 | 36,436.00 |
| Debt/Assets | 11,479 | 0.23 | 0.26 | 0.00 | 0.01 | 0.17 | 0.35 | 1.45 |
| Cash/Assets | 11,799 | 0.21 | 0.23 | 0.00 | 0.04 | 0.13 | 0.30 | 0.95 |
| Net Income/Assets | 11,796 | -0.01 | 0.08 | -0.56 | -0.01 | 0.01 | 0.02 | 0.11 |
| Cash-flow/Assets | 11,460 | 0.00 | 0.08 | -0.54 | 0.00 | 0.02 | 0.03 | 0.12 |
| Operating Margin | 11,445 | 0.01 | 0.07 | -0.40 | 0.01 | 0.03 | 0.04 | 0.12 |
| Tangible Assets/Assets | 11,797 | 0.82 | 0.20 | 0.24 | 0.71 | 0.89 | 0.99 | 1.00 |
| Market to Book Ratio (Assets) | 11,804 | 2.42 | 2.26 | 0.61 | 1.19 | 1.61 | 2.48 | 10.00 |
| Credit Line/Assets | 11,794 | 0.20 | 0.25 | 0.00 | 0.00 | 0.12 | 0.27 | 1.62 |
| Use of credit Line/Credit Line | 8,354 | 0.31 | 0.33 | 0.00 | 0.00 | 0.20 | 0.60 | 1.00 |
| Use of Credit Line/Available Line | 8,270 | 0.34 | 0.35 | 0.00 | 0.00 | 0.24 | 0.66 | 1.00 |
| Variable | N | Mean | Std. Dev. | Min. | 25% | Median | 75% | Max |
| Total Asset (in mill.) | 123,581 | 2,732.75 | 8,189.49 | 0.07 | 42.84 | 222.62 | 1,235.17 | 56,522.28 |
| Total Reveue (in mill.) | 123,098 | 606.36 | 1,925.45 | 0.00 | 5.13 | 41.67 | 263.02 | 13,790.76 |
| Debt/Assets | 120,108 | 0.19 | 0.21 | 0.00 | 0.00 | 0.14 | 0.31 | 1.00 |
| Cash/Assets | 123,282 | 0.22 | 0.24 | 0.00 | 0.03 | 0.12 | 0.32 | 0.96 |
| Net Income/Assets | 123,019 | -0.03 | 0.18 | -3.11 | -0.02 | 0.00 | 0.02 | 0.16 |
| Cash-flow/Assets | 116,999 | -0.02 | 0.18 | -3.07 | -0.01 | 0.02 | 0.03 | 0.17 |
| Operating Margin | 116,843 | 0.00 | 0.14 | -2.20 | -0.01 | 0.02 | 0.04 | 0.14 |
| Tangible Assets/Assets | 123,177 | 0.85 | 0.20 | 0.21 | 0.76 | 0.95 | 1.00 | 1.00 |
| Market to Book Ratio (Assets) | 113,679 | 2.08 | 1.75 | -9.96 | 1.09 | 1.59 | 2.57 | 10.00 |
| Variable | N | Mean | Std. Dev. | Min. | 25% | Median | 75% | Max |
| Total Asset (in mill.) | 1,614 | 4,303.55 | 12,972.17 | 36.21 | 587.07 | 1,336.29 | 3,270.27 | 121,823.00 |
| Total Reveue (in mill.) | 1,613 | 868.35 | 2,824.81 | 2.22 | 127.22 | 268.51 | 695.60 | 29,019.00 |
| Debt/Assets | 1,603 | 0.40 | 0.23 | 0.00 | 0.23 | 0.38 | 0.53 | 1.45 |
| Cash/Assets | 1,614 | 0.07 | 0.09 | 0.00 | 0.02 | 0.04 | 0.09 | 0.86 |
| Net Income/Assets | 1,613 | 0.00 | 0.05 | -0.56 | 0.00 | 0.01 | 0.02 | 0.11 |
| Cash-flow/Assets | 1,593 | 0.01 | 0.05 | -0.54 | 0.01 | 0.02 | 0.03 | 0.12 |
| Operating Margin | 1,592 | 0.03 | 0.03 | -0.40 | 0.02 | 0.03 | 0.04 | 0.12 |
| Tangible Assets/Assets | 1,614 | 0.75 | 0.22 | 0.24 | 0.58 | 0.80 | 0.96 | 1.00 |
| Market to Book Ratio (Assets) | 1,614 | 2.25 | 2.53 | 0.61 | 1.11 | 1.36 | 1.82 | 10.00 |
| Credit Line/Assets | 1,613 | 0.41 | 0.29 | 0.00 | 0.22 | 0.34 | 0.54 | 1.62 |
| Use of credit Line/Credit Line | 1,589 | 0.56 | 0.31 | 0.00 | 0.34 | 0.63 | 0.81 | 1.00 |
| Use of Credit Line/Available Line | 1,589 | 0.58 | 0.31 | 0.00 | 0.38 | 0.68 | 0.84 | 1.00 |
| Variable | N | Mean | Std. Dev. | Min. | 25% | Median | 75% | Max |
| Total Asset (in mill.) | 8,880 | 3,107.00 | 12,128.80 | 0.68 | 104.00 | 489.72 | 1,862.12 | 212,949.00 |
| Total Reveue (in mill.) | 8,876 | 899.82 | 5,275.36 | 0.00 | 24.84 | 113.64 | 448.54 | 116,360.00 |
| Debt/Assets | 8,599 | 0.21 | 0.25 | 0.00 | 0.01 | 0.16 | 0.31 | 1.45 |
| Cash/Assets | 8,880 | 0.21 | 0.22 | 0.00 | 0.04 | 0.13 | 0.29 | 0.95 |
| Net Income/Assets | 8,879 | -0.01 | 0.08 | -0.56 | -0.01 | 0.01 | 0.02 | 0.11 |
| Cash-flow/Assets | 8,612 | 0.00 | 0.08 | -0.54 | 0.00 | 0.02 | 0.03 | 0.12 |
| Operating Margin | 8,609 | 0.02 | 0.07 | -0.40 | 0.01 | 0.03 | 0.04 | 0.12 |
| Tangible Assets/Assets | 8,879 | 0.83 | 0.19 | 0.24 | 0.72 | 0.90 | 0.99 | 1.00 |
| Market to Book Ratio (Assets) | 8,880 | 2.41 | 2.21 | 0.61 | 1.20 | 1.64 | 2.49 | 10.00 |
| Credit Line/Assets | 8,877 | 0.18 | 0.23 | 0.00 | 0.04 | 0.12 | 0.25 | 1.62 |
| Use of credit Line/Credit Line | 6,826 | 0.25 | 0.31 | 0.00 | 0.00 | 0.07 | 0.48 | 1.00 |
| Use of Credit Line/Available Line | 6,740 | 0.28 | 0.33 | 0.00 | 0.00 | 0.08 | 0.54 | 1.00 |
| Swap Dummy | Credit Line Assets/ | Avail. Line/ Total Line | Credit line Usage | Cash/Assets | No Rating Dummy | |
| Swap Dummy | 1.0000 | |||||
| Credit Line/Assets | 0.3106 | 1.0000 | ||||
| Avail. Line/Total Line | 0.0860 | -0.0354 | 1.0000 | |||
| Credit Line Usage | 0.3577 | 0.4708 | 0.2034 | 1.0000 | ||
| Cash/Assets | -0.1847 | -0.1805 | -0.0203 | -0.2161 | 1.0000 | |
| No Bond Rating | -0.2161 | 0.0592 | 0.0468 | -0.0183 | 0.2472 | 1.0000 |
| Non-Inv. Grade | 0.2843 | 0.0866 | -0.0437 | 0.1890 | -0.1999 | -0.7440 |
| all dF/dx | Inv. Grade dF/dx | Non-Inv. Grade dF/dx | No Rating dF/dx | |
| Size | 0.018 | 0.004 | 0.008 | 0.030 |
| Size Standard Error | (0.018) | (0.012) | (0.015) | (0.031) |
| Cash/Assets | -1.010** | -0.264 |
-0.539 | -1.277** |
| Cash Assets Standard Error | (0.104) | (0.136) | (0.127) | |
| Cash-Flow/Assets | -0.056 | 0.227 | 0.141 |
-0.062 |
| Cash-Flow/Assets Standard Error | (0.140) | (0.342) | (0.069) | (0.173) |
| Market to Book Ratio | -0.009 | -0.046 | 0.006 | -0.009 |
| Market to Book Ratio Standard Error | (0.010) | (0.039) | (0.019) | (0.014) |
| Market to Book Ratio |
0.038 | 0.041 | 0.004 | 0.010 |
| Market to Book Ratio |
(0.084) | (0.034) | (0.141) | (0.131) |
| Tangible Assets/ Assets | 0.095 | -0.175 | 0.065 | 0.195 |
| Tangible Assets/ Assets Standard Error | (0.092) | (0.112) | (0.094) | (0.118) |
| Non-Investment Grade Rating | 0.072 | |||
| Non-Investment Grade Rating Standard Error | (0.070) | |||
| No Bond Rating | 0.046 | |||
| No Bond Rating Standard Error | (0.114) | |||
| Time Effects | yes | yes | yes | yes |
| Industry effects | yes | no | no | no |
| Pseudo |
0.359 | 0.412 | 0.293 | 0.297 |
| N | 10839 | 1188 | 2220 | 7460 |
| all dF/dx | Inv. Grade dF/dx | Non-Inv. Grade dF/dx | No Rating dF/dx | |
| Credit Line/Assets | 0.375** | 1.427 |
0.924** | 0.220** |
| Credit Line/Assets Standard Error | (0.053) | (0.569) | (0.208) | (0.043) |
| Size | -0.001 | 0.078 |
-0.131 |
-0.009 |
| Size Standard Error | (0.025) | (0.034) | (0.063) | (0.017) |
| Cash/Assets | -0.273 |
-0.565 |
0.159 | -0.194 |
| Cash/Assets Standard Error | (0.135) | (0.310) | (0.450) | (0.107) |
| Cash-Flow/Assets | 0.316 |
0.019 | 0.454 | 0.154 |
| Cash-Flow/Assets Standard Error | (0.135) | (0.232) | (0.385) | (0.101) |
| Market to Book Ratio | -0.038 |
-0.006 | -0.001 | -0.046** |
| Market to Book Ratio Standard Error | (0.016) | (0.031) | (0.072) | (0.016) |
| MTBA |
0.372 | -0.176 | 0.694 |
|
| MTBA |
(0.260) | (0.519) | (0.296) | |
| Tangible Assets/ Assets | -0.171 |
0.078 | -0.555** | -0.090 |
| Tangible Assets/ Assets Standard Error | (0.082) | (0.094) | (0.210) | (0.059) |
| Non-Investment Grade Rating | 0.398** | |||
| Non-Investment Grade Rating Standard Error | (0.127) | |||
| No Bond Rating | 0.325** | |||
| No Bond Rating Standard Error | (0.125) | |||
| Time Effects | yes | yes | yes | yes |
| Industry effects | yes | no | no | no |
| Pseudo |
0.238 | 0.396 | 0.147 | 0.198 |
| N | 7878 | 1055 | 2039 | 4861 |
| Pooled Tobit | Panel Tobit | Fixed Effects all firms | Fixed Effects firms with credit lines | |
| Size | -0.003 | -0.009 | -0.021 |
-0.042** |
| Size Standard Error | (0.012) | (0.006) | (0.009) | (0.011) |
| Cash/Assets | -0.667** | -0.232** | -0.078 |
-0.093 |
| Cash/Assets Standard Error | (0.099) | (0.025) | (0.034) | (0.046) |
| Cash-Flow/Assets | -0.418** | -0.151** | -0.108 |
-0.197** |
| Cash-Flow/Assets Standard Error | (0.161) | (0.033) | (0.048) | (0.061) |
| Market to Book Ratio | 0.008 | -0.004 | -0.002 | 0.006 |
| Market to Book Ratio Standard Error | (0.009) | (0.003) | (0.004) | (0.006) |
| Market to Book Ratio |
0.034 | 0.070 |
0.054 | 0.045 |
| Market to Book Ratio |
(0.096) | (0.031) | (0.039) | (0.057) |
| Tangible Assets/ Assets | -0.054 | 0.008 | -0.015 | -0.070 |
| Tangible Assets/ Assets Standard Error | (0.054) | (0.027) | (0.032) | (0.036) |
| Mandatory Swap | 0.256** | 0.266** | 0.269** | 0.264** |
| Mandatory Swap Standard Error | (0.083) | (0.012) | (0.029) | (0.039) |
| Commercial Paper Issuer | -0.060 |
-0.001 | ||
| Commercial Paper Issuer Standard Error | (0.023) | (0.061) | ||
| Non-Investment Grade Rating | 0.084 |
0.041 | ||
| Non-Investment Grade Rating Standard Error | (0.035) | (0.049) | ||
| No Bond Rating | 0.019 | -0.205** | ||
| No Bond Rating Standard Error | (0.071) | (0.49) | ||
| Firm Fixed Effects | no | no | yes | yes |
| Time Effects | yes | yes | yes | yes |
| Industry effects | yes | yes | yes | yes |
| 0.39 | - | 0.78 | 0.81 | |
| N | 9639 | 9639 | 9639 | 7979 |
| Pooled Tobit (1) | Pooled Tobit (2) | Panel Tobit (3) | Panel Tobit (4) | Fixed Effects (5) | Fixed Effects (6) | |
| Swap | 0.316** | 0.318** | 0.098** | 0.100** | 0.073** | 0.074** |
| Swap Standard Error | (0.036) | (0.036) | (0.015) | (0.015) | (0.012) | (0.012) |
| Crisis | -0.002 | 0.013 | 0.025 |
|||
| Crisis Standard Error | (0.027) | (0.021) | (0.014) | |||
| Crisis*Swap | 0.064** | 0.033 |
0.036** | |||
| Crisis*Swap Standard Error | (0.024) | (0.017) | (0.010) | |||
| Crisis*No Bond Rating | -0.018 | -0.013 | -0.011 | |||
| Crisis*No Bond Rating Standard Error | (0.030) | (0.022) | (0.015) | |||
| Crisis*Non-Investment Grade Rating | 0.010 | 0.066 |
0.065** | |||
| Crisis*Non-Investment Grade Rating Standard Error | (0.042) | (0.027) | (0.017) | |||
| Crisis*Investment Grade Rating | 0.069 | 0.071 |
0.036 |
|||
| Crisis*Investment Grade Rating Standard Error | (0.049) | (0.036) | (0.016) | |||
| Swap*Crisis*No Bond Rating | 0.038 | 0.040 | 0.039** | |||
| Swap*Crisis*No Bond Rating Standard Error | (0.045) | (0.025) | (0.015) | |||
| Swap*Crisis*Non-Investment Grade Rating | 0.067 | -0.015 | -0.001 | |||
| Swap*Crisis*Non-Investment Grade Rating Standard Error | (0.054) | (0.028) | (0.016) | |||
| Swap*Crisis*Investment Grade Rating | 0.110 | 0.053 | 0.052 | |||
| Swap*Crisis*Investment Grade Rating Standard Error | (0.129) | (0.061) | (0.034) | |||
| No Bond Rating | 0.065 | 0.085 | 0.453** | 0.468** | ||
| No Bond Rating Standard Error | (0.100) | (0.101) | (0.091) | (0.092) | ||
| Non-Investment Grade Rating | 0.253** | 0.267** | 0.464** | 0.469** | ||
| Non-Investment Grade Rating Standard Error | (0.081) | (0.082) | (0.088) | (0.088) | ||
| Commercial Paper Issuer | -0.202 |
-0.201 |
-0.334** | -0.337** | ||
| Commercial Paper Issuer Standard Error | (0.093) | (0.093) | (0.108) | (0.108) | ||
| Size | -0.007 | -0.006 | 0.036** | 0.037** | 0.093** | 0.093** |
| Size Standard Error | (0.018) | (0.018) | (0.012) | (0.012) | (0.013) | (0.012) |
| Cash/Assets | -0.786** | -0.786** | -0.766** | -0.766** | -0.363** | -0.364** |
| Cash/Assets Standard Error | (0.166) | (0.166) | (0.059) | (0.059) | (0.044) | (0.044) |
| Cash-Flow/Assets | -1.222** | -1.227** | -0.382** | -0.385** | -0.237** | -0.236** |
| Cash-Flow/Assets Standard Error | (0.179) | (0.179) | (0.071) | (0.071) | (0.046) | (0.046) |
| Market to Book Ratio | -0.020 | -0.021 | -0.068** | -0.069** | -0.025** | -0.025** |
| Market to Book Ratio Standard Error | (0.019) | (0.019) | (0.008) | (0.008) | (0.005) | (0.005) |
| Market to Book Ratio |
0.226 | 0.229 | 0.542** | 0.547** | 0.189** | 0.194** |
| Market to Book Ratio |
(0.175) | (0.175) | (0.079) | (0.079) | (0.056) | (0.056) |
| Tangible Common Equity/Assets | -0.464** | -0.464** | -0.354** | -0.351** | -0.178** | -0.177** |
| Tangible Common Equity/Assets Standard Error | (0.089) | (0.089) | (0.055) | (0.055) | (0.047) | (0.047) |
| 0.230 | 0.230 | - | - | 0.750 | 0.750 | |
| N | 7743 | 7743 | 7743 | 7743 | 7743 | 7743 |
| Pooled Tobit Regression | (1) | (2) | (3) | (4) | (5) |
| Swap | 0.332** | 0.316** | 0.318** | 0.317** | 0.318** |
| Swap Standard Error | (0.036) | (0.036) | (0.036) | (0.037) | (0.036) |
| Crisis | 0.015 | -0.002 | -0.002 | ||
| Crisis Standard Error | (0.026) | (0.027) | (0.027) | ||
| Crisis*Swap | 0.064** | 0.057 |
|||
| Crisis*Swap Standard Error | (0.024) | (0.024) | |||
| Crisis*No Bond Rating | -0.021 | -0.018 | |||
| Crisis*No Bond Rating Standard Error | (0.029) | (0.030) | |||
| Crisis*Non-Investment Grade Rating | 0.015 | 0.010 | |||
| Crisis*Non-Investment Grade Rating Standard Error | (0.032) | (0.042) | |||
| Crisis*Investment Grade Rating | 0.080 |
0.069 | |||
| Crisis*Investment Grade Rating Standard Error | (0.040) | (0.049) | |||
| Swap*Crisis*No Bond Rating | 0.026 | 0.038 | |||
| Swap*Crisis*No Bond Rating Standard Error | (0.041) | (0.045) | |||
| Swap*Crisis*Non-Investment Grade Rating | 0.078 |
0.067 | |||
| Swap*Crisis*Non-Investment Grade Rating Standard Error | (0.036) | (0.054) | |||
| Swap*Crisis*Investment Grade Rating | 0.171 | 0.011 | |||
| Swap*Crisis*Investment Grade Rating Standard Error | (0.109) | (0.129) | |||
| 0.230 | 0.230 | 0.230 | |||
| N | 7743 | 7743 | 7743 | 7743 | 7743 |
| Pooled Tobit Regression | (1) | (2) | (3) | (4) | (5) |
| Swap | 0.106** | 0.098** | 0.101** | 0.099** | 0.100** |
| Swap Standard Error | (0.014) | (0.015) | (0.015) | (0.015) | (0.015) |
| Crisis | 0.023 | 0.013 | 0.013 | ||
| Crisis Standard Error | (0.021) | (0.021) | (0.021) | ||
| Crisis*Swap | 0.033 |
0.019 | |||
| Crisis*Swap Standard Error | (0.017) | (0.018) | |||
| Crisis*No Bond Rating | -0.009 | -0.013 | |||
| Crisis*No Bond Rating Standard Error | (0.022) | (0.022) | |||
| Crisis*Non-Investment Grade Rating | 0.049 |
0.066 |
|||
| Crisis*Non-Investment Grade Rating Standard Error | (0.025) | (0.027) | |||
| Crisis*Investment Grade Rating | 0.078 |
0.071 |
|||
| Crisis*Investment Grade Rating Standard Error | (0.033) | (0.036) | |||
| Swap*Crisis*No Bond Rating | 0.016 | 0.040 | |||
| Swap*Crisis*No Bond Rating Standard Error | (0.024) | (0.025) | |||
| Swap*Crisis*Non-Investment Grade Rating | 0.038 |
-0.015 | |||
| Swap*Crisis*Non-Investment Grade Rating Standard Error | (0.022) | (0.028) | |||
| Swap*Crisis*Investment Grade Rating | 0.108 |
0.053 | |||
| Swap*Crisis*Investment Grade Rating Standard Error | (0.054) | (0.061) | |||
| N | 7743 | 7743 | 7743 | 7743 | 7743 |
| Fixed Effects Regression | (1) | (2) | (3) | (4) | (5) |
| Swap | 0.082** | 0.073** | 0.075** | 0.074** | 0.074** |
| Swap Standard Error | (0.012) | (0.012) | (0.012) | (0.012) | (0.012) |
| Crisis | 0.034 |
0.025 |
0.025 |
||
| Crisis Standard Error | (0.014) | (0.014) | (0.014) | ||
| Crisis*Swap | 0.036** | 0.024 |
|||
| Crisis*Swap Standard Error | (0.010) | (0.011) | |||
| Crisis*No Bond Rating | 0.013 | 0.011 | |||
| Crisis*No Bond Rating Standard Error | (0.014) | (0.015) | |||
| Crisis*Non-Investment Grade Rating | 0.054** | 0.065** | |||
| Crisis*Non-Investment Grade Rating Standard Error | (0.016) | (0.017) | |||
| Crisis*Investment Grade Rating | 0.040 |
0.036 |
|||
| Crisis*Investment Grade Rating Standard Error | (0.016) | (0.016) | |||
| Swap*Crisis*No Bond Rating | 0.025 |
0.039** | |||
| Swap*Crisis*No Bond Rating Standard Error | (0.014) | (0.015) | |||
| Swap*Crisis*Non-Investment Grade Rating | 0.040** | -0.001 | |||
| Swap*Crisis*Non-Investment Grade Rating Standard Error | (0.013) | (0.016) | |||
| Swap*Crisis*Investment Grade Rating | 0.062 |
0.052 | |||
| Swap*Crisis*Investment Grade Rating Standard Error | (0.032) | (0.034) | |||
| 0.750 | 0.750 | 0.750 | 0.750 | 0.750 | |
| N | 7743 | 7743 | 7743 | 7743 | 7743 |
| Swap Non-Users mean | Swap Non-Users 5% | Swap Non-Users 10% | Swap Non-Users 25% | Swap Non-Users 50% | Swap Non-Users Obs | Swap Users mean | Swap Users 5% | Swap Users 10% | Swap Users 25% | Swap Users 50% | Swap Users Obs. | |
| Pre-Crisis | 0.904 | 0.477 | 0.661 | 0.897 | 1.000 | 3416 | 0.956 | 0.768 | 0.837 | 0.961 | 0.998 | 645 |
| Crisis | 0.897 | 0.500 | 0.640 | 0.880 | 1.000 | 1283 | 0.941 | 0.670 | 0.806 | 0.946 | 0.992 | 379 |
| Post-Crisis | 0.895 | 0.467 | 0.596 | 0.893 | 1.000 | 2113 | 0.922 | 0.572 | 0.700 | 0.937 | 0.989 | 565 |
| Total | 0.900 | 0.480 | 0.633 | 0.892 | 1.000 | 6812 | 0.940 | 0.653 | 0.789 | 0.949 | 0.993 | 1589 |
| Pooled Tobit | Panel Tobit | Quantile Regression 10% | Quantile Regression 25% | Quantile Regression 40% | |
| Swap | 0.041 | 0.010 | 0.111** | 0.044** | 0.010 |
| Swap Standard Error | (0.025) | (0.012) | (0.022) | (0.013) | (0.005) |
| Size | 0.019 | 0.035** | 0.031** | 0.006 | 0.001 |
| Size Standard Error | (0.014) | (0.009) | (0.010) | (0.006) | (0.002) |
| Cash/Assets | -0.008 | -0.109** | -0.248** | 0.050 | 0.023 |
| Cash/Assets Standard Error | (0.100) | (0.044) | (0.072) | (0.044) | (0.017) |
| Cash-Flow/Assets | 0.379** | 0.139** | 0.666** | 0.333** | 0.101** |
| Cash-Flow/Assets Standard Error | (0.124) | (0.057) | (0.162) | (0.098) | (0.037) |
| Debt/Assets | -0.080 | -0.029 | -0.137** | 0.001 | -0.003 |
| Debt/Assets Standard Error | (0.053) | (0.027) | (0.041) | (0.026) | (0.009) |
| Market to Book Ratio | 0.025 |
0.028** | 0.031** | 0.004 | 0.001 |
| Market to Book Ratio Standard Error | (0.016) | (0.006) | (0.010) | (0.006) | (0.002) |
| Market to Book Ratio |
-0.259 |
-0.158** | -0.346** | -0.125 |
-0.048 |
| Market to Book Ratio |
(0.139) | (0.060) | (0.088) | (0.053) | (0.020) |
| Commercial Paper Issuer | -0.153 |
-0.241** | -0.325** | -0.203** | -0.057** |
| Commercial Paper Issuer Standard Error | (0.061) | (0.080) | (0.039) | (0.024) | (0.009) |
| Non-Investment Grade Rating | -0.075 | -0.083 | 0.015 | -0.013 | -0.030** |
| Non-Investment Grade Rating Standard Error | (0.051) | (0.067) | (0.035) | (0.021) | (0.008) |
| No Bond Rating | -0.018 | 0.138 |
0.160** | 0.073 |
-0.006 |
| No Bond Rating Standard Error | (0.073) | (0.071) | (0.056) | (0.034) | (0.013) |
| Time Effects | yes | yes | yes | yes | yes |
| Industry Effects | yes | yes | no | no | no |
| 0.102 | - | 0.089 | 0.043 | 0.021 | |
| N | 7522 | 7522 | 7522 | 7522 | 7522 |
| Pooled Tobit (1) | Pooled Tobit (2) | Panel Tobit (3) | Panel Tobit (4) | Fixed Effects (5) | Fixed Effects (6) | |
| Hedging Propensity | 1.192** | 1.194** | 0.574** | 0.572** | 0.456** | 0.452** |
| Hedging Propensity Standard Error | (0.132) | (0.133) | (0.049) | (0.049) | (0.046) | (0.046) |
| Swap - Hedging Propensity | 0.216** | 0.216** | 0.067** | 0.068** | 0.049** | 0.050** |
| Swap - Hedging Propensity Standard Error | (0.040) | (0.040) | (0.015) | (0.015) | (0.011) | (0.011) |
| Crisis | -0.042 | -0.014 | 0.005 | |||
| Crisis Standard Error | (0.028) | (0.022) | (0.014) | |||
| Crisis*Swap | 0.042 |
0.026 | 0.028** | |||
| Crisis*Swap Standard Error | (0.022) | (0.017) | (0.010) | |||
| Crisis*No Bond Rating | -0.053 |
-0.036 | -0.006 | |||
| Crisis*No Bond Rating Standard Error | (0.031) | (0.023) | (0.015) | |||
| Crisis*Non-Investment Grade Rating | -0.038 | 0.031 | 0.038 |
|||
| Crisis*Non-Investment Grade Rating Standard Error | (0.039) | (0.028) | (0.017) | |||
| Crisis*Investment Grade Rating | 0.007 | 0.038 | 0.013 | |||
| Crisis*Investment Grade Rating Standard Error | (0.048) | (0.036) | (0.016) | |||
| Swap*Crisis*No Bond Rating | 0.024 | 0.036 | 0.033 |
|||
| Swap*Crisis*No Bond Rating Standard Error | (0.042) | (0.025) | (0.015) | |||
| Swap*Crisis*Non-Investment Grade Rating | 0.032 | -0.022 | -0.007 | |||
| Swap*Crisis*Non-Investment Grade Rating Standard Error | (0.050) | (0.028) | (0.016) | |||
| Swap*Crisis*Investment Grade Rating | 0.166 | 0.065 | 0.057 |
|||
| Swap*Crisis*Investment Grade Rating Standard Error | (0.114) | (0.061) | (0.033) | |||
| No Bond Rating | -0.020 | -0.002 | 0.396** | 0.411** | ||
| No Bond Rating Standard Error | (0.094) | (0.095) | (0.089) | (0.089) | ||
| Non-Investment Grade Rating | 0.034 | 0.049 | 0.338** | 0.345** | ||
| Non-Investment Grade Rating Standard Error | (0.084) | (0.084) | (0.086) | (0.086) | ||
| Commercial Paper Issuer | -0.043 | -0.040 | -0.255 |
-0.258 |
||
| Commercial Paper Issuer Standard Error | (0.095) | (0.095) | (0.105) | (0.105) | ||
| Size | -0.022 | -0.02 | 0.030 |
0.030 |
0.086** | 0.086** |
| Size Standard Error | (0.017) | (0.017) | (0.012) | (0.012) | (0.013) | (0.013) |
| Cash/Assets | -0.447** | -0.446** | -0.612** | -0.614** | -0.251** | -0.253** |
| Cash/Assets Standard Error | (0.153) | (0.153) | (0.161) | (0.161) | (0.047) | (0.047) |
| Cash-Flow/Assets | -1.083** | -1.087** | -0.438** | -0.441** | -0.286** | -0.285** |
| Cash-Flow/Assets Standard Error | (0.158) | (0.158) | (0.071) | (0.071) | (0.049) | (0.049) |
| Market to Book Ratio | -0.005 | -0.005 | -0.058** | -0.059** | -0.019** | -0.020** |
| Market to Book Ratio Standard Error | (0.017) | (0.017) | (0.008) | (0.008) | (0.005) | (0.005) |
| Market to Book Ratio |
0.134 | 0.136 | 0.491** | 0.497** | 0.172** | 0.176** |
| Market to Book Ratio |
(0.161) | (0.161) | (0.079) | (0.079) | (0.058) | (0.058) |
| Tangible Common Equity/Assets | -0.275** | -0.275** | -0.257** | -0.255** | -0.106** | -0.105** |
| Tangible Common Equity/Assets Standard Error | (0.086) | (0.086) | (0.055) | (0.055) | (0.046) | (0.047) |
| 0.270 | 0.270 | - | - | 0.760 | 0.760 | |
| N | 7642 | 7642 | 7642 | 7642 | 7642 | 7642 |
| Pooled Tobit Regression | (1) | (2) | (3) | (4) | (5) |
| Hedging Propensity | 1.204** | 1.192** | 1.192** | 1.195** | 1.194** |
| Hedging Propensity Standard Error | (0.132) | (0.132) | (0.132) | (0.132) | (0.133) |
| Swap - Hedging Propensity | 0.226** | 0.216** | 0.216** | 0.215** | 0.216** |
| Standard Error | (0.039) | (0.040) | (0.040) | (0.040) | (0.040) |
| Crisis | -0.032 | -0.042 | -0.043 | ||
| Crisis Standard Error | (0.027) | (0.028) | (0.028) | ||
| Crisis*Swap | 0.042 |
0.040 |
|||
| Crisis*Swap Standard Error | (0.022) | (0.023) | |||
| Crisis* No Bond Rating | -0.056 |
-0.053 |
|||
| Crisis* No Bond Rating Standard Error | (0.030) | (0.031) | |||
| Crisis*Non-Investment Grade Rating | -0.041 | -0.038 | |||
| Crisis*Non-Investment Grade Rating Standard Error | (0.033) | (0.039) | |||
| Crisis*Investment Grade Rating | 0.032 | 0.007 | |||
| Crisis*Investment Grade Rating Standard Error | (0.039) | (0.048) | |||
| Swap*Crisis*No Bond Rating | 0.016 | 0.024 | |||
| Swap*Crisis*No Bond Rating Standard Error | (0.039) | (0.042) | |||
| Swap*Crisis*Non-Investment Grade Rating | 0.037 | 0.032 | |||
| Swap*Crisis*Non-Investment Grade Rating Standard Error | (0.034) | (0.050) | |||
| Swap*Crisis*Investment Grade Rating | 0.208 |
0.166 | |||
| Swap*Crisis*Investment Grade Rating Standard Error | (0.096) | (0.114) | |||
| 0.270 | 0.270 | 0.270 | |||
| N | 7642 | 7642 | 7642 | 7642 | 7642 |
| Pooled Tobit Regression | (1) | (2) | (3) | (4) | (5) |
| Hedging Propensity | 0.583** | 0.574** | 0.571** | 0.576** | 0.572** |
| Hedging Propensity Standard Error | (0.049) | (0.049) | (0.049) | (0.049) | (0.049) |
| Swap - Hedging Propensity | 0.073** | 0.067** | 0.069** | 0.067** | 0.068** |
| Swap - Hedging Propensity Standard Error | (0.014) | (0.015) | (0.015) | (0.015) | (0.015) |
| Crisis | -0.006 | -0.014 | -0.014 | ||
| Crisis Standard Error | (0.021) | (0.022) | (0.022) | ||
| Crisis*Swap | 0.026 | 0.015 | |||
| Crisis*Swap Standard Error | (0.017) | (0.018) | |||
| Crisis*No Bond Rating | -0.031 | -0.036 | |||
| Crisis*No Bond Rating Standard Error | (0.022) | (0.023) | |||
| Crisis*Non-Investment Grade Rating | 0.012 | 0.031 | |||
| Crisis*Non-Investment Grade Rating Standard Error | (0.026) | (0.028) | |||
| Crisis*Investment Grade Rating | 0.050 | 0.038 | |||
| Crisis*Investment Grade Rating Standard Error | (0.033) | (0.036) | |||
| Swap*Crisis*No Bond Rating | 0.015 | 0.036 | |||
| Swap*Crisis*No Bond Rating Standard Error | (0.024) | (0.025) | |||
| Swap*Crisis*Non-Investment Grade Rating | 0.022 | -0.022 | |||
| Swap*Crisis*Non-Investment Grade Rating Standard Error | (0.022) | (0.028) | |||
| Swap*Crisis*Investment Grade Rating | 0.114 |
0.065 | |||
| Swap*Crisis*Investment Grade Rating Standard Error | (0.054) | (0.061) | |||
| N | 7642 | 7642 | 7642 | 7642 | 7642 |
| Fixed Effects Regression | (1) | (2) | (3) | (4) | (5) |
| Hedging Propensity | 0.466** | 0.456** | 0.452** | 0.457** | 0.452** |
| Hedging Propensity Standard Error | (0.045) | (0.046) | (0.046) | (0.046) | (0.046) |
| Swap - Hedging Propensity | 0.055** | 0.049** | 0.050** | 0.049** | 0.050** |
| Swap - Hedging Propensity Standard Error | (0.011) | (0.011) | (0.011) | (0.011) | (0.011) |
| Crisis | 0.012 | 0.005 | 0.005 | ||
| Crisis Standard Error | (0.014) | (0.014) | (0.014) | ||
| Crisis*Swap | 0.028** | 0.019 |
|||
| Crisis*Swap Standard Error | (0.010) | (0.010) | |||
| Crisis*No Bond Rating | -0.004 | -0.006 | |||
| Crisis*No Bond Rating Standard Error | (0.015) | (0.015) | |||
| Crisis*Non-Investment Grade Rating | 0.026 | 0.038 |
|||
| Crisis*Non-Investment Grade Rating Standard Error | (0.016) | (0.017) | |||
| Crisis*Investment Grade Rating | 0.019 | 0.013 | |||
| Crisis*Investment Grade Rating Standard Error | (0.016) | (0.016) | |||
| Swap*Crisis*No Bond Rating | 0.022 | 0.033 |
|||
| Swap*Crisis*No Bond Rating Standard Error | (0.014) | (0.015) | |||
| Swap*Crisis*Non-Investment Grade Rating | 0.026 |
-0.007 | |||
| Swap*Crisis*Non-Investment Grade Rating Standard Error | (0.012) | (0.016) | |||
| Swap*Crisis*Investment Grade Rating | 0.065 |
0.057 |
|||
| Swap*Crisis*Investment Grade Rating Standard Error | (0.031) | (0.033) | |||
| 0.760 | 0.760 | 0.760 | 0.760 | 0.760 | |
| N | 7642 | 7642 | 7642 | 7642 | 7642 |
| Pooled Tobit | Panel Tobit | Quantile Regression 10% | Quantile Regression 25% | Quantile Regression 40% | |
| Hedging Propensity | -0.028 | -0.129** | 0.157 |
0.141** | 0.029 |
| Hedging Propensity Standard Error | (0.106) | (0.041) | (0.066) | (0.039) | (0.016) |
| Swap - Hedging Propensity | 0.048 |
0.019 | 0.105** | 0.032 |
0.010 |
| Swap - Hedging Propensity Standard Error | (0.027) | (0.012) | (0.024) | (0.014) | (0.006) |
| Size | 0.020 | 0.041** | 0.035** | 0.009 | 0.002 |
| Size Standard Error | (0.015) | (0.009) | (0.010) | (0.006) | (0.002) |
| Cash/Assets | -0.044 | -0.170** | -0.212** | 0.092 |
0.031 |
| Cash/Assets Standard Error | (0.110) | (0.047) | (0.077) | (0.045) | (0.019) |
| Cash-Flow/Assets | 0.374** | 0.174** | 0.643** | 0.321** | 0.103** |
| Cash-Flow/Assets Standard Error | (0.124) | (0.047) | (0.164) | (0.096) | (0.039) |
| Debt/Assets | -0.069 | -0.007 | -0.139** | -0.031 | -0.005 |
| Debt/Assets Standard Error | (0.061) | (0.028) | (0.044) | (0.026) | (0.011) |
| Market to Book Ratio | 0.025 | 0.028** | 0.031** | 0.006 | 0.001 |
| Market to Book Ratio Standard Error | (0.016 | (0.006) | (0.010) | (0.006) | (0.001) |
| Market to Book Ratio |
-0.270 |
-0.162** | -0.342** | -0.140** | -0.048 |
| Market to Book Ratio |
(0.140) | (0.061) | (0.090) | (0.053) | (0.022) |
| Commercial Paper Issuer | -0.166 |
-0.269** | -0.302** | -0.184** | -0.053** |
| Commercial Paper Issuer Standard Error | (0.065) | (0.082) | (0.041) | (0.024) | (0.009) |
| Non-Investment Grade Rating | -0.058 | -0.051 | 0.013 | -0.034 | -0.032** |
| Non-Investment Grade Rating Standard Error | (0.056) | (0.068) | (0.038) | (0.023) | (0.009) |
| No Bond Rating | -0.012 | 0.161 |
0.148 |
0.047 | -0.010 |
| No Bond Rating Standard Error | (0.075) | (0.071) | (0.058) | (0.034) | (0.014) |
| Time Effects | yes | yes | yes | yes | yes |
| Industry Effects | yes | yes | no | no | no |
| 0.102 | - | 0.089 | 0.043 | 0.021 | |
| N | 7522 | 7522 | 7522 | 7522 | 7522 |