
Skip to: Printable Version (PDF)
New Methods for Inference in Long-Run Predictive Regressions1
NOTE: International Finance Discussion Papers are preliminary materials circulated to stimulate discussion and critical comment. References to International Finance Discussion Papers (other than an acknowledgment that the writer has had access to unpublished material) should be cleared with the author or authors. Recent IFDPs are available on the Web at http://www.federalreserve.gov/pubs/ifdp/. This paper can be downloaded without charge from the Social Science Research Network electronic library at http://www.ssrn.com/.
Abstract:
I develop new asymptotic results for long-horizon regressions with overlapping observations. I show that rather than using auto-correlation robust standard errors, the standard t-statistic can simply be divided by the square root of the forecasting horizon to correct for the effects of the overlap in the data. Further, when the regressors are persistent and endogenous, the long-run OLS estimator suffers from the same problems as does the short-run OLS estimator, and similar corrections and test procedures as those proposed for the short-run case should also be used in the long-run. In addition, I show that under an alternative of predictability, long-horizon estimators have a slower rate of convergence than short-run estimators and their limiting distributions are non-standard and fundamentally different from those under the null hypothesis. These asymptotic results are supported by simulation evidence and suggest that under standard econometric specifications, short-run inference is generally preferable to long-run inference. The theoretical results are illustrated with an application to long-run stock-return predictability.
JEL Classification: C22, G1.
Keywords: Predictive regressions; Long-horizon regressions; Stock return predictability.
1 Introduction
Predictive regressions are used frequently in empirical finance and economics. The underlying economic motivation is often the test of a rational expectations model, which implies that the innovations to the dependent variable should be orthogonal to all past information; i.e., the dependent variable should not be predictable using any lagged regressors. Although this orthogonality condition should hold at any time horizon, it is popular to test for predictability by regressing sums of future values of the dependent variable onto the current value of the regressor. A leading example is the question of stock return predictability, where regressions with 5 or 10 year returns are often used (e.g. Campbell and Shiller, 1988, and Fama and French, 1988a); while stock return predictability will also serve as the motivating example in this paper, the results derived are applicable to a much wider range of empirical questions.3
The reasons behind the use of such long-horizon regressions are seldom clearly spelled out, but there seems to be an intuitive notion that a stronger signal might be extracted by analyzing long-run data. Previous analytical evidence in favour of this intuition is somewhat mixed, and overall fairly weak (e.g. Berkowitz and Giorgianni, 2001, Campbell, 2001, Mark and Sul, 2004, and Rapach and Wohar, 2005). From a practical perspective, however, the main issue with long-horizon regressions has been the uncertainty regarding the proper calculation of standard errors. Since overlapping observations are typically used, the regression residuals will exhibit strong serial correlation and standard errors failing to account for this fact will lead to biased inference.
The main contribution of this paper is the development of new asymptotic results for long-run regressions with overlapping observations. Using a framework with near-unit-root regressors, I show how to obtain asymptotically correct test-statistics, with good small sample properties, for the null hypothesis of no predictability. In addition, I provide some further understanding of long-horizon regressions, and the power of the associated test-statistics, by analyzing the properties of the long-run estimators under an alternative of predictability.4
Typically, auto-correlation robust estimation of the standard
errors (e.g. Newey and West, 1987) is used to perform inference in
long-run regressions. However, these robust estimators tend to
perform poorly in finite samples since the serial correlation
induced in the error terms by overlapping data is often very
strong. I show that rather than using robust standard errors, the
standard ![]() statistic can
simply be divided by the square root of the forecasting horizon to
correct for the effects of the overlap in the data. Further, when
the regressors are persistent and endogenous, the long-run OLS
estimator suffers from the same problems as does the short-run OLS
estimator, and similar corrections and test procedures as those
proposed by Campbell and Yogo (2005) for the short-run case should
also be used in the long-run; again, the resulting test statistics
should be scaled due to the overlap. Thus, these results lead to
simple and more efficient inference in long-run regressions by
obviating the need for robust standard error estimation methods and
controlling for the endogeneity and persistence of the
regressors.
statistic can
simply be divided by the square root of the forecasting horizon to
correct for the effects of the overlap in the data. Further, when
the regressors are persistent and endogenous, the long-run OLS
estimator suffers from the same problems as does the short-run OLS
estimator, and similar corrections and test procedures as those
proposed by Campbell and Yogo (2005) for the short-run case should
also be used in the long-run; again, the resulting test statistics
should be scaled due to the overlap. Thus, these results lead to
simple and more efficient inference in long-run regressions by
obviating the need for robust standard error estimation methods and
controlling for the endogeneity and persistence of the
regressors.
The asymptotic distributions of the long-run estimators are derived not only under the null-hypothesis of no predictability, but also under an alternative of predictability. This gives a more complete characterization of the asymptotic properties of the long-run estimators than is typically found in the literature, where results for long-run estimators are often derived only under the null-hypothesis of no predictability. It is shown that, under the standard econometric model of stock return predictability, the long-run estimators converge to well-defined quantities, but their asymptotic distributions are non-standard and fundamentally different from the asymptotic distributions under the null hypothesis of no predictability. The rates of convergence of the long-run estimators are also slower under the alternative hypothesis of predictability than under the null hypothesis, and slower than that of the short-run estimator. These results suggest that under the standard econometric specifications that are typically postulated, short-run inference is preferable to long-run inference. These results are also in line with those of Mark and Sul (2004), who analyze local alternatives to the null hypothesis of no predictability. They find that there are cases in which a long-run specification has more power to detect deviations from the null hypothesis than a short-run specification, but only when the innovations to the regressand are correlated with past innovations to the regressor. Since such a correlation already violates the orthogonality condition that is being tested, this region of the parameter space is not relevant in most traditional applications of long-horizon regressions.
The results in this paper are derived under the assumption that
the forecasting horizon increases with the sample size, but at a
slower pace. Most previous work, e.g. Richardson and Stock (1989)
and Valkanov (2003), rely on the assumption that the forecasting
horizon grows at the same pace as the sample size so that the
forecasting horizon remains a fraction of the sample size
asymptotically. In some related work, Moon et al. (2004) consider
both asymptotic approaches and find that although the asymptotic
distributions are different under the two assumptions, they both
tend to provide good approximations for the finite sample
properties. Indeed, Valkanov (2003), who studies a similar
econometric model to the one analyzed in this paper, derives a
similar scaling result to the one found here. His results are less
transparent, however, and do not capture the convenient result
derived here -- namely, that with exogenous regressors the scaled
standard ![]() statistic
will be normally distributed. Likewise, Valkanov's results are also
not as amenable to the endogeneity corrections pursued in this
paper.
statistic
will be normally distributed. Likewise, Valkanov's results are also
not as amenable to the endogeneity corrections pursued in this
paper.
Monte-Carlo simulations confirm the asymptotic results just described. They show that the scaling of the test-statistic to control for the overlap in the observations, in conjunction with the endogeniety corrections, produce tests that have rejection rates under the null hypothesis very close to their nominal size. Further, it is evident that the power of the tests, in finite samples, based on short-run inference dominates that of the long-run test-statistics, which confirms the asymptotic results under the alternative of predictability.
The theoretical results in the paper are illustrated with an application to stock-return predictability. I use annual excess returns on the S&P 500, as well as monthly excess returns on the value weighted CRSP index as dependent variables, and the dividend price ratio and the smoothed earnings price ratio, suggested by Campbell and Shiller (1988), as predictor variables. The data are a subset of those used by Campbell and Yogo (2005) and for the one period horizon case the results are qualitatively identical to those found by Campbell and Yogo. Using the entire samples and correcting for the endogeneity and persistence in the regressors, the earnings price ratio is found to be a significant predictor in both the annual and the monthly data, whereas the null of no predictability cannot be rejected when using the dividend price ratio as a predictor. Contrary to some popular beliefs, however, the case for predictability does not increase with the forecast horizon. In fact, the near opposite is true and for horizons beyond five years the null of no predictability can no longer be rejected for the earnings price ratio. Given the fairly weak evidence of predictability at the short horizon, these results are entirely consistent with a loss of power as the forecasting horizon increases.
The rest of the paper is organized as follows. Section 2 sets up the model and the key assumptions. Section 3 derives the theoretical results and Section 4 describes the Monte-Carlo simulations. Section 5 discusses the practical implementation of the methods in the paper. The empirical application is given in Section 6 and Section 7 concludes. Technical proofs are found in the appendix.
2 Model and Assumptions
Although the results derived in this paper are of general
applicability, it is helpful to discuss the model and derivations
in light of the specific question of stock return predictability.
Thus, let the dependent variable be denoted ![]() , which would typically represent
excess stock returns when analyzing return predictability, and the
corresponding vector of regressors,
, which would typically represent
excess stock returns when analyzing return predictability, and the
corresponding vector of regressors, ![]() , where
, where ![]() is an
is an ![]() vector and
vector and ![]() . The behavior of
. The behavior of ![]() and
and ![]() are assumed to satisfy,
are assumed to satisfy,
| (1) | ||
| (2) |
where ![]() is an
is an
![]() matrix. The
error processes are assumed to satisfy the following conditions.
matrix. The
error processes are assumed to satisfy the following conditions.
Assumption 1 Assumption 1 Let
![]() and
and
![]() be the filtration generated by
be the filtration generated by ![]() . Then
. Then
1.
![]() , and
, and
![]()
2.
![]()
3.
![]()
4.
![]() and
and
![]()
The model described by equations (1) and (2) and Assumption 1
captures the essential features of a predictive regression with
nearly persistent regressors. It states the usual martingale
difference (mds) assumption for the errors in the return processes
but allows for a linear time-series structure in the errors of the
predictor variables; moreover, the innovations can be conditionally
heteroskedastic, as long as they are covariance stationary. The
error terms ![]() and
and
![]() are also often
highly correlated. The auto-regressive roots of the regressors are
parametrized as being local-to-unity, which captures the
near-unit-root behavior of many predictor variables, but is less
restrictive than a pure unit-root assumption.
are also often
highly correlated. The auto-regressive roots of the regressors are
parametrized as being local-to-unity, which captures the
near-unit-root behavior of many predictor variables, but is less
restrictive than a pure unit-root assumption.
Similar models are used to analyze the predictability of stock returns by Cavanagh et al. (1995), Lanne (2002), Valkanov (2003), Torous et al. (2004), and Campbell and Yogo (2005).
Let
![]() be the joint
innovations process. Under Assumption 1, by standard arguments
(Phillips and Solo, 1992),
be the joint
innovations process. Under Assumption 1, by standard arguments
(Phillips and Solo, 1992),
![$\displaystyle \frac{1}{\sqrt{T}}\sum_{t=1}^{\left[ Tr\right] }E_{t}\Rightarrow B\left( r\right) =BM\left( \Omega\right) \left( r\right) , $](img48.gif)
where
![]()
![]() ,
,
![]() ,
,
![]() ,
,
![]() ,
and
,
and
![]() denotes an
denotes an ![]() dimensional Brownian motion. Also, let
dimensional Brownian motion. Also, let
![]() be the one-sided long-run variance of
be the one-sided long-run variance of ![]() . The following lemma sums up the
key asymptotic results for the nearly integrated model in this
paper (Phillips 1987, 1988).
. The following lemma sums up the
key asymptotic results for the nearly integrated model in this
paper (Phillips 1987, 1988).
(a)
![]()
(b)
![]()
(c)
![]()
(d)
![]()
(e)
![]()
where
![]()
Analogous results hold for the demeaned variables
![]() ,
with the limiting process
,
with the limiting process ![]() replaced by
replaced by
![]() . These
results are used repeatedly below.
. These
results are used repeatedly below.
In both empirical work, and the applied theory literature, the
stronger assumption that both
![]() and
and ![]() are martingale difference
sequences is often imposed. In the current paper, I will primarily
work with the general linear process structure for
are martingale difference
sequences is often imposed. In the current paper, I will primarily
work with the general linear process structure for ![]() , but I will also comment and
derive some of the results under the simpler mds assumption.
, but I will also comment and
derive some of the results under the simpler mds assumption.
1.
![]()
2.
![]()
3.
![]() and
and
![]()
Before discussing the long-run estimators of ![]() in equation (1) it is useful to
quickly review the properties of the standard (short-run) OLS
estimator of
in equation (1) it is useful to
quickly review the properties of the standard (short-run) OLS
estimator of ![]() , since
the long-run estimators will reflect many of these properties. Let
, since
the long-run estimators will reflect many of these properties. Let
![]() denote the
standard OLS estimate of
denote the
standard OLS estimate of ![]() in equation (1). By Lemma 1 and the continuous
mapping theorem (CMT), it follows that
in equation (1). By Lemma 1 and the continuous
mapping theorem (CMT), it follows that
|
(3) |
as
![]() .
This result is identical under either Assumption 1 or 2. Analogous
to the case with
.
This result is identical under either Assumption 1 or 2. Analogous
to the case with
pure unit-root regressors, the OLS estimator does
not have an asymptotically mixed normal distribution due to the
correlation between ![]() and
and ![]() , which causes
, which causes ![]() and
and ![]() to be correlated. Therefore,
standard test procedures cannot be used.
to be correlated. Therefore,
standard test procedures cannot be used.
The greatest problem in dealing with regressors that are
near-unit-root processes is the nuisance parameter ![]() . If
. If ![]() was known, critical values for the asymptotic
distribution in (3) could be obtained from simulations, for
instance. More efficient methods can also be implemented in this
case as discussed below in Section 3.3. However,
was known, critical values for the asymptotic
distribution in (3) could be obtained from simulations, for
instance. More efficient methods can also be implemented in this
case as discussed below in Section 3.3. However, ![]() is generally unknown and not
consistently estimable. It is nevertheless useful to first derive
inferential methods under the assumption that
is generally unknown and not
consistently estimable. It is nevertheless useful to first derive
inferential methods under the assumption that ![]() is known, and then use the arguments
of Cavanagh et al. (1995) to construct feasible tests. The
following section derives and outlines the inferential methods used
for estimating and performing tests on
is known, and then use the arguments
of Cavanagh et al. (1995) to construct feasible tests. The
following section derives and outlines the inferential methods used
for estimating and performing tests on ![]() in equation (1), treating
in equation (1), treating
![]() as known. Section 5
discusses how the methods of Cavanagh et al. (1995), and Campbell
and Yogo (2005), can be used to construct feasible tests with
as known. Section 5
discusses how the methods of Cavanagh et al. (1995), and Campbell
and Yogo (2005), can be used to construct feasible tests with
![]() unknown.
unknown.
3 Long-Run Estimation
3.1 The Fitted Regressions
In long-run regressions, the focus of interest are fitted regressions of the type
| (4) |
and
| (5) |
where
![]() and
and
![]() . In
equation (4), long-run future
. In
equation (4), long-run future
returns are regressed onto a one period predictor, whereas in equation (5), long-run future returns are regressed onto long-run past regressors. Equation (4) is the specification most often used for testing stock return predictability, although Fama and French (1988b) use (5) in a univariate framework where sums of future returns are regressed onto sums of past returns. For completeness, I will consider both kinds of specifications here. The regressions in equation (4) and (5) will be referred to as the unbalanced and balanced regressions, respectively, since in the former case long-run returns are regressed onto short-run predictors and in the latter long-run returns are regressed onto long-run predictors. This choice of terminology, i.e. unbalanced and balanced, is used purely as a mnemonic device; `unbalanced' is not meant to convey anything negative about this specification.
Let the OLS estimators of
![]() and
and
![]() in equations (4) and (5),
using overlapping observations, be denoted by
in equations (4) and (5),
using overlapping observations, be denoted by
![]() and
and
![]() , respectively. A
long-standing issue is the calculation of correct standard errors
for
, respectively. A
long-standing issue is the calculation of correct standard errors
for
![]() and
and
![]() . Since overlapping
observations are used to form the estimates, the residuals
. Since overlapping
observations are used to form the estimates, the residuals
![]() will exhibit serial correlation; standard errors failing to account
for this fact will lead to biased inference. The common solution to
this problem has been to calculate auto-correlation robust standard
errors, using methods described by Hansen and Hodrick (1980) and
Newey and West (1987). However, these robust estimators tend to
have rather poor finite sample properties; this is especially so in
cases when the serial correlation is strong, as it often is when
overlapping observations are used. In this section, I derive the
asymptotic properties of
will exhibit serial correlation; standard errors failing to account
for this fact will lead to biased inference. The common solution to
this problem has been to calculate auto-correlation robust standard
errors, using methods described by Hansen and Hodrick (1980) and
Newey and West (1987). However, these robust estimators tend to
have rather poor finite sample properties; this is especially so in
cases when the serial correlation is strong, as it often is when
overlapping observations are used. In this section, I derive the
asymptotic properties of
![]() and
and
![]() under the assumption
that the forecasting horizon
under the assumption
that the forecasting horizon ![]() grows with the sample size but at a slower pace. The
results complement those of Valkanov (2003), who treats the case
where the forecasting horizon grows at the same rate as the sample
size. Simulation results in Valkanov (2003) and this paper show
that both asymptotic approaches provide limiting distributions that
are good proxies for the finite sample behaviour of the long-run
estimators. However, it turns out that the asymptotic results
derived under the current assumptions are more transparent than
those of Valkanov (2003) and provide further understanding of the
properties of the long-run estimators, both under the null and the
alternative hypothesis of predictability. In particular, the
results here show the strong connection between the limiting
distributions of the short- and long-run estimators. This finding
has important implications for the construction of more efficient
estimators and test-statistics that control for the endogeneity and
persistence in the regressors. The procedures in this paper also
avoid the need for simulation methods; the proposed test-statistics
have limiting normal distributions, although in the case of
endogenous regressors with unknown persistence, Bonferroni type
methods need to be used to construct tests and confidence
intervals.
grows with the sample size but at a slower pace. The
results complement those of Valkanov (2003), who treats the case
where the forecasting horizon grows at the same rate as the sample
size. Simulation results in Valkanov (2003) and this paper show
that both asymptotic approaches provide limiting distributions that
are good proxies for the finite sample behaviour of the long-run
estimators. However, it turns out that the asymptotic results
derived under the current assumptions are more transparent than
those of Valkanov (2003) and provide further understanding of the
properties of the long-run estimators, both under the null and the
alternative hypothesis of predictability. In particular, the
results here show the strong connection between the limiting
distributions of the short- and long-run estimators. This finding
has important implications for the construction of more efficient
estimators and test-statistics that control for the endogeneity and
persistence in the regressors. The procedures in this paper also
avoid the need for simulation methods; the proposed test-statistics
have limiting normal distributions, although in the case of
endogenous regressors with unknown persistence, Bonferroni type
methods need to be used to construct tests and confidence
intervals.
3.2 The Limiting Distributions of the Long-Run OLS Estimators
Given that equations (4) and (5) are estimated with overlapping
observations, created from short-run data, they should be viewed as
fitted regressions rather than actual data generating processes
(dgp); the use of overlapping observations effectively necessitates
the specification of a dgp for the observed short-run data. The
results below are derived under the assumption that the true dgp
satisfies equations (1) and (2), and that the long-run observations
are formed by summing up data generated by that process. Under the
null hypothesis of no predictability, the one period dgp is simply
![]() , in which
case the long-run coefficients
, in which
case the long-run coefficients
![]() and
and
![]() will also be equal to zero.
It follows that under the null both equations (4) and (5) are
correctly specified and the analysis of
will also be equal to zero.
It follows that under the null both equations (4) and (5) are
correctly specified and the analysis of
![]() and
and
![]() simplifies. It is
therefore common in the literature to only derive asymptotic
results for long-run estimators under the null of no
predictability. By considering the properties of the estimators
both under the null and the alternative, however, a more complete
picture of the properties of the long-run estimators emerges. Of
course, equation (1) is only one possible alternative to the null
of no predictability, but it provides a benchmark case.
simplifies. It is
therefore common in the literature to only derive asymptotic
results for long-run estimators under the null of no
predictability. By considering the properties of the estimators
both under the null and the alternative, however, a more complete
picture of the properties of the long-run estimators emerges. Of
course, equation (1) is only one possible alternative to the null
of no predictability, but it provides a benchmark case.
1. Under the null hypothesis that ![]() , as
, as
![]() ,
such that
,
such that
![]() ,
,
(a)
|
(6) |
(b)
|
(7) |
2. Under the alternative hypothesis that
![]() , as
, as
![]() ,
such that
,
such that
![]() ,
,
(a)
|
(8) |
(b)
|
(9) |
where
Theorem 1 shows that under the null of no predictability, the
limiting distributions of
![]() and
and
![]() are identical to that
of the plain short-run OLS estimator
are identical to that
of the plain short-run OLS estimator
![]() , although
, although
![]() needs to be
standardized by
needs to be
standardized by ![]() ,
since, as seen in part 2 of the
theorem, the estimated parameter
,
since, as seen in part 2 of the
theorem, the estimated parameter
![]() is of an order
is of an order ![]() times larger than the original
short-run parameter
times larger than the original
short-run parameter ![]() .
.
Under the alternative hypothesis of predictability, the limiting
distributions of
![]() and
and
![]() are quite different
from the short-run result, and are in fact similar to the
distribution of the OLS estimator of the first order
auto-regressive root in
are quite different
from the short-run result, and are in fact similar to the
distribution of the OLS estimator of the first order
auto-regressive root in ![]() , although the rate of convergence is slower. The
estimators still converge to well defined parameters under the
alternative hypothesis, but their asymptotic distributions are
driven by the auto-regressive nature of the regressors and the fact
that the fitted regressions in (4) and (5) are effectively
misspecified, under the assumption that the true relationship takes
the form of equation (1). In addition, the limiting distributions
of
, although the rate of convergence is slower. The
estimators still converge to well defined parameters under the
alternative hypothesis, but their asymptotic distributions are
driven by the auto-regressive nature of the regressors and the fact
that the fitted regressions in (4) and (5) are effectively
misspecified, under the assumption that the true relationship takes
the form of equation (1). In addition, the limiting distributions
of
![]() and
and
![]() exhibit second order
bias terms in the shape of
exhibit second order
bias terms in the shape of
![]() and
and
![]() ,
respectively. These bias terms do not show up in the asymptotics of
the short-run
,
respectively. These bias terms do not show up in the asymptotics of
the short-run
![]() OLS
estimator, and are, again, a result of the effective
misspecification of the long-run regression. Interestingly, under
Assumption 2, the second order bias term in
OLS
estimator, and are, again, a result of the effective
misspecification of the long-run regression. Interestingly, under
Assumption 2, the second order bias term in
![]() dissapears, since in
this case
dissapears, since in
this case
![]() while
the second order bias in
while
the second order bias in
![]() still remains.
still remains.
The equality between the long-run asymptotic distributions under the null hypothesis, shown in Theorem 1, and that of the short-run OLS estimator in equation (3), may seem puzzling. To understand the intuition behind this result, it is helpful to consider the asymptotic properties of narrow band frequency domain regressions around the zero frequency. Since such regressions also attempt to capture a long-run relationship, they are similar in nature to the long-run regressions considered here. As shown by Phillips (1991b) and Corbae et al. (2002), when the regressors are unit-root processes, the limiting distribution of the (non-parametric) narrow band zero frequency estimator is identical to that of the standard OLS time-domain estimator, or equivalently to the full frequency band spectral regression. There is thus no asymptotic efficiency loss from excluding all frequencies outside a neighbourhood around the origin. The reason behind this result is that the spectra of the unit-root processes is dominated by the behaviour at the zero frequency. That is, the long-run movements in the regressors dominate their behaviour, and ignoring the short-run movements causes no asymptotic efficiency loss. The same phenomenon occurs for the long-run estimators considered here, which explains the identical rates of convergence and limiting distributions for the short- and long-run estimators.
3.3 Endogeneity Corrections
It is apparent that, under the null hypothesis, the long-run OLS estimators suffer from the same endogeneity problems as the short-run estimator. It is therefore useful to first consider suitable endogeneity corrections in the short-run regression; the following discussion repeats the results in Hjalmarsson (2005).
In the pure unit-root case, one popular inferential approach is to `` fully modify'' the OLS estimator as suggested by Phillips and Hansen (1990) and Phillips (1995). This estimator is suitable under Assumption 1, since it allows for a very general error structure. In the near-unit-root case, a similar method can be considered. Define the quasi-differencing operator
|
(10) |
and let
![]() and
and
![]() where
where
![]() , and
, and
![]() are
are
consistent estimates of the respective parameters.5 The fully modified OLS estimator is now given by
|
(11) |
where
![]() and
and
![]() .
The only difference in the
.
The only difference in the
definition of (11), from the FM-OLS
estimator for the pure unit-root case, is the use of the
quasi-differencing operator, as opposed to the standard
differencing operator. Once the innovations ![]() are obtained from
quasi-differencing, the modification proceeds in exactly the same
manner as in the unit-root case.
are obtained from
quasi-differencing, the modification proceeds in exactly the same
manner as in the unit-root case.
Define
![]() and the Brownian motion
and the Brownian motion
![]() . The process
. The process
![]() is now
orthogonal to
is now
orthogonal to ![]() and
and
![]() . Using the same
arguments as Phillips (1995), it follows that, as
. Using the same
arguments as Phillips (1995), it follows that, as
![]() ,
,
|
(12) |
Campbell and Yogo (2005) derive similar results, but they attack the problem from a test point-of-view, whereas the derivation by Hjalmarsson (2005) that is presented here starts with the estimation problem. However, presenting the derivation in this manner makes clear that this approach is a generalization of fully modified estimation.
Analogously, a generalization of the augmented regression
equation of Phillips (1991a) is possible. By obtaining
![]() through quasi-differencing, the augmented regression
through quasi-differencing, the augmented regression
| (13) |
can be estimated. Under Assumption 2, the OLS estimator of
![]() in equation (13)
will have an
in equation (13)
will have an
asymptotic distribution identical to that in (12).
Similar remedies to those just presented for the short-run case, such as the fully modified approach, can be considered in the long-run. However, simulations not reported in the paper show that the finite sample properties of the fully-modified long-run estimators appear very unsatisfactory. In the sequel I therefore focus on a long-run version of the augmented regression equation in (13), which turn out to work well in finite samples. The asymptotic results for the long-run FM-OLS estimator can be derived in a similar manner and are not given here.
Consider the fitted augmented regression equations
| (14) |
and
| (15) |
where
![]() . Let
. Let
![]() and
and
![]() be the OLS estimators
of
be the OLS estimators
of
![]() and
and
![]() in equations (14) and (15).
in equations (14) and (15).
1. Under the null hypothesis that ![]() , as
, as
![]() ,
such that
,
such that
![]() ,
,
|
(16) |
where
2. Under the alternative hypothesis that
![]() , as
, as
![]() ,
such that
,
such that
![]() ,
,
|
(17) |
Under the null hypothesis of no predictability, the estimators
![]() and
and
![]() have asymptotically
mixed normal distributions, although under the alternative
hypothesis of predictability, the asymptotic distributions are
still non-standard. It is interesting to note, however, that the
second order bias term that appears in the balanced long-run OLS
estimator
have asymptotically
mixed normal distributions, although under the alternative
hypothesis of predictability, the asymptotic distributions are
still non-standard. It is interesting to note, however, that the
second order bias term that appears in the balanced long-run OLS
estimator
![]() , under the alternative
hypothesis, is in fact eliminated by fitting the augmented
regression equation.
, under the alternative
hypothesis, is in fact eliminated by fitting the augmented
regression equation.
The results in Theorems 1 and 2 bring some clarity to the properties of long-run regressions with nearly persistent regressors. Under the null of no predictability, the long-run estimators have identical asymptotic distributions to the short-run estimators. Under the alternative hypothesis of predictability, however, the asymptotic properties of the long-run estimators change substantially and the results are now driven by the de facto misspecification of the long-run regressions, and the auto-regressive nature of the regressors; this is manifest in both the slower rate of convergence as well as the non-standard limiting distribution.
3.4 A Normally Distributed  Statistic for Long-Run
Inference
Statistic for Long-Run
Inference
Given the asymptotically mixed normal distributions of
![]() and
and
![]() under the null
hypothesis, standard test procedures can now be applied to test the
null of no predictability. In fact, the following convenient result
is easy to prove.
under the null
hypothesis, standard test procedures can now be applied to test the
null of no predictability. In fact, the following convenient result
is easy to prove.
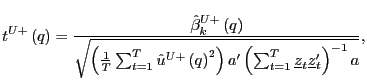
|
(18) |
and
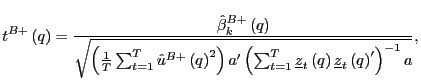
|
(19) |
where
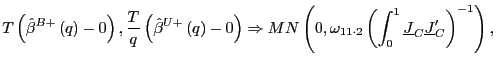
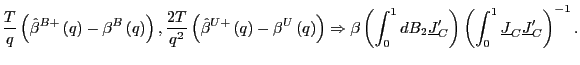
Thus, long-run inference can be performed by simply scaling the
corresponding standard ![]() statistic by
statistic by ![]() . In the case of exogenous regressors, such
that
. In the case of exogenous regressors, such
that
![]() , the
scaling result in (20) will of course apply to the
, the
scaling result in (20) will of course apply to the ![]() statistics from the standard long-run
estimators
statistics from the standard long-run
estimators
![]() and
and
![]() , which makes long-run
inference extremely straightforward in this case.
, which makes long-run
inference extremely straightforward in this case.
4 Monte Carlo Results
All of the above asymptotic results are derived under the
assumption that the forecasting horizon grows with the sample size,
but at a slower rate. Valkanov (2003) and Torous et al. (2004) also
study long-run regressions with near-integrated regressors, but
derive their asymptotic results under the assumption that
![]() as
as
![]() .
That is, they assume that the forecasting horizon grows at the same
pace as the sample size. Under such conditions, the asymptotic
properties of
.
That is, they assume that the forecasting horizon grows at the same
pace as the sample size. Under such conditions, the asymptotic
properties of
![]() and
and
![]() are quite different
from those derived in this paper. There is, of course, no right or
wrong way to perform the asymptotic analysis; what matters in the
end is how well the asymptotic distributions capture the properties
of actual finite sample estimates. To this end, a brief Monte Carlo
simulation is therefore conducted.
are quite different
from those derived in this paper. There is, of course, no right or
wrong way to perform the asymptotic analysis; what matters in the
end is how well the asymptotic distributions capture the properties
of actual finite sample estimates. To this end, a brief Monte Carlo
simulation is therefore conducted.
Equations (1) and (2) are simulated, with ![]() and
and ![]() drawn from an
drawn from an ![]() bivariate normal distribution
with mean zero, unit variance and correlation
bivariate normal distribution
with mean zero, unit variance and correlation
![]() . The large
negative correlation is chosen to assess the effectiveness of the
endogeneity corrections in
. The large
negative correlation is chosen to assess the effectiveness of the
endogeneity corrections in
![]() and
and
![]() , as well as to
reflect the sometimes high endogeneity of regressors such as the
dividend- or earnings-price ratio in tests of stock return
predictability. The intercept
, as well as to
reflect the sometimes high endogeneity of regressors such as the
dividend- or earnings-price ratio in tests of stock return
predictability. The intercept ![]() is set to one and the local-to-unity parameter
is set to one and the local-to-unity parameter
![]() is set to either
0 or
is set to either
0 or ![]() . Three different estimators, and their
corresponding
. Three different estimators, and their
corresponding ![]() statistics,
are considered: the long-run estimators,
statistics,
are considered: the long-run estimators,
![]() and
and
![]() , as well as the
short-run OLS estimator in the augmented regression equation
(13).6 Since the
aim of the simulation is to determine how well the asymptotic
distributions derived above reflect actual finite sample
distributions, all estimation and testing is done under the
assumption that the parameter
, as well as the
short-run OLS estimator in the augmented regression equation
(13).6 Since the
aim of the simulation is to determine how well the asymptotic
distributions derived above reflect actual finite sample
distributions, all estimation and testing is done under the
assumption that the parameter ![]() is known. The sample sizes are chosen as
is known. The sample sizes are chosen as
![]() and
and ![]() .
.
The first part of the simulation study evaluates the finite
sample properties of the three estimators under an alternative of
predictability, where the true ![]() is set equal to
is set equal to ![]() and the second part analyzes the size and power
properties of the scaled
and the second part analyzes the size and power
properties of the scaled ![]() tests. The forecasting horizon is set to
tests. The forecasting horizon is set to
![]() and
and ![]() for the
for the ![]() and
and ![]() samples, respectively. These
forecasting horizons are similar to those often used in practice
for similar sample sizes. All results are based on
samples, respectively. These
forecasting horizons are similar to those often used in practice
for similar sample sizes. All results are based on ![]() repetitions.
repetitions.
The results are shown in Figures 1 and 2 for ![]() and
and ![]() , respectively. In the top two panels, (A1) and
(A2) in both figures, the kernel estimates of the densities of the
estimated coefficients are shown. To enable a fair comparison,
, respectively. In the top two panels, (A1) and
(A2) in both figures, the kernel estimates of the densities of the
estimated coefficients are shown. To enable a fair comparison,
![]() is divided by
is divided by
![]() and
and
![]() by
by ![]() , as indicated by the result in
Theorem 1. The non-standard distributions of
, as indicated by the result in
Theorem 1. The non-standard distributions of
![]() and
and
![]() under the alternative
are evident, especially so for
under the alternative
are evident, especially so for
![]() . The fact that
. The fact that
![]() converges faster
than
converges faster
than
![]() under the
alternative, after proper scaling, is also clear. This is
especially clear in the
under the
alternative, after proper scaling, is also clear. This is
especially clear in the ![]() case shown in Figure 2. The short-run estimator
outperforms both long-run estimators, however. In the bottom
graphs, (B1) and (B2), the rejection rates of the
case shown in Figure 2. The short-run estimator
outperforms both long-run estimators, however. In the bottom
graphs, (B1) and (B2), the rejection rates of the ![]() two-sided
two-sided ![]() tests, for tests of the null of no
predictability, are given. For both
tests, for tests of the null of no
predictability, are given. For both ![]() and
and ![]() , all three tests have a rejection rate very
close to
, all three tests have a rejection rate very
close to ![]() under the
null, so the scaling of the long-run
under the
null, so the scaling of the long-run ![]() statistics by
statistics by ![]() appears to work well in practice, as well as
the endogeneity corrections. For
appears to work well in practice, as well as
the endogeneity corrections. For ![]() there are some slight deviations from the
nominal
there are some slight deviations from the
nominal ![]() size in
the average rejection rates under the null. These deviations are
small, however, and well within the acceptable range; the rejection
rates for
size in
the average rejection rates under the null. These deviations are
small, however, and well within the acceptable range; the rejection
rates for
![]() and
and
![]() under the null of no
predictability are
under the null of no
predictability are ![]() and
and ![]() , respectively,
for
, respectively,
for ![]() , and
, and
![]() and
and ![]() for
for ![]() . The test based on the
. The test based on the
![]() estimator has
similar power properties to the short-run test, although the
short-run test performs better in all instances. The test based on
estimator has
similar power properties to the short-run test, although the
short-run test performs better in all instances. The test based on
![]() performs rather
poorly in all cases.
performs rather
poorly in all cases.
In summary, the simulation results show that the endogeneity
correction performed in
![]() and
and
![]() appears to work well
and that the scaling of the
appears to work well
and that the scaling of the ![]() statistic, as suggested by Corollary 1, achieves the
correct size. Both the asymptotically slower rate of convergence
for
statistic, as suggested by Corollary 1, achieves the
correct size. Both the asymptotically slower rate of convergence
for
![]() and
and
![]() under the alternative
of predictability and the finite sample results given in Figures 1
and 2 indicate that there is little reason to consider long-run
tests if one believes that the alternative model of stock return
predictability is given by equation (1).
under the alternative
of predictability and the finite sample results given in Figures 1
and 2 indicate that there is little reason to consider long-run
tests if one believes that the alternative model of stock return
predictability is given by equation (1).
Simulations not reported in this paper also show that these results are robust to heteroskedastic error terms in the form of ARCH/GARCH processes.
5 Feasible Methods
To implement the methods described in the two previous sections,
knowledge of the parameter ![]() is required. Since
is required. Since ![]() is typically unknown and not estimable in general,
the bounds procedures of Cavanagh et al. (1995) and Campbell and
Yogo (2005) can be used to obtain feasible procedures. The
following discussion assumes a scalar regressor, as do the above
studies.
is typically unknown and not estimable in general,
the bounds procedures of Cavanagh et al. (1995) and Campbell and
Yogo (2005) can be used to obtain feasible procedures. The
following discussion assumes a scalar regressor, as do the above
studies.
Although ![]() is not
estimable, a confidence interval for
is not
estimable, a confidence interval for ![]() can be obtained, as described by Stock (1991). By
evaluating the estimator and test-statistic for each value of
can be obtained, as described by Stock (1991). By
evaluating the estimator and test-statistic for each value of
![]() in that confidence
interval, a range of possible estimates and values of the
test-statistic are obtained. A conservative test can then be formed
by choosing the most conservative value of the test statistic,
given the alternative hypothesis. If the confidence interval has a
coverage rate of
in that confidence
interval, a range of possible estimates and values of the
test-statistic are obtained. A conservative test can then be formed
by choosing the most conservative value of the test statistic,
given the alternative hypothesis. If the confidence interval has a
coverage rate of
![]() and the nominal size
of the test is
and the nominal size
of the test is
![]() , then by
Bonferroni's inequality the final conservative test will have a
size no greater than
, then by
Bonferroni's inequality the final conservative test will have a
size no greater than
![]() . In general, the size of
the test will be less than
. In general, the size of
the test will be less than ![]() , and a test with a pre-specified size can be
achieved by fixing
, and a test with a pre-specified size can be
achieved by fixing
![]() and
adjusting
and
adjusting
![]() . Since a
test-statistic will by necessity be conservative only against a
one-sided alternative, conservative confidence intervals provide a
more convenient way of presenting the results from the Bonferroni
tests. Let
. Since a
test-statistic will by necessity be conservative only against a
one-sided alternative, conservative confidence intervals provide a
more convenient way of presenting the results from the Bonferroni
tests. Let
![]() and
and
![]() denote
the values in the
denote
the values in the
![]() confidence interval
for
confidence interval
for ![]() , for which the
test-statistic takes on the largest and smallest value,
respectively. The lower bound of the
, for which the
test-statistic takes on the largest and smallest value,
respectively. The lower bound of the
![]() confidence interval for
confidence interval for
![]() is then given by
is then given by
![]() and the upper bound by
and the upper bound by
![]() , where the
, where the
![]() and
and
![]() subscripts indicate that the estimators and the test-statistics are
evaluated for these values of
subscripts indicate that the estimators and the test-statistics are
evaluated for these values of ![]() and
and
![]() denotes the
denotes the
![]() quantile of the standard normal distribution. Again,
quantile of the standard normal distribution. Again,
![]() can be
adjusted to achieve a desired
can be
adjusted to achieve a desired
![]() coverage rate.
Analogously, a confidence interval for
coverage rate.
Analogously, a confidence interval for
![]() can be constructed from the
estimator
can be constructed from the
estimator
![]() . Note that, unlike
the short-run methods in Campbell and Yogo (2005), there is no
guarantee that
. Note that, unlike
the short-run methods in Campbell and Yogo (2005), there is no
guarantee that
![]() and
and
![]() are the
endpoints of the confidence interval for
are the
endpoints of the confidence interval for ![]() , although for most values of
, although for most values of
![]() they typically are;
the test-statistics should thus be evaluated for all values in
they typically are;
the test-statistics should thus be evaluated for all values in
![]() , to find
, to find
![]() and
and
![]() .
.
In the empirical section, I adopt a similar approach to Campbell
and Yogo (2005). A confidence interval for ![]() is obtained by inverting the DF-GLS
unit-root statistic. Table 2 of Campbell and Yogo (2005) is used to
find the desired significance level of this confidence interval in
order for the confidence interval for the long-run slope
coefficient to have a
is obtained by inverting the DF-GLS
unit-root statistic. Table 2 of Campbell and Yogo (2005) is used to
find the desired significance level of this confidence interval in
order for the confidence interval for the long-run slope
coefficient to have a ![]() coverage rate. A drawback of this method is that
no clear-cut point estimate is produced, but rather a range of
estimates. I therefore present standard long-run OLS point
estimates in the empirical work below.
coverage rate. A drawback of this method is that
no clear-cut point estimate is produced, but rather a range of
estimates. I therefore present standard long-run OLS point
estimates in the empirical work below.
6 Empirical Application to Stock Return Predictability
To illustrate the theoretical results derived in this paper, I
revisit the question of stock return predictability. There have
been many conflicting results regarding the existence of a
predictable component in stock returns. However, the most recent
work by Lewellen (2004) and Campbell and Yogo (2005), which rely on
both robust as well as more efficient methods of inference, do find
evidence that stock returns are predictable to some degree. In this
section, I extend their empirical analysis to the long-horizon
case. Since the long-run estimators
![]() and
and
![]() , which control for
the endogeneity and persistence in the regressors, and the
corresponding scaled
, which control for
the endogeneity and persistence in the regressors, and the
corresponding scaled ![]() tests
are effectively long-run versions of the methods developed in
Campbell and Yogo (2005), the empirical results presented here
provide a direct comparison with previous work.
tests
are effectively long-run versions of the methods developed in
Campbell and Yogo (2005), the empirical results presented here
provide a direct comparison with previous work.
To further facilitate comparison between the short-run and the long-run case, I use a subset of the data used by Campbell and Yogo (2005); these data were downloaded from Professor Yogo's website.7 They consist of the annual excess returns on the S&P 500 over the period 1880-2002 as well as the monthly excess returns on the CRSP NYSE/AMEX value-weighted index over the period 1926-2002. The excess returns are calculated as the stock returns over the riskfree rate, measured by the return on the one-month T-bill for the monthly data, and by the return on the three-month T-bill rolled over quarterly for the annual data. As predictor variables, I use the dividend-price ratio and the smoothed earnings-price ratio suggested by Campbell and Shiller (1988). The dividend price ratio is calculated as dividends over the past year divided by the current price and the (smoothed) earnings-price ratio as the average earnings of the past 10 years divided by the current price. Since earnings are not available for the CRSP data, the corresponding S&P 500 earnings are used for this series as well. All regressions are run using log-transformed variables with the log excess returns as the dependent variable.
The two key data characteristics that define the properties of
the regression estimators analyzed in this paper are the near
persistence and endogeneity of the regressors. Table 1 shows
confidence intervals for the local-to-unity parameter ![]() , calculated by inverting the DF-GLS
unit-root test, as well as estimates of the correlation between the
innovations to returns and the innovations to the regressors; these
estimates are labeled
, calculated by inverting the DF-GLS
unit-root test, as well as estimates of the correlation between the
innovations to returns and the innovations to the regressors; these
estimates are labeled ![]() in Table 1. The values are calculated in an
identical manner to those of Table 4 in Campbell and Yogo (2005).
As is evident, there is a large negative correlation between the
innovations to returns and the predictor variables, both for the
dividend- and earnings-price ratios. With the exception of the
annual earnings-price ratio series, the confidence intervals for
in Table 1. The values are calculated in an
identical manner to those of Table 4 in Campbell and Yogo (2005).
As is evident, there is a large negative correlation between the
innovations to returns and the predictor variables, both for the
dividend- and earnings-price ratios. With the exception of the
annual earnings-price ratio series, the confidence intervals for
![]() include the unit-root
case and it is clear that all predictor variables have first order
auto-regressive roots that are close to unity. There is thus a
strong case for using estimators that correct for the bias induced
by the endogeneity and persistence in the regressors.
include the unit-root
case and it is clear that all predictor variables have first order
auto-regressive roots that are close to unity. There is thus a
strong case for using estimators that correct for the bias induced
by the endogeneity and persistence in the regressors.
Given the poor performance of the
![]() estimator in the
simulation exercises, I only show results for the estimator
estimator in the
simulation exercises, I only show results for the estimator
![]() ; the standard
version,
; the standard
version,
![]() , of this estimator is
also what is typically used in long-run tests of stock return
predictability. To illustrate the effects of an increasing
forecasting horizon, I show the estimates, with confidence
intervals, as plots against the forecasting horizon
, of this estimator is
also what is typically used in long-run tests of stock return
predictability. To illustrate the effects of an increasing
forecasting horizon, I show the estimates, with confidence
intervals, as plots against the forecasting horizon ![]() . Figures 3 and 4 show the results
for the annual S&P 500 returns and the monthly CRSP returns,
respectively. The left-hand plots in these figures show the
. Figures 3 and 4 show the results
for the annual S&P 500 returns and the monthly CRSP returns,
respectively. The left-hand plots in these figures show the
![]() Bonferroni
confidence intervals based on the estimator
Bonferroni
confidence intervals based on the estimator
![]() and the right hand
plots show the standard long-run OLS point estimate
and the right hand
plots show the standard long-run OLS point estimate
![]() , along with
, along with
![]() confidence
intervals. The OLS confidence intervals, calculated as
confidence
intervals. The OLS confidence intervals, calculated as
![]() , are shown as a comparison, but are not valid since the
long-run OLS estimator is not mixed normally distributed; that is,
these confidence intervals take into account the overlap in the
data, but not the endogeneity and persistence in the regressors.
The Bonferroni confidence intervals are calculated according to the
methods described in the previous section, based on an inversion of
the DF-GLS statistic. The estimates and confidence intervals have
all been scaled by
, are shown as a comparison, but are not valid since the
long-run OLS estimator is not mixed normally distributed; that is,
these confidence intervals take into account the overlap in the
data, but not the endogeneity and persistence in the regressors.
The Bonferroni confidence intervals are calculated according to the
methods described in the previous section, based on an inversion of
the DF-GLS statistic. The estimates and confidence intervals have
all been scaled by ![]() ,
as suggested by Theorem 1, to ease comparison across different
horizons.
,
as suggested by Theorem 1, to ease comparison across different
horizons.
At the one-period horizon, the results are qualitatively
identical to those of Campbell and Yogo;8 based on the Bonferroni confidence
intervals shown in the right hand side graphs of Figures 3 and 4,
there is evidence that the earnings-price ratio predicts
stock-returns both in the annual and the monthly data, but the null
of no predictability cannot be rejected when using the dividend
price ratio as a regressor. If standard OLS methods were used to
make inference, the null hypothesis would be rejected in all cases,
for both the earnings- and dividend-price ratio, at the one-period
horizon. What is interesting, however, is the behaviour of the
confidence intervals as the forecasting horizon increases. Contrary
to some popular beliefs, the evidence in favour of predictability
is not stronger at the longer horizons. In fact, the case for
predictability typically becomes weaker as the forecasting horizon
increases. Only in the monthly data, with the dividend-price ratio
as a regressor, is there slightly stronger evidence at longer
horizons. However, the long-run evidence is extremely weak and
seems more like random fluctuations than a consistent pattern; the
confidence intervals are pointwise along ![]() and the overall confidence level in
the monthly case could thus be substantially less than the nominal
pointwise level. It is also clear that failure to control for the
endogeneity and persistence in the regressors will vastly overstate
the case for predictability, in the long-run as well as the
short-run. This is particularly evident in the results for the
monthly data, shown in Figure 4.
and the overall confidence level in
the monthly case could thus be substantially less than the nominal
pointwise level. It is also clear that failure to control for the
endogeneity and persistence in the regressors will vastly overstate
the case for predictability, in the long-run as well as the
short-run. This is particularly evident in the results for the
monthly data, shown in Figure 4.
Given the theoretical results, and the simulation evidence presented earlier in this paper, these empirical results are not hard to reconcile. Since the evidence of predictability is weak also at the short horizon, and there is a demonstrated loss of power as the forecasting horizon increases, it is not surprising that the null of no predictability cannot be rejected for longer horizons.
These results also generally agree with those of Ang and Bekaert (2003) who also draw the conclusion that the evidence of predictability tends to be strongest at a shorter horizon. Their findings suggest that previous strong evidence of long-run predictability may be largely due to incorrect inference based on Hansen and Hodrick (1980) and Newey and West (1987) methods, as well as a much stronger case for predictability in data ending before 1990. Ang and Bekaert (2003) use Hodrick (1992) auto-correlation robust standard errors, which they argue have good finite sample properties. However, these rely on the regressors being covariance stationary, which is a restrictive assumption for variables like the dividend- and earnings-price ratio, as evidenced by the results in Table 1. Boudoukh et al. (2005) explicitly question the prevailing view of long-horizon predictability and reach similar conclusions to those presented here, although their focus is on the joint properties of the regression estimators across different horizons.
7 Conclusion
I derive several new results for long-horizon regressions that use overlapping observations when the regressors are endogenous and nearly persistent. I show how to properly correct for the overlap in the data in a simple manner that obviates the need for auto-correlation robust standard error methods in these regressions. Further, when the regressors are persistent and endogenous, I show how to correct the long-run OLS estimators and test procedures in a manner similar to that proposed by Campbell and Yogo (2005) for the short-run case.
In addition, by analyzing the asymptotic properties of the long-run estimators under an alternative of predictability, I find strong evidence that long-horizon tests tend to have less power to detect deviations from the null hypothesis of no predictability than do one-period short-run tests.
An empirical application to stock-return predictability illustrates these results and shows that, in line with the theoretical results of this paper, the evidence for predictability is typically weaker as the forecasting horizon gets longer, reflecting the loss of power in long-run tests.
A Proofs
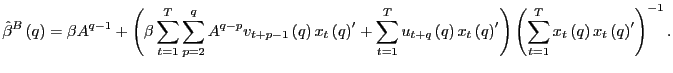
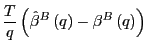
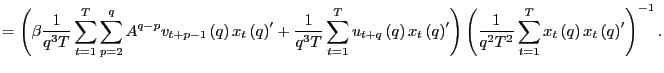
1. (a) Under the null hypothesis,
as
![]() ,
such that
,
such that
![]() , since
for any
, since
for any ![]() ,
,
![]()
Therefore,
(b) Under the null hypothesis,
![]()
|
||
where
since
![]() .
Now, using Skorohod's representation theorem, there exists a
probability
.
Now, using Skorohod's representation theorem, there exists a
probability
space with random variables
![]() , for which
, for which
![]()
![]() and
and
![]() where `
where `![]() '
denotes distributional equivalence. Since the asymptotic limit of
'
denotes distributional equivalence. Since the asymptotic limit of
![]() is identical
for all
is identical
for all ![]() ,
,
![]() and
and
|
|
||
|
Since
![]() for all
for all ![]() , and
, and
![]() , it follows that as
, it follows that as
![]() ,
,
as
![]() .
Similarly, let
.
Similarly, let
![]()
![]() and
and
![]() For any fixed
For any fixed ![]() and
and ![]() ,
,
![]() Using the same methods as for the denominator, as
Using the same methods as for the denominator, as
![]() ,
,
2. (a) Next, consider the properties
of
![]() under the alternative
hypothesis. By summing up on both sides in equation (1),
under the alternative
hypothesis. By summing up on both sides in equation (1),

|
||
|
where
|
||
|
By previous results, as
|
||
|
||
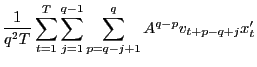
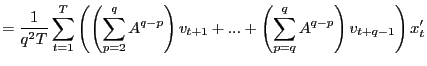
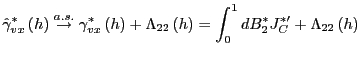
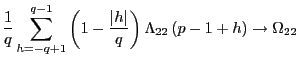
![$\displaystyle =\frac{1}{q}\left[ \left( \frac{1}{q}\sum_{p=2}^{q}A^{q-p}\right)... ...1}{q}\sum_{p=q} ^{q}A^{q-p}\right) \hat{\gamma}_{vx}\left( q-1\right) \right] ,$](img218.gif)
|
where
|
|
||
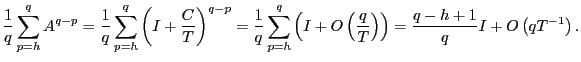
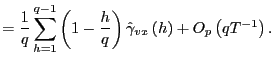
![$\displaystyle =\frac{1}{q}\left[ \left( \frac{q-1}{q}+O\left( qT^{-1}\right) \r... ...1}{q}+O\left( qT^{-1}\right) \right) \hat{\gamma}_{vx}\left( q-1\right) \right]$](img222.gif)
|
||
|
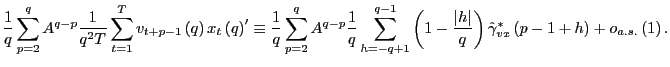
For any
where
![]() Since
Since
![]() , as
, as
![]() ,
and
,
and
![]() as
as
![]() , it
follows that
, it
follows that
(b) As in part 2.(a),
Observe that
![]() ,
,
![]() ,
,
![]() and one can therefore write
and one can therefore write
|
||
|
Thus,
Let
![]() and consider
and consider
Since
![]() as
as
![]() and
and
![]() as
as
![]() ,
,
it follows that
Proof of Theorem 2. Only the derivations for
![]() are shown. The proof
for
are shown. The proof
for
![]() follows in a similar
manner, although with somewhat simpler arguments given the
short-run nature of the regressors in this case.
follows in a similar
manner, although with somewhat simpler arguments given the
short-run nature of the regressors in this case.
1. Start with
![]() under the
null-hypothesis. Let
under the
null-hypothesis. Let
![]() be the
be the ![]() vector of observations, and define
vector of observations, and define
![]() and
and
![]() analogously. The OLS estimator of
analogously. The OLS estimator of
![]() in (15) is now given by
in (15) is now given by
As
![]() ,
,
![]()
![]()

 and
and 
as
![]() ,
by standard results (e.g. Andrews, 1991), since
,
by standard results (e.g. Andrews, 1991), since
![]() . By identical
. By identical
arguments,
as
![]() ,
,
Thus,
![]()

2. Now consider
![]() under the alternative
hypothesis. Observe that,
under the alternative
hypothesis. Observe that,


|
||
|
||
|
Consider
By similar arguments as above, as
![]() ,
,
![]() and
and
![]() Further,
Further,
|
||
|
||
|
||
|
as
Proof of Corollary 1. Under the null hypothesis, following the arguments in the Proof of Theorem 2,
|
||
|
Identical arguments hold for
where
![]() and
and
![]() are the standard
are the standard ![]() statistics corresponding to
statistics corresponding to
![]() and
and
![]() . The results now
follow directly from the asymptotically mixed normal distributions
of the estimators.
. The results now
follow directly from the asymptotically mixed normal distributions
of the estimators. ![]()
References
1. Andrews, D.W.K., 1991. Heteroskedasticity and Autocorrelation Consistent Covariance Matrix Estimation, Econometrica 59, 817-858.
2. Ang, A., and G. Bekaert, 2003. Stock Return Predictability: Is it There? Working paper, Columbia University.
3. Boudoukh J., and M. Richardson, 1993. Stock Returns and Inflation: A Long-Horizon Perspective, American Economic Review 83, 1346-1355.
4. Boudoukh J., M. Richardson, and R.F. Whitelaw, 2005. The myth of long-horizon predictability, NBER working paper 11841.
5. Berkowitz, J., and L. Giorgianni, 2001. Long-horizon exchange rate predictability?, Review of Economics and Statistics 83, 81-91.
6. Campbell, J.Y., 2001. Why long horizons? A study of power against persistent alternatives, Journal of Empirical Finance 8, 459-491.
7. Campbell, J.Y., and R. Shiller, 1988. Stock prices, earnings, and expected dividends, Journal of Finance 43, 661-676.
8. Campbell, J.Y., and M. Yogo, 2005. Efficient Tests of Stock Return Predictability, forthcoming Journal of Financial Economics.
9. Cavanagh, C., G. Elliot, and J. Stock, 1995. Inference in models with nearly integrated regressors, Econometric Theory 11, 1131-1147.
10. Corbae D., S. Ouliaris, and P.C.B. Phillips, 2002. Band Spectral Regression with Trending Data, Econometrica 70, 1067-1109.
11. Daniel, K., 2001. The power and size of mean reversion tests, Journal of Empirical Finance 8, 493-535.
12. Fama, E.F., and K.R. French, 1988a. Dividend yields and expected stock returns, Journal of Financial Economics 22, 3-25.
13. Fama, E.F., and K.R. French, 1988b. Permanent and Temporary Components of Stock Prices, Journal of Political Economy, 96, 256-73.
14. Fisher, M.E., and J.J. Seater, 1993. Long-Run Neutrality and Superneutrality in an ARIMA Framework, American Economic Review 83, 402-415.
15. Goetzman W.N., and P. Jorion, 1993. Testing the Predictive Power of Dividend Yields, Journal of Finance 48, 663-679.
16. Hansen, L.P., and R.J. Hodrick, 1980. Forward Exchange Rates as Optimal Predictors of Future Spot Rates: An Econometric Analysis, Journal of Political Economy 88, 829-853.
17. Hjalmarsson, E., 2005. Fully modified estimation with nearly integrated regressors, Working paper, Division of International Finance, Federal Reserve Board.
18. Hodrick, R.J., 1992. Dividend Yields and Expected Stock Returns: Alternative Procedures for Inference and Measurement, Review of Financial Studies 5, 357-386.
19. Jansson, M., and M.J. Moreira, 2004. Optimal Inference in Regression Models with Nearly Integrated Regressors, Working Paper, Harvard University.
20. Lanne, M., 2002. Testing the Predictability of Stock Returns, Review of Economics and Statistics 84, 407-415.
21. Lewellen, J., 2004. Predicting returns with financial ratios, Journal of Financial Economics, 74, 209-235.
22. Mankiw, N.G., and M.D. Shapiro, 1986. Do we reject too often? Small sample properties of tests of rational expectations models, Economic Letters 20, 139-145.
23. Mark, N.C., 1995. Exchange Rates and Fundamentals: Evidence on Long-Horizon Predictability, American Economic Review 85, 201-218.
24. Mark, N.C., and D. Sul, 2004. The Use of Predictive Regressions at Alternative Horizons in Finance and Economics, NBER Technical Working Paper 298.
25. Mishkin, F.S., 1990. What does the term structure tell us about future inflation?, Journal of Monetary Economics 25, 77-95.
26. Mishkin, F.S., 1992. Is the Fisher effect for real?, Journal of Monetary Economics 30, 195-215.
27. Moon, R., A. Rubia, and R. Valkanov, 2004. Long-Horizon Regressions when the Predictor is Slowly Varying, Working Paper, UCLA, Anderson School of Management.
28. Nelson, C.R., and M.J. Kim, 1993. Predictable Stock Returns: The Role of Small Sample Bias, Journal of Finance 48, 641-661.
29. Newey, W., and K. West, 1987. A Simple, Positive Semi-Definite, Heteroskedasticity and Autocorrelation Consistent Covariance Matrix, Econometrica 55, 703-708.
30. Phillips, P.C.B, 1987. Towards a Unified Asymptotic Theory of Autoregression, Biometrika 74, 535-547.
31. Phillips, P.C.B, 1988. Regression Theory for Near-Integrated Time Series, Econometrica 56, 1021-1043.
32. Phillips, P.C.B, 1991a. Optimal Inference in Cointegrated Systems, Econometrica 59, 283-306.
33. Phillips, P.C.B, 1991b. Spectral regression for cointegrated time series, in Nonparametric and Semiparametric Methods in Economics and Statistics, edited by W. Barnett, J. Powell, and G. Tauchen. Cambridge, Cambridge University Press.
34. Phillips, P.C.B, 1995. Fully Modified Least Squares and Vector Autoregression, Econometrica 63, 1023-1078.
35. Phillips, P.C.B, and B. Hansen, 1990. Statistical Inference in Instrumental Variables Regression with I(1) Processes, Review of Economic Studies 57, 99-125.
36. Phillips, P.C.B., and V. Solo, 1992. Asymptotics for Linear Processes, Annals of Statistics, 20, 971-1001.
37. Polk, C., S. Thompson, and T. Vuolteenaho, 2004. Cross-sectional Forecasts of the Equity Premium, Working Paper, Harvard University.
38. Rapach D.E., and M.E. Wohar, 2005. Valuation ratios and long-horizon stock price predictability, Journal of Applied Econometrics 20, 327-344.
39. Richardson, M., and T. Smith, 1991. Tests of Financial Models in the Presence of Overlapping Observations, Review of Financial Studies 4, 227-254.
40. Richardson, M., and J.H. Stock, 1989. Drawing Inferences from Statistics Based on Multiyear Asset Returns, Journal of Financial Economics 25, 323-348.
41. Rossi, B., 2005. Testing long-horizon predictive ability with high persistence, and the Meese-Rogoff puzzle, International Economic Review 46, 61-92.
42. Stambaugh, R., 1999. Predictive regressions, Journal of Financial Economics 54, 375-421.
43. Stock, J.H., 1991. Confidence intervals for the largest autoregressive root in U.S. economic time-series. Journal of Monetary Economics 28, 435-460.
44. Torous, W., R. Valkanov, and S. Yan, 2004. On Predicting Stock Returns with Nearly Integrated Explanatory Variables, Journal of Business 77, 937-966.
45. Valkanov, R., 2003. Long-horizon regressions: theoretical results and applications, Journal of Financial Economics 68, 201-232.
Table 1
Characterstics of the predictor
variables. This table reports the key time-series characteristics
of the dividend-price ratio ![]() and the earnings-price ratio
and the earnings-price ratio ![]() . The S&P 500 variables are on
an annual frequency and the CRSP data on a monthly frequency. The
column labeled
. The S&P 500 variables are on
an annual frequency and the CRSP data on a monthly frequency. The
column labeled ![]() gives the estimated correlations between the innovations to the
predictor variables and the innovations to the corresponding excess
returns. The last column gives a 95% confidence interval of the
local-to-unity parameter
gives the estimated correlations between the innovations to the
predictor variables and the innovations to the corresponding excess
returns. The last column gives a 95% confidence interval of the
local-to-unity parameter ![]() ,
obtained by inverting the DF-GLS unit-root test
statistic.
,
obtained by inverting the DF-GLS unit-root test
statistic.
| Series | Sample Period | Obs. | Variable | ||
|---|---|---|---|---|---|
| S&P 500 |
|
||||
| S&P 500 |
|
||||
| CRSP |
|
||||
| CRSP |
|
Figure 1
Figure 1 depicts results from the
Monte Carlo simulation for ![]() . The top two graphs, (A1) and (A2), show the
kernel estimates of the densities of the estimated coefficients,
using the estimators
. The top two graphs, (A1) and (A2), show the
kernel estimates of the densities of the estimated coefficients,
using the estimators
![]()
![]() , and
, and
![]() , referred to as
Balanced, Unbalanced and Short-run, respectively, in the legend.
The true value of
, referred to as
Balanced, Unbalanced and Short-run, respectively, in the legend.
The true value of ![]() is equal to
is equal to ![]() As
suggested by the result in Theorem1,
As
suggested by the result in Theorem1,
![]() and
and
![]() are divided by
are divided by
![]() and
and ![]() , respectively, with
, respectively, with ![]() , to enable a
fair comparison between the estimators. The bottom graphs, (B1) and
(B2), show the average rejection rates of the scaled
, to enable a
fair comparison between the estimators. The bottom graphs, (B1) and
(B2), show the average rejection rates of the scaled ![]() tests corresponding to the respective
estimators; the flat dashed lines show the
tests corresponding to the respective
estimators; the flat dashed lines show the ![]() level.
level.
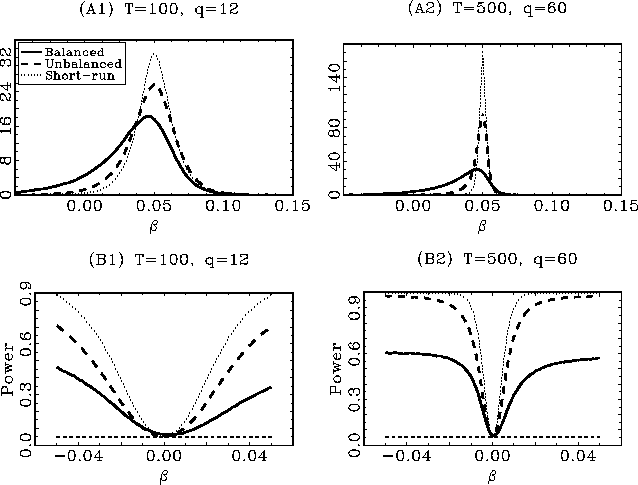
Figure 2
Figure 2 depicts results from the
Monte Carlo simulation for ![]() . The top two graphs, (A1) and (A2), show the
kernel estimates of the densities of the estimated coefficients,
using the estimators
. The top two graphs, (A1) and (A2), show the
kernel estimates of the densities of the estimated coefficients,
using the estimators
![]()
![]() , and
, and
![]() , referred to as
Balanced, Unbalanced and Short-run, respectively, in the legend.
The true value of
, referred to as
Balanced, Unbalanced and Short-run, respectively, in the legend.
The true value of ![]() is equal to
is equal to ![]() As
suggested by the result in Theorem1,
As
suggested by the result in Theorem1,
![]() and
and
![]() are divided by
are divided by
![]() and
and ![]() , respectively, with
, respectively, with
![]() , to enable a
fair comparison between the estimators. The bottom graphs, (B1) and
(B2), show the average rejection rates of the scaled
, to enable a
fair comparison between the estimators. The bottom graphs, (B1) and
(B2), show the average rejection rates of the scaled ![]() tests corresponding to the respective
estimators; the flat dashed lines show the
tests corresponding to the respective
estimators; the flat dashed lines show the ![]() level.
level.
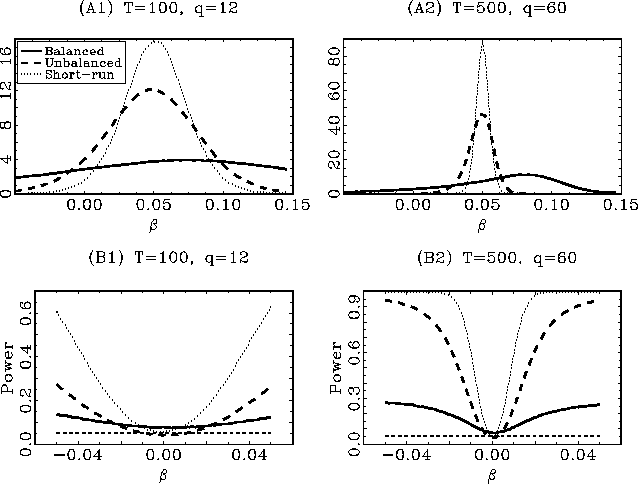
Figure 3
Figure 3 depicts estimation results
for the annual S&P 500 data. The top two graphs show the
results for the earnings-price ratio
![]() .
In the left hand one, (A1), the
.
In the left hand one, (A1), the ![]() Bonferroni confidence intervals for the slope
coefficient
Bonferroni confidence intervals for the slope
coefficient ![]() are
plotted as a function of the forecasting horizon
are
plotted as a function of the forecasting horizon ![]() . These are obtained from the
endogeneity corrected long-run estimator
. These are obtained from the
endogeneity corrected long-run estimator
![]() and the
corresponding scaled
and the
corresponding scaled ![]() statistics. They are thus asymptotically valid for
statistical inference. To enable comparison across
statistics. They are thus asymptotically valid for
statistical inference. To enable comparison across ![]() , the confidence bounds have been
scaled by
, the confidence bounds have been
scaled by ![]() as
suggested by Theorem 1. As a
comparison, in the right hand graph, (A2), the standard
as
suggested by Theorem 1. As a
comparison, in the right hand graph, (A2), the standard ![]() confidence
intervals for the long-run OLS estimator
confidence
intervals for the long-run OLS estimator
![]() are shown, along with
the point estimate
are shown, along with
the point estimate
![]() (the dotted line).
These confidence intervals are calculated as
(the dotted line).
These confidence intervals are calculated as
![]() and are not valid since they are based on the assumption of
an asymptotically mixed normal distribution of
and are not valid since they are based on the assumption of
an asymptotically mixed normal distribution of
![]() . Again, the point
estimates and the confidence bounds have been scaled by
. Again, the point
estimates and the confidence bounds have been scaled by ![]() . The flat dashed
lines indicate zero. The bottom graphs, (B1) and (B2), show the
corresponding results for the dividend-price ratio
. The flat dashed
lines indicate zero. The bottom graphs, (B1) and (B2), show the
corresponding results for the dividend-price ratio
![]() .
.

Figure 4
Figure 4 depicts estimation results
for the monthly CRSP data. The top two graphs show the results for
the earnings-price ratio
![]() .
In the left hand one, (A1), the
.
In the left hand one, (A1), the ![]() Bonferroni confidence intervals for the slope
coefficient
Bonferroni confidence intervals for the slope
coefficient ![]() are
plotted as a function of the forecasting horizon
are
plotted as a function of the forecasting horizon ![]() . These are obtained from the
endogeneity corrected long-run estimator
. These are obtained from the
endogeneity corrected long-run estimator
![]() and the
corresponding scaled
and the
corresponding scaled ![]() statistics. They are thus asymptotically valid for
statistical inference. To enable comparison across
statistics. They are thus asymptotically valid for
statistical inference. To enable comparison across ![]() , the confidence bounds have been
scaled by
, the confidence bounds have been
scaled by ![]() as
suggested by Theorem 1. As a
comparison, in the right hand graph, (A2), the standard
as
suggested by Theorem 1. As a
comparison, in the right hand graph, (A2), the standard ![]() confidence
intervals for the long-run OLS estimator
confidence
intervals for the long-run OLS estimator
![]() are shown, along with
the point estimate
are shown, along with
the point estimate
![]() (the dotted line).
These confidence intervals are calculated as
(the dotted line).
These confidence intervals are calculated as
![]() and are thus not valid since they are based on the
assumption of an asymptotically mixed normal distribution of
and are thus not valid since they are based on the
assumption of an asymptotically mixed normal distribution of
![]() . Again, the point
estimates and the confidence bounds have been scaled by
. Again, the point
estimates and the confidence bounds have been scaled by ![]() . The flat dashed
lines indicate zero. The bottom graphs, (B1) and (B2), show the
corresponding results for the dividend-price ratio
. The flat dashed
lines indicate zero. The bottom graphs, (B1) and (B2), show the
corresponding results for the dividend-price ratio
![]() .
.
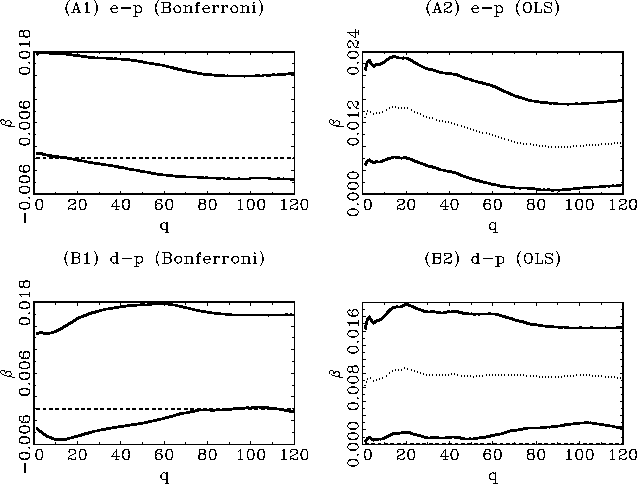
Footnotes
1. This paper was part of the author's Ph.D. dissertation at Yale University and parts of the contents were previously circulated under the title `` On the Predictability of Global Stock Returns''. Return to text
2. I have greatly benefitted from comments by my advisors, Peter Phillips and Robert Shiller. I am also grateful for advice from Don Andrews, Ray Fair, Jon Faust, Lennart Hjalmarsson, Yuichi Kitamura, Taisuke Otsu, Randi Pintoff, as well participants in the econometrics seminar and workshop at Yale University, the finance seminar at Göteborg University, and the World meeting of the Econometric Society in London. Tel.: +1-202-452-2436; fax: +1-202-263-4850; email: [email protected]. The views presented in this paper are solely those of the author and do not represent those of the Federal Reserve Board or its staff. Return to text
3. Other applications of long-horizon regressions include tests of exchange rate predictability (Mark, 1995, and Rossi 2005), the Fisher effect (Mishkin, 1990, 1992, and Boudoukh and Richardson, 1993), and the neutrality of money (Fisher and Seater, 1993). Return to text
4. There is now a large literature on regressions with overlapping observations. Additional references to those mentioned previously include Hansen and Hodrick (1980), Richardson and Stock (1989), Richardson and Smith (1991), Hodrick (1992), Nelson and Kim (1993), Goetzman and Jorion (1993), Daniel (2001), Moon et al. (2004), Torous et al. (2004), and Boudoukh et al. (2005). The study by Valkanov (2003) is the most closely related to this paper and is discussed in more detail below.
Studies on (short-run) predictive regressions in the context of persistent regressors include Mankiw and Shapiro (1986), Cavanagh et al. (1995), Stambaugh (1999), Lewellen (2004), Janson and Moreira (2004), Polk et al. (2004), and Campbell and Yogo (2005). Return to text
5. The definition of
![]() is slightly different from the one found in Phillips (1995). This
is due to the predictive nature of the regression equation
(1), and the martingale difference sequence
assumption on
is slightly different from the one found in Phillips (1995). This
is due to the predictive nature of the regression equation
(1), and the martingale difference sequence
assumption on ![]() . Return to
text
. Return to
text
6. As shown by Phillips (1991a), in the case of normally distributed errors, the OLS estimator in the short-run augmented regression equation (13) will in fact be equal to the maximum likelihood estimator. Return to text
7. http://finance.wharton.upenn.edu/~yogo/ Return to text
8. They are not numerically
identical since the confidence intervals based on
![]() , with
, with ![]() , will be slightly different from
those based on Campbell and Yogo's
, will be slightly different from
those based on Campbell and Yogo's ![]() test. Also, unlike here, all results in Campbell and
Yogo are standardized to conform with a model where both innovation
processes have unit variance. Return to
text
test. Also, unlike here, all results in Campbell and
Yogo are standardized to conform with a model where both innovation
processes have unit variance. Return to
text
This version is optimized for use by screen readers. A printable pdf version is available.