
Release Date: March 27, 2009
Release dates | Documentation
Current Monthly Release Other formats: ASCII | PDF (144 KB)
Supplemental Monthly Release Other formats: ASCII | PDF (144 KB)
Annual Revision Release Other formats: ASCII | PDF (150 KB)
Data Download Program (DDP) | Announcements | Historical data (text files)
INDUSTRIAL PRODUCTION AND CAPACITY UTILIZATION:
THE 2009 HISTORICAL AND ANNUAL REVISION
.
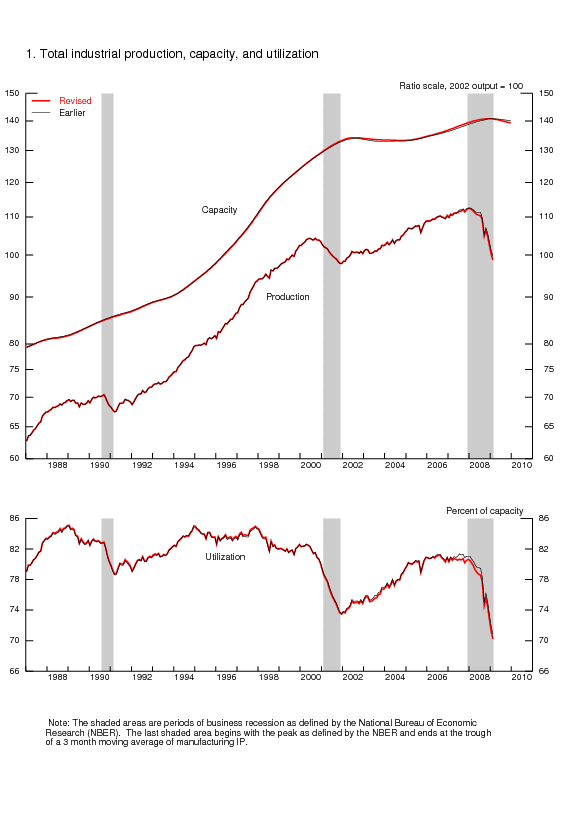
The Federal Reserve has revised the index of industrial production (IP) and the related measures of capacity and capacity utilization. Although rates of change from January 1972 through February 2009 are affected, the revision has its largest impact on data in 2007 and 2008. The overall contour of total IP is little changed by the revision: The index posted moderate increases from 2004 through 2007 but declined sharply in 2008. Relative to earlier estimates, measured from fourth quarter to fourth quarter, total IP is now reported to have increased 0.3 percentage point more slowly in 2007 and to have decreased 0.5 percentage point more rapidly in 2008; the index for February 2009 now stands about 1 percent below its previously published level.
The revision shows that the rates of capacity utilization for total industry in the fourth quarters of 2007 and 2008 were about 1/2 percentage point lower than previously estimated. At 74.3 percent, overall utilization in the fourth quarter of 2008 was 6.6 percentage points below its 1972-2008 (long-run) average.
The revision to IP incorporates new data from the following sources: manufacturing data from selected 2007 Current Industrial Reports from the U.S. Census Bureau, annual data on the publishing industry from the Census Bureau's Services Annual Survey, new annual data on mineral extraction for 2006 and 2007 from the U.S. Geological Survey (USGS), annual data on logging for 2007 from the U.S. Forest Service, the 2002 input-output tables from the Bureau of Economic Analysis (BEA), and updated price deflators from the BEA. Comprehensive benchmark data for manufacturing for 2007 are not yet available. The results of both the 2007 Census of Manufactures and the 2008 Annual Survey of Manufactures (both from the Census Bureau) should be available for the 2010 revision to the IP indexes. Results from the 2007 and 2008 Quarterly Surveys of Plant Capacity, however, were used to augment the regular monthly production indicators in the revised production indexes for those years. The new monthly production estimates also reflect the incorporation of updated seasonal factors and monthly and quarterly source data that became available (or were revised) after the closing of the reporting window.
The revised capacity utilization rates incorporate the results from the Census Bureau's Quarterly Survey of Plant Capacity for the fourth quarters of 2007 and 2008. In addition, the revisions to the capacity indexes and capacity utilization rates incorporate the revised production indexes and newly available data on industrial capacity from the USGS, the Energy Information Administration of the U.S. Department of Energy (DOE), and other organizations.
RESULTS OF THE REVISION
The tables show the summary statistics for the annual revision. Tables 1A and 1B show the monthly, quarterly, and annual average index levels for IP and for capacity and utilization for January 1979 through February 2009, along with percent changes in IP and capacity utilization rates. Tables 2 and 3 show the revised rates of change in IP from 2004 through 2008 for market groups, industry groups, special aggregates, and selected detail. Table 4 shows the revised annual rates of change in IP for the 2004-08 period for selected detail, and table 5 shows the rates of change in capacity by industry groups for the 2005-09 period. Tables 2 through 5 also show the difference between the revised and earlier rates of change. Table 6 shows the revised capacity utilization rates for the final quarters of 2005 through 2008 and the differences between the revised and previous rates. Tables 7A, 7B, 8A, 8B, 9A, and 9B report the revised production, capacity, and utilization series for manufacturing, total industry excluding selected high-technology industries, and manufacturing excluding selected high-technology industries. Table 10 reports the annual proportions in IP by market and industry groups for 2001 through 2008. Table 11 reports revised IP indexes and capacity utilization rates for the major market and industry groups for the most recent six months.
Industrial Production
The changes in total IP were revised slightly for 2007 and 2008 (table 2), but the overall contour for recent years was little changed--moderate gains for 2004 through 2007 are still followed by a drop in the index in 2008.[1] Compared with the previous estimates, the increase in output in 2007 is now reported to have been slower, and the decline in 2008 is now reported to have been faster.[2] The increases for 2004 through 2006 are little changed.
Production by Industry Group
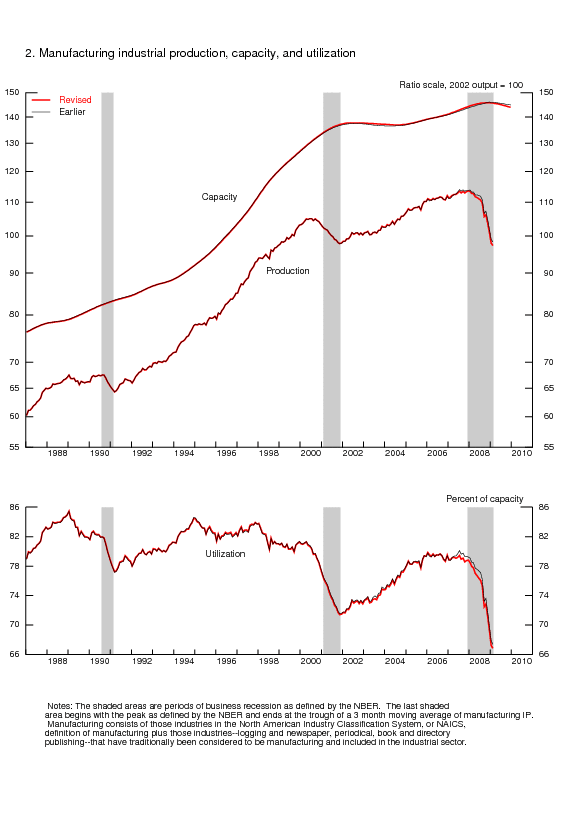
Manufacturing production expanded, on net, during the 2004-07 period, albeit at a somewhat slower rate than initially reported, before contracting in 2008.[3] For durable goods industries as a whole, output rose in each year from 2004 through 2007, although these gains have been moderated by the recent revision. Durable goods output fell sharply in 2008, and that drop was little changed, on net, compared with the previous estimate. For the 2004-06 period, the revisions to output in most durable goods industries were relatively modest, with the exception of computer and electronic products, in which the gain in output in 2006 is now stated to have been significantly lower. Relative to previous estimates, the current revision reports noticeably lower output indexes in 2007 for wood products, nonmetallic mineral products, computer and electronic products, and furniture and related products but it reports a noticeably higher output index in 2007 for miscellaneous durable goods. For 2008, relative to previous estimates, higher output indexes are reported for electrical equipment, appliances, and components and for furniture and related products, but the production indexes for wood products, primary metals, machinery, and computer and electronic products were revised down moderately.
Production in nondurable manufacturing industries advanced in every year from 2004 through 2007 but fell sharply in 2008. Within the nondurable goods sector, output in most recent years was little changed, on net, compared with previous estimates. The current revision reports noticeably higher rates of change in 2007 in textile and product mills, apparel and leather, and petroleum and coal products but a noticeably lower rate of change in chemicals. For 2008, output is now reported to have fallen markedly faster for apparel and leather, printing and support activities, chemicals, and plastics and rubber products compared with previous estimates.
The revised output index for non-NAICS manufacturing (logging and publishing) fell each year from 2005 through 2008, with a particularly sharp drop in 2008. The rate of change for these industries in 2006 is substantially higher than stated earlier, but revisions to the rates for other years were smaller. The index for mining rose modestly in the past two years after a jump in 2006; the increase in 2006 was revised up relative to previous estimates, but the index is otherwise similar to what was previously reported. The index for utilities is also nearly unchanged from previous estimates, with the exception of 2008, for which the index now shows a small decline rather than a small advance.
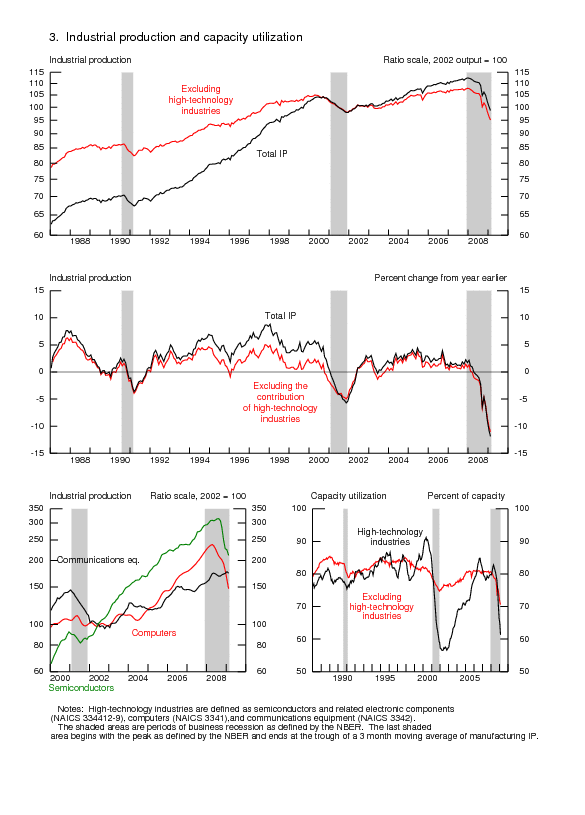
The estimates for selected high-technology industries--computers and peripheral equipment, communications equipment, and semiconductors and related electronic components--had sizable revisions over the 2004-08 period (table 3). On net, output in the high-tech sector is still reported to have posted gains in recent years, with robust increases from 2004 through 2007 followed by a moderate contraction in 2008. However, the increases in 2006 and 2007 are now shown to have been slower, and the decrease in 2008 is now shown to have been more rapid, than reported earlier. The index for computers and peripheral equipment rose in each of the years from 2004 through 2007 and then fell in 2008; the rates of change were revised up in each of the past few years except 2005. The output of communications equipment expanded in each of the past few years, but the rates of increase in most years are markedly lower than estimated previously, particularly in 2007. Production of semiconductors and related components rose solidly from 2004 through 2007 but contracted significantly in 2008; the rates of change in 2004, 2006, 2007, and 2008 are notably lower than formerly reported, and the rise in 2005 is now higher.
Production by Market Group
The production index for final products and nonindustrial supplies (table 2) posted moderate gains from 2004 through 2007 and then fell markedly in 2008. The rates of change in the index are a bit lower than previously reported for 2007 and 2008 but are little changed for previous years.[4]
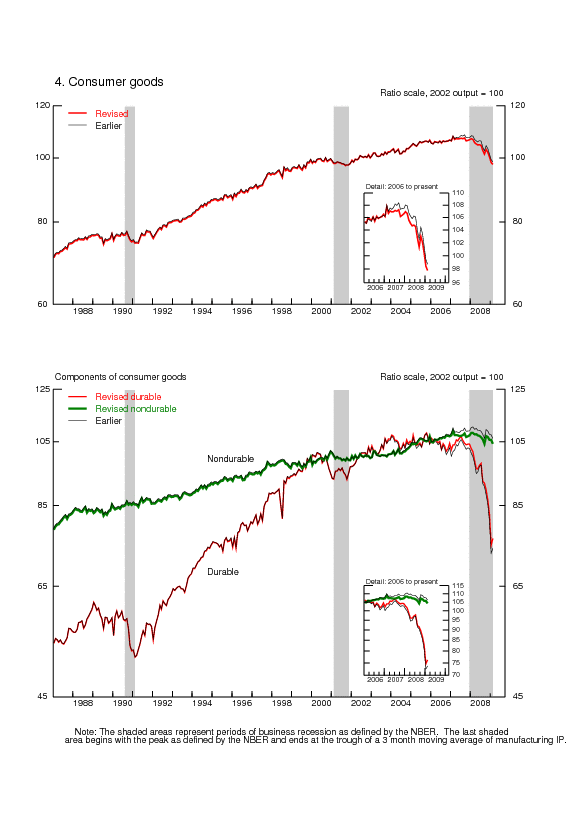
The production of consumer goods rose modestly in 2004 and 2005, was almost unchanged in 2006 and 2007, and then moved down significantly in 2008. Compared with previous estimates, output was revised down noticeably in 2007; the revisions to other recent years were much smaller. The output of durable consumer goods fell slightly, on net, from 2004 through 2007 and then dropped steeply in 2008; the rate of change was revised up somewhat in 2006. Among durable consumer goods, the most significant revisions were in the index for home electronics, which now increases less rapidly in 2005 and 2006, but more rapidly in 2004 and 2007; in 2008, the index now posts an advance instead of a decline.
The index for consumer nondurables shows moderate gains in output for 2004, 2005, and 2006 and modest contractions for 2007 and 2008. The index for consumer nondurable non-energy goods was nearly unaltered in every year except 2007, which now shows a decline. In that year, significantly lower estimates of the output of chemical products and of paper products more than account for the revision. The index for consumer energy products was revised down in 2008 but still posted moderate increases, on net, over the past few years.
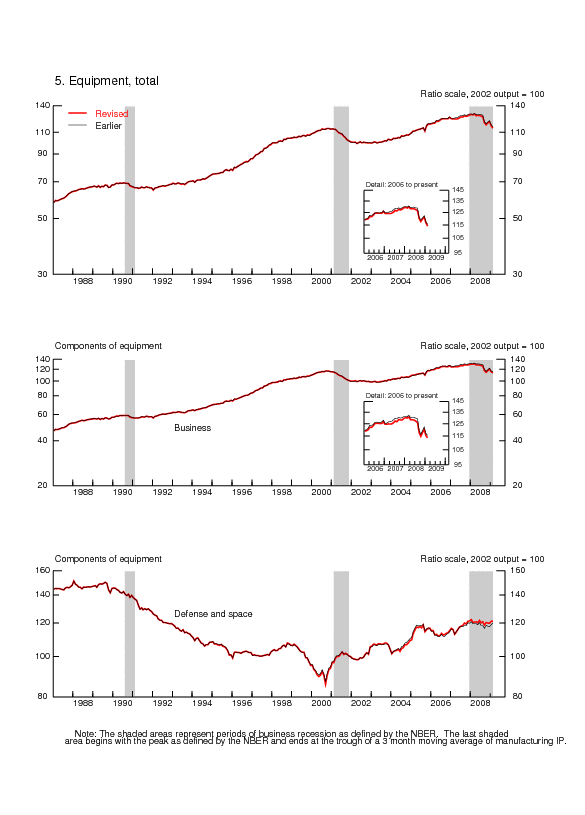
The production of business equipment increased solidly from 2004 through 2006, rose modestly in 2007, and then deteriorated in 2008. Relative to previous estimates, the rate of change in the index was noticeably lower in 2005 and 2007; the revisions to other recent years were smaller. For transit equipment, output rose substantially, on net, from 2004 through 2006 and fell back in 2007; the index plummeted in 2008, partly because of weakness in the motor vehicle industry and partly because of a strike at a major aircraft producer in the second half of the year. The rates of change in the index for transit equipment were revised down in 2004, 2005, and 2008; were revised up in 2007; and were little changed in 2006. The production of information processing equipment expanded in each year from 2004 through 2008. The increases in each year were revised down, however, except in 2004 and in 2008, for which the index now posts an advance instead of a small decline. The production of defense and space equipment is now estimated to have risen more slowly in 2004 and more quickly in 2005 and 2007; the declines in 2006 and 2008 are now reported to have been smaller than stated previously.
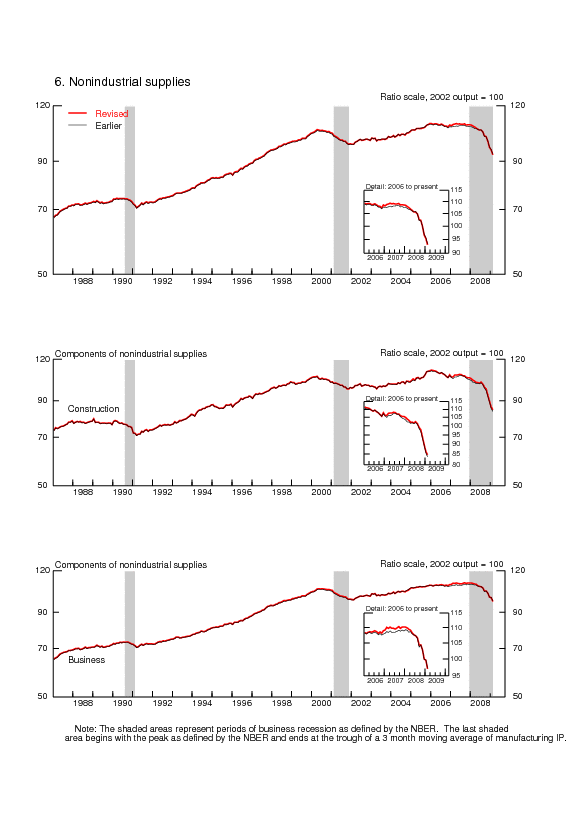
After posting gains in 2004 and 2005, the output of construction supplies fell back in 2006 and 2007 and then dropped sharply in 2008; relative to earlier estimates, the index decreased less in 2007. The production of business supplies rose modestly from 2004 through 2007 and then slumped in 2008; this index now reports a small increase for 2006 instead of a small decline, and the rate of change in 2008 is weaker than previously reported.
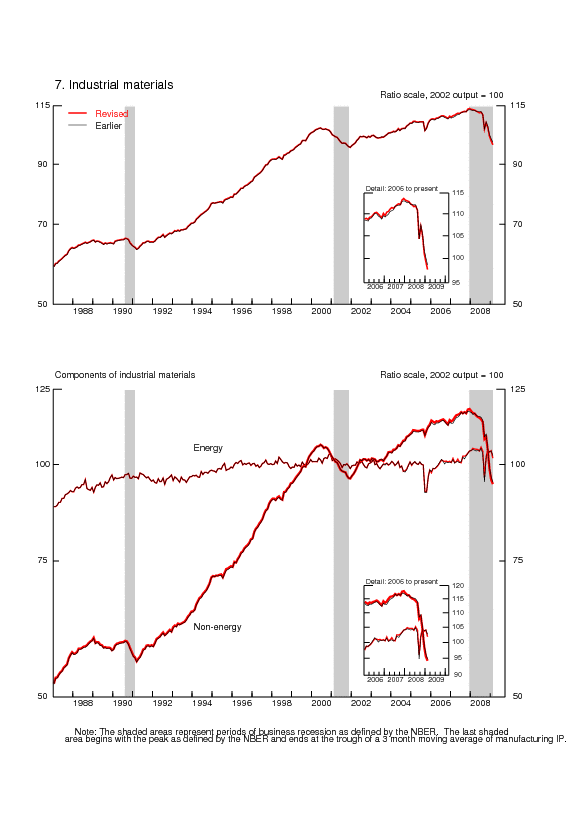
The index for materials moved up over the years 2004 through 2007, then fell markedly in 2008; the rate of change in 2008 is now somewhat weaker than the previous estimate. The indexes for durable and nondurable materials both fell more than 10 percent in 2008 after having increased moderately, on net, from 2004 through 2007. Relative to earlier estimates, over the 2004-08 window, the rates of change for the index for durable materials are lower, on net, but the rates of change for the index for nondurable materials are higher overall. The index for energy materials only edged up in 2008 after having increased moderately in the previous two years, and it is little changed by the revision.
Capacity
Overall, total industrial capacity posted moderate gains from 2005 through 2008 but is expected to decline in 2009 (table 5). The rates of change in both 2008 and 2009 were revised down noticeably from earlier estimates, but revisions to earlier years were smaller. The contour of manufacturing capacity and the revisions to that contour are similar to those for total industry. Aggregate capacity for the selected high-technology industries rose in each year from 2005 through 2009; the revision shows that, relative to previous reports, capacity in these industries rose less quickly in 2005, 2006, and especially 2008 but increased somewhat more rapidly in 2007 and it is expected to rise in 2009. Excluding high-technology industries, manufacturing capacity expanded from 2005 through 2008 but is expected to decline in 2009. The current estimates are similar to previous reports except for 2009, for which the contraction in capacity is now anticipated to be greater than stated previously.
Capacity at mines is estimated to have fallen in 2005 and to have expanded from 2006 through 2008; it is expected to recede somewhat in 2009. The gains in 2006 and 2008 are now reported to have been stronger than previously published, but the rates of change in 2007 and 2009 have been revised down. Capacity at electric and gas utilities has risen each year since 2004. The current estimates show quicker gains in 2005 and 2006 than reported earlier; revisions to other recent years were negligible.
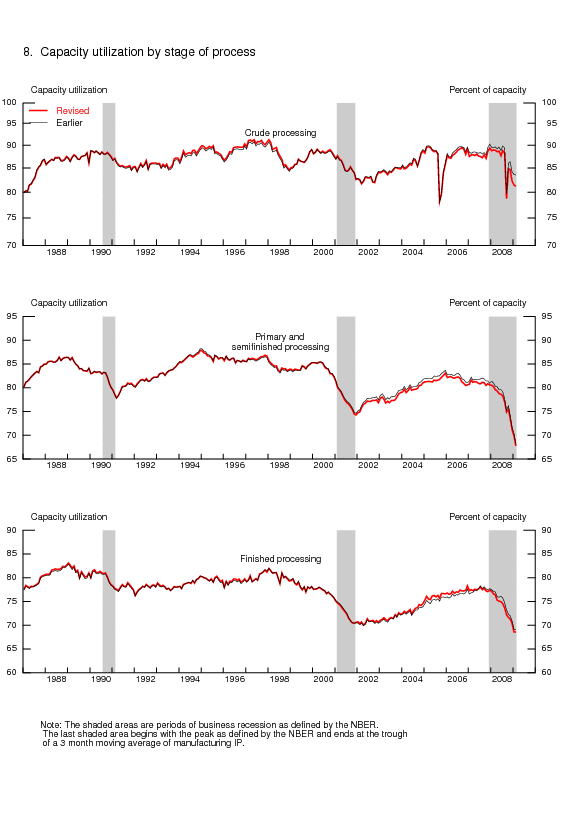
By stage of processing, capacity in the crude stage is now reported to have risen more in 2006 and 2008 than previously shown but is now expected to fall in 2009. The rates of change for capacity in the primary and semifinished stages were revised down for 2008 and 2009; revisions to earlier years were slight. Relative to previous estimates, increases to the index for finished goods processors were revised up in 2007 and 2008, but capacity is expected to fall more in 2009 than stated previously.
Capacity Utilization
From 2005 through 2007, the capacity utilization rate for total industry stood a little below its long-run (1972 to 2008) average of 80.9 percent but in 2008 fell to a level more than 6-1/2 percentage points below its long-run average (table 6). The utilization rate for total industry was revised down noticeably in 2007 and 2008; revisions to earlier years were slight. Similarly, manufacturing capacity utilization, on balance, spent 2005 through 2007 at a little below its long-run average of 79.6 percent and tumbled to 71.1 percent in the fourth quarter of 2008, 8-1/2 percentage points below its long-run average.
Relative to earlier reports, the factory operating rate was revised down in 2007 and 2008. Within durable goods, utilization rates for most industries were near their long-run averages from 2005 through 2007 and then dropped well below average in 2008; an exception was motor vehicles and parts, in which the utilization rate was significantly below average in 2006 and 2007 and then fell even further in 2008. In the fourth quarter of 2008, three durable goods industries (nonmetallic mineral products, primary metals, and furniture and related products) had utilization rates between 10 and 20 percentage points below their long-run averages, and two durable goods industries (wood products, and motor vehicles and parts) had utilization rates more than 20 percentage points below their long-run averages. Among durable goods industries, some of the larger downward revisions to utilization over the 2005-08 period were for wood products, nonmetallic mineral products, and motor vehicles and parts. The durable goods industries that reported the largest net upward revisions since 2005 were machinery; electrical equipment, appliances, and components; aerospace and miscellaneous transportation equipment; and furniture and related products.
As with the durable goods industries, utilization rates for most nondurable goods industries were near their long-run averages from 2005 through 2007 but turned down sharply in 2008. In the fourth quarter of 2008, four nondurable goods industries (textile and product mills, paper, printing and support activities, and plastics and rubber products) had utilization rates between 10 and 20 percentage points below their long-run averages. Among nondurable goods industries, the following industries had the largest downward revisions to their utilization rates over the 2005-08 period: food, beverage, and tobacco products; petroleum and coal products; and plastics and rubber products. Textile and product mills, apparel and leather, and printing and support activities had the largest upward revisions to their utilization rates over the 2005-08 period. Capacity utilization in the other (non-NAICS) manufacturing category was revised downward for 2005 and upward for 2006 through 2008.
The operating rates for the selected high-technology industries were slightly above their long-run averages in the fourth quarters of 2006 and 2007 but fell more than 7 percentage points below their long-run averages in 2008. Relative to earlier estimates, capacity utilization is now reported to have been higher in 2005, 2006, and 2008 but lower in 2007. The operating rates for computers and peripheral equipment are now shown to have been higher than previously reported in each of the past few years, particularly 2008. Utilization rates for communications equipment are now higher than previously reported in 2005 and 2006 but lower in 2007 and 2008. Capacity utilization in the semiconductors and related electronic components industry was above or near its long-run average from 2005 through 2007, but, in the fourth quarter of 2008, although it was revised up, it still stood at more than 14 percentage points below its long-run average.
Capacity utilization in mining was generally above its long-run average from 2005 through 2008, and in the fourth quarter of 2008 stood at 89.5 percent, almost 2 percentage points higher than its long-run average. Relative to earlier estimates, the utilization rate for mining was a little lower in 2006 and 2008 but was little changed in 2005 and 2007. At electric and gas utilities, capacity utilization rates were revised down for 2005 through 2008, and capacity utilization in the fourth quarter of 2008 is now estimated to have been nearly 4 percentage points below its long-run average.
TECHNICAL ASPECTS OF THE REVISION
Comprehensive data for 2007 for manufacturing were not available for this revision. After incorporating the limited information that was available, the benchmark indexes for manufacturing--defined for each six-digit NAICS industry as nominal gross output divided by a price index--were little changed before 2007. The principal changes resulted from small revisions to price indexes from the Bureau of Economic Analysis and from improved estimates of price indexes for communications equipment output constructed by the Federal Reserve (discussed below). In addition, the benchmark indexes for logging and publishing (included in the IP index for manufacturing but no longer included in manufacturing under NAICS) were advanced through 2007 and updated for 2006 based on data from the U.S. Forest Service and the Census Bureau.
The IP indexes in recent years did incorporate information from selected Current Industrial Reports for 2007, the revised input-output accounts for 2002 from the BEA, the Quarterly Survey of Plant Capacity for 2007 and 2008, and other annual industry reports. The indexes also incorporated revised monthly and quarterly source data on production, shipments, inventories, and production-worker hours.
As mentioned earlier, the benchmark indexes for most industries incorporate updated price indexes from the industry output program of the BEA. However, the price indexes for pharmaceuticals (NAICS 325412), for semiconductors (NAICS 334413), and for most components of communications equipment (NAICS 3342) are constructed by the Federal Reserve from alternative sources.[5]
Changes to the Methodology for Adjusting for Temporary Help Supply Employees.
The compilation of the initial IP estimate for a given month relies heavily on the hours worked by production workers in the manufacturing sector when the availability of the other IP source data is limited. The hours data are adjusted to account for the labor input of temporary help supply (THS) employees who work in the manufacturing sector. The procedure for implementing this adjustment is as follows. An estimate is made of the component of THS employment that is allocated to manufacturing. This estimate begins with a baseline figure projected from the Current Population Survey but varies based on the cyclical movements of the manufacturing sector and the rest of the economy--THS employment has a cyclical pattern similar to that of manufacturing.[6] The THS employment in manufacturing is then allocated among the NAICS three-digit industries based on each industry's use of THS workers and cyclical patterns. With this revision, the allocation of THS employment among industries within manufacturing was updated based on data from the annual Survey of Plant Capacity for 2002 through 2005.[7]
In addition, this revision updates the method for estimating each industry's monthly baseline share of temporary help employment use in manufacturing. Previously, this share was held constant for each industry at the level estimated according to the method above. With this revision, the share is allowed to evolve based on the industry's share of total manufacturing employment.
An adjusted production-worker hour series for each three-digit manufacturing industry is computed by adding THS hours for an industry (THS employment multiplied by assumptions on hours per week and relative productivity) to the reported production-worker hours for the industry. The percentage adjustment for each three-digit industry's hours is then applied to the hours series for each of its component industries. These adjusted detailed hours series are used in making (1) estimates for those IP series based on labor input for the period for which benchmark output indexes are not yet available and (2) preliminary estimates of those IP series based on physical product data for which the current source data are not yet available.
Changes to Individual Production and Capacity Series
With this revision, the monthly production indicators for some series have changed.
Carpet and Rug Mills
The index for carpet and rug mills (NAICS 31411) is based on quarterly data on unit shipments from the Carpet and Rug Institute. Formerly, it was based on monthly data from the same source. A cubic spline is used to interpolate monthly values from the quarterly figures, a method similar to that used for the other series for which only quarterly physical product data are available.[8]
High-Technology Goods
Computers
The six product-based indexes for electronic computer manufacturing (NAICS 334111) are derived from quarterly data on domestic absorption from International Data Corporation, an industry research group. Previously, to construct the monthly indicator, the nominal absorption data were aggregated to the industry level and converted to domestic industry shipments based on the Census Bureau's trade data (by adding exports and subtracting imports). The industry-level ratio of shipments to domestic absorption was applied to each of the six product-level absorption estimates to obtain product-level shipments. With this revision, domestic absorption is now adjusted to reflect domestic production using the Census Bureau's quarterly Current Industrial Report for computers and peripheral equipment when available, and it is projected forward using a model-based trend.
Communications equipment
Price indexes for two product classes in the communications equipment industry were revised to incorporate additional product detail. The price index for enterprise and home voice equipment (NAICS 33421, part), which covers the production of telephones, was updated. This price index was previously calculated using average selling prices for two types of phones (corded and cordless) but is now a matched-model index constructed using detailed data, beginning in 1997, from the Consumer Electronics Association on transmission frequency, number of lines, and presence of other features such as caller identification, speakerphone, and integrated answering machine. The price index for wireless system equipment (NAICS 33422, part), which covers mobile phone infrastructure, was improved by folding in additional detail on base-station radio transmission capacity using data from the Dell'Oro Group, a market research firm. The resulting mobile infrastructure price index falls 4 percentage points faster per year, on average, from 2000 to 2008.
Capacity
Electricity generation
The capacity index for electric power generation, transmission, and distribution (NAICS 2211) is now based on generation capability data from the Department of Energy; previously it was based on electricity generation capacity data from the North American Electric Reliability Council (NERC). The change was made because the DOE data are compiled using a more consistent definition over time. However, because the DOE data are published with a lag, the capacity projection for the most recent year or two is estimated by extending the DOE generation capability series by the rate of change shown for the NERC electricity generation capacity data.
Nonferrous metals (except aluminum)
The capacity index for nonferrous metal (except aluminum) production and processing (NAICS 3314) is now based on copper smelting, copper refining, and zinc smelting data from the U.S. Geological Survey. Formerly the capacity index was based on the USGS data on just copper smelting and copper refining.
Natural gas extraction
The DOE no longer publishes physical capacity estimates for natural gas extraction (NAICS 211111, part). Capacity estimates for recent years are based on output projections from the Short-Term Energy Outlook (STEO) and Annual Energy Outlook (AEO) reports of the DOE.
Trend-through-peak estimates
The trend-through-peak method of estimating capacity is used for those industries in mining and utilities for which there are no physical capacity sources�seven individual series accounting for about 5 percent of capacity. With this revision, the trend-through-peak method used to estimate capacity indexes for oil extraction (NAICS 211111, part), natural gas liquid extraction (NAICS 211112), and natural gas sales and transmission (NAICS 2212) is based on production indexes that are extended using output projections from the STEO and AEO reports from the DOE.
The basic method in estimating trend-through-peak capacities for these industries is to construct baseline estimates of capacity by connecting peaks in production, with these peaks representing 100 percent utilization. In practice, the procedure involves a fair degree of judgment and deviates from a strict trend-through-peak approach in a variety of ways. Most importantly, if a peak in production was reached several years ago and production has not subsequently approached that previous maximum, published capacity levels generally will, after a time, trend downward. That is, they will tend to follow recent IP. Second, historically, the capacity levels corresponding to peaks in production for different series have yielded a variety of peak utilization rates.
Weights for Aggregation
The IP index is a Fisher index. The weights for manufacturing industries are derived from value-added measures from the Census of Manufactures and the Annual Survey of Manufactures. The Federal Reserve derives estimates of value added for the electric and gas utility industries from annual revenue and expense data issued by other organizations. The weights for aggregation, expressed as unit value added, were estimated with the latest data on producer prices for the period after 2006. Table10 shows the annual value-added proportions in the IP index from 2001 through 2008.
The outputs of most industries are inputs to multiple markets. Although data are sometimes available that directly split the output of an industry by its purchaser, most industry output measures do not provide that detail. With the 2002 annual revision, weights that allocate individual IP indexes into multiple market groups were derived from the 1997 input-output tables from the BEA.[9] With this revision, the weights for the period from 2002 forward were updated using estimates from the 2002 input-output tables. The weights for the period up through 1997 are still computed from the 1997 tables, and the weights between 1997 and 2002 are linear combinations of the 1997 and 2002 weights.
Revised Monthly Data
This revision incorporates product data that became available or were revised after the regular six-month reporting window for monthly IP was closed. These data were released with too great a lag to be included with monthly IP estimates but were available for inclusion in the annual revision.
Revised Seasonal Factors
Seasonal factors for all series were reestimated using data that extend into 2008 or 2009. Factors for production-worker hours--which adjust for timing, holiday, and monthly seasonal patterns--were updated with data through February 2009. The updated factors for the physical product series, which include adjustments for holiday and workday patterns, used data through 2008. Seasonal factors for unit motor vehicle assemblies have been updated, and projections through September 2009 are on the Board's website at http://www.federalreserve.gov/releases/g17/mvsf.htm.
Data Availability and Publication Changes
Files containing the revised data and the text and tables from this release are available on the Board's website at www.federalreserve.gov/releases/g17, as are updated data for the annual revision and for all of the regularly issued series on industrial production, capacity, and capacity utilization. The revised data will also be available through the STAT-USA website of the Department of Commerce (www.stat-usa.gov). Further information on these revisions is available from the Board's Industrial Output Section (telephone 202-452-3197).
A document with printed tables of the revised estimates of series shown in the G.17 release is available upon request to the Industrial Output Section, Mail Stop 82, Division of Research and Statistics, Board of Governors of the Federal Reserve System, Washington, DC 20551.
An expanded version of this release will be published in a forthcoming article in the Federal Reserve Bulletin.
[1] In this section, all the rates of change are calculated from the fourth quarter of the previous year to the fourth quarter of the reference year. Estimates for the fourth quarter of 2008 are subject to further revision in the upcoming monthly releases.
Return to text
[2] The downward revision to overall IP in 2008 primarily reflects changes to the underlying indexes, but more than 0.1 percentage point of the revision to the rate of change resulted from updating the weights for energy goods to reflect the drop in energy prices in mid-2008.
Return to text
[3] Manufacturing consists of those industries in the North American Industry Classification System, or NAICS, definition of manufacturing plus those industries--logging and newspaper, periodical, book, and directory publishing--that traditionally have been considered to be manufacturing.
Return to text
[4] Although aggregate IP was little revised before 2007, some market groups had noticeable revisions. These revisions were often due to the incorporation of the 2002 input-output tables in the IP estimates, which changed the allocation of individual IP indexes among market groups.
Return to text
[5] A table that lists annual and quarterly price indexes for the networking equipment component of communications equipment follows.
Return to text
[6] See Marcello Estevao and Saul Lach (1999), "Measuring Temporary Labor Outsourcing in U.S. Manufacturing," Finance and Economics Discussion Series 1999-57 (Washington: Board of Governors of the Federal Reserve System, October).
Return to text
[7] For several years, the Annual Survey of Plant Capacity collected information about the share of production workers that consisted of temporary workers; this information is not collected in the Quarterly Survey of Plant Capacity.
Return to text
[8] See Richard D. Raddock (1993), "Industrial Production, Capacity, and Capacity Utilization since 1987," Federal Reserve Bulletin, vol. 79 (June).
Return to text
[9] See Carol Corrado (2003), "Industrial Production and Capacity Utilization: The 2002 Historical and Annual Revision," Federal Reserve Bulletin, vol. 89 (April).
Return to text
| |
Production Index |
Price Index |
Value of Production (millions of dollars) |
|---|---|---|---|
| Annual Estimates (indexes are 2002=100) | |||
| 1998 | 50.6 | 234.4 | 17,220.1 |
| 1999 | 72.9 | 194.4 | 20,677.1 |
| 2000 | 101.1 | 174.1 | 25,691.3 |
| 2001 | 118.6 | 133.2 | 23,103.2 |
| 2002 | 100.0 | 100.0 | 14,602.6 |
| 2003 | 110.1 | 76.6 | 12,158.9 |
| 2004 | 129.3 | 59.9 | 11,322.5 |
| 2005 | 146.2 | 54.3 | 11,559.9 |
| 2006 | 242.8 | 51.4 | 18,137.0 |
| 2007 | 261.6 | 50.2 | 19,219.8 |
| Quarterly Estimates (indexes are 2002=100) | |||
| 1998Q1 | 42.3 | 261.9 | 16,107.6 |
| Q2 | 50.7 | 244.6 | 18,052.1 |
| Q3 | 54.0 | 219.0 | 17,217.1 |
| Q4 | 56.5 | 213.9 | 17,589.7 |
| 1999Q1 | 67.7 | 205.0 | 20,192.3 |
| Q2 | 73.1 | 195.9 | 20,847.5 |
| Q3 | 72.5 | 195.4 | 20,604.9 |
| Q4 | 79.4 | 182.6 | 21,094.6 |
| 2000Q1 | 92.1 | 182.8 | 24,498.6 |
| Q2 | 102.0 | 172.1 | 25,530.4 |
| Q3 | 103.1 | 175.2 | 26,263.9 |
| Q4 | 108.1 | 167.8 | 26,376.7 |
| 2001Q1 | 122.4 | 147.2 | 26,217.5 |
| Q2 | 117.7 | 137.6 | 23,562.3 |
| Q3 | 118.4 | 126.9 | 21,869.4 |
| Q4 | 115.9 | 122.5 | 20,666.9 |
| 2002Q1 | 105.1 | 111.3 | 17,022.9 |
| Q2 | 95.0 | 107.9 | 14,915.6 |
| Q3 | 103.1 | 92.3 | 13,836.7 |
| Q4 | 96.7 | 89.5 | 12,598.8 |
| 2003Q1 | 92.3 | 89.2 | 11,979.4 |
| Q2 | 108.3 | 81.8 | 12,886.8 |
| Q3 | 122.7 | 72.3 | 12,902.8 |
| Q4 | 116.5 | 63.6 | 10,782.7 |
| 2004Q1 | 152.2 | 61.9 | 13,699.1 |
| Q2 | 130.8 | 60.5 | 11,504.0 |
| Q3 | 121.1 | 59.6 | 10,498.2 |
| Q4 | 115.9 | 57.8 | 9,737.4 |
| 2005Q1 | 123.9 | 55.1 | 9,933.6 |
| Q2 | 135.1 | 54.3 | 10,681.3 |
| Q3 | 147.2 | 54.2 | 11,608.0 |
| Q4 | 178.2 | 53.5 | 13,856.8 |
| 2006Q1 | 190.3 | 53.2 | 14,717.0 |
| Q2 | 223.3 | 51.5 | 16,719.5 |
| Q3 | 263.2 | 50.6 | 19,386.7 |
| Q4 | 292.6 | 50.2 | 21,387.0 |
| 2007Q1 | 298.2 | 50.2 | 21,775.0 |
| Q2 | 295.5 | 50.8 | 21,848.9 |
| Q3 | 265.1 | 50.3 | 19,396.7 |
| Q4 | 195.9 | 49.4 | 14,091.4 |
G.17 Revision Release Tables:
| Chart 1 | Total industrial production, capacity, and utilization | |
| Chart 2 | Manufacturing industrial production, capacity, and utilization | |
| Chart 3 | Industrial production and capacity utilization | |
| Chart 4 | Consumer goods | |
| Chart 5 | Equipment, total | |
| Chart 6 | Nonindustrial supplies | |
| Chart 7 | Industrial materials | |
| Chart 8 | Capacity utilization by stage of process | |
| Ascii | Screen reader | Table 1A: Industrial Production: Total |
| Ascii | Screen reader | Table 1B: Capacity and Utilization: Total |
| Ascii | Screen reader | Table 2: Rates of Change in Industrial Production, Market and Industry Group Summary: 2004-08 |
| Ascii | Screen reader | Table 3: Rates of Change in Industrial Production, Special Aggregates and Selected Detail: 2004-08 |
| Ascii | Screen reader | Table 4: Annual Rates of Change for Industrial Production: 2004-08 |
| Ascii | Screen reader | Table 5: Rates of Change in Capacity, By Industry Groups: 2005-09 |
| Ascii | Screen reader | Table 6: Revised and Earlier Capacity Utilization Rates, By Industry Groups |
| Ascii | Screen reader | Table 7A: Industrial Production: Manufacturing |
| Ascii | Screen reader | Table 7B: Capacity and Utilization: Manufacturing |
| Ascii | Screen reader | Table 8A: Industrial Production: Total Industry Excluding Selected High-Technology Industries |
| Ascii | Screen reader | Table 8B: Capacity and Utilization: Total Industry Excluding Selected High-Technology Industries |
| Ascii | Screen reader | Table 9A: Industrial Production: Manufacturing Excluding Selected High-Technology Industries |
| Ascii | Screen reader | Table 9B: Capacity and Utilization: Manufacturing Excluding Selected High-Technology Industries |
| Ascii | Screen reader | Table 10: Annual Proportions in Industrial Production, Market and Industry Group Summary |
| Ascii | Screen reader | Table 11: Industrial Production and Capacity Utilization Summary |
Release dates | Documentation
Current Monthly Release Other formats: ASCII | PDF (144 KB)
Supplemental Monthly Release Other formats: ASCII | PDF (144 KB)
Annual Revision Release Other formats: ASCII | PDF (150 KB)
Data Download Program (DDP) | Announcements | Historical data (text files)