Economic and Financial Developments in 2006 and Early 2007
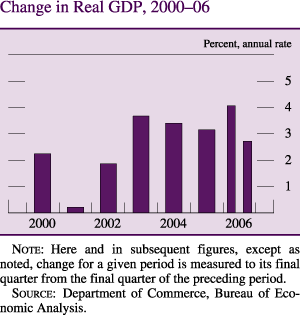
The especially brisk pace of economic activity in early 2006 primarily reflected a rebound after hurricane-related disruptions in the autumn of 2005. During the rest of the year, however, economic activity slowed to a pace somewhat below the average rate of recent years. Real GDP is reported to have increased at an average annual rate of 2-3/4 percent over the final three quarters of 2006, down from the average 3-1/4 percent pace in 2004 and 2005. The slowdown principally was the result of the contraction in residential construction, which intensified later in the year, and the marked decline in production of light motor vehicles in the second half of the year as manufacturers took steps to trim dealers' inventories. In other sectors of the economy, consumer spending remained strong as employment and income made further solid gains, and business outlays for new structures and equipment rose considerably over much of the year. Financial market conditions were generally supportive of economic expansion in 2006. Equity markets recorded sizable gains, and long-term interest rates rose only modestly from historically low levels. Risk spreads on corporate bonds remained narrow or declined further. Overall economic conditions were such that businesses maintained a steady pace of hiring, and the unemployment rate moved down further.
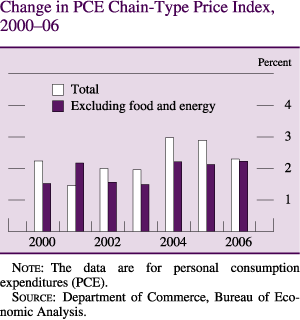
Consumer price inflation, as measured by the rise in the PCE price index, moved down in the second half of 2006 after having stepped up in the first half. Energy prices, which rose during the first half and turned sharply downward later in the year, played an important role in shaping the contour of total consumer price inflation. In addition, core PCE price inflation eased modestly over the second half of 2006. Apparently influenced by incoming data on inflation and economic activity, measures of long-term inflation expectations rose early in the year but ended the year slightly lower than at the beginning. Nonetheless, core PCE price inflation for the year as a whole--at 2-1/4 percent--was a bit higher than in the preceding year, which perhaps reflected in part the high level of resource utilization.
The Household Sector
Consumer Spending
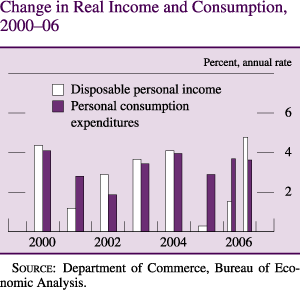
The rapid increase in consumer spending in 2006 was supported by rising employment, gains in real income, increases in household wealth, and favorable financial conditions. Over the four quarters of 2006, real PCE rose 3-3/4 percent--faster than in 2005 and at roughly the same rate as in 2004. The rise in consumer outlays was particularly robust in the first quarter of 2006 but then moderated in the middle of the year, when households' gains in real income slowed and consumer sentiment softened. Consumer spending rose briskly again in the fourth quarter of the year as gains in real income picked up and consumer confidence improved.
Household spending for new motor vehicles slowed in 2006; sales of 16.5 million new light vehicles (cars, sport-utility vehicles, and pickup trucks) were below the average of nearly 17 million sold in the preceding two years. Moreover, households' apparent concerns about elevated gasoline prices, particularly early in the year, shifted the composition of light vehicle sales toward more fuel-efficient autos and away from light trucks and SUVs. The shift helped boost the share of total sales captured by foreign producers because they tend to offer more fuel-efficient vehicles.
Real PCE for goods other than motor vehicles rose 4-3/4 percent over the four quarters of 2006, about in line with the brisk average pace in the preceding two years. Households increased their spending for a broad range of consumer goods, though the rise was particularly strong for electronic equipment and other durables. Real spending on gasoline remained about constant in the first half of the year but increased in the second half as prices fell. Consumer spending for services maintained a moderate pace of growth; expenditures in this category rose 2-3/4 percent in 2006, about the same average pace as in 2004 and 2005.
In 2006, real household income was boosted by gains in wage and salary income and the increased purchasing power resulting from the deceleration in overall consumer prices. Labor income received by households rose both because of gains in real hourly wages and because of sustained increases in employment. However, the pickup in real after-tax income was damped because tax payments made by households increased at a rate greater than that for income. The acceleration in tax payments likely reflected, at least in part, several factors: tax payments on larger capital gains realizations, which are excluded from income in the national income and product accounts (NIPA); gains in real income that moved some households into higher tax brackets; and possibly a further shift in the distribution of income toward high-income households that typically face higher tax rates. All told, real after-tax income rose 3 percent over the four quarters of 2006, up from the negligible gain posted in 2005 but a little below the average rate of increase in 2003 and 2004.
The rise in after-tax income in 2006 was outpaced by increases in household spending. As a result, the personal saving rate declined further in 2006 and averaged negative 1 percent for the year as a whole. Households apparently were inclined to increase their spending further above their disposable income, at least in part, because their wealth continued to rise. The ratio of household net worth to income, which has been trending higher since 2003, inched up further in 2006. Although increases in the value of homes slowed significantly, the value of corporate equities held by households both indirectly--such as in mutual funds and retirement accounts--and directly appreciated considerably.
Consumer sentiment deteriorated in the first half of 2006, according to the Reuters/University of Michigan Surveys of Consumers (Reuters/Michigan). In the spring, consumer confidence had moved to its lowest level for the year, probably in part because energy prices had surged. The subsequent decline in energy prices, along with the rise in the stock market and reductions in the unemployment rate, boosted consumer confidence in the second half of the year. On net, the Reuters/Michigan index of consumer sentiment was a shade higher at the end of 2006 than at the beginning of the year; sentiment moved up further in early 2007 to near the upper end of its range since 2003.
Residential Investment
The deterioration of conditions in the housing market played a significant role in restraining the pace of economic expansion in 2006. The demand for new and existing homes began to weaken in the middle of 2005, and the subsequent decline steepened through the first half of 2006. As a result, the inventory of unsold new homes relative to sales rose sharply. Apparently prompted by lower demand and excessive inventories, homebuilders began to cut back on the pace of new construction near the beginning of 2006, and the decline in activity continued throughout the year. Later in the year, however, some indicators were hinting that the demand for housing was starting to stabilize.
By the middle of 2006, sales of both new and existing homes had fallen dramatically to a pace that was about 15 percent below that of a year earlier. Concurrently, inventories of unsold homes relative to sales rose considerably above the level that had prevailed during the period of robust housing demand from the late 1990s into 2005. By the third quarter of 2006, the backlog of unsold new homes had reached 6-3/4 months' supply, and the stock of existing homes for sale had risen to about 7 months' supply--both well above the average of about 4-1/2 months' supply of new and existing homes in 2005. By the end of 2006, however, there were tentative signs that the demand for homes was stabilizing. The decline in sales of new and existing homes appeared to bottom out in the summer, and sales were roughly constant over the later part of the year. In the fourth quarter, builders' inventories of unsold new homes were reported to have edged down a bit from their third-quarter level, while the stock of existing homes for sale remained about the same as in the third quarter. Despite these developments, the extent of any improvement in the inventories of unsold homes is obscured by the failure of these figures to account for recorded sales of new homes that are subsequently canceled.
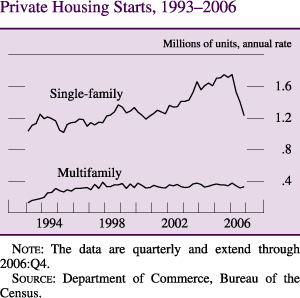
The drag on new residential construction in 2006 imposed by the contraction in home sales and the buildup of inventories was significant. Both the number of permits issued for new single-family homes and the number of home starts dropped sharply. As of the fourth quarter of 2006, new single-family homes were started at an annual rate of 1.23 million units, almost 30 percent below the average pace in 2005; permits were down by a similar amount. In contrast to the marked slackening in construction of new single-family homes, the rate of starts of new multifamily homes in 2006, at 337,000 units, was about the same as in the preceding several years.
Housing activity, as measured by real expenditures on residential structures in the NIPA, trimmed 1/4 percentage point from the rate of real GDP growth in the first half of 2006, but the drag intensified to subtract about 1-1/4 percentage points from the annual rate of increase in real GDP in the second half. For 2006 as a whole, the contraction in real residential investment lowered the annual rate of growth in real GDP 3/4 percentage point after having added 1/2 percentage point, on average, to the rate from 2003 through 2005.
The rate of house-price appreciation slowed substantially in 2006 after several years of very rapid gains. The repeat-transactions index of home prices published by the Office of Federal Housing Enterprise Oversight (OFHEO) increased at an annual rate of only 1-1/2 percent in the third quarter of 2006, down substantially from average gains of about 10 percent in 2004 and 2005. The OFHEO index attempts to control for the quality of existing single-family homes sold by using prices of homes involved in repeat transactions. The increase in the OFHEO house-price index over the four quarters ending in the third quarter of 2006 (a calculation that smoothes through some of the quarterly volatility in the data) was 6 percent, the smallest four-quarter increase since the late 1990s. The average price of existing single-family homes sold, which is published by the National Association of Realtors (NAR) and does not control for the types of homes sold, declined about 2 percent over the four quarters of 2006, compared with average gains of roughly 9 percent in 2004 and 2005. The outright decline in the NAR index of home prices relative to the deceleration in the constant-quality OFHEO home-price index suggests that the composition of existing homes sold shifted toward lower-priced homes.
The cost of mortgage financing increased in the first half of 2006, but rates decreased in the second half. The average rate for a thirty-year fixed-rate mortgage was 6-1/4 percent at the end of 2006, about the same as at the beginning of the year. The average for a one-year adjustable-rate mortgage declined also in the second half and stood at 5-1/2 percent at the end of 2006, about 1/4 percentage point above the level at the start of the year. According to respondents to the Reuters/Michigan survey, relatively low mortgage rates and the perception that purchase prices were more favorable improved their assessment of homebuying conditions in the second half of 2006.
Household Finance
Household sector debt is estimated to have slowed from the robust 11-3/4 percent increase posted in 2005 to a still-vigorous 8-1/4 percent in 2006. The deceleration reflected a drop in the pace of mortgage debt growth from about 14 percent in 2005 to less than 9 percent in 2006. Despite the reduction in mortgage borrowing, home equity lending remained active, and the gross volume of cash-out refinancing exceeded 2005 levels. Meanwhile, consumer debt expanded only moderately in 2006.
Although household indebtedness increased less rapidly in 2006 than in 2005, it still outpaced the growth of disposable personal income. In addition, the rise in interest rates contributed to higher debt service payments, and the household financial obligations ratio continued its upward trend of the past decade to reach a record high. Evidence to date suggests that most households have been able to meet their debt service obligations, although there are indications of growing strains among some borrowers. Delinquency rates on subprime residential mortgages with variable interest rates have increased markedly; still, delinquency rates on other mortgages and consumer loans have remained low. Household bankruptcy filings during 2006 ran at a pace well below the average of the preceding several years. Bankruptcies likely were damped in 2006 by the decisions of some households to file before the implementation of more-stringent bankruptcy requirements in October 2005. However, even allowing for such an effect, the recent pace is low relative to pre-reform norms.
The Business Sector
Fixed Investment
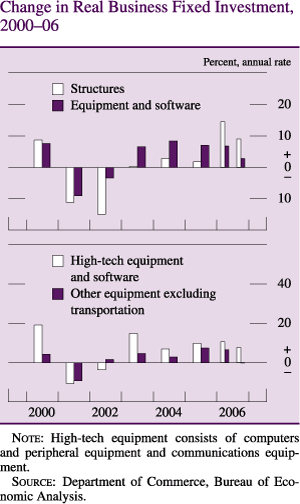
Total real business fixed investment rose 6-3/4 percent over the four quarters of 2006, up from a 5-1/2 percent increase in 2005 and about the same pace as in 2004. In general, the fundamentals supporting business capital spending remained favorable in 2006: The strong rise in profits continued to help firms maintain substantial liquid assets, user costs for equipment declined further, and interest rates and credit spreads remained relatively low. Although the pace of real business outlays for equipment and software slowed somewhat in 2006, investment in nonresidential structures rose 11-3/4 percent. Capital spending was quite robust during most of the year, adding about 1 percentage point to the annual rate of increase in real GDP over the first three quarters, but it decelerated sharply in the fourth quarter. The deceleration reflected, in part, a slowing in spending for business structures from its brisk pace earlier in the year, a drop in outlays for transportation equipment, and some weakness in purchases of equipment related to construction and motor vehicle manufacturing.
Real investment in high-technology equipment rose 9 percent in 2006, about the same average annual pace as in the preceding two years. Further decreases in the prices of high-technology equipment continued to reduce the user cost of this type of equipment. Real business spending for computing equipment increased 14-1/2 percent, and software spending posted an 8 percent gain, both roughly comparable to their average rates of increase in the previous two years. Business outlays for communications equipment rose almost 7 percent in 2006. Spending for communications equipment was particularly robust in the early part of the year and was likely boosted in part by spending to replace equipment damaged by the hurricanes in the autumn of 2005. Investment in communications equipment last year continued to be supported by demand from telecommunications service providers that were expanding their broadband networks.
Real business investment in transportation equipment--typically a volatile category of investment--was about unchanged on net in 2006. For motor vehicles, business spending increased less than 1 percent over the year. Purchases of light vehicles weakened, partly because of cutbacks in sales to rental companies. In contrast, business outlays for medium and heavy trucks accelerated in 2006, reportedly in anticipation of new emissions regulations by the Environmental Protection Agency that went into effect at the beginning of 2007. New orders for medium and heavy trucks reached new highs early in 2006, and production and sales remained strong through the end of the year. Outlays for new aircraft were brisk in early 2006, but they were depressed over the remainder of the year; all told, aircraft investment declined more than 15 percent for the year as a whole.
Real investment in equipment other than high-tech and transportation goods--a broad category that represents about half of total nominal business spending for equipment and software--rose at an average annual rate of 5-1/2 percent during the first three quarters of 2006. However, spending for these capital goods softened in the final quarter of the year. Although the declines in the fourth quarter were generally broad based, they were led by decreases in spending for equipment related to construction and motor vehicle manufacturing. However, the backlog of orders for capital goods such as industrial machinery and other types of heavy equipment remained substantial at the end of 2006, and it should sustain production and shipments of these items in early 2007.
Real outlays for nonresidential construction increased 11-3/4 percent in 2006 after having been little changed since 2003. However, the rise in business construction spending slowed near the end of 2006 from its rapid pace earlier in the year; outlays increased at an annual rate of only about 3 percent in the fourth quarter. For 2006 as a whole, sizable gains were posted for office, retail, and industrial buildings. In addition, outlays for drilling and mining structures associated with energy exploration were strong. At the end of 2006, forward-looking indicators for nonresidential construction activity appeared to be favorable: Vacancy rates for buildings in both the office and industrial sectors, which peaked a few years ago, continued to drift down, and the vacancy rate for retail buildings remained at the low level that has prevailed since 2000.
Inventory Investment
In the first half of 2006, dealer stocks of motor vehicles rose noticeably as sales slowed, particularly for light trucks. The increase in the prices of gasoline earlier in the year appeared to have reduced consumers' demand for light trucks and SUVs, which tend to be less fuel efficient. Dealers' inventories of these vehicles reached an elevated 90 days' supply at the end of the second quarter. As a result, motor vehicle manufacturers scaled back the production of light trucks over the second half of 2006, which helped to reduce dealers' inventories during that period. Nonetheless, at the end of 2006, inventories of light vehicles still appeared to be above desired levels. Manufacturers cut production further in January of this year, helping them make additional progress in reducing the stock overhang.
Excluding motor vehicles, inventories held by businesses in the manufacturing and trade sectors appeared generally to be well aligned with sales in the first half of 2006. However, later in the year, a variety of indicators suggested that some businesses accumulated an unde-sired level of stocks. The book value of manufacturing and trade inventories (excluding motor vehicles) rose relative to sales from September through November. The increases were particularly noticeable for firms that supply the construction and motor vehicle sectors, although increases were apparent in a few other sectors as well. Survey data also suggested that inventories for some businesses were viewed as too high. However, manufacturers outside of the motor vehicles sector appear to be making relatively prompt adjustments to their production, which to date seem to be limiting the extent of undesired stockbuilding.
Corporate Profits and Business Finance
Profits of nonfinancial corporations extended their upward move, pushing the ratio of before-tax profits to income in this sector to nearly 14 percent, the highest level reached since 1969. In the third quarter, operating earnings per share for S&P 500 firms came in 20 percent above levels of a year earlier. About two-thirds of firms in the S&P 500 have reported earnings for the fourth quarter. Current market estimates of earnings per share for S&P 500 firms call for roughly 10 percent growth in the fourth quarter over year-earlier levels. Earnings growth was widespread across sectors in 2006 but was particularly strong for financial firms.
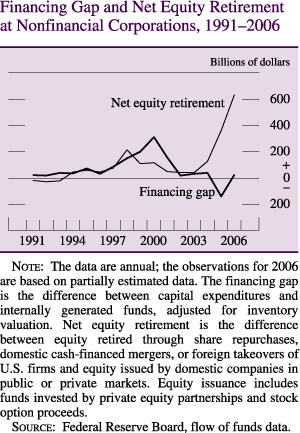
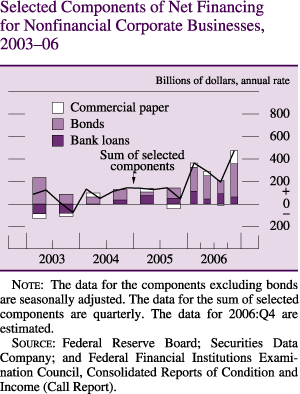
Firms' capital expenditures exceeded internal funds raised in 2006, an indication that businesses funded investments not only with current cash flow but also with external funds and liquid assets. Borrowing by nonfinancial firms picked up in 2006 in association with increased real investment as well as with extensive retirements of equity, which resulted from record share repurchases and heavy merger and acquisition activity. Net bond issuance proceeded at a faster clip than in the past several years. Similarly, commercial paper issuance was the strongest it had been since 2000, and commercial and industrial lending by banks was rapid as well. The Federal Reserve's Senior Loan Officer Opinion Survey on Bank Lending Practices revealed that a significant net fraction of respondents to that survey eased credit standards and terms on commercial and industrial loans during 2006. Bankers indicated that they were responding to more-aggressive competition and greater liquidity in the secondary market for such loans. Loan officers also reported that a contributing factor was an increased tolerance for risk.
The expansion of commercial mortgage debt in 2006 remained rapid by historical standards but fell off from the swift pace of 2005. The deceleration likely reflected the rise in mortgage rates and a net tightening of credit standards for these loans--an explanation consistent with responses to the loan officer survey.
Gross public issuance of equity by nonfinancial corporations in 2006 roughly maintained the moderate pace of the past couple of years, and private equity issuance appears to have risen a bit to finance buyouts and other restructurings. Still, net equity issuance turned more negative as equity retirements from cash-financed mergers and acquisitions and share repurchases increased considerably.
On balance, despite increased borrowing and net equity retirements, the strength of corporate earnings growth has left the credit quality of nonfinancial firms solid. Balance sheet liquidity remains high, and corporate leverage is near historical lows. In addition, net interest payments relative to cash flow remained near the low end of the range seen over the past two decades. The six-month trailing bond default rate fell during the first half of the year as defaults by some large firms in the troubled airline and automobile sectors in late 2005 dropped out of the series, and it was near zero throughout the second half of 2006. Delinquency rates on business loans remained quite low.
The Government Sector
Federal Government
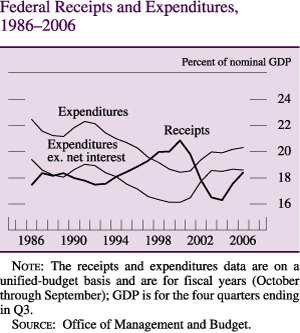
The deficit in the federal unified budget narrowed further during the past year. The unified budget recorded a deficit of $248 billion in fiscal year 2006--$70 billion smaller than in the previous fiscal year. The federal deficit in fiscal 2006 was a bit less than 2 percent of nominal GDP, significantly lower than its recent fiscal year peak of more than 3-1/2 percent of GDP in 2004. In fiscal 2006, outlays rose about in line with nominal GDP, but receipts increased at a faster pace. From October through December--the first quarter of fiscal 2007--the federal deficit was almost $40 billion less than in the same period a year earlier, as the rise in receipts continued to outpace the growth in outlays. The latest projections from the Congressional Budget Office and the Administration anticipate that the unified deficit in fiscal 2007 will be smaller as a percentage of nominal GDP than it was in fiscal 2006. Although the unified deficit has improved recently, the federal budget will face the mounting pressures of providing Social Security and health benefits to a rapidly growing number of beneficiaries as the baby-boom generation ages in coming years.
In fiscal 2006, nominal federal receipts rose 11-3/4 percent and were equivalent to almost 18-1/2 percent of nominal GDP, substantially higher than their recent fiscal year low of 16-1/4 percent of GDP in 2004. Income tax receipts from individuals outpaced the rise in taxable personal income (as measured in the NIPA), while surging corporate tax payments about matched the robust growth in profits. As noted above, the increase in individual income tax liabilities relative to taxable income in the NIPA appears to have reflected, at least in part, taxes on larger capital gains realizations (which are excluded from NIPA income), the effect of some taxpayers moving into higher tax brackets as their real incomes increased, and possibly a further shift in the distribution of income toward high-income households that typically face higher tax rates. In the first quarter of fiscal 2007, revenues were more than 8 percent greater than in the same period a year earlier, as both individual and corporate tax payments continued to rise briskly.
Nominal federal outlays increased about 7-1/2 percent in fiscal 2006 and were about 20-1/4 percent of nominal GDP, well above their most recent fiscal year low of less than 18-1/2 percent of GDP in 2000. Net interest payments increased 23 percent in fiscal 2006, as interest rates rose and federal debt continued to grow. Outlays for Medicare increased 10-1/2 percent, reflecting in part new benefits payments associated with the Part D prescription drug program, which started in January 2006. At the same time, outlays for Medicaid declined a bit, to some extent because of a shift of some Medicaid payments to Medicare Part D. Spending for disaster relief and national flood insurance was almost $28 billion greater in fiscal 2006 than in the previous fiscal year, primarily owing to the federal government's response to the hurricanes in the autumn of 2005. Outlays for defense in fiscal 2006 slowed to their lowest rate of increase since fiscal 2001, although the rise was still about 6 percent. In the first quarter of fiscal 2007, total federal outlays were only 1 percent greater than those in the same period a year earlier; in this period, defense spending was 12 percent above its year-earlier level, but outlays related to disaster relief and flood insurance were markedly lower than they were a year earlier.
As measured in the NIPA, real federal expenditures on consumption and gross investment--the part of federal spending that is a direct component of real GDP--increased 2-1/2 percent over the four quarters of calendar year 2006 and contributed about 1/4 percentage point to the growth rate of real GDP in that year. The increase was the result of a pickup in real defense purchases, which rose more than 4 percent during calendar 2006 after two years of smaller increases. At the same time, real nondefense purchases declined more than 1 percent after having risen, on average, about 2 percent per year over the preceding two years.
The reduction in the unified deficit in the past two years implies that the federal government required less national saving to finance its operations. However, nonfederal saving, which excludes borrowing by the federal government from total net national saving, remained relatively low. Although the saving rate for private business and state and local governments has increased in recent years, the improvement has been offset by declines in the personal saving rate. Total national saving, net of depreciation, was 2 percent of nominal GDP in the third quarter of 2006. The recent national saving rate is an improvement from the lows of a few years ago, but it has been insufficient to avoid an increasing reliance on borrowing from abroad to finance the nation's capital spending.
Federal Borrowing
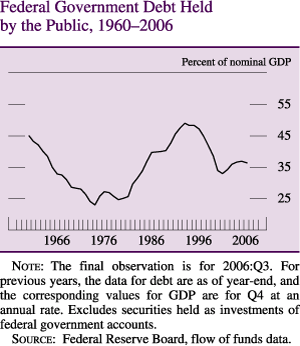
The Treasury responded to the reduction in the federal deficit in 2006 by paying down Treasury bills over the course of the year and by trimming the gross issuance of marketable Treasury coupon securities. As of the third quarter of 2006, the quantity of federal debt held by the public as a percentage of nominal GDP had declined about 1/2 percentage point, to about 36 percent.
Early in the first quarter of 2006, federal debt subject to the statutory limit reached the then-current ceiling of $8.2 trillion. The Treasury employed various methods to avoid breaching the limit until the Congress increased it to nearly $9 trillion in March. As of the end of December, the total amount of federal debt subject to the limit was $8.6 trillion.
In February, the Treasury auctioned thirty-year bonds for the first time since 2001. The offering was apparently well received, as was the reopening of the issue in August. The Treasury announced in August that it would issue thirty-year bonds on a quarterly basis beginning in 2007.
The acquisition of Treasury debt by foreigners slowed further in 2006 from its peak in 2004. However, outstanding Treasury debt also grew more slowly, leaving the share of outstanding debt held by foreign investors little changed, on balance, from its average level over the preceding two years. According to Treasury data on international capital flows, foreigners (official and other) purchased considerably fewer U.S. Treasury coupon securities in 2006 than in 2005. The average proportion of nominal coupon securities purchased by foreign and international investors at auctions in 2006 about matched the average from the previous year at 16 percent, but it was down noticeably from an average level of 25 percent in 2004.
State and Local Government
The fiscal positions of state and local governments improved further in 2006. Apart from federal grants-in-aid, revenues rose at an annual rate of 7 percent over the first three quarters of 2006 after posting relatively strong gains in the preceding two years. Receipts from taxes on retail sales and on individual and corporate incomes continued to rise at a brisk pace; however, decreasing gains in house prices slowed the rise in property tax revenues in the third quarter of 2006 from the rapid pace in the previous two years. The sustained strength in total revenues, along with the efforts of states and localities to restrain spending for health care, has enabled these jurisdictions to step up spending on other programs and still rebuild their reserve funds. As measured in the NIPA, net saving by state and local governments excluding social insurance funds--a measure that is broadly similar to the surplus in an operating budget--was almost $4 billion during the first three quarters of 2006. States and localities generally have seen improvement in their fiscal positions recently, but in coming years most governments will have to face the budget pressures of providing pension and health benefits to an expanding number of retired employees, and the states' costs for Medicaid are expected to rise substantially as the baby-boom generation ages.
Real expenditures by state and local governments on consumption and gross investment, the component of these governments' spending that enters directly into the calculation of real GDP, rose 3 percent over the four quarters of 2006. That increase was the largest since 2001 and contributed about 1/4 percentage point to the change in real GDP during the year. Real expenditures for investment rose 4-3/4 percent, largely because of a strong increase in real construction spending in the first half of the year. Spending for current consumption in real terms increased 2-1/2 percent over the four quarters of 2006. Hiring by state and local governments stepped up last year. Of the cumulative increase in employment of 254,000 in 2006, about two-thirds of the jobs were in education.
State and Local Government Borrowing
Borrowing by state and local governments dropped below its rapid 2005 pace amid improved fiscal positions and fewer advance refunding issues. Nonetheless, bond issuance for new capital expenditures, particularly for education and transportation, boosted long-term borrowing. Credit quality in the state and local sector rose substantially in 2006, as the number of credit-rating upgrades far exceeded the small number of downgrades.
The External Sector
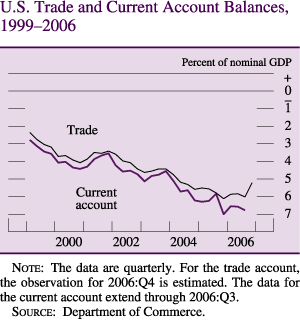
The U.S. current account deficit averaged $875 billion at an annual rate, or about 6-1/2 percent of nominal GDP, in the first three quarters of 2006 (the latest available data). The deficit was wider than in 2005, partly because of a larger deficit on trade of goods and services. In addition, net investment income, which turned negative in the fourth quarter of 2005, remained negative in the first three quarters of last year, further expanding the current account deficit.
International Trade
After widening through most of 2005, the nominal trade deficit leveled out in the first half of 2006, rose to a record high in August, and then narrowed noticeably through November (the latest available data). On average, the nominal trade deficit was wider in 2006 than in the previous year. Nominal imports of goods grew more slowly than exports did early last year and, after reaching late-summer peaks, dropped because of declines in both the price and volume of imported oil. Meanwhile, imports of services decelerated sharply in the second half of last year. In contrast, nominal exports of goods and services pushed upward steadily throughout the year and grew significantly faster than did nominal imports. Given that the level of exports was smaller than the level of imports, the faster export growth during 2006 was not enough to narrow the nominal trade deficit. Although the nominal trade deficit last year (through November, annualized) was wider in dollar terms, the trade deficit as a share of GDP, at just under 6 percent, was about the same as in 2005.
Real exports of goods and services grew a robust 9-1/4 percent last year. In the first quarter, growth was boosted by a catch-up of exports affected by hurricane damage in late 2005. Throughout the year, exports were supported by strong foreign economic activity. Real exports of goods rose 10-1/4 percent last year, a little faster than in the previous year. Export growth was spread fairly evenly across all major end-use categories, though exports of computers and semiconductors expanded noticeably more slowly than in 2005. By destination, exports to China and other emerging Asian economies grew very rapidly, as did those to South America. Exports to Mexico and western Europe rose at a more modest pace. Real exports of services were up a solid 6-3/4 percent for the year, double the pace of 2005.
Prices of exported goods rose at a 3-1/2 percent rate last year, a little faster than their pace in 2005. Reflecting the effects of very large jumps in prices of industrial supplies, particularly fuels and metals, export prices moved up sharply in the second and third quarters; they decelerated toward the end of the year as prices of exported fuels retreated from their high levels and as prices of exported metals moved up more slowly.
Real imports of goods and services rose 3 percent last year, more slowly than in the previous year. As with the growth in real exports, real import growth got off to a quick start last year amid robust domestic growth. But import growth slowed, on average, in the middle quarters of the year, along with U.S. real GDP growth, and real imports fell in the fourth quarter as a result of a sharp drop in oil and natural gas imports. Despite some fourth-quarter declines, for the year imports increased in every major end-use category except petroleum and natural gas. Imports of services rose more than 5 percent last year, a step-up from the previous year's sluggish pace.
Prices of imported non-oil goods increased less than 1 percent, on balance, in 2006 despite some wide gyrations. After falling in the first quarter, prices reversed course, surged upward, and then cooled in the fourth quarter. The quarterly pattern was driven by movements in nonfuel commodity prices, which soared in the second and third quarters before leveling off in the fourth quarter.
Metals figured prominently among the nonfuel commodities that boosted trade prices last year. Prices for a variety of metals--including copper, aluminum, nickel, and zinc--skyrocketed in the second quarter. Factors contributing to the surge in prices included growing demand, particularly from developing countries, low levels of inventories for some metals, and perhaps increased speculative demand. Prices for nickel and zinc continued to move up throughout the year. In the second half of the year, aluminum prices trended sideways, and copper prices moved down from their peaks as inventory and supply conditions improved somewhat. For most of these metals, those price trends have continued this year. An exception is zinc, the price of which has plummeted.
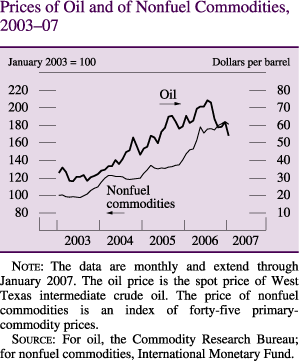
The spot price of West Texas intermediate crude oil averaged $66 per barrel in 2006, nearly $10 per barrel higher than in 2005; moreover, crude oil prices were especially volatile last year. The spot price climbed from around $61 per barrel at the end of 2005 to a peak of $77 per barrel in August as violence in the Middle East, a shutdown of the Prudhoe Bay oil field in Alaska, and forecasts of an active hurricane season led to increased demand. In the event, oil supply was affected far less than anticipated by these factors, and oil prices declined over the next few months as demand dropped and elevated petroleum inventories were drawn down. Oil demand for heating was depressed by above-average temperatures in the Northern Hemisphere in the fourth quarter and in the early weeks of 2007, and the spot price fell further, to around $50 per barrel in mid-January, before moving back up to $58 per barrel at the end of the month. Far-dated futures prices began last year at about $60 per barrel, moved in a pattern similar to spot prices throughout most of the year, and averaged just over $61 per barrel in January 2007.
Notwithstanding the decrease of global oil prices since August, several factors continue to support these prices at historically elevated levels. Ongoing violence has diminished oil production in Iraq and Nigeria. The continuing dispute with Iran over its nuclear program threatens a possible curtailment of Iranian exports. Energy investment by international oil companies has been hampered in some countries, such as Russia and Venezuela, by increased government control of domestic energy industries. Moreover, in response to the recent decline in oil prices, OPEC has reduced its crude oil production to the lowest level since 2004. Oil demand over the past year has also increased modestly in developing countries despite high prices.
The Financial Account
Foreign official inflows in the first three quarters of 2006 were above their 2005 pace but remained below the record levels of 2004. Most of these official inflows were attributable to Asian central banks and took the form of purchases of U.S. government securities, primarily bonds and mortgage-backed securities issued by government-sponsored enterprises (GSEs). Preliminary data indicate a slight easing of official purchases in the fourth quarter of 2006. Net private inflows slowed in the first quarter but have changed little since then.
Foreign private purchases of U.S. securities in the second and third quarters of 2006 slowed slightly from the extraordinary pace set in the second half of 2005 and early 2006, but preliminary fourth-quarter data show recent demand to have been strong. More than half of private flows last year took the form of purchases of corporate bonds, and most of the remainder went toward investment in GSE bonds and corporate equities. On net, private foreigners purchased few U.S. Treasuries. Foreign direct investment flows into the United States remained robust.
Net purchases of foreign securities by U.S. residents, a financial outflow, set a record pace in the first three quarters of 2006. Preliminary data show a further surge in net purchases in the fourth quarter. Demand for foreign bonds by U.S. residents slightly exceeded that for foreign equities. After the expiration of the partial tax holiday implemented in the Homeland Investment Act of 2004, U.S. direct investment abroad dropped back to more normal levels.
The Labor Market
Employment and Unemployment
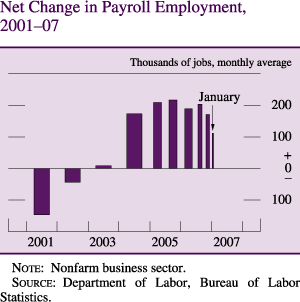
Labor markets remained strong in 2006. Nonfarm payroll employment increased 186,000 per month, on average, during the second half of 2006, a rate essentially the same as in the first half of the year. Employment rose 111,000 in January of 2007. The unemployment rate in the fourth quarter of last year--4-1/2 percent--was at its lowest quarterly level since 2001, and it was little changed in January 2007.
In response to the contraction in homebuilding, hiring in the construction sector slowed considerably in the second and third quarters of 2006, and this sector shed workers in the fourth quarter. Although hiring for nonresidential building construction remained brisk for most of the year, the steep decline in housing starts curtailed the overall demand for construction workers. Employment in the manufacturing sector, which rose in the first half of 2006, declined in the second half as factory output slowed. From July to December, many of the factory layoffs were at makers of motor vehicles and parts and at producers closely tied to the construction industry. Outside of the construction and manufacturing sectors, employment generally increased at a solid pace in the second half of 2006, and hiring was particularly rapid in a number of service industries--especially those providing education and health services, professional and technical business services, and financial services.
As a result of the continued expansion of labor demand in 2006, the unemployment rate fell further. After remaining around 4-3/4 percent in the first three quarters of 2006, the unemployment rate edged down to 4-1/2 percent in the fourth quarter. The tighter labor market was associated with a noticeable increase in employment among individuals who had not been participating in the labor force. In line with this cyclical tightening of the labor market, the labor force participation rate ticked up during 2006, from 66 percent in the first quarter to 66-1/4 percent in the fourth quarter, after a 1/4 percentage point rise during 2005. The recent rise in the participation rate follows a period of decline beginning in the late 1990s that in part reflected some longer-term secular trends in labor force behavior. Those trends included a leveling off in the participation rate of women and an increase in the proportion of the workforce in older age groups, which have lower average participation rates.
Other indicators also suggest that labor market conditions remained generally favorable during the second half of 2006. Layoffs remained low as new claims for unemployment insurance fluctuated around a relatively subdued level of 315,000 per week. In addition, data reported by the Bureau of Labor Statistics showed a further increase during the later part of the year in the rate of job openings as a percentage of private-sector employment.
Productivity and Labor Compensation
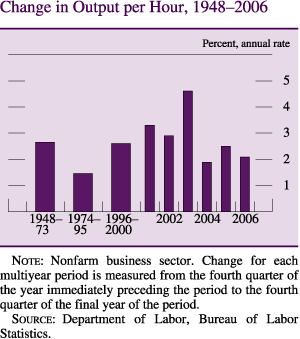
The growth rate of labor productivity in the nonfarm business sector, which had slowed in 2004 and 2005 from an exceptionally rapid pace earlier in the decade, remained relatively subdued in 2006. Over the four quarters of 2006, output per hour of work in the nonfarm business sector increased 2 percent, compared with about a 3 percent average annual rate of increase during the first half of this decade and the second half of the 1990s. During that earlier period, productivity gains were spurred by the rapid pace of technological change, the growing ability of firms to use information and other technology to improve the efficiency of their operations, and increases in the amount of capital per worker. Despite the recent slowing in productivity growth, these underlying factors do not appear to have waned. Accordingly, the recent slowdown in labor productivity may be at least in part a temporary cyclical response to the moderation in the pace of economic activity in 2006 rather than a meaningful downshift in the longer-run trend.
As the labor market tightened in 2006, the rise in hourly labor compensation, which includes both wages and employer payments for employee benefits, stepped up for workers in the nonfarm business sector. In nominal terms, compensation per hour increased almost 5 percent over the four quarters of 2006, compared with an average 4 percent rise in the preceding two years. After adjusting compensation for increases in the PCE price index, real compensation per hour rose 3 percent in 2006, up from an average gain of about 1 percent in 2004 and 2005.
An alternative measure of employee compensation is the employment cost index (ECI) for private nonfarm businesses, which is based on a survey of firms conducted by the Bureau of Labor Statistics. According to this measure, nominal hourly compensation increased 3-1/4 percent in 2006, 1/4 percentage point faster than in 2005. In real terms, the ECI for hourly compensation rose 1-1/4 percent last year after averaging a 1/2 percent increase over the preceding two years. The nominal wages and salaries component of the ECI rose 3-1/4 percent in 2006, while the benefits component advanced 3 percent.
From the perspective of employers, the acceleration in hourly compensation in the nonfarm business sector last year boosted the average labor costs associated with producing a unit of output 2-3/4 percent, up from increases of about 1-3/4 percent in both 2004 and 2005. Although the rise in unit labor costs increased, firms' profit margins appeared to remain elevated in 2006 relative to longer-run standards.
Prices
| Percent | |||
| Price measure | 2004 | 2005 | 2006 |
|---|---|---|---|
| Chain-type | |||
| Gross domestic product (GDP) | 3.2 | 3.1 | 2.5 |
| Gross domestic purchases | 3.7 | 3.6 | 2.2 |
| Personal consumption expenditures (PCE) | 3.0 | 3.1 | 1.9 |
| Excluding food and energy | 2.2 | 2.1 | 2.3 |
| Market-based PCE excluding food and energy | 1.7 | 1.8 | 2.0 |
| Fixed-weight | |||
| Consumer price index | 3.3 | 3.7 | 1.9 |
| Excluding food and energy | 2.1 | 2.1 | 2.6 |
Note:
Changes are based on quarterly averages of seasonally adjusted data.
Source:
For chain-type measures, Department of Commerce, Bureau of Economic Analysis; for fixed-weight measures, Department of Labor, Bureau of Labor Statistics.
Headline inflation slowed in 2006. The PCE chain-type price index rose 2 percent over the four quarters of 2006, a step-down from the 3 percent increase recorded in 2005. The drop in energy prices in the latter part of 2006 accounted for the deceleration in the headline number. Core inflation moved higher in the first part of 2006 but then eased toward the end of the year. On balance, core PCE prices rose about 2-1/4 percent over the four quarters of 2006, a little faster than the 2 percent increase in 2005. The market-based component of the core PCE price index--which excludes imputed prices that are not observed in market transactions and that often change irregularly--increased 2 percent in 2006, about 1/4 percentage point more than in the previous year.
Energy prices recorded dramatic swings during 2006. PCE energy prices increased at an annual rate of about 15 percent in the first half of the year and declined at an annual rate of almost 17 percent in the second half. The sharp movements in consumer energy prices in 2006 were associated primarily with fluctuations in prices for crude oil. The changes in energy prices also were amplified by a widening in the margin of the retail price of gasoline over the associated cost of crude oil in the first half of the year and by some narrowing of that margin in the second half. On balance, the PCE energy price index decreased 4 percent over the four quarters of 2006.
Food price inflation remained fairly moderate in 2006. The PCE index for food and beverages increased 2-1/4 percent, roughly the same pace as in the preceding year. Retail prices of meat and poultry rose modestly for 2006, as robust demand was met by ample supplies of meat. Prices of wheat rose over the course of the year, and prices of corn and soybeans spiked at the end of the year in the wake of downward revisions to estimates of crop production. Prices of corn also were boosted during the year by increased demand for corn to produce ethanol. But the small share of wheat, corn, and soybeans in the total value of food production limited their effect on retail food prices. Prices for food consumed away from home, which are influenced importantly by the costs of labor, energy, and other business inputs, increased 3-1/4 percent in 2006, a more rapid pace than that for prices of food consumed at home.
The core PCE price index accelerated to an annual rate of about 2-1/2 percent in the first half of 2006 on the strength of pickups in the price indexes for both goods and services. In the spring, increases in housing rents were particularly sharp. The rise may have reflected in part a shift in demand toward rental housing as rising mortgage rates and lofty home prices made home purchases less affordable. The pass-through of higher energy costs to a broad range of goods and services also probably contributed to the acceleration in core consumer price inflation in the first half of 2006.
In the second half of 2006, core PCE price inflation edged down to an annual rate of just below 2-1/4 percent. The deceleration was the result of a decrease in core goods prices, which likely reflected in some measure the waning influence of energy prices. In contrast, core services inflation in the second half of the year remained at about the same pace as in the first half. Although housing rents rose more slowly in the second half of the year, their effect on the PCE for core services was mostly offset by faster price increases for medical care and a number of other services.
The swings in energy costs in 2006 were apparent in the prices of inputs used in the production and sale of final goods and services, especially of items for which energy costs represent a relatively large share of total production costs, including industrial chemicals, plastics, fertilizer, and stone and clay products. In addition, the prices of some commodities, such as a variety of metals, rose significantly in 2006 in response to strong worldwide demand. As a result, the core producer price index for intermediate goods, which excludes food and energy, rose 5-1/4 percent in 2006, up from the 4-3/4 percent increase in 2005. The index increased at an annual rate of 7-1/4 percent in the first half of 2006, but it decelerated to an annual rate of about 3-1/4 percent in the second half as energy costs declined.
For the year as a whole, measures of long-term inflation expectations remained well anchored, although short-term expectations were heavily influenced by fluctuations in energy prices. The Reuters/Michigan survey measure of the median expectation of households for inflation over the next twelve months was about 3 percent in December, down from its peak of 3-3/4 percent in August. Longer-term inflation expectations recorded in the Reuters/Michigan survey showed less variability. The median survey respondent in December expected the rate of inflation during the next five to ten years to be 3 percent, down from its peak of 3-1/4 percent in August. Other indicators likewise suggest that longer-run inflation expectations have remained contained. According to the Survey of Professional Forecasters, conducted by the Federal Reserve Bank of Philadelphia, expectations of inflation over the next ten years remained at 2-1/2 percent in 2006, a level that has been essentially unchanged since 1998. In addition, inflation compensation implied by the spread of yields on nominal Treasury securities over their inflation-protected counterparts stayed within the relatively narrow range of 2 percent to 2-3/4 percent during the year.
U.S. Financial Markets
Financial conditions in the United States supported economic growth in 2006. Yields on long-term Treasury securities climbed a bit, on balance, but stayed low by historical standards, while strong corporate profits helped fuel substantial gains in equity markets. Liquid corporate balance sheets and low corporate leverage helped keep risk spreads on corporate bonds narrow. Meanwhile, business borrowing picked up to a rapid pace, spurred in part by a rise in merger and acquisition activity. In the residential real estate sector, mortgage borrowing slowed markedly, as house prices decelerated, especially in the second half of the year. Consumer credit expanded at a moderate pace. Nonetheless, household debt growth outpaced the growth of disposable personal income, and the financial obligations of households inched higher. Although households generally appeared able to meet their obligations, signs of financial strain were apparent in subprime variable-rate mortgages. The M2 monetary aggregate expanded at a moderate pace in 2006.
Interest Rates
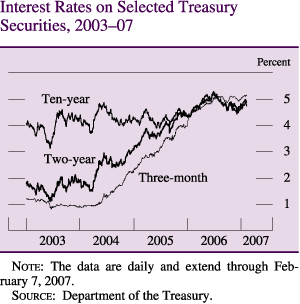
Market interest rates rose modestly, on balance, in 2006--yields on two- and ten-year nominal Treasury securities increased about 40 and 30 basis points respectively. Changes in interest rates seemed largely tied to changes in the outlook for economic growth and inflation. Rates across the maturity spectrum increased notably over the first half of the year, as incoming data on activity and inflation came in higher than markets had expected and as the FOMC raised the target federal funds rate 25 basis points at each of its first four meetings. At the time of the June FOMC meeting, interest rate futures market quotes indicated that market participants perceived considerable odds of an additional rate tightening by year-end. However, market interest rates declined, on net, over subsequent months in response to incoming data suggesting that inflation pressures were moderating and that economic growth was slowing. Market expectations for the trajectory of the federal funds rate over the next several years shifted down considerably during the second half of the year. More recently, market participants have backed away from expectations of a substantial easing of monetary policy as incoming data on economic activity have been stronger than expected. Investors now expect the FOMC to ease policy only slightly over the next two years. Although investors modestly revised their medium-term policy expectations over the course of the year, the Committee's interest rate decisions were largely anticipated in financial markets by the time of each meeting. Throughout the year, forward-looking measures of uncertainty about monetary policy inferred from interest rate options remained near the low end of historical ranges.
Yields on inflation-indexed Treasury securities increased about as much as those on their nominal counterparts in 2006. Medium- and long-term inflation compensation--measured from spreads between yields on nominal and inflation-indexed securities--were about unchanged to a little lower, on net, and during the year these measures exhibited only modest swings in response to incoming inflation data and oil price movements.
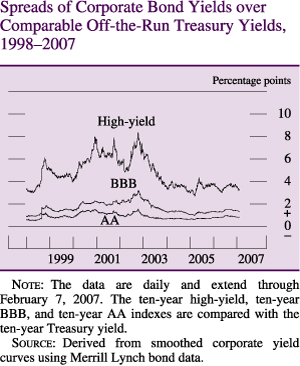
In the corporate bond market, yields on investment-grade securities moved about in line with those on comparable-maturity Treasury securities. In contrast, yields on speculative-grade securities fell slightly, pulling risk spreads lower in that segment of the market. The narrowness of investment- and speculative-grade spreads seems to reflect investors' sanguine perceptions of corporate credit quality over the medium term, which likely reflect in large part the strength of business balance sheets and a benign economic outlook. The term structure of forward risk spreads for corporate bonds supports this view, as forward spreads one and two years ahead are low, while the spreads further out the curve are more in line with historical norms.
Equity Markets
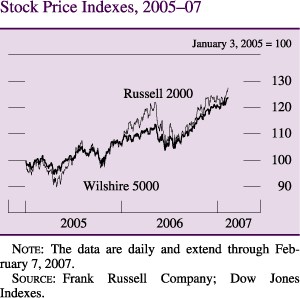
Broad equity indexes soared 10 percent to 20 percent in 2006, boosted by strong growth in corporate earnings. Share prices rose across a wide range of sectors, but increases in telecommunications and security brokerage stocks were especially noteworthy. The difference between the twelve-month forward earnings-price ratio for the S&P 500 and the long-term real Treasury yield--a crude measure of the premium that investors require for holding equity shares--was little changed on balance. The implied volatility of the S&P 500 calculated from options prices spiked temporarily in the late spring in connection with a period of strain in several markets but remained near historical lows for the remainder of the year. Net inflows into domestic equity mutual funds were quite modest in 2006, while inflows into international equity funds were exceptionally strong.
Market Functioning and Financial Stability
Overall, financial markets functioned smoothly over the year and proved resilient to several shocks. Equity markets in the United States and currency and fixed-income markets in several emerging-market economies experienced heightened volatility late in the second quarter, but the turbulence was short lived. The liquidation of a few sizable hedge funds attracted considerable attention for a time but had little discernible effect on the broad functioning of markets. Even the liquidation of Amaranth--a hedge fund that was wound down in the fall after reporting a loss in excess of $6 billion, mostly in energy trades--left little imprint on financial markets, although it raised some concerns about risk-management practices. Implied volatilities, risk spreads, and various other potential measures of financial stress generally stayed at very low levels throughout the year, suggesting that investors were comfortable taking on risk, likely in part because they were confident about the economic and financial outlook.
Throughout the year, bid-ask spreads on the most actively traded Treasury securities remained within narrow ranges. Some instances of questionable trading activities occurred in the secondary market for Treasury securities over the course of the year. The Interagency Working Group for Treasury Market Surveillance monitored these situations closely. 1 In November, the Federal Reserve Bank of New York arranged a meeting with all primary dealers to discuss developments in Treasury markets and to encourage the firms to review their internal oversight of trading operations. Subsequently, a private-sector group sponsored by the Federal Reserve Bank of New York released a draft report laying out a set of best practices for firms active in the Treasury market on topics such as appropriate trading strategies and internal controls.
In July, the Federal Reserve Board implemented a revision to the treatment of GSEs and certain international organizations under its Policy on Payments System Risk. Under the change, interest and redemption payments on securities issued by these institutions are now released only when the issuer's Federal Reserve account contains sufficient funds to cover the payments; that is, these institutions no longer may employ daylight credit to fund such payments. The Board of Governors determined that the change represents an appropriate risk-management policy for the central bank and is consistent with the general practices of private issuing and paying agents. In addition, GSEs and international organizations are now subject to a penalty fee for daylight overdrafts resulting from general corporate payment activity (activity other than interest and redemption payments). This change aligns the policy for GSEs and international organizations with that for other Federal Reserve account holders that do not have regular access to the Federal Reserve's discount window and thus are not eligible for intraday credit. The transition to the new policy occurred smoothly with minimal effects on the functioning of the payments system and no notable adverse effects on short-term funding markets.
Following up on a meeting with the Federal Reserve Bank of New York in the fall of 2005, the largest participants in the fast-growing market for credit derivatives agreed to a series of steps to strengthen that market's infrastructure. Over the course of 2006, credit derivatives dealers phased out the practice of transferring positions to a different counterparty without first obtaining the consent of the original counterparty. They also reduced by 85 percent the number of trade confirmations outstanding more than thirty days; they doubled the share of trades that are confirmed via an electronic platform, to 80 percent of total trade volume; and they agreed upon a new protocol for the settlement of such derivatives after a credit event.
Debt and Financial Intermediation by Banks
Total debt of the domestic nonfinancial sectors expanded an estimated 7-3/4 percent in 2006, well below the pace in 2005 but still faster than that of nominal income. Debt growth slowed markedly in the household and government sectors, but business debt accelerated.
About 30 percent of the growth in nonfinancial sector debt in 2006 was intermediated by the banking sector. This share is about even with the average over the past ten years and is about 5 percentage points above the average observed in the 1980s and early 1990s. Commercial bank credit expanded 9-1/2 percent in 2006, supported by brisk growth in loans to businesses. Bank credit also was boosted in the autumn by a consolidation of a substantial volume of thrift assets onto a commercial bank's balance sheet that had resulted from an internal reorganization at a large bank holding company.
Bank lending to businesses through commercial and industrial loans increased at a rapid pace last year. The growth was fueled by vigorous merger and acquisition activity, rising outlays for investment goods, ongoing inventory accumulation, and an accommodative lending environment. Bank loans secured by commercial real estate, though strong, decelerated over the course of the year. The moderation in commercial real estate lending was consistent with responses by large and medium-sized banks to the Senior Loan Officer Opinion Survey on Bank Lending Practices, which pointed to slowing demand and a net tightening of credit standards for such loans in the second half of the year. Consumer loans and residential mortgages held by banks grew at a moderate rate for the year as a whole. However, excluding the effects of the thrift consolidation, residential real estate lending slowed considerably in the fourth quarter, no doubt reflecting in part the downturn in the housing market.
Commercial bank profits as a percentage of average assets were strong in 2006 and rose slightly above 2005 levels. Net interest margins declined a bit further, likely in response to continued competitive pressures and a modest inversion of the yield curve, but bank profitability was supported by growth in non-interest income and by well-contained costs. Continued strong asset quality also helped to support profitability in 2006 by allowing banks to reduce their loan-loss provisioning. Robust asset quality was reflected in loan delinquency and charge-off rates that remained at low levels through the end of 2006.
The M2 Monetary Aggregate and Reserves
M2 expanded at a 5 percent rate last year, somewhat faster than in 2005. Typically, as short-term interest rates rise, deposit rates lag somewhat, increasing the opportunity cost of holding money. In 2006, this effect apparently slowed money growth less than would have been expected on the basis of historical norms, and the velocity of M2 rose only about 3/4 percent. Retail money market mutual funds and small time deposits, components of M2 whose yields move most closely with market rates, grew rapidly. However, liquid deposits, which constitute the largest component of M2, and whose yields adjust more gradually, were about flat on net. Currency expanded a modest 3-1/2 percent, an increase similar to that in 2005, reflecting weak, possibly negative, net demand from overseas.
Part of the Financial Services Regulatory Relief Act of 2006 gave the Federal Reserve authority, beginning in October 2011, to pay interest on reserve balances and to further reduce or eliminate reserve requirements. At the October FOMC meeting, the Chairman asked the staff to prepare for the implementation of this legislation.
International Developments
Foreign economic growth was generally strong in 2006, as expansion continued in all major regions of the world. The Japanese economy decelerated somewhat but maintained positive growth, and the pace of activity in the euro area picked up. Labor market conditions in both areas improved. Emerging-market economies also recorded solid growth last year and experienced no apparent lasting ill effects from the brief period of financial market volatility that hit some of them particularly hard in the late spring. Although there are signs that steps taken to slow growth of investment in China have been effective, the Chinese economy continued to grow rapidly. Rising energy prices boosted consumer price inflation in many areas of the world early last year, but monetary tightening appears to have prevented inflation from moving significantly higher, and the effects of higher energy prices on core prices were modest.
Industrial countries tightened monetary policy in 2006. Some countries paused around the same time as the Federal Reserve, and others continued to tighten throughout the year. After ending its policy of quantitative easing in the spring, the Bank of Japan (BOJ) raised its policy rate 25 basis points in July. Weak consumer spending and low inflation have apparently deterred the BOJ from tightening since then. With growth in the European economies firming, concerns over inflationary pressures prompted the European Central Bank to raise its policy rate five times last year, to 3.5 percent. The Bank of Canada tightened 75 basis points in several steps over the first half of the year but has left the overnight rate unchanged since then. After keeping its policy rate constant in the first half of the year, the Bank of England tightened policy 25 basis points in August and November 2006 and in January 2007. The statements accompanying each tightening cited the upside risks to inflation posed by low levels of spare capacity.
During the first half of 2006, ten-year sovereign yields in the euro area, Canada, and Japan rose sharply on balance: Increases ranged from 45 basis points in Japan to 75 basis points in Germany. Yields on inflation-protected long-term securities in these economies also rose during the first half of 2006 but not as much as nominal yields and thus implied a noteworthy rise in inflation compensation. These developments occurred largely in reaction to continuing upward pressures on inflation, which stemmed from a further run-up in energy prices and indications that global economic growth remained robust.
From their midyear highs, nominal government benchmark bond yields fell noticeably until about the beginning of December in most major advanced economies, as investors reacted to moves in U.S. rates and evaluated the implications for the global economy of the economic slowdown that seemed to be under way in the United States. Over this period, yields on ten-year nominal bonds declined by amounts that ranged from about 25 basis points in the United Kingdom to about 70 basis points in Canada. Yields on inflation-indexed securities declined less; modest declines in inflation breakeven rates were attributed in part to lower energy prices in the second half of the year.
Since the beginning of December, however, nominal and indexed government bond yields have risen once again in most advanced economies, partly because new data releases appeared to alleviate investors' concerns that global economic growth might slow appreciably. Yields on both ten-year nominal and indexed securities have risen 15 basis points in Japan and 25 to 50 basis points in the euro area, the United Kingdom, and Canada since their December lows. As a result, inflation breakeven rates have been little changed.
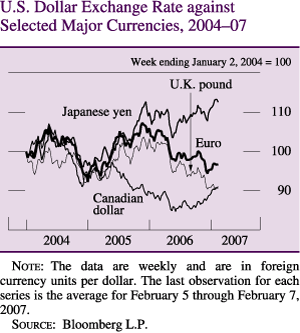
The Federal Reserve's broadest measure of the nominal trade-weighted exchange value of the dollar declined 3-3/4 percent from the beginning of last year through early February of this year. Over that period, the dollar appreciated 2-1/4 percent against the yen and 1-1/2 percent against the Canadian dollar, but it depreciated about 9 percent, on net, against the euro, almost 13 percent against sterling, and 4 percent against the Chinese renminbi. The renminbi's rate of appreciation stepped up in late 2006 and early 2007, but daily fluctuations in the dollar-renminbi exchange rate were very small.
Most of the dollar's overall decline in 2006 occurred between mid-April and early May. During this period, market participants reportedly sensed that the FOMC was approaching the end of its series of policy tightenings, and interest rate differentials moved against the dollar. Traders also refocused on the large and persistent U.S. current account deficit, which was further boosted by crude oil prices that had moved above $70 per barrel. To date in 2007, the dollar's broad nominal exchange value has risen 1 percent on balance.
In the wake of strong advances in 2005, major global equity indexes posted solid gains, on balance, in 2006 and in early 2007. After rising 5 percent to 10 percent in the first quarter of 2006, most global indexes fell sharply beginning in early May to reach intra-year lows in mid-June. Market participants attributed the drops in share prices to increased uncertainty about prospective inflation, caused in part by the run-up in energy prices, and to a retreat from risk-taking. Broad-based gains in stock prices since midsummer appear to be associated with a scaling back of expectations for future tightening of monetary policy in several countries and with declines in energy prices. Since mid-June, broad stock market indexes have gained 10 percent to 20 percent in Europe, Japan, and Canada.
Industrial Economies
After increasing at an annual rate of roughly 2 percent in the first half of 2006, Japanese real GDP grew only 3/4 percent in the third quarter, largely because of slower growth of consumption. Capital spending was an important contributor to growth of output throughout the year, supported by strong corporate profitability. Labor market conditions continued to improve; the unemployment rate was about 4 percent in December, its lowest level since 1998, and the ratio of job offers to applicants remained close to a thirteen-year high. However, wage growth was very subdued, as firms controlled cost increases, and unit labor costs continued to fall. In 2006, consumer prices started to rise again, posting small twelve-month increases after June, and land prices in Japan's six largest cities rose for the first time since 1991. However, the GDP deflator continued to decline slowly.
Real GDP in the euro area accelerated somewhat in 2006, posting average growth of 3-1/4 percent at an annual rate over the first three quarters. Output growth was supported in part by strong consumer spending, which grew substantially faster than in 2005. The stronger performance of the economy was reflected in improving labor market conditions: The unemployment rate in the euro area fell 0.8 percentage point during the year to reach 7.5 percent in December, continuing a downward movement that began in 2004. Wages and salaries in the manufacturing and services sector grew at an average annual rate of 2-1/4 percent in the first three quarters of the year--a bit lower than their rate of growth in 2005. Higher energy prices boosted euro-area consumer price inflation, which rose to about 2-1/2 percent in the first half of 2006; late in the year, it dropped below the European Central Bank's target ceiling of 2 percent. Core inflation remained near 1-1/2 percent.
Real GDP in the United Kingdom grew 3 percent last year, and real GDP in Canada grew 3 percent, on average, through the first three quarters. Despite declining consumer confidence in the United Kingdom, the pace of consumption growth over the year was slightly higher than in 2005, and consumer spending in Canada, supported by moderate employment growth, also remained robust. Declines in energy prices brought Canadian consumer price inflation down after the middle of the year to a twelve-month change of about 1-1/2 percent in December, below the Bank of Canada's 2 percent inflation target. Inflation in the United Kingdom edged up throughout the year, partly because of increases in electricity and natural gas prices that were implemented in the fall.
Emerging-Market Economies
Real GDP growth in China remained strong but moderated a bit in the second half. The mild slowdown suggests that the administrative measures put in place by the Chinese authorities to cool investment have had an effect. The trade surplus recorded a substantial increase in 2006. Four-quarter inflation picked up near the end of last year to over 2 percent, reflecting higher food prices.
Elsewhere in emerging Asia, economic performance was generally solid in 2006. In Korea, GDP growth slowed from the strong pace registered in 2005, partly because of monetary tightening, and consumer price inflation remained modest. The pace of growth in other countries stayed strong throughout 2006 as a result of robust exports and, in some cases, strengthening domestic demand. Four-quarter inflation moderated across the region. That moderation resulted from the waning effects of earlier reductions or removals of domestic fuel subsidies, but the previous tightening of monetary policy in the region and an appreciation of exchange rates also made a contribution. Capital inflows into several Asian emerging-market economies--particularly Thailand--in late 2006 and early this year put upward pressure on local currencies. Measures taken by Thai authorities seemed to succeed in limiting upward movement of the baht, but share prices in the Thai stock market fell sharply. Financial markets in other countries in the region were less affected and showed no noticeable spillovers from events in Thailand.
Output growth in Mexico was exceptionally strong in the first half of last year, especially in the manufacturing, construction, and services sectors. Growth stepped down in the second half; construction activity remained robust but was offset by a slowdown in exports of manufactured goods to the United States. Mexican consumer price inflation was elevated during the second half by higher food prices and reached rates above the 4 percent upper limit of the central bank's inflation target range; at year-end, inflation was still at the top end of the range.
Brazilian output growth was solid in the first quarter but slowed noticeably later in the year, partly because of weak manufacturing performance. Brazilian four-quarter inflation fell markedly, from almost 6 percent at the end of 2005 to just over 3 percent in December. In Argentina, steady growth in investment and consumption kept real GDP on a solid uptrend throughout 2006. The Argentine government continued to attempt to bring down inflation through voluntary price agreements with producers in several sectors; although inflation had edged down to the single-digit range by year-end, it was still high.
1. The group was established in 1992 and includes representatives from the Board of Governors of the Federal Reserve System, the Treasury, the Securities and Exchange Commission, the Commodity Futures Trading Commission, and the Federal Reserve Bank of New York. Return to text


