
Gauging the Uncertainty of the Economic Outlook
from Historical Forecasting Errors
Keywords: Uncertainty, forecasting, FOMC, monetary policy, prediction errors
Abstract:
1. Introduction
Recently, the Federal Open Market Committee (FOMC) announced several important changes to the information it will regularly provide the public on the economic outlook.2 In addition to extending the frequency, range, and detail of the forecasts provided by FOMC participants, the Committee will now publish information about the uncertainty of the economic outlook.3 Specifically, the Committee will release a summary of participants' views about how the current level of uncertainty compares with that seen on average in the past; this current assessment relative to a historical benchmark will be qualitative, not quantitative. In addition, the Committee will summarize participants' views on whether the risks to the outlook for real activity and inflation are skewed in one direction or another.
The purpose of this paper is to provide background information on the magnitude of uncertainty seen on average over history, as an aid to public understanding of the Committee's qualitative assessments of the current situation. To this end, we provide evidence on the past predictive accuracy of a number of different forecasters, including FOMC participants, the staff of the Federal Reserve Board, the Congressional Budget Office, the Administration, the Blue Chip consensus forecasts, and the Survey of Professional Forecasters. To preview our main results, we find that:
- Historical forecast errors are large in economic terms, indicating that -- if past performance is a good guide to future accuracy -- uncertainty about the economic outlook is considerable.
- Average differences in predictive performance across the forecasters in our sample are small, suggesting that we can use information gathered from a range of sources to help gauge the average magnitude of past uncertainty.
- About 70 percent of historical outcomes have fallen within one root mean squared error of forecasts. This result implies that historical prediction errors provide a reasonable basis for making explicit probability statements about the accuracy of future projections, conditional (once again) on the past being a good guide to future conditions.
All macroeconomic projections are subject to error. The economy may be hit with any number of unforeseen developments. The available measurements of real activity and inflation may be flawed. And models of the economy may be misspecified in critical ways. For all these reasons, the likelihood that actual outcomes will deviate substantially from predicted values is considerable. This likelihood does not mean that macroeconomic projections are worthless; rather, it implies that point forecasts of real activity and inflation provide an incomplete picture of the economic outlook. Achieving a more complete picture requires additional information about the probability distribution of the various possible outcomes. In particular, we would like to be able to make statements of the form: "There is a 70 percent probability that actual GDP growth next year will fall between X percent and Y percent and a 70 percent probability that consumer price inflation will fall between A percent and B percent."
A forecaster who wishes to make such a probability statement has several options for obtaining the necessary information.4 One option (pursued in this paper) is to look to past prediction errors as a rough guide to the magnitude of forecast errors that may occur in the future. For example, if 70 percent of actual outcomes over history fell within a band of a particular width around the predicted outcomes, then a forecaster might expect future outcomes to cluster around his or her current projection to a similar degree. Such an error-based approach has two attractive features. First, the relationship of the uncertainty estimates to historical experience is clear. Second, the approach focuses on the actual historical performance of forecasters under true "field conditions" and does not rely on after-the-fact analytic calculations, using various assumptions, of what their accuracy might have been.
Admittedly, the error-based approach has a potential drawback: It assumes that the past is a good guide to the future. Although this assumption in one form or another underlies all statistical analyses, there is always a risk that structural changes to the economy may have altered its inherent predictability, thereby reducing the relevance of past forecasting performance. Indeed, recent studies by Tulip (2005) and Campbell (2007) find that a statistically and economically significant reduction in the size of macroeconomic forecast errors occurred in the mid-1980s; Mishkin (2007), among others, suggests that some of this decline may be attributable to better monetary policy. We see this evidence as a reason for being wary about looking too far back in time for guidance, not an across-the-board invalidation of the relevance of past experience to gauging future uncertainty. That said, these studies suggest the need to be alert to evidence of structural change and other factors that may alter the predictability of economic outcomes for better or worse.
Our implementation of the error-based approach involves measuring the average accuracy of forecasts over history. A limitation of this procedure is that it provides guidance only on the average degree of uncertainty seen in the past and not on how a forecaster today, after taking account of conditions as they now stand, may perceive the degree to which uncertainty currently deviates from historical norms. As the Committee has noted in recent statements, unusual financial market developments have made the current economic outlook more uncertain than usual. This example illustrates the conditional nature of uncertainty and shows that perceptions of its magnitude may change from period to period in response to specific events. Each FOMC participant will now provide an assessment of whether the uncertainty attending his or her current projection, taking account of the current situation, is greater, smaller or broadly similar to the average of the past; the Committee will report a summary of these assessments. Our estimates of past forecasting accuracy provide a benchmark of "typical" uncertainty against which to compare these qualitative assessments.
Model simulations provide another way to gauge the uncertainty of the economic outlook. Given an econometric model of the economy, we can repeatedly simulate it while subjecting the model to stochastic shocks of the sort experienced in the past; for this purpose, we can use models ranging in size from simple univariate or VAR specifications to the large-scale models maintained at central banks. This approach has several advantages. For example, we can use it to approximate the entire probability distribution of possible outcomes for the economy. Moreover, we can generate these distributions as far into the future as desired and in as much detail as the structure of the model allows. Furthermore, the model-based approach permits analysis of the sources of uncertainty and can help explain why uncertainty might change over time.
However, the model-based approach also has its limitations. First, the estimates are specific to the particular model used in the analysis. If the forecaster and his or her audience are worried that the model in question is not an accurate depiction of the economy (as is always the case to some degree), they may not find its uncertainty estimates credible. Second, like the forecast-error-based approach, the model-based approach relies on the past being a good guide to the future. Finally, the model-based approach abstracts from both the difficulties and advantages of real-time forecasting: It tends to understate uncertainty by exploiting after-the-fact information to design and estimate the model, and it tends to overstate uncertainty by ignoring extra-model information available to forecasters at the time. For all these reasons, we do not emphasize the model-based approach in this paper, although we do compare our benchmark estimates of uncertainty with ones derived from stochastic simulations of FRB/US, a model used in the Federal Reserve Board for forecasting and policy analysis.
A third approach to gauging uncertainty is to have forecasters provide their own judgmental assessments of the confidence intervals associated with their projections. Such an approach does not mean that forecasters generate probability estimates with no basis in empirical fact; rather, the judgmental approach simply requires the forecaster, after reviewing the available evidence, to write down his or her best guess about the distribution of risks. Some central banks now combine judgment with other analyses to construct subjective fan charts that illustrate the uncertainty surrounding their outlooks; for example, such fan charts have been a prominent feature of the Bank of England's Inflation Report since the mid-1990s.
While the experience of these central banks demonstrates that subjective probability fan charts can be effective communication tools, this approach is harder to apply in the context of the FOMC. One difficulty is the lack of a consensus forecast around which to center (as the mean or mode) the distribution of possible outcomes; instead of a single projection, the seven Board members and the twelve Bank presidents produce their own individual forecasts. A related difficulty is the problem of summarizing how Committee participants, as a group, view uncertainty. While each Committee participant in principle may have an explicit quantitative assessment of the uncertainty surrounding his or her own outlook, the best way to aggregate such information into an informative quantitative assessment of the group's overall view is unclear and might be hard to implement. As we noted above, however, the Committee will report participants' qualitative views on how the uncertainty of the current outlook compares with historical experience, and these assessments may incorporate judgment to varying degrees.
In the remainder of this paper, we lay out a procedure for using past forecast errors to provide a benchmark estimate of historical forecast uncertainty. We begin by discussing several general considerations that influence the way in which we collect historical forecast data. We then turn to a detailed discussion of our six sources of forecast information -- the FOMC, the Federal Reserve Board staff, the Congressional Budget Office, the Administration, the Blue Chip, and the Survey of Professional Forecasters. Section 4 of the paper presents our empirical results; in section 5, we provide an illustrative example of how it would be possible to use our empirical results to make probability statements about the economic outlook. We then conclude with a few caveats.
2. Collecting Historical Forecast Data
To provide a benchmark against which to assess the uncertainty associated with the projections provided by individual Committee participants, one obvious place to turn is the FOMC's own forecasting record -- and indeed, we exploit this information in our analysis. For several reasons, however, we also take account of the projection errors of other forecasters. First, although the Committee has provided projections of real activity and inflation for almost thirty years, the horizon of these forecasts was, for quite a while, considerably shorter than it is now -- at most one and a half years ahead as compared with roughly three years under the procedures just announced. Accordingly, we must look to other sources to provide benchmark information on the potential accuracy of the Committee's new longer-range forecasts. Second, the definition of inflation projected by FOMC participants has changed over time in important ways, making it problematic to relate participants' past prediction errors to its current forecasts. In contrast, other forecasters have published inflation projections over many years using the same unchanged measure of consumer prices. Finally, given that the composition of the FOMC has changed over time, consideration of other forecasts reduces the likelihood of placing undue weight on a potentially unrepresentative record. For these reasons, we believe that supplementing the Committee's record with that of other forecasters has the potential to yield more-reliable estimates of forecast uncertainty.
In addition to seeking out multiple sources of forecast information, we also are interested in projections released at specific times of the year. For 2008, the FOMC has announced that it will release economic projections four times a year in conjunction with the release of the minutes of the January, April, June, and October FOMC meetings; the Monetary Policy Report, published in February and July, will also contain the information published with the January and June minutes, respectively. Accordingly, we would like our forecast data to have publication dates that match this winter-spring-summer-autumn schedule as closely as possible.
Under the FOMC's new communication procedures, the Committee will periodically release projections of real GDP growth, the civilian unemployment rate, total personal consumption expenditures (PCE) chain-weighted price inflation, and core PCE chain-weighted price inflation (that is, excluding food and energy). Ideally, the economic measures projected historically by our sample of forecasters would correspond exactly to these definitions; unfortunately, this has not always been the case. As discussed in the next section, the discrepancies in our sample from the Committee's new procedures are, for the most part, minor and do not have serious implications for our measures of uncertainty. However, our sample of inflation forecasts may be an exception. As noted, Committee participants now use the PCE chain-weighted price index (both overall and core) as the basis for their inflation forecasts, but over history neither the Committee nor other forecasters consistently made inflation projections on this basis. Rather, consistent-definition inflation projections are available from a variety of forecasters over a long period for the total consumer price index (CPI). Using the accuracy of CPI inflation forecasts to gauge the uncertainty of either total or core PCE inflation raises questions of comparability because price indexes differ in volatility and hence predictability. Fortunately, the staff of the Federal Reserve Board has long produced separate inflation forecasts for all these various price measures, so we are able to compare the accuracy of CPI-based forecasts with that of projections for total and core PCE inflation.
A final issue in data collection concerns the appropriate historical period for evaluating forecasting accuracy. In deciding how far back in time to go, we face two competing effects. On the one hand, collecting more data by extending the sample further back in time should yield sharper estimates of forecast accuracy if the forecasting environment has been stable over time. On the other hand, if the environment has in fact changed materially because of structural changes to the economy or improvements in forecasting techniques, then keeping the sample period relatively short should yield estimates that more accurately reflect current uncertainty. In balancing these two concerns, we have elected to start our sample with projections published in 1986. As discussed by McConnell and Perez-Quiros (2000) and many others, macroeconomic volatility in the United States was much larger before this period. As noted above, studies have found that the size of forecast errors changed around this time. By gauging current uncertainty with data from the mid-1980s on, we are implicitly assuming that the calm conditions since the Great Moderation will persist into the future.
3. Data Sources
For the reasons just discussed, we have computed historical projection errors based on projections made by a variety of forecasters. Our first source is the FOMC itself, for which we employ the midpoint of the central tendency ranges reported in past releases of the Monetary Policy Report.5 Our second source is the staff of the Federal Reserve Board, which prepares a forecast prior to each FOMC meeting; these projections are unofficially but universally called Greenbook forecasts.6 Our third and fourth sources are the Congressional Budget Office (CBO) and the Administration, both of which regularly publish forecasts as part of the federal budget process. Finally, we have two private data sources -- the monthly Blue Chip consensus forecasts and the mean responses to the quarterly Survey of Professional Forecasters (SPF). Both of these private surveys include a large number of business forecasters; the SPF also includes forecasters from universities and other nonprofit institutions.
Because these six sources did not project real activity and inflation in a uniform manner, they create some technical and conceptual issues for our analysis. We now discuss some of the key differences among our sources, including variations in data coverage and in reporting basis, and consider the implications of those differences. We then address several other issues important to our analysis, such as how to define "truth" in assessing forecasting performance, the mean versus modal nature of projections, and the implications of conditionality.
Data coverage
As summarized in Table 1, our data sources differ in several ways with regard to data coverage. For example, although all our sources published forecasts in every year from 1986 to 2006, only the Greenbook, the Blue Chip, and the SPF released projections at the four points of the year that correspond to the FOMC's new publication schedule; in contrast, the FOMC, the CBO, and the Administration did not publish forecasts during the spring and autumn.7 For this latter group, we approximate their missing projections by averaging the forecasts each made in adjacent periods; the pseudo-spring forecast is the average of their winter and summer projections, and the pseudo-autumn forecast is the average of their summer projection and following winter forecast.8
A second important variation concerns the horizon of the forecast. Historically, the Committee's projections have the shortest horizon, generally covering only the current year in the case of the winter projection and the following year in the case of the summer projection. In contrast, the horizons of the Greenbook, Blue Chip, and SPF projections extend over the following year, and they extend over a third year in the case of the autumn Greenbook forecasts. Finally, the projections published by both the CBO and the Administration extend many years into the future, thereby providing us with information on the accuracy of longer-range projections.
A final variation in data coverage concerns the availability of forecasts of the three main series used in our analysis -- real GDP growth, the unemployment rate, and CPI inflation. With the exception of the FOMC, all our sources published projections of these economic measures.9 In contrast, the Committee published inflation projections based on the total CPI from 1989 through 1999 only; prior to this period, participants based their inflation forecasts on the GNP deflator, and after this period they based them first on the overall PCE price index and later on the core PCE price index. Because these price measures have varying degrees of predictability -- in part reflecting differences in their sensitivity to volatile food and energy prices -- the FOMC's average historical accuracy in predicting inflation is a mixed estimate, not a "pure" one that can be used to gauge the accuracy of either total PCE or core PCE inflation forecasts. Thus, we do not use the Committee's inflation forecasts in our analysis.
Variations in reporting basis
Our six data sources also differ in the reporting basis of their projections of real activity and inflation. The FOMC, the Greenbook, the Administration, and the Blue Chip all published their projections for real GDP growth, CPI inflation, and the unemployment rate on the same basis now used by the Committee -- that is, as fourth-quarter-over-fourth-quarter percent changes for output growth and inflation and as fourth-quarter averages for the unemployment rate. In contrast, the CBO published projections for real GDP growth and CPI inflation on the desired reporting basis only for the current and following year; it reported projections for more-distant years as calendar-year-over-calendar-year percent changes. Moreover, the CBO did not report projections of the fourth-quarter average of the unemployment rate -- only its annual average. Finally, with the exception of the autumn release, SPF projections beyond the current year are available only on a calendar-year-over-calendar-year basis for real GDP growth and inflation and on an annual-average basis for the unemployment rate.10
These differences in reporting bases create a comparability problem for our analysis, especially in the case of the unemployment rate. Annual unemployment rate projections tend to be more accurate than forecasts of the fourth-quarter average for two reasons. First, averaging across quarters eliminates some quarter-to-quarter noise. Second, the annual average is effectively closer in time than the fourth-quarter average because the midpoint of the former precedes the midpoint of the latter by more than four months. This shorter effective horizon is especially important for current-year projections of the unemployment rate because the forecaster will already know, or have a good estimate of, some of the quarterly data that enter the annual average. For this reason, we do not use CBO prediction errors in computing the average accuracy of forecasts of the unemployment rate in the fourth quarter of the current year.
Annual-average forecasts of the unemployment rate probably have a comparative advantage at longer horizons as well for the same reasons. Moreover, similar considerations apply to out-year projections of real GDP growth and CPI inflation made on a calendar-year-over-calendar-year basis. Based on a comparison of Greenbook errors for forecasts made on these different reporting bases, we do not believe that the comparability problems are so severe as to merit excluding the out-year CBO and SPF projections from our estimates of average predictive accuracy. However, these reporting differences probably do account for some of the observed (small) differences in forecasting accuracy discussed below.11
Defining "truth"
Given our six sources of historical forecast data, we face the issue of how to define "truth" for the purposes of computing prediction errors. One possibility is to use the currently published estimates of historical data for real GDP growth, the unemployment rate, and the CPI. Using currently published data, however, has the drawback of incorporating subsequent definitional changes to the series that forecasters were actually projecting at the time. One example of such a change is the adoption of chain aggregation by the Bureau of Economic Analysis (BEA) in the mid-1990s for constructing measures of real GDP and its components as well as their associated price indexes; another example is the 1999 redefinition of business fixed investment to include outlays for computer software. Using current data would mean that these definitional changes would be a source of forecast error -- even though we do not interpret them as a source of uncertainty in a meaningful sense.
To minimize these problems, we define "truth" for real GDP and the two PCE price indexes for each year to be the BEA's so-called "first final" estimate. The "first final" estimate is the third and last one published by the BEA prior to the release of its annual revisions of the national accounts; the BEA usually publishes the first final estimates for the fourth quarter of the prior year in late March. This approach does not entirely free us from the problem of unanticipated methodological revisions for out-year forecasts because some revisions of this sort did occur within two or three years after some of the projections in our sample were made. In the case of the unemployment rate and the total CPI, we use the prior-year estimates reported in the April/May Greenbooks. However, the definition of "truth" is not an important problem for these two series because they are usually subject to only very small revisions relating to estimated seasonal factors.12
Mean versus modal forecasts
Another issue important to our forecast comparisons is whether they represent mean predictions as opposed to median or modal forecasts. The projections now produced by FOMC participants are explicitly modal forecasts in that they represent participants' projections of the most likely outcome. Although participants provide qualitative assessments of whether the risks around their projections are weighted to one side or the other, we do not have quantitative estimates of any skew. More importantly, we do not know whether participants' projections in the past had this modal characteristic. In the case of the Greenbook forecasts, the Federal Reserve Board staff only rarely has seen the distribution of risks as sufficiently skewed to warrant making the modal nature of the projection explicit in the text of the Greenbook. In contrast, the CBO's forecasts are explicitly mean projections. As for our other sources, we have no reason to believe that they are not mean projections, although we cannot rule out the possibility that some of these forecasters may have had some objective other than minimizing the root mean squared error of their predictions.
Implications of conditionality
A final issue of comparability concerns the conditionality of forecasts. Currently, each FOMC participant conditions his or her individual projection on "appropriate monetary policy," defined as the future policy most likely to foster trajectories for output and inflation consistent with the participant's interpretation of the dual mandate. Although the definition of "appropriate monetary policy" was less explicit in the past, Committee participants presumably had a similar idea in mind when making their forecasts historically. Whether or not the other forecasters in our sample generated their projections on a similar basis is unknown, but we think it reasonable to assume that most sought to maximize the accuracy of their predictions and so conditioned their forecasts on their assessment of the most likely outcome for monetary policy. However, this assumption is not valid for the Greenbook projections. Through most of the 1990s, the Federal Reserve staff conditioned its forecasts on a roughly flat path for the federal funds rate. This practice meant that real activity and inflation might evolve over the projection period in a way that was potentially inconsistent with the FOMC's policy objectives and, therefore, unlikely to occur. That is, the staff took the approach over much of our sample period of designing its forecasts not to maximize forecasting accuracy but instead to inform the FOMC about the potential consequences of unchanged policy. Thus, the Greenbook's historical forecast errors may tend to overstate the uncertainty of the outlook to some degree.13
4. Historical Forecast Accuracy
In this section, we review the empirical evidence on historical predictive accuracy provided by our sample of six forecasters. We organize this review around six key findings, starting first with the general magnitude of forecasting errors and ending with a comparison of our error-based estimates of uncertainty to ones derived from stochastic simulations of the FRB/US model. In all of this analysis, we focus on the root mean squared prediction errors made by our panel because such errors -- under certain assumptions that we will address in a moment -- provide a direct means of gauging the width of the confidence bands in which actual future outcomes might be expected to fall on average.14
Result #1: Forecasts errors are large
The difference between actual outcomes, as measured using real-time data, and the forecasts discussed in the previous section represent our set of forecast errors. We calculate these errors for all forecasts published between 1986 and 2006. For each forecaster we then take the square root of the mean squared error, or RMSE. The RMSE is a standard measure of the "typical" forecast error. Figure 1 and Tables 2 through 4 show the average across forecasters of the individual RMSEs for each horizon and variable. We should stress that these average RMSEs are not the root mean squared errors of a hypothetical pooled forecast that someone might have constructed by averaging the forecasts of the different members of our sample. Rather, we average the individual RMSEs of our forecasters in order to generate a benchmark for the typical amount of uncertainty we might expect to be associated with the separate forecasts of the different members of our sample, including the FOMC.
By way of a guide to Figure 1, the shortest forecast horizon we consider is for forecasts made in the autumn -- that is, in the fourth quarter of each year for outcomes of that year. As shown in the top panel of Figure 1, the average current-quarter RMSE for real GDP growth on a fourth-quarter-over-fourth-quarter basis is 0.6 percentage point.15 For more distant events, uncertainty is greater. The longest horizon forecasts in our sample are those made in the first quarter of each year (the winter) for outcomes that occur three years later in the fourth quarter. At this horizon, the average RMSE for GDP growth is 1.5 percentage points. Similarly, the average RMSE in our sample widens from around a tenth or two to about 1 percentage point for both the unemployment rate and CPI inflation.
These errors seem large. Suppose, for example, that a forecaster projected the unemployment rate to be close to 5 percent over the next few years. Given the size of past errors, we should not be surprised to see the unemployment rate actually climb to 6 percent or fall to 4 percent, because of unanticipated disturbances to the economy and other factors. This fact is sobering because such differences in actual outcomes for the real economy would imply very different states of public well-being and would likely have important implications for the stance of monetary policy. Similarly, an inflation outcome of 1 percent per year would no doubt be seen by the FOMC as having quite different ramifications for the appropriate level of the federal funds rate from an inflation outcome of 3 percent. Yet, we should not be overly surprised to see either inflation outcome if we are projecting prices to rise 2 percent per year.
Another way of gauging the size of these forecast errors is to compare them to the actual variations seen from year to year over history. We might judge forecasters as quite informative if they make errors that on average are only a fraction of the standard deviations for output growth, the unemployment rate, and inflation. However, the ratio of the average RMSEs to the 1986-2006 standard deviations is about 90 percent for real GDP growth, 50 percent for the unemployment rate, and 80 percent for CPI inflation in the case of winter projections of current-year conditions. For longer forecast horizons, RMSEs are about the same as the standard deviations. These figures suggest that output and inflation forecasts beyond the next few quarters tell us little beyond the long-run average of a series, although forecasts of the unemployment rate may be somewhat more informative a bit further into the future. This result may not be as surprising as it initially appears. In particular, if monetary policy is doing a good job of stabilizing real activity and inflation, then deviations of output growth and inflation from their long-run averages should be essentially unpredictable past a certain horizon.
As Figure 1 illustrates, average RMSEs increase with forecast horizon and then tend to flatten out. This result is not surprising because we know more about the forces affecting near-term events; put another way, as the time between a forecast and an event increases, more surprises will accumulate. That said, much of the widening of the RMSEs for GDP growth and inflation reflects data construction rather than increasing uncertainty about the future. Near-horizon forecasts of real GDP growth and CPI inflation span some quarters for which the forecaster already has published quarterly data. For this reason, most of the increase in RMSEs during the first few quarters essentially reflects the incremental replacement of a known past with an unknown future in the calculations.
Result #2: Differences across forecasters are small
Our second main result is that differences in predictive accuracy across forecasters are small. This point is evident from a simple perusal of Tables 2 through 4, which shows that RMSEs on the same reporting basis and for the same variable-horizon combination typically differ by only one or two tenths of a percentage point across forecasters, controlling for release date. Compared with the size of the RMSEs themselves, such differences seem relatively unimportant because they imply only modest variations in the average magnitude of past uncertainty. Moreover, some of the differences clearly reflect the variations in reporting basis that we discussed earlier. For example, as was discussed in footnote 10, the CBO's unemployment forecasts were more accurate than others were in part because they are on an annual-average basis. Finally, some of variation across forecasters likely reflects differences in the timing of projections because forecasts made late in the quarter tend to be more accurate than those made earlier, particularly in the case of current-year forecasts.16
Of course, some of the differences we observe probably reflect random noise, given the small size of our sample. Table 5 shows p-values from a test of the hypothesis that the RMSEs are unequal because of chance alone -- that is, the probability that we would see such differences because of random sampling variability when all forecasters are in fact equally accurate.17 Generalizing about the results in the table is difficult, given that the tests are not independent. Nevertheless, the broad pattern is for p-values to be large for the longer-horizon forecasts -- that is, the likelihood is high that accuracy is the same for out-year forecasts. In contrast, some clear differences do appear for current-year and next-year projections. However, we judge that timing and methodological differences probably account for most of these low p-values, in part because the low next-year p-values tend to become insignificant when we exclude the projections reported on a non-standard basis (that is, some of the CBO and SPF projections).
That the forecasts in our sample have similar accuracy is perhaps not particularly surprising, given that each reflects the average view of many people, either explicitly or implicitly. This similarity is most clear for the Blue Chip and the SPF forecasts, which represent the mean of the individual projections provided by a large group of forecasters. By averaging across many independent projections, these surveys tend to wash out idiosyncratic differences in forecasting techniques or views about the economy. Given that the participants in both surveys have similar expertise and the same access to information, we therefore should not expect these two surveys to yield appreciably different views about the outlook. A similar logic applies to the midpoint of the consensus range of the FOMC projections published in the Monetary Policy Report, as this forecast is the "average" view of nineteen informed individuals. Of course, our three other sources -- the Federal Reserve Board staff, the Congressional Budget Office, and the Administration -- do produce forecasts that represent the views of individual institutions. But in all three cases the forecasting process incorporates the analysis and judgment of a large number of economists, and for all practical purposes the outcome is a group decision.18 Furthermore, these institutions are aware of the private forecasts when they make their own forecasts, and knowing that the Blue Chip and the SPF often contain valuable information, may adjust their projections in ways that bring them into closer alignment with the consensus of private forecasters.
Another explanation for the small size of the performance differences is that inherently unpredictable factors probably account for a large percentage of the variation in real activity and inflation. Although difficult to prove, this explanation seems plausible given the nature of some of the important shocks that buffeted the economy between 1986 and 2006. Events such as the Iraqi invasion of Kuwait and the productivity acceleration that began in the mid-1990s caught most economic forecasters by surprise. Similarly, we would not expect many forecasters, if any, to have anticipated the onset of the stock market boom of the late 1990s and the later housing market boom of this decade; we might also expect most forecasters to have made similar errors in predicting the timing and magnitude of the busts that eventually followed these booms. In any event, the projection errors in our sample are highly correlated, with correlation coefficients that typically range from 0.75 to 0.95. Gavin and Mandel (2001) and Sims (2002) have made similar observations.
Although the focus of this paper is on the performance of forecasters as a whole and not that of any individual forecaster, we think one particular result is worthy of note. Romer and Romer (2000) and Sims (2002) reported that the Greenbook, over a period that extended back into the 1970s and ended in the early 1990s, outperformed some other forecasters, especially for short-horizon forecasts of inflation. In contrast, a review of Tables 2 through 4 reveals that the Federal Reserve Board staff performs about the same as other forecasters for our sample.
Result #3: RMSE-based bands span roughly 70 percent of errors
If we knew that forecast errors were normally distributed, then we would expect to see roughly 70 percent of historical errors to fall within a range equal to zero plus or minus one RMSE. (The precise theoretical probability is 68 percent.) This knowledge, in turn, would enable forecasters to make probability statements of the sort we noted in the introduction: "Based on the historical accuracy of our forecasts, we believe there is about a 70 percent probability that variable X will lie within plus or minus one RMSE of the current projection." However, forecasters could still make statements of this sort without knowledge of the exact distribution (whether normal or something else) as long as they had a good sense of the percentage of past errors that did fall within a range of plus or minus one RMSE.
Table 6 shows the actual percentage of past errors -- for each combination of variable, forecast horizon, and release date -- that did fall within this range. Most of the percentages are in the vicinity of 68 percent. Of course, the actual frequency of errors falling in a given band will vary in small samples, reflecting random variation. If the true percentage is 68 percent and our sample includes N independent errors, the actual percentages we observe should be binomially distributed with parameters (N, .68). Accordingly, we can compute the probability of observing deviations from 68 percent that are as large as we see. As indicated by the asterisks in Table 6, this probability is less than 10 percent in only a few cases using a two-tailed test. These results seem consistent with our assumptions, especially given that our errors are not independent (thereby implying that our test overstates the effective size of our sample).
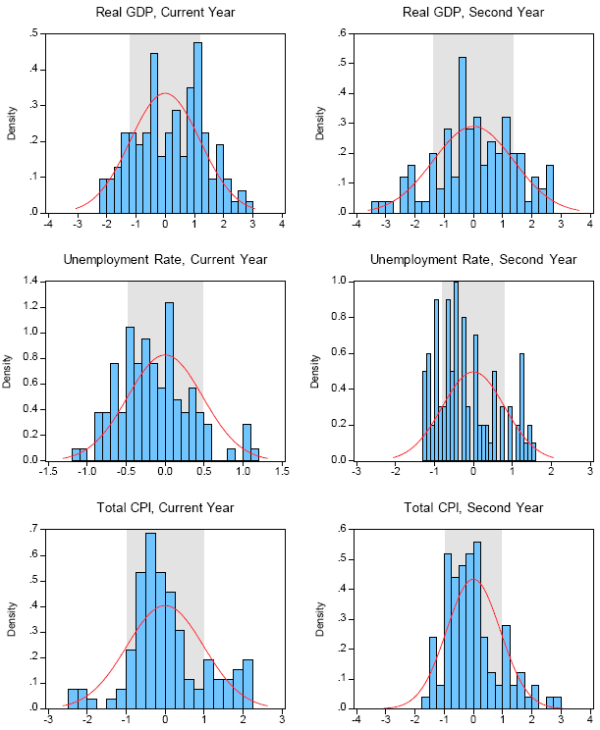
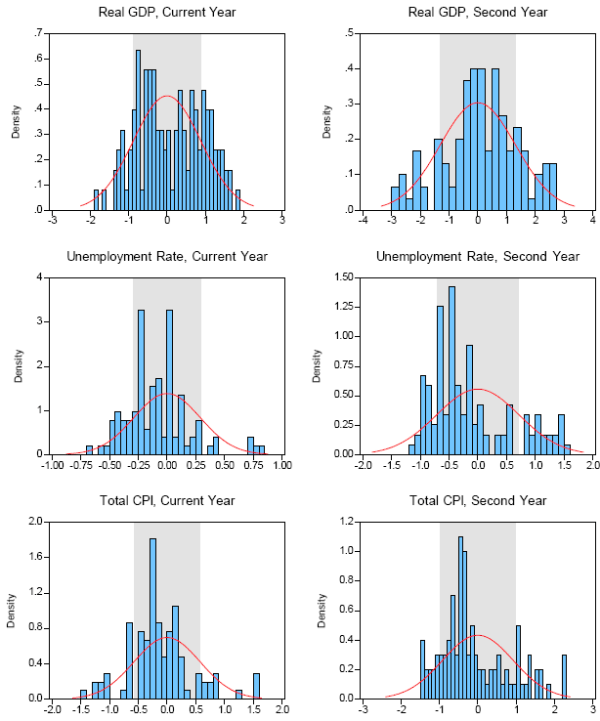
For some purposes, such as statistical inference or the calculation of confidence intervals with different probabilities, we would like to know if the forecast errors are in fact distributed normally; for example, we could then say that 95 percent of the errors should fall within a range equal to plus or minus two RMSEs. Figures 2 and 3 provide some graphical information on the historical distribution of forecast errors for the winter and spring publication dates, respectively; the figures also compare these empirical histograms to a corresponding theoretical normal distribution with mean zero and standard deviation equal to the sample RMSE. To construct these graphs for the different publication dates, we pool the prediction errors for all the forecasters in our sample for each different variable-horizon combination. Visually, the actual empirical distributions overall do not appear to be grossly at odds with the theoretical normal distribution. For example, the empirical and theoretical distributions appear to have roughly the same amount of mass concentrated in the central shaded region, which encompasses 68 percent of the mass under the normal distribution.
Overall impressions aside, some of the histograms do seem to have suspiciously non-normal features, such as skewness. Jarque-Bera tests for normality yield p-values of 5 percent or less for almost one-third of all the different combinations of variable, forecast horizon, and release date (Table 7). By themselves, these results would seem to cast doubt on the validity of assuming that forecast errors are normally distributed. However, the Jarque-Bera test in these circumstances is likely to signal non-normality too often because the errors are highly correlated across forecasters; forecast errors for horizons beyond the current year are serially correlated as well.
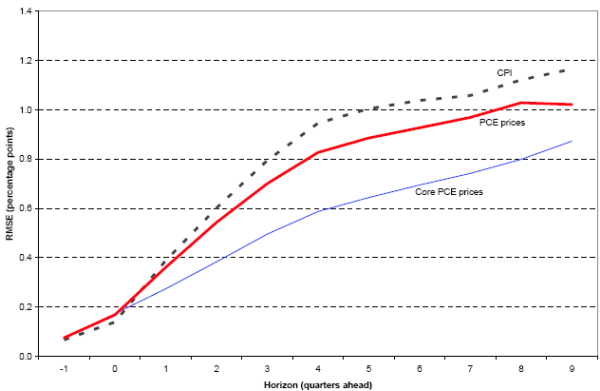
Result #4: CPI inflation errors may be larger than PCE inflation errors
As discussed in section 3, the FOMC will be presenting inflation forecasts based on the total PCE price index and the core PCE price index. Given the scarcity of historical forecasts of these variables, we derive a benchmark for past inflation uncertainty from forecasts for total CPI inflation. The CPI is closely related to the PCE price indexes (indeed, many components of the PCE measure are derived directly from detailed pieces of the CPI) and has been widely forecast. However, there are important differences as well, including the weights assigned to different elements of the price indexes, the scope of expenditures considered, and the methods used to aggregate detailed components into the overall measure (fixed weights versus chain weighting).
Figure 4 compares forecast errors for these three series based on Greenbook projections. Over most of the forecast horizon, RMSEs for PCE inflation are about 10 percent smaller than RMSEs for CPI inflation. Core PCE RMSEs are as much as 38 percent smaller than CPI RMSEs (for four-quarter-ahead forecasts), although the margin falls to 25 percent for nine-quarter-ahead forecasts. (These latter forecasts appeared in September Greenbooks and were for inflation two calendar years ahead.) These comparisons suggest that the errors we report for CPI inflation slightly overstate past uncertainty about PCE inflation and considerably overstate past uncertainty for core PCE inflation.
Result #5: Error-based estimates of uncertainty are sensitive to sample period
Ideally, our RMSE estimates of forecast uncertainty should be reasonably robust, in the sense that they should not be markedly sensitive to modest adjustments to our basic methodology, such as changes in sample period. In Table 8, we report average RMSEs for three different samples -- the full sample covering the period from 1986 to 2006, a truncated sample that excludes forecasts made prior to 1991, and a third sample that excludes all projections made after 2000. By dropping projections made at either the start or the end of the full sample period, we cause the RMSEs to shift by as much as two or three tenths of a percentage point. Such shifts are not huge from an economic standpoint, but they do illustrate how relatively minor variations in sample period can cause estimated confidence intervals to shift by a noticeable amount.
Estimates of historical forecasting accuracy look much less stable if one examines the period prior to the start of the Great Moderation in the mid-1980s. Campbell (2007) for the SPF and Tulip (2005) for the Greenbook find statistically and economically significant reductions in the size of
forecast errors in the mid-1980s (and no clear trend up or down since). For example, the root mean squared error of the Greenbook forecast of real GDP growth was roughly 60 percent greater from the late 1960s to 1984 than it has been since for projections with a horizon of a year or less. In a
similar vein, we find that the RMSE of one-year-ahead Greenbook inflation forecasts based on the GDP deflator (the inflation series for which we have the longest time series) was 2
![]() times larger from 1968 to 1984 than it has been since. These changes highlight a general risk to any
assessment of uncertainty: The economy can evolve over time in ways that can fundamentally alter its inherent predictability. The fact that the economy has been unusually calm for the last twenty years is not a guarantee that it will remain so permanently.
times larger from 1968 to 1984 than it has been since. These changes highlight a general risk to any
assessment of uncertainty: The economy can evolve over time in ways that can fundamentally alter its inherent predictability. The fact that the economy has been unusually calm for the last twenty years is not a guarantee that it will remain so permanently.
Result #6: Error-based and model-based estimates of uncertainty are broadly similar
Our final empirical result concerns the relationship between our RMSE-based estimates of uncertainty and ones derived from simulations of econometric models.19 Model-based estimates, like error-based estimates, are by nature empirical and rooted in historical experience, in part because the parameters of an econometric model are typically chosen to fit the data subject to the constraints imposed by economic theory. In addition, the model-based approach attempts to approximate the probability distribution of possible outcomes for the future by repeatedly simulating the response of the model to random shocks of the sort seen in the past. Despite this shared empirical basis, however, model-based estimates may differ noticeably from error-based estimates for many reasons. As was noted earlier, the model-based approach may understate uncertainty because after-the-fact information was used to design and estimate the model; alternatively, it may overstate uncertainty by ignoring extra-model information available to forecasters at the time.
With these caveats in mind, Table 9 compares the average RMSEs from our sample with forecast standard error estimates derived from simulations of FRB/US, an econometric model used by the Federal Reserve Board staff for forecasting and policy analysis.20 To construct these model-based estimates, we simulate the model 5000 times, repeatedly subjecting it to shocks drawn randomly from the 1986-2006 set of model equation residuals. In the simulations, monetary policy responds to the shocks as predicted by an estimated version of the Taylor rule.
As can be seen, the model-based estimates are remarkably similar to the historical RMSEs for both real GDP and inflation. In contrast, the model results suggest that uncertainty about the outlook for the unemployment rate is markedly less than our estimates of past forecasting performance would suggest.21 Table 9 also provides some supplementary information on the relative magnitude of uncertainty estimates for total CPI inflation, total PCE inflation, and core PCE inflation. According to the FRB/US model, uncertainty about the outlook for total PCE inflation appears to be somewhat less than uncertainty about total CPI inflation, while uncertainty about core PCE inflation turns out to be only two-thirds as large as total CPI uncertainty. These relative magnitudes are roughly consistent with the evidence presented earlier using historical Greenbook RMSEs.
5. Confidence intervals about the forecast -- an illustrative example
Returning to a point we made at the start of this paper, we would like to make probability statements of the form: "There is about a 70 percent probability that actual GDP growth next year will fall between X percent and Y percent, and about a 70 percent probability that consumer price inflation will fall between A percent and B percent." We are now in position to do this using our set of historical RMSEs. To illustrate this procedure, we take the most recently published forecast of economic activity that extends over the full horizon recently adopted by the FOMC -- specifically, the projection released by the CBO in August 2007. This projection is shown in the top panel of Table 10. At the time, the CBO projected that real GDP growth would be relatively weak in 2007 but then would strengthen over 2008 and 2009 to 3.2 percent, a rate that the CBO judged to be in line with the economy's potential. Given this pace of overall growth, the CBO expected the unemployment rate to drift up to 4.8 percent, the CBO's estimated value of the NAIRU. Finally, the CBO projected CPI inflation to slow from 3.6 percent in 2007 to 2.2 percent, on average, over 2008 to 2010 as the temporary effects of surging energy prices dissipated.
The middle portion of Table 10 shows the average RMSEs for summer projections; these figures are taken from Tables 2 through 4. If current uncertainty is similar to that seen in the past, we can expect that actual economic outcomes will fall about 70 percent of the time, on average, within a range equal to the baseline forecast plus or minus the average RMSE. These ranges appear in the bottom portion of the table. These ranges indicate that the economic outlook is highly uncertain. For example, our analysis suggests a probability of about 70 percent that the unemployment rate could be between 4.0 percent and 5.4 percent in 2008, with the range of uncertainty widening somewhat past that point.
Uncertainty is also considerable for inflation. On the basis of the CBO forecast, and again assuming that uncertainty is similar to the average of the past, our analysis suggests a probability of about 30 percent that total CPI inflation could run below 1
![]() percent or above 3
percent or above 3
![]() percent in 2010. For core inflation, however, the range of uncertainty would likely be somewhat
smaller. The CBO projected that core PCE inflation would settle in at around 1
percent in 2010. For core inflation, however, the range of uncertainty would likely be somewhat
smaller. The CBO projected that core PCE inflation would settle in at around 1
![]() percent past 2008. Given our finding that core PCE inflation forecasts are probably one-quarter to
one-third more accurate than total CPI inflation projections, we would say that the probability is approximately 70 percent that actual core PCE inflation beyond next year will fall between 1 percent and 2
percent past 2008. Given our finding that core PCE inflation forecasts are probably one-quarter to
one-third more accurate than total CPI inflation projections, we would say that the probability is approximately 70 percent that actual core PCE inflation beyond next year will fall between 1 percent and 2
![]() percent.
percent.
6. Conclusions
In this paper, we have presented estimates of past forecast uncertainty. These estimates can be used as a benchmark against which to assess the qualitative assessments of FOMC participants of current uncertainty. This approach, which exploits the historical forecast record of several groups, suggests that uncertainty about the economic outlook is considerable. In addition, our results appear to be in line with at least some model-based estimates; for example, they are similar to ones generated through stochastic simulations of the FRB/US model.
We should repeat a caveat to our analysis: Our approach rests to a large degree on the assumption that the past is a good guide to the future and that forecasters in the future will make prediction errors similar to those made over the past twenty years. Although assumptions of this sort are a practical necessity in all empirical work, we must bear in mind that the economy appears to have been more volatile and unpredictable prior to the mid-1980s. In light of this fact, one cannot rule out the possibility that the average magnitude of economic uncertainty could change again, for better or worse. If so, our error-based estimates by themselves would paint a misleading picture of the potential risks to the outlook.
For this and other reasons, we stress that our approach is not a complete assessment of uncertainty at present. Rather, we intend our estimates to be used in conjunction with the qualitative summary the FOMC will publish of participants' views concerning the uncertainty of the current outlook. For example, Committee participants may suggest that uncertainty is greater or less than that seen on average in the past or that the risks to the outlook are skewed in a particular direction. This information, taken as a whole, is intended to convey a more complete sense of likely outcomes than would be provided by their individual forecasts and the benchmark uncertainty estimates alone.
References
| Source | Release Dates | Horizon | Reporting Basis: Real GDP Growth | Reporting Basis: Unemployment Rate | Reporting Basis: Total CPI Inflation |
|---|---|---|---|---|---|
| Monetary Policy Report | Winter Summer |
Extends to next year in Summer | Q4/Q4 | Q4 | Not used |
| Federal Reserve staff (Greenbook) | Winter Spring Summer Fall |
Extends to year after next in autumn | Q4/Q4 | Q4 | Q4/Q4 |
| Congressional Budget Office | Winter Summer |
More than four years | Q4/Q4 for current and next year; annual average thereafter | Annual average | Q4/Q4 for current and next year; annual average thereafter |
| Administration | Winter Summer |
More than four years | Q4/Q4 | Q4 Total through 1991, then civilian | Q4/Q4 |
| Blue Chip | Winter Spring Summer Fall |
Current and next year | Q4/Q4 | Q4 | Q4/Q4 |
| Survey of Professional Forecasters | Winter Spring Summer Fall |
Current and next year | Q4/Q4 for current year and (for autumn only) next year. Otherwise, annual average | Q4 for current year and, for autumn only, next year. Otherwise, annual average | Q4/Q4 for current year and, for autumn only, next year. Otherwise, annual average |
| Projection Period Year: Current | Projection Period Year: Second | Projection Period Year: Third | Projection Period Year: Fourth | |
|---|---|---|---|---|
| Winter projections: Monetary Policy Report | 1.10 | -- | -- | -- |
| Winter projections: Federal Reserve staff (Greenbook) | 1.19 | 1.39 | -- | -- |
| Winter projections: Congressional Budget Office | 1.26 | 1.39 | 1.353 | 1.433 |
| Winter projections: Administration | 1.29 | 1.48 | 1.46 | 1.52 |
| Winter projections: Blue Chip | 1.17 | 1.30 | -- | -- |
| Winter projections: Survey of Professional Forecasters | 1.14 | 1.313 | -- | -- |
| Winter projections: Average | 1.19 | 1.37 | 1.40 | 1.48 |
| Spring projections: | ||||
| Spring projections:Monetary Policy Report2 | 0.94 | -- | -- | -- |
| Spring projections:Federal Reserve staff (Greenbook) | 1.03 | 1.25 | -- | -- |
| Spring projections:Congressional Budget Office2 | 1.03 | 1.36 | 1.363 | 1.403 |
| Spring projections:Administration2 | 1.09 | 1.44 | 1.45 | 1.50 |
| Spring projections:Blue Chip | 1.04 | 1.31 | -- | -- |
| Spring projections:Survey of Professional Forecasters | 0.92 | 1.313 | -- | -- |
| Spring projections:Average | 1.01 | 1.33 | 1.41 | 1.45 |
| Summer projections: Monetary Policy Report | 0.84 | 1.28 | -- | -- |
| Summer projections: Federal Reserve staff (Greenbook) | 0.89 | 1.34 | -- | -- |
| Summer projections: Congressional Budget Office | 0.89 | 1.35 | 1.393 | 1.383 |
| Summer projections: Administration | 0.96 | 1.42 | 1.45 | 1.47 |
| Summer projections: Blue Chip | 0.90 | 1.29 | -- | -- |
| Summer projections: Survey of Professional Forecasters | 0.79 | 1.193 | -- | -- |
| Summer projections: Average | 0.88 | 1.31 | 1.42 | 1.43 |
| Autumn projections: | ||||
| Autumn projections: Monetary Policy Report2 | 0.46 | 1.16 | -- | -- |
| Autumn projections: Federal Reserve staff (Greenbook) | 0.60 | 1.37 | 1.50 | -- |
| Autumn projections: Congressional Budget Office2 | 0.54 | 1.27 | 1.353 | 1.373 |
| Autumn projections: Administration2 | 0.61 | 1.28 | 1.48 | 1.47 |
| Autumn projections: Blue Chip | 0.64 | 1.26 | -- | -- |
| Autumn projections: Survey of Professional Forecasters | 0.61 | 1.25 | -- | -- |
| Autumn projections: Average | 0.58 | 1.27 | 1.44 | 1.42 |
- Percent change, fourth quarter of year from fourth quarter of previous year.
- Average of summer projection and subsequent winter projection.
- Percent change, annual average for year relative to annual average of previous year.
| Projection Period Year: Current | Projection Period Year: Second | Projection Period Year: Third | Projection Period Year: Fourth | |
|---|---|---|---|---|
| Winter projections: Monetary Policy Report | 0.48 | -- | -- | -- |
| Winter projections: Federal Reserve staff (Greenbook) | 0.46 | 0.79 | -- | -- |
| Winter projections: Congressional Budget Office | 0.333 | 0.783 | 1.043 | 1.073 |
| Winter projections: Administration | 0.51 | 0.85 | 1.02 | 1.04 |
| Winter projections: Blue Chip | 0.49 | 0.89 | -- | -- |
| Winter projections: Survey of Professional Forecasters | 0.47 | 0.713 | -- | -- |
| Winter projections: Average | 0.484 | 0.80 | 1.03 | 1.06 |
| Spring projections: Monetary Policy Report2 | 0.36 | -- | -- | -- |
| Spring projections: Federal Reserve staff (Greenbook) | 0.35 | 0.73 | -- | -- |
| Spring projections: Congressional Budget Office2 | 0.213 | 0.693 | 1.003 | 1.093 |
| Spring projections: Administration2 | 0.41 | 0.80 | 1.00 | 1.06 |
| Spring projections: Blue Chip | 0.39 | 0.85 | -- | -- |
| Spring projections: Survey of Professional Forecasters | 0.33 | 0.633 | -- | -- |
| Spring projections: Average | 0.374 | 0.74 | 1.00 | 1.07 |
| Summer projections: Monetary Policy Report | 0.28 | 0.77 | -- | -- |
| Summer projections: Federal Reserve staff (Greenbook) | 0.30 | 0.73 | -- | -- |
| Summer projections: Congressional Budget Office | 0.143 | 0.663 | 0.993 | 1.123 |
| Summer projections: Administration | 0.32 | 0.77 | 0.99 | 1.08 |
| Summer projections: Blue Chip | 0.29 | 0.79 | -- | -- |
| Summer projections: Survey of Professional Forecasters | 0.25 | 0.523 | -- | -- |
| Summer projections: Average | 0.294 | 0.71 | 0.99 | 1.10 |
| Autumn projections: Monetary Policy Report2 | 0.14 | 0.60 | -- | -- |
| Autumn projections: Federal Reserve staff (Greenbook) | 0.15 | 0.62 | 0.90 | -- |
| Autumn projections: Congressional Budget Office2 | 0.073 | 0.463 | 0.873 | 1.073 |
| Autumn projections: Administration2 | 0.20 | 0.62 | 0.91 | 1.05 |
| Autumn projections: Blue Chip | 0.14 | 0.65 | -- | -- |
| Autumn projections: Survey of Professional Forecasters | 0.11 | 0.60 | -- | -- |
| Autumn projections: Average | 0.154 | 0.59 | 0.89 | 1.06 |
- Fourth-quarter average.
- Average of summer projection and subsequent winter projection.
- Annual average. Forecasts for the annual average of the unemployment rate tend to be more accurate than forecasts for the fourth-quarter average, especially for the current year.
- Excludes CBO root mean squared prediction errors because of non-comparability.
| Projection Period Year: Current | Projection Period Year: Second | Projection Period Year: Third | Projection Period Year: Fourth | |
|---|---|---|---|---|
| Winter projections: Federal Reserve staff (Greenbook) | 1.00 | 0.98 | -- | -- |
| Winter projections: Congressional Budget Office | 0.99 | 0.90 | 0.803 | 0.873 |
| Winter projections: Administration | 1.07 | 1.05 | 1.04 | 1.16 |
| Winter projections: Blue Chip | 0.95 | 0.91 | -- | -- |
| Winter projections: Survey of Professional Forecasters | 0.93 | 0.983 | -- | -- |
| Winter projections: Average | 0.99 | 0.96 | 0.92 | 1.01 |
| Spring projections: Federal Reserve staff (Greenbook) | 0.71 | 1.02 | -- | -- |
| Spring projections: Congressional Budget Office2 | 0.73 | 0.92 | 0.803 | 0.883 |
| Spring projections: Administration2 | 0.74 | 0.98 | 1.04 | 1.11 |
| Spring projections: Blue Chip | 0.64 | 0.92 | -- | -- |
| Spring projections: Survey of Professional Forecasters | 0.66 | 1.023 | -- | -- |
| Spring projections: Average | 0.69 | 0.97 | 0.92 | 0.99 |
| Summer projections: Federal Reserve staff (Greenbook) | 0.52 | 1.03 | -- | -- |
| Summer projections: Congressional Budget Office | 0.62 | 0.96 | 0.813 | 0.893 |
| Summer projections: Administration | 0.62 | 0.94 | 1.08 | 1.08 |
| Summer projections: Blue Chip | 0.59 | 0.94 | -- | -- |
| Summer projections: Survey of Professional Forecasters | 0.50 | 1.033 | -- | -- |
| Summer projections: Average | 0.57 | 0.98 | 0.95 | 0.99 |
| Autumn projections: Federal Reserve staff (Greenbook) | 0.15 | 1.07 | 1.04 | -- |
| Autumn projections: Congressional Budget Office2 | 0.36 | 0.91 | 0.803 | 0.843 |
| Autumn projections: Administration2 | 0.35 | 0.93 | 1.07 | 1.06 |
| Autumn projections: Blue Chip | 0.21 | 0.94 | -- | -- |
| Autumn projections: Survey of Professional Forecasters | 0.24 | 0.95 | -- | -- |
| Autumn projections: Average | 0.26 | 0.96 | 0.97 | 0.95 |
- Percent change, fourth quarter of year from fourth quarter of previous year.
- Average of summer projection and subsequent winter projection.
- Percent change, annual average for year relative to annual average of previous year.
| Projection Period Year: Current | Projection Period Year: Second | Projection Period Year: Third | Projection Period Year: Fourth | |
|---|---|---|---|---|
| Winter projections: Real GDP | .10 | .54 | .52 | .55 |
| Winter projections: Unemployment Rate | .442 | .78 | .77 | |
| Winter projections: Total CPI | .05 | .22 | .25 | .28 |
| Spring projections: Real GDP | .20 | .75 | .59 | .51 |
| Spring projections: Unemployment Rate | .87 | .78 | ||
| Spring projections: Total CPI | .48 | .06 | .22 | .31 |
| Summer projections: Real GDP | .13 | .17 | .68 | .51 |
| Summer projections: Unemployment Rate | .012 | .96 | .81 | |
| Summer projections: Total CPI | .23 | .02 | .20 | .32 |
| Autumn projections: Real GDP | .26 | .52 | .47 | .52 |
| Autumn projections: Unemployment Rate | .53 | .83 | ||
| Autumn projections: Total CPI | .44 | .20 | .27 |
- Multivariate generalization of the Diebold and Mariano (1995) test of predictive accuracy. Details are in footnote 14.
- Excludes CBO annual-average unemployment rate forecasts.
| Projection Period Year: Current | Projection Period Year: Second | Projection Period Year: Third | Projection Period Year: Fourth | |
|---|---|---|---|---|
| Winter projections: Real GDP (Q4-over-Q4 percent change) | 62 | 66 | 71 | 67 |
| Winter projections: Unemployment rate (Q4 average)2 | 66 | 61 | 63 | 67 |
| Winter projections: Total CPI (Q4-over-Q4 percent change) | 71 | 68 | 66 | 75 |
| Spring projections: Real GDP (Q4-over-Q4 percent change) | 61* | 67 | 68 | 67 |
| Spring projections: Unemployment rate (Q4 average)2 | 69 | 61 | 61 | 64 |
| Spring projections: Total CPI (Q4-over-Q4 percent change) | 67 | 70 | 66 | 72 |
| Summer projections: Real GDP (Q4-over-Q4 percent change) | 61* | 67 | 74 | 64 |
| Summer projections: Unemployment rate (Q4 average)2 | 69 | 65 | 58 | 64 |
| Summer projections: Total CPI (Q4-over-Q4 percent change) | 70 | 68 | 66 | 69 |
| Autumn projections: Real GDP (Q4-over-Q4 percent change) | 66 | 68 | 70 | 64 |
| Autumn projections: Unemployment rate (Q4 average)2 | 69 | 59* | 56* | 61 |
| Autumn projections: Total CPI (Q4-over-Q4 percent change) | 76* | 70 | 70 | 69 |
- Sample includes prediction errors for all forecasters with projections published from 1986 to 2006.
- Current-year count excludes CBO annual-average unemployment rate forecasts.
| Projection Period Year: Current | Projection Period Year: Second | Projection Period Year: Third | Projection Period Year: Fourth | |
|---|---|---|---|---|
| Winter projections: Real GDP | .17 | .59 | .80 | .35 |
| Winter projections: Unemployment Rate | .082 | .01 | .21 | .52 |
| Winter projections: Total CPI | .32 | .11 | .02 | |
| Spring projections: Real GDP | .08 | .51 | .83 | .41 |
| Spring projections: Unemployment Rate | .042 | .21 | .45 | |
| Spring projections: Total CPI | .06 | .06 | ||
| Summer projections: Real GDP | .07 | .41 | .86 | .48 |
| Summer projections: Unemployment Rate | .012 | .21 | .39 | |
| Summer projections: Total CPI | .04 | .18 | ||
| Autumn projections: Real GDP | .26 | .47 | .80 | .62 |
| Autumn projections: Unemployment Rate | .09 | .36 | ||
| Autumn projections: Total CPI | .01 | .12 |
- Sample includes prediction errors for all forecasters with projections published from 1986 to 2006.
- Excludes CBO annual-average unemployment rate forecasts.
| Projection Period Year: Current | Projection Period Year: Second | Projection Period Year: Third | Projection Period Year: Fourth | |
|---|---|---|---|---|
| Winter projections, Real GDP: 1986 to 2006 sample | 1.19 | 1.37 | 1.40 | 1.48 |
| Winter projections, Real GDP: 1991 to 2006 sample | 1.21 | 1.34 | 1.24 | 1.28 |
| Winter projections, Real GDP: 1986 to 2000 sample | 1.27 | 1.55 | 1.56 | 1.59 |
| Winter projections, Unemployment rate: 1986 to 2006 sample | 0.481 | 0.80 | 1.03 | 1.06 |
| Winter projections, Unemployment rate: 1991 to 2006 sample | 0.481 | 0.78 | 0.94 | 0.95 |
| Winter projections, Unemployment rate: 1986 to 2000 sample | 0.491 | 0.85 | 1.09 | 1.14 |
| Winter projections, Total CPI: 1986 to 2006 sample | 0.99 | 0.96 | 0.92 | 1.01 |
| Winter projections, Total CPI: 1991 to 2006 sample | 0.83 | 0.94 | 0.83 | 0.85 |
| Winter projections, Total CPI: 1986 to 2000 sample | 0.95 | 0.87 | 0.92 | 1.05 |
| Summer projections, Real GDP: 1986 to 2006 sample | 0.88 | 1.31 | 1.42 | 1.43 |
| Summer projections, Real GDP: 1991 to 2006 sample | 0.88 | 1.33 | 1.28 | 1.28 |
| Summer projections, Real GDP: 1986 to 2000 sample | 0.88 | 1.49 | 1.58 | 1.54 |
| Summer projections, Unemployment rate: 1986 to 2006 sample | 0.291 | 0.71 | 0.99 | 1.10 |
| Summer projections, Unemployment rate: 1991 to 2006 sample | 0.301 | 0.70 | 0.92 | 1.03 |
| Summer projections, Unemployment rate: 1986 to 2000 sample | 0.271 | 0.76 | 1.06 | 1.18 |
| Summer projections, Total CPI: 1986 to 2006 sample | 0.57 | 0.98 | 0.95 | 0.99 |
| Summer projections, Total CPI: 1991 to 2006 sample | 0.53 | 0.94 | 0.89 | 0.87 |
| Summer projections, Total CPI: 1986 to 2000 sample | 0.48 | 0.91 | 0.94 | 1.02 |
- Excludes CBO annual-average unemployment rate forecasts.
| Projection Period Year: Current | Projection Period Year: Second | Projection Period Year: Third | Projection Period Year: Fourth | |
|---|---|---|---|---|
| Winter projections, Real GDP (Q4-over-Q4 percent change): Average historical root mean squared error | 1.19 | 1.37 | 1.40 | 1.48 |
| Winter projections, Real GDP (Q4-over-Q4 percent change): Model estimate of forecast standard error | 1.13 | 1.35 | 1.61 | 1.64 |
| Winter projections, Unemployment rate (Q4 average): Average historical root mean squared error | 0.482 | 0.80 | 1.03 | 1.06 |
| Winter projections, Unemployment rate (Q4 average): Model estimate of forecast standard error | 0.32 | 0.59 | 0.70 | 0.78 |
| Winter projections, Total CPI (Q4-over-Q4 percent change): Average historical root mean squared error | 0.99 | 0.96 | 0.92 | 1.01 |
| Winter projections, Total CPI (Q4-over-Q4 percent change): Model estimate of forecast standard error | 0.94 | 1.00 | 1.07 | 1.11 |
| Summer projections, Real GDP (Q4-over-Q4 percent change): Average historical root mean squared error | 0.88 | 1.31 | 1.42 | 1.43 |
| Summer projections, Real GDP (Q4-over-Q4 percent change): Model estimate of forecast standard error | 0.81 | 1.29 | 1.54 | 1.58 |
| Summer projections, Unemployment rate (Q4 average): Average historical root mean squared error | 0.292 | 0.71 | 0.99 | 1.10 |
| Summer projections, Unemployment rate (Q4 average): Model estimate of forecast standard error | 0.20 | 0.46 | 0.61 | 0.74 |
| Summer projections, Total CPI (Q4-over-Q4 percent change): Average historical root mean squared error | 0.57 | 0.98 | 0.95 | 0.99 |
| Summer projections, Total CPI (Q4-over-Q4 percent change): Model estimate of forecast standard error | 0.63 | 0.96 | 1.05 | 1.08 |
| Addenda: model estimates of PCE price forecast standard errors, Total (Q4-over-Q4 percent change): Winter | 0.75 | 0.84 | 0.91 | 0.95 |
| Addenda: model estimates of PCE price forecast standard errors, Total (Q4-over-Q4 percent change): Summer | 0.50 | 0.80 | 0.88 | 0.92 |
| Addenda: model estimates of PCE price forecast standard errors, Core (Q4-over-Q4 percent change): Winter | 0.44 | 0.62 | 0.71 | 0.76 |
| Addenda: model estimates of PCE price forecast standard errors, Core (Q4-over-Q4 percent change): Summer | 0.27 | 0.56 | 0.68 | 0.72 |
- Model estimates based on 5000 stochastic simulations of the FRB/US model, with shocks drawn from the 1986-2006 set of model equation residuals.
- Excludes CBO annual-average unemployment rate forecasts.
| 2007 | 2008 | 2009 | 2010 | |
|---|---|---|---|---|
| CBO forecast (Summer 2007): Real GDP1 | 2.2 | 3.0 | 3.2 | 3.2 |
| CBO forecast (Summer 2007): Unemployment rate2 | 4.63 | 4.7 | 4.8 | 4.8 |
| CBO forecast (Summer 2007): Total CPI1 | 3.6 | 2.1 | 2.2 | 2.2 |
| Average historical root mean squared error3: Real GDP1 | 0.9 | 1.3 | 1.4 | 1.4 |
| Average historical root mean squared error3: Unemployment rate2 | 0.3 | 0.7 | 1.0 | 1.1 |
| Average historical root mean squared error3: Total consumer prices1 | 0.6 | 1.0 | 1.0 | 1.0 |
| Likely range for actual economic outcomes
(approximately 70 percent odds): Real GDP1 |
1.3 to 3.1 | 1.7 to 4.3 | 1.8 to 4.6 | 1.8 to 4.6 |
| Likely range for actual economic outcomes
(approximately 70 percent odds): Unemployment rate2 |
4.3 to 4.9 | 4.0 to 5.4 | 3.8 to 5.8 | 3.8 to 5.8 |
| Likely range for actual economic outcomes
(approximately 70 percent odds): Total consumer prices1 |
3.0 to 4.2 | 1.1 to 3.1 | 1.2 to 3.2 | 1.2 to 3.2 |
- Q4-over-Q4 percent changes for 2007 and 2008, and calendar-year-over-calendar-year percent changes for 2009 and 2010.
- Fourth-quarter average for 2007 and annual averages for 2008 through 2010.
- Projected value for the fourth quarter of 2007 inferred from projected annual value in 2007 and 2008.
Average Root Mean Squared Forecast Errors
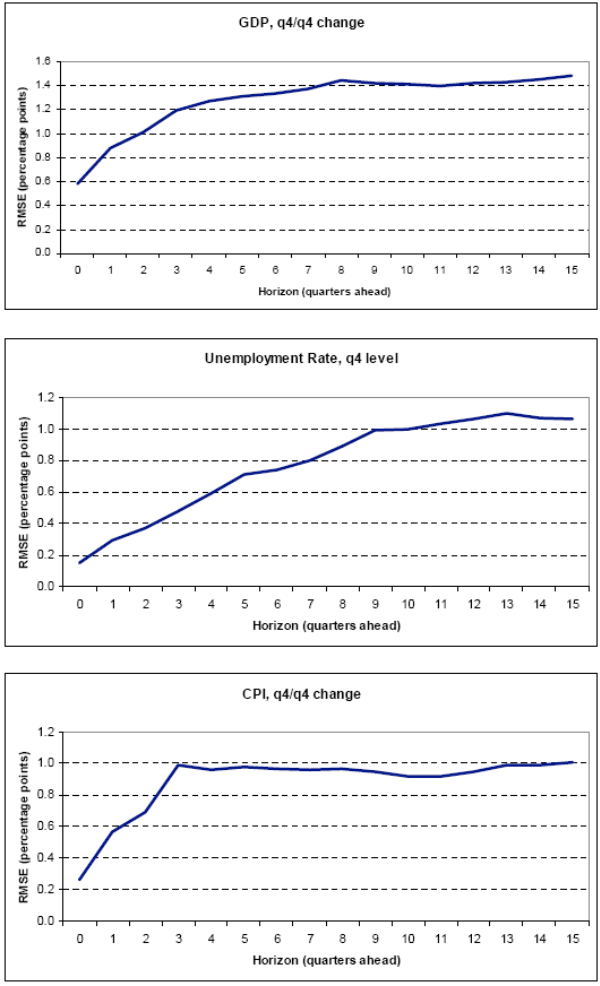
Note: The forecast horizon extends from the forecast made in the fourth quarter (the autumn release) of current year conditions, to the forecast made in the first quarter (the winter release) of developments fifteen quarters ahead.
Winter Projection Errors -- Actual Distribution Vs. Normal Density
(shaded area equals zero plus or minus average root mean squared error)
Summer Projection Errors -- Actual Distribution Vs. Normal Density
(shaded area equals zero plus or minus average root mean squared error)
Greenbook Inflation RMSEs, 1986-2006
(All 4-quarter changes; different measures)
 Notes:
- The CPI forecast errors used to generate this figure differ from those used to generate the results shown in Table 4 (and elsewhere in the paper) in two ways. First, the errors in this figure are generated using all eight Greenbook forecasts produced each year, rather than just the January, May, June and October forecasts. Second, the errors shown here are based on all four-quarter forecasts (that is, the q1-over-q1, q2-over-q2, q3-over-q3, and q4-over-q4 forecasts), and not just the q4-over-q4 forecasts.
- The forecasts of the staff of the Federal Reserve Board of Governors are referred to as "Greenbook" forecasts as shorthand. In fact, forecasts of total and core PCE prices have only been included in the Greenbook since 2000; earlier forecasts are taken from unpublished Federal Reserve archives.