
Does the NEA Crowd Out Private
Charitable Contributions to the Arts?
Keywords: Crowding out, Charitable contributions, Public goods
Abstract:
In this paper, I extend a theoretical model of the crowding out hypothesis, whereby government contributions to a public good displace private giving, in order to illustrate how dollar-for-dollar crowding out is possible even when individuals regard their own contributions and government grants as imperfect substitutes. I estimate that private charitable contributions to arts organizations increased by 60 cents to a dollar due to a major funding cut to the National Endowment for the Arts (NEA) during the mid-1990s. These increases, however, also coincided with, on average, a 25 cent increase in fund-raising expenditures by arts organizations for every dollar decrease in government grants. The estimate of crowding out found in this paper is large, particularly for a study using a micro-data set. I argue that an appropriate interpretation of an estimate of a crowding out parameter, in general, depends crucially on the context.
JEL Codes: D120, D210, H110, H400, H490
1 Introduction
This paper investigates the mechanism by which the federal government's funding of the arts through National Endowment for the Arts (NEA) displaces private charitable contributions to non-profit arts organizations. Government funding of the arts has incited contentious political debates since the creation of the NEA in 1965. Conservatives argue that arts organizations attract enough non-government support to continue operating without federal aid, and that the NEA discourages private, charitable gifts to the arts. Artists, musicians, and their affiliated organizations, on the other hand, often decry the shortage of funds, the financial struggles in raising revenue, and the difficulty of meeting their operating costs and so welcome the NEA. This particular policy debate is one instance of the debate over the government's ability to increase the supply of a public good. It has been of interest to economists because of the crowding out hypothesis, whereby a dollar spent by the government crowds out a dollar of private spending on the public good. Embedded in the framework of the crowding out hypothesis are conjectures about the role that the government should play in providing public goods, be it through lump-sum taxes, proportional taxation, or subsidies to private giving. Gauging the efficacy of the government in affecting the supply of a public good through these distributive functions is an important policy tool. In addition, trying to understand the human motives for giving sheds light on the relationship between individuals and the government.
The arts provide an important setting to study crowding out because their production coincides with that of both private and public goods. With a few textbook exceptions, most goods provided by the government confer both public and private benefits. The activity of arts organizations constitutes a public good because they are the conduits through which the NEA seeks its goal of "enrich[ing] our Nation and its diverse cultural heritage [through] supporting works of artistic excellence, advancing learning in the arts, and strengthening the arts in communities throughout the country" (National Endowment for the Arts, 2003). To the extent that arts organizations contribute to the national cultural ethos, their activities comprise a public good. On the other hand, many arts activities are excludable and rival. For example, ticket sales and/or congestion at an art museum may prevent some museum-goers from seeing the pieces they had hoped to see.
Another reason why the arts provide an important setting is that arts organizations are not the passive recipients of private and government contributions. Rather, they willfully and actively raise funds, the intensity of which can be influenced by their receipt of government grants. The response of private donors is thus a composite of a pure crowding out effect and an effect attributable to fund-raising. With larger government grants, individuals may decrease their contributions because government funding is substitutable (to varying degrees) for their own. They may also indirectly decrease if larger government grants crowd out fund-raising expenditures. For both economic theory and public policy, estimating the total effect of government grants on private contributions, inclusive of the effect of fund-raising, as well as the pure crowding out effect is informative.
This paper presents a model of crowding out that takes into account the public and private characteristics of arts activities, as well as the effects of fund-raising. The theoretical model decomposes the effect of government grants into a pure crowding out effect and an effect transmitted through the fund-raising responses of arts organizations. In the empirical analysis, I exploit variation in government grants induced by the surprise Republican victory during 1994 mid-term Congressional election in order to obtain estimates of the effect of government grants on both fund-raising and private contributions to arts non-profits. The Republican-controlled Congress reduced the appropriation to the NEA by 40% subsequent to their victory. To preview the results, I find that private charitable contributions to arts organizations increased by 60 cents to a dollar for every dollar decrease in government grants. There was also a concomitant 25 cent increase in fund-raising expenses when the NEA experienced its budget cuts. In the Results section, I discuss the implications of these findings for the magnitude of the pure crowding out effect.
The remainder of the paper is organized as follows: Section II outlines the consensus views on crowding out while Section III presents a theoretical model relating private donations, government contributions, fund-raising, and the equilibrium supply of the public good. Sections IV through VI present the econometric model, data, and findings, respectively. Finally, Section VII concludes, draws the implications for policy, and suggests possible avenues for further research.
2 Previous Research
Estimating the extent of crowding out is important for two main reasons. First, the magnitude of crowding out is an indicator of the government's ability to effectuate an increase in the supply of a public good. To the extent that taxation is costly and if crowding out is dollar-for-dollar, it is pareto-improving for society to rely on the private provision of public goods. Second, the U.S. tax code subsidizes charitable giving, and the optimal subsidy rate on a charitable good depends positively on the magnitude of crowding out (Andreoni, 1990; Saez, 2003).
Previous scholarship on the crowding out hypothesis has centered around the government's ability to provide public goods, along with individuals' motivations for giving, and has moved in the direction of concluding that government funds partially crowd out private donations. Though earlier theoretical and empirical work (Roberts, 1984; Andreoni, 1990,Kingma, 1989; Payne, 1998) questions this perspective based on improved empirical methods and data. An interpretation of the earlier, complete crowd-out literature was that the government's role in providing public goods was quite limited. The more recent, empirical studies primarily map out causal relationships between government and individual donations (Payne, 1998), and test alternative theories of giving (Andreoni, 1993). These studies lead the reader into inferring that the government need not be ineffective at increasing the supply of a public good because individuals, for whatever reason, do not treat their own and government donations as perfect substitutes. Crowding out is thus partial, and its magnitude suggests that the government is not entirely ineffective at regulating the supply of a public good.
In addition to this general literature on the crowding out of public goods, some recent studies examine the relationship between the NEA and private giving in the arts sector (Smith, 2003; Borgonovi and O'Hare, 2004). Taken together, these studies put forth that government grants to arts organizations leverage, or "crowd in," private donations due to the prestige in and the signalling value of an NEA grant.1 This paper departs from Brooks (2000), Smith (2003), and Borgonovi and O'Hare (2004), and contributes to the literature, in four major ways. First, by explicitly developing an economic model of private contributions to a public good, I show how dollar-for-dollar crowding out is possible even when individuals regard their own contributions and government grants as imperfect substitutes. Earlier research estimating the effect of the NEA does not develop a theoretical framework to explain the possible mechanisms by which crowding out or "crowding in" occurs. These distinctions are important, however, to inform policies about government spending on a public good and about the optimal subsidy rate on private contributions to a public good.
Second, as discussed in further detail below, I rely on a natural experiment to disentangle the simultaneity between government grants and private contributions to arts organizations. Though earlier work recognizes the importance of doing so, their empirical methodologies do not address that unobserved factors, such as an arts organization's quality, are likely to induce a spurious positive correlation between government grants and private contributions (Smith, 2003; Borgonovi and O'Hare, 2004). Not surprisingly, these earlier studies find that the NEA leverages private donations, a result that may in fact be due to quality affecting both government grants and private contributions. Hence these earlier studies do not answer the causal question of whether the NEA crowds out charitable contributions to the arts.
Third, I use micro-level data on a panel of arts organizations across all disciplines that file an IRS Form 990 in fiscal years 1995 and 1996. Earlier research estimates the effect of the NEA using particular arts organizations, such as orchestras or dance companies (Brooks, 2000; Borgonovi and O'Hare, 2004). As I discuss in greater detail below, accurately estimating crowding out entails studying the relationship between government grants and private contributions for the same public good, which is accomplished using a panel of arts organizations. In addition, relating aggregate measures of private contributions to aggregate levels of government grants can be deceptive if the composition of arts organizations or their activities varies over time, as would be the case with in the time-series data in Borgonovi and O'Hare (2004).
Finally, as Andreoni and Payne (2003) emphasize, charitable fund-raising activities may add another dimension to the crowding out narrative in that decreased fund-raising efforts, rather than purely a direct behavioral response by individuals, may contribute to the estimates of crowding out. Although they find a non-trivial behavioral response by fund-raisers, their study does not empirically disaggregate the effect of government grants on individual donations into the direct, crowding out effect and the indirect effect through lower fund-raising. This paper contributes to the crowding out literature by beginning to disaggregate these effects.2 I separately estimate the effect of government grants on private contributions and fund-raising. This disaggregation helps us identify the mechanisms through which crowding out occurs. With these results, I infer the magnitude of the direct crowding out effect for the last dollar donated.
3 Theoretical Model
This section develops a theoretical model to decompose the effect of government grants on private contributions into a pure crowding out effect and an indirect fund-raising effect. In this model, the government contributes to a public good through lump-sump taxation, an arts organization maximizes net revenue, and individuals contribute to a public good.3 Individuals maximize a utility function, and the government, through its choice of lump-sum taxes, also contributes to the public good. The following model borrows heavily from Andreoni's (1990) model of impure altruism, which is a special case of the joint production model of Cornes and Sandler (1984). Here, the government moves first, and is followed by the non-profit arts organization and individuals. The arts organization chooses a fund-raising effort level to maximize the revenue it receives from individuals and the government. Individuals choose their contributions to the public good to maximize their utility.
Suppose individuals can purchase a private good (![]() ) and contribute to a public good (
) and contribute to a public good (![]() ), such as arts activity. Contributions to the public good are measured in dollars. The aggregate supply of the public good is
), such as arts activity. Contributions to the public good are measured in dollars. The aggregate supply of the public good is
![]() , where
, where ![]() denotes the lump-sum
taxes the government collects to finance the public good.4 In other words, the level of the public good is the sum of the private and public contributions,
measured in dollars. Each individual's utility function is:
denotes the lump-sum
taxes the government collects to finance the public good.4 In other words, the level of the public good is the sum of the private and public contributions,
measured in dollars. Each individual's utility function is:
The function
That individuals obtain utility from the size of their donations represents the private benefit from making a donation to a non-profit organization.5 By making a donation, individuals obtain a private good, like the "warm glow" from giving (Andreoni, 1990), the prestige associated with making a donation, or special privileges from the organization, and they contribute to the production of a public good. This "warm glow" from giving operates through the third argument of the utility function in (1).
Letting
![]() denote individual
denote individual ![]() 's effective net contribution to the
public good and letting
's effective net contribution to the
public good and letting
![]() denote the net contributions of everyone but individual
denote the net contributions of everyone but individual ![]() , we can
rewrite the utility function as:
, we can
rewrite the utility function as:
| (3) |
In the ensuing discussion, I assume an interior solution.
As in Bergstrom, Blume, and Varian (1986), the function ![]() is individual
is individual ![]() 's demand function for the public good as a function of the exogenous parameters. The exogenous parameters for individual
's demand function for the public good as a function of the exogenous parameters. The exogenous parameters for individual ![]() include his/her income, other individuals'
contributions, taxes, and the cost of donating to the public good, which is determined by the level of fund-raising effort. Let
include his/her income, other individuals'
contributions, taxes, and the cost of donating to the public good, which is determined by the level of fund-raising effort. Let ![]() and
and ![]() denote the partial derivatives of (4) with respect to the first and second arguments respectively. As others have noted,
denote the partial derivatives of (4) with respect to the first and second arguments respectively. As others have noted, ![]() and
and ![]() if the public good is normal. Intuitively,
if the public good is normal. Intuitively, ![]() because an increase in the donations of other individuals is like having more income.6 Researchers in this literature term
because an increase in the donations of other individuals is like having more income.6 Researchers in this literature term
![]() the propensity to contribute to the public good for altruistic reasons (Andreoni,
1990; Ribar and Wilhelm, 2002). The partial derivative
the propensity to contribute to the public good for altruistic reasons (Andreoni,
1990; Ribar and Wilhelm, 2002). The partial derivative ![]() is
the "warm glow" effect on an individual's demand for the public good, and it arises because government grants are not a perfect substitute for an individual's contributions. Researchers also term
is
the "warm glow" effect on an individual's demand for the public good, and it arises because government grants are not a perfect substitute for an individual's contributions. Researchers also term ![]() as the egoistic propensity to donate to the public good. If
as the egoistic propensity to donate to the public good. If ![]() , individuals do not donate for "warm glow"-related or egoistic reasons.
, individuals do not donate for "warm glow"-related or egoistic reasons.
Higher levels of fund-raising can increase an individual's demand for the public good, as well as the equilibrium level of the public good, by lowering the price of donating. Let ![]() denote the partial derivative of (4) with respect to the third argument,
denote the partial derivative of (4) with respect to the third argument, ![]() . As Andreoni (1990) notes,
. As Andreoni (1990) notes, ![]() . The effect of an uncompensated change in
. The effect of an uncompensated change in ![]() is:
is:
Taking account of this expression for ![]() , the non-profit organization's objective is to maximize net revenues:
, the non-profit organization's objective is to maximize net revenues:
Three phenomena are associated with this first-order condition. First, in the case where the price effect is positive, firms choose not to fund-raise. Second, higher effort corresponds to a lower "price" of giving, which increases individuals' donations to the public good according to income and substitution effects. The marginal benefit of fund-raising is thus the additional donations to the non-profit organization through lower informational or transactional costs. The term
3.1 Effect of Government Grants on Fund-raising
At this point, it is helpful to know the sign of
![]() , which is the fund-raising response of the organization when the government changes its contribution to the public good. If the level of fund-raising effort
decreases with higher government grants, this reduction has a negative effect on individual donations to the public good. Fund-raising effort decreases with higher government funding when the latter lowers the marginal benefit of fund-raising. In other words, a given level of fund-raising becomes
less effective with larger government grants, which are financed by higher lump-sum taxes in this model.
, which is the fund-raising response of the organization when the government changes its contribution to the public good. If the level of fund-raising effort
decreases with higher government grants, this reduction has a negative effect on individual donations to the public good. Fund-raising effort decreases with higher government funding when the latter lowers the marginal benefit of fund-raising. In other words, a given level of fund-raising becomes
less effective with larger government grants, which are financed by higher lump-sum taxes in this model.
Formally showing that
![]() requires that:
requires that:
where
Intuitively, suppose the organization is optimally fund-raising, and the government increases taxes on one individual. If the organization maintains the same level of fund-raising, the marginal benefit is lower with larger government grants. For higher levels of the public good, the marginal effectiveness of fund-raising is lower because at higher levels of taxation, at which total spending on the public good is higher, the non-profit organization is less able to raise additional revenues by lowering the cost of donating. The marginal cost of additional fund-raising remains the same regardless of the level of government grants. Greater government grants thus correspond to a lower than otherwise marginal benefit of additional fund-raising, and the organization is better off in terms of maximizing its net revenues by decreasing its fund-raising efforts.
3.2 Effect of Government Grants on Private Contributions
In addition to affecting fund-raising, a change in government grants also results in a direct effect on individuals' contributions to the public good. When the government increases spending on a public good, individuals respond through two mechanisms: direct crowding out and changes in
fund-raising effort leading to higher donation costs. Intuitively, the extent of the direct response will depend on how substitutable government grants are for individuals' contributions. It is possible to describe the total change in an individual's contribution to the public good as:
| (9) |
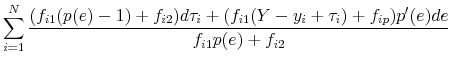
The effect on total contributions of a change in government grants is:10
![\displaystyle \left [ 1+ \sum_{i=1}^{N} \frac{1 - f_{i1}p(e) - f_{i2}}{f_{i1}p(e) + f_{i2}} \right]^{-1} *](img60.gif)
where
The sign of ![]() in (10) is ambiguous. One the one hand, larger government grants can increase total individual contributions (
in (10) is ambiguous. One the one hand, larger government grants can increase total individual contributions (
![]() ). On the other hand, they also lower fund-raising effort, which in turn increases the cost of individuals' donations. If the second effect is large enough, it is
possible for the supply of the public good to fall with higher government grants. If the expression in (10) were equal to zero, it means that government grants fully crowd out individual contributions, and the government cannot increase the supply of the public good. The
multiplicative term on the right-hand side of (10),
). On the other hand, they also lower fund-raising effort, which in turn increases the cost of individuals' donations. If the second effect is large enough, it is
possible for the supply of the public good to fall with higher government grants. If the expression in (10) were equal to zero, it means that government grants fully crowd out individual contributions, and the government cannot increase the supply of the public good. The
multiplicative term on the right-hand side of (10),
![\left [ 1 + \sum_{i=1}^{N} \frac {1 - f_{i1}p(e) - f_{i2}}{f_{i1}p(e) + f_{i2}} \right ] ^{-1}](img64.gif) , is positive and less than one when the consumption good and the public good are normal with
respect to other individuals' contributions.
, is positive and less than one when the consumption good and the public good are normal with
respect to other individuals' contributions.
The first additive term on the right-hand side of (10),
![]() , is the direct effect of government grants on the level of the public good, and it is positive. Given the
assumptions of the model, it is straightforward to show that
, is the direct effect of government grants on the level of the public good, and it is positive. Given the
assumptions of the model, it is straightforward to show that
![]() is both positive and less than one.11 This term attenuates the pure crowding out effect of government grants by considering how egoistic an individual is as well as whether the private or public sector is able to provide the public good at a lower cost.12 Note that in the case where individuals are purely altruistic (as in Bergstrom, et. al.), crowding out is not dollar-for-dollar as long as the private and public
sectors face different costs of supplying the public good.
is both positive and less than one.11 This term attenuates the pure crowding out effect of government grants by considering how egoistic an individual is as well as whether the private or public sector is able to provide the public good at a lower cost.12 Note that in the case where individuals are purely altruistic (as in Bergstrom, et. al.), crowding out is not dollar-for-dollar as long as the private and public
sectors face different costs of supplying the public good.
Among other things, the presence of fund-raising leaves open the possibility that the direct effect of government grants on the level of the public good is zero or negative, despite the presence of "warm glow." The intuition for this result is straightforward; recall that without fund-raising, an individual prefers contributing a dollar to the public good through his/her own donation than through taxes because the latter do not yield any warm glow benefits. Government grants need not perfectly crowd out individuals' donations since individuals lose the warm glow benefits if they lower their contributions by the amount of the government grant. Fund-raising lowers the cost of donating to the public good, and subsequently giving for altruistic reasons becomes relatively less attractive. If this effect is large enough, then the presence of fund-raising may result in additional crowding out (relative to the no fund-raising scenario) by de-emphasizing the altruistic reason to give.
The second additive term on the right-hand side of (10),
![]() , is the indirect effect of fund-raising, which is negative. When the government
increases its grants, the organization lowers its level of fund-raising effort and thereby increases the cost of making a contribution.13 Equation (10) implies that when taxes each individual by a dollar, his/her out-of-pocket contribution (
, is the indirect effect of fund-raising, which is negative. When the government
increases its grants, the organization lowers its level of fund-raising effort and thereby increases the cost of making a contribution.13 Equation (10) implies that when taxes each individual by a dollar, his/her out-of-pocket contribution (![]() ) need not fall by a dollar, holding the level of fund-raising fixed. These
predictions result from the nature of the utility function (1), which is a function of the total supply of the public good as well as one's own donation.
) need not fall by a dollar, holding the level of fund-raising fixed. These
predictions result from the nature of the utility function (1), which is a function of the total supply of the public good as well as one's own donation.
To summarize, without fund-raising in this model, crowding out is partial because of individuals' "warm glow" benefits from contributing, and the government can increase the supply of the public good with government grants Andreoni (1990). This model however suggests that the presence of fund-raising can revive the traditional perfect crowding out hypothesis through two mechanisms. First, by lowering the "cost" of donating, fund-raising lowers the altruistic propensity to donate. This means that even when individuals derive "warm glow" benefits from donating, dollar-for-dollar crowding out is possible. Second, an organization fund-raises less in the face of higher government grants. This behavioral response in turn increases the "cost" of making a private contribution, and reduces individuals' out-of-pocket contributions. Depending on whether the "warm glow" effect or the fund-raising effect dominates, it is theoretically possible to observe a wide range of outcomes, from the extreme crowding out of private contributions to very little crowding out. The next three sections explore these possibilities with an econometric model, and discuss the empirical issues arising in estimating the relationship between private contributions and government grants in the context of the NEA.
4 Empirical Specification
In this section, I recast the theoretical results in a framework suitable for estimation. The following equations relate the effect of government grants on private contributions and fund-raising:
where
Two methodological reasons motivate this framework of examining changes in donations and fund-raising expenses vis-a-vis changes in government grants to both identify and interpret ![]() and
and ![]() . First and foremost, identifying exogenous variation in government grants is difficult, particularly in the case of
arts non-profits, because unobserved factors, such as an organization's quality, influence its receipt of both private donations and government grants. In this particular case,
. First and foremost, identifying exogenous variation in government grants is difficult, particularly in the case of
arts non-profits, because unobserved factors, such as an organization's quality, influence its receipt of both private donations and government grants. In this particular case, ![]() in
Equation (11) would be biased upward with higher quality organizations receiving more government grants and private contributions. Relating changes in private contributions to changes in government grants circumvents this "quality bias" since the effect of government grants
is identified off of the organization-specific variation. In fact, this approach controls for all unobserved but time-invariant characteristics of an organization that affect its receipt of government grants and private contributions.14
in
Equation (11) would be biased upward with higher quality organizations receiving more government grants and private contributions. Relating changes in private contributions to changes in government grants circumvents this "quality bias" since the effect of government grants
is identified off of the organization-specific variation. In fact, this approach controls for all unobserved but time-invariant characteristics of an organization that affect its receipt of government grants and private contributions.14
Second, to relate private donations to government grants for the same public good, the unit of observation is the organization in Equation (11). This detail is important because it enables us to identify crowding out rather than a spurious correlation between government grants and private contributions that stems from individuals' substitution of government provided goods for privately provided ones (Kingma 1989). For example, suppose that orchestra performances are privately funded while opera concerts are publicly funded. If these two events comprise all arts activities and they are somewhat substitutable for one another, an increase in the government's funding of opera concerts may result in less funding of orchestra performances, and thus less private spending on arts activities. This phenomenon does not represent crowding out as much as substitution of opera concerts for orchestra performances. Earlier studies of crowding out that related government grants to private donations for different public goods were likely to find large estimates because they were unable to distinguish between true crowding out and changes in private giving due to substitution of the public good financed by private giving for the good financed by government spending (Roberts, 1984).
The standard estimation technique in this literature entails using an instrumental variable for government grants. Some instrumental variables for government grants to non-profit organizations include government transfers to individuals and transfers to non-profits measured at the state level, as well as mean personal income in a non-profit's region (Kingma, 1989; Payne, 1998). With all of these instruments, it is possible to mis-state the significance of government grants because the instruments could have independent effects on private donations or fund-raising. For instance, transfer payments to individuals are an automatic stabilizer, so when personal income experiences negative shocks, this instrument is likely to have a negative relationship with private contributions, independent of the mechanism through government grants. In this case, one may find partial crowding out even if the true relationship is one of perfect crowding out.
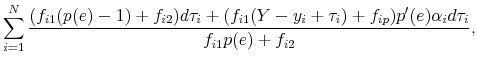
Rather than try to avoid the pitfalls of instrumental variables estimation, I exploit the variation in government grants induced by the surprise Republican victory during the 1994 mid-term election. Between government fiscal years (FY) 1995 and 1996, the Congressional appropriation to the NEA decreased by 40% from $188 million to $112 million (in 2000 dollars) via H.R. 1557. Although the NEA had been in a precarious situation since 1989, with a Congressional debate to abolish the endowment, the secular decreases in the Congressional appropriation of the early 1990s pale in comparison to the sharp decrease in FY 1996 (see Figure (1).15
Careful examination of the changes in the NEA's grant-making process during this period suggests that the difference in an organization's grant award between FY 1995 and FY 1996 can be treated as exogenous event. H.R. 1557 not only reduced the overall NEA budget, it also coincided with new rules governing the receipt of grants, including the maximum grant award amount, an organization's eligibility status, and the kinds of projects allowed to be funded. When these changes were announced, arts organizations had already submitted their grant applications under the presumption that the FY 1995 rules would govern the NEA's grant-making decisions. They were thus unable to react to the new guidelines by altering their applications or making the projects seeking funding more amenable to the new rules. Based on these new guidelines, 93% of arts organizations receiving funding in FY 1995 experienced reductions in their funding in FY 1996, with the average decrease being around 60% for this group.16 About one percent of organizations not receiving NEA funding in FY 1995 got it in FY 1996. By and large, the ramifications of the Congressional reduction in the NEA appropriation were both drastic and felt across many types of arts organizations.
This identification strategy has two attractive features with empirically testable implications. First, if indeed the change in an organization's grant award between FY 1995 and 1996 is akin to an exogenous event, organizations experiencing smaller and larger changes in their grant awards should be similar in terms of their observable (predetermined) characteristics. While finding similarities does not prove the exogeneity of the change in the grant award, it certainly makes it more plausible.
The second attractive feature of the identification strategy is that it is possible to control for the unobserved factors affecting in private contributions and fund-raising that are unrelated to the changes in grant awards between FY 1995 and 1996. These factors may include underlying time trends in private contributions and fund-raising, or supply/demand-related factors affecting arts organizations as a whole, such as changes in the macroeconomic environment. Among arts organizations, those that do not receive government grants but experience changes in private contributions or fund-raising expenses provide a counterfactual for what would have happened in the absence of a reduction in government grants.17
In this econometric model, it is possible to consistently estimate ![]() and
and ![]() , which in the context of the theoretical model, represent the total effect of government grants on private contributions and its effect on fund-raising, respectively. It is also useful to know the pure crowding out effect, which holds the level of fund-raising fixed.
Ascertaining this pure effect, however, requires having a variable that affects government grants but not fund-raising or private contributions. Having such a variable would allow for an estimate of the pure crowding out effect that holds constant the level of fund-raising.18 Due to the difficulty of finding such a variable, I instead estimate the effect of government grants on private contributions net of the
cost of raising these funds:
, which in the context of the theoretical model, represent the total effect of government grants on private contributions and its effect on fund-raising, respectively. It is also useful to know the pure crowding out effect, which holds the level of fund-raising fixed.
Ascertaining this pure effect, however, requires having a variable that affects government grants but not fund-raising or private contributions. Having such a variable would allow for an estimate of the pure crowding out effect that holds constant the level of fund-raising.18 Due to the difficulty of finding such a variable, I instead estimate the effect of government grants on private contributions net of the
cost of raising these funds:
The specification in (13) has two interpretations. The first and more obvious one is that the parameter ![]() tells us how much money an organization is able
to collect, net of the fund-raising costs, upon experiencing a dollar reduction in government grants. However, we do not know whether fund-raising is responsible for all of the response in an organization's donations or just a fraction of it from the specification in (11). The
second interpretation is that
tells us how much money an organization is able
to collect, net of the fund-raising costs, upon experiencing a dollar reduction in government grants. However, we do not know whether fund-raising is responsible for all of the response in an organization's donations or just a fraction of it from the specification in (11). The
second interpretation is that ![]() tells us the effect of government grants on private contributions for the last dollar donated if organizations fund-raise up to the point where a
dollar of fund-raising expenditures brings in a dollar of private donations. The parameter
tells us the effect of government grants on private contributions for the last dollar donated if organizations fund-raise up to the point where a
dollar of fund-raising expenditures brings in a dollar of private donations. The parameter ![]() tells us the total response of private donations to changes in government grants while
tells us the total response of private donations to changes in government grants while
![]() gives the fund-raising response to a change in government grants. Taken together, if organizations fund-raise to the point where a dollar of fund-raising yields a dollar of private
contributions, a dollar increase in government grants results in a
gives the fund-raising response to a change in government grants. Taken together, if organizations fund-raise to the point where a dollar of fund-raising yields a dollar of private
contributions, a dollar increase in government grants results in a
![]() change in private giving, and this parameter nets out the effect of fund-raising for the last dollar contributed. This last assumption is a strong one,
particularly in light of the theoretical model presented, however it provides a useful benchmark. If, on average, a dollar of fund-raising returns more than a dollar of private contributions, estimating
change in private giving, and this parameter nets out the effect of fund-raising for the last dollar contributed. This last assumption is a strong one,
particularly in light of the theoretical model presented, however it provides a useful benchmark. If, on average, a dollar of fund-raising returns more than a dollar of private contributions, estimating ![]() in equation (13) yields an upper bound (in absolute value) on the estimate of the pure crowding out effect of government grants.
in equation (13) yields an upper bound (in absolute value) on the estimate of the pure crowding out effect of government grants.
One possible threat to the validity of using the change in government grants between FY 1995 and 1996 rests in the timing of the reduction in the Congressional appropriation to the NEA, and whether these cuts were anticipated by arts organizations and the donating public. Although the 1994
mid-term Republican victory was a relative surprise, roughly nine months had lapsed before Congress officially reduced the NEA budget for FY 1996, during which arts organizations could have sought private contributions. This added fund-raising effort by arts organizations would then be a response
to the threat of funding cuts rather than to a reduction in government grants per se, and the estimate of ![]() in Equation
(12) would be biased downward. Fortunately for this study, Congressional threats to lower or eliminate NEA funding date back to the late 1980's and the artistic controversies incited by Robert Mapplethorpe and the like (Anonymous, 1989). Due to
the overall uncertainty of the fate of the NEA prior to the mid-term election, the surprise Republican victory, though contributing to the sense of precariousness, may have had a small marginal impact. In fact, the heightened awareness of the NEA's grant-making abilities shortly after the mid-term
election not only differs from the minimal public attention devoted to the Congressional appropriations to the NEA in prior years, it provides ample opportunity for a donor response.
in Equation
(12) would be biased downward. Fortunately for this study, Congressional threats to lower or eliminate NEA funding date back to the late 1980's and the artistic controversies incited by Robert Mapplethorpe and the like (Anonymous, 1989). Due to
the overall uncertainty of the fate of the NEA prior to the mid-term election, the surprise Republican victory, though contributing to the sense of precariousness, may have had a small marginal impact. In fact, the heightened awareness of the NEA's grant-making abilities shortly after the mid-term
election not only differs from the minimal public attention devoted to the Congressional appropriations to the NEA in prior years, it provides ample opportunity for a donor response.
5 Data
The primary source of data is from the Urban Institute's National Center for Charitable Statistics (NCCS) IRS 990 Core Files, which contain the financial data for organizations filing an IRS Form 990, for fiscal years (FY) 1990 through 1998. The data consist of arts organizations as identified by the National Taxonomy of Exempt Entities (NTEE).19 In FY 1995 and 1996, there were 17,472 and 19,244 arts organizations, respectively, that filed an IRS 990.
One particular challenge to this study is that the Core Files do not contain disaggregated measures of private and government contributions received by a non-profit organization, and instead only report total contributions received. As a result, I matched the Core Files with grant-making data
from the NEA and state-level arts agencies.20 This process disaggregates total contributions into two components- federal and state grants, and private and
local government contributions.21 So,
In addition to the measure of private contributions given in (14), I also report estimates using an alternative measure of private giving that includes membership dues in addition to ![]() . Membership dues are revenues collected from individuals who are members of an organization and who may receive special services for their patronage. Membership dues are an alternative way for individuals to support arts organizations, and they receive a private benefit
in return. The theoretical model presented in this paper does not differentiate between this type of private support from simply donating cash to an organization.
. Membership dues are revenues collected from individuals who are members of an organization and who may receive special services for their patronage. Membership dues are an alternative way for individuals to support arts organizations, and they receive a private benefit
in return. The theoretical model presented in this paper does not differentiate between this type of private support from simply donating cash to an organization.
Fund-raising effort is measured by expenditures incurred in the course of soliciting contributions, gifts, and grants. The IRS Form 990 instructions require organizations to list all expenses, including overhead costs, in conducting fund-raising campaigns, soliciting bequests and grants, or hosting special events that generate contributions.
Table (1) summarizes federal and state grant awards, as well as the two measures of private contributions to arts organizations, in FY 1995 and 1996. The bulk of arts activities is funded by private contributions, with state arts agencies funding more organizations though with smaller grant awards than the NEA. Among those receiving a grant, the average NEA grant decreased from roughly $50,000 to $37,000, or by about 26%, between FY 1995 and 1996. The average state grant was relatively stable during this period, at $22,000. The percent of arts organizations receiving an NEA grant dropped by 35%. From Table (2), the median grant award within a category typically fell by less (in percentage terms) than the total amount allocated to a particular category, suggesting that the funding cuts were more severe on the extensive rather than intensive margin.
Control variables for estimating the coefficients of (11), (12), and (13) include lagged program service revenues (as a percent of total revenues), assets at the beginning of 1995 relative to total revenues, and state dummies. Program service revenues (PSR) are an organization's revenues from activities that justify the organization's tax-exempt status. An example of PSR is the sale of its services, such as through ticket sales. Because there are temporary and permanent components to an organization's PSR, I use the average PSR from 1990 to 1995 as a percent of total revenues.23 Dividing by total revenues accounts for the possibility that larger organizations are likely to take in more PSR and also experience larger changes in NEA funding. This variable controls for the underlying trend in demand for the activities of particular organizations and also for size, both of which could potentially influence the overall level of private contributions. Beginning of the year assets are a measure of an organization's wealth, and are also normalized by revenues. State dummies control for any cross-state variation in the demand for arts activities as well as state-level demand shocks.
A strength of these IRS 990 data is that, unlike itemized individual tax return data, we can assess whether private contributions and government grants are going toward the same public good. Furthermore, because of the financial information in the Core Files, we can control for factors affecting both the levels of private contributions and government grants, such as an organization's PSR. Payne (1998) suggests that a limitation of these IRS data is the assumption that government grants constitute the only explicit measure of government funding of all non-profit organizations. But since the government funding of the arts occurs primarily through the NEA and state arts agencies, and not through government contracts awarded or the direct provision of arts activities, we need not be as concerned about this particular kind of measurement error.
6 Empirical Results
An implication of the identification strategy is that organizations experiencing smaller and larger changes in their grant awards should be similar in their observable (predetermined) characteristics. Table (3) examines these characteristics by whether organizations experienced a small or large change in government grants between FY 1995 and 1996. Looking at the last two columns, both types of organizations have similar lagged PSR and assets (both as a percent of revenue). Organizations with larger changes in government grants are also larger in scale; on average, they earn higher revenues and PSR.24 Larger arts organizations tend to be somewhat more concentrated in the Northeast and less so in other regions.
To control for other factors influencing private contributions between FY 1995 and 1996, I use organizations that experienced no change in their government grants as a counterfactual. From Table 3, these organizations have less PSR but more assets. For the purposes of this study, however, it suffices for these organizations to experience the same trends (rather than levels) in private contributions in the pre-FY 1995 period. Figure (7) provides the historical averages of total (private plus government) contributions for organizations that do and do not experience a change in government grants during the FY 1990 to 1995 period.25 Given some similarities in the pre-FY 1995 trend in total contributions, it may be possible to control for the time trend in private contributions by using the "No Change" organizations as a benchmark for what would have happened to arts organizations had there been no funding cut.
Table (4) presents the Ordinary Least Squares (OLS) results of estimating the crowding out parameter in Equation (11). This estimate combines the direct and indirect effects of government grants discussed in the theoretical model. Columns (1) and (2) present the results for private contributions as the dependent variable whereas Columns (3) and (4) correspond to private contributions plus membership dues as the dependent variable. Based on these estimates, private donations increased from 60 cents to a dollar for every dollar reduction in NEA funding for arts organizations. These estimates are significantly different from zero but not significantly different from minus one in all four of the specifications. The finding that private contributions increased suggests that arts organizations were able to increase donor support in the face of cuts from the NEA. Henceforth, I will focus on the second measure of private contributions in reporting estimates even though the qualitative discussion largely remains the same.26
From Table (4), the estimated crowding out parameters are larger (in absolute value) than other studies' estimates using micro-data.27 Other studies' estimates range from findings of zero crowding out to partial crowding out of roughly 50 cents on the dollar. They also estimate crowding out in sectors that are more reliant on government grants than are arts organizations. One possible conjecture is that the relatively large responses to the NEA funding cuts were due to the visibility of the organizations receiving grants as well as the already highly active private sector in FY 1995 that was funding the arts.
The story thus far, however, is incomplete. Table (5) illustrates that the fund-raising effort of arts organizations increased by roughly 25 cents for every dollar reduction in NEA funding. This finding is consistent with the results of the theoretical model, where government grants crowd out fund-raising because having less government grants corresponds to a higher marginal benefit of fund-raising than otherwise while not affecting the marginal cost. Organizations therefore increase their fund-raising effort in response to a reduction in government funding. These increases in fund-raising effort documented in Table (5) are similar in magnitude to the effect of government grants among arts organizations found in Andreoni and Payne (2003).
Columns (3) and (4) of Table (5) present estimates of ![]() , the effect of government grants on net of fund-raising donations. This parameter represents the effect
of government grants on net donations or alternatively, on the last dollar donated controlling for the effects of fund-raising. The net donations variable is the difference between private contributions, including membership dues, and fund-raising expenditures. Upon controlling for the cost of
attracting private donations, I find that a dollar reduction in NEA funding results in an increase of about 80 cents in private donations. Organizations, on average, are left with roughly 80 cents when government grants decrease by a dollar. Alternatively, given this point estimate, an increase
government grants of a dollar crowds out 80 cents, rather than a full dollar, of the last donated dollar, and the remaining reduction of 25 cents is due to a decrease in fund-raising effort. Based on the earlier discussion about this interpretation, we can treat this estimate as an upper bound (in
absolute value) of the net-of-fund-raising effect of government grants on private contributions. If the average return to fund-raising is higher than a dollar of private giving, government grants will crowd out less than 80 cents of private contributions.
, the effect of government grants on net of fund-raising donations. This parameter represents the effect
of government grants on net donations or alternatively, on the last dollar donated controlling for the effects of fund-raising. The net donations variable is the difference between private contributions, including membership dues, and fund-raising expenditures. Upon controlling for the cost of
attracting private donations, I find that a dollar reduction in NEA funding results in an increase of about 80 cents in private donations. Organizations, on average, are left with roughly 80 cents when government grants decrease by a dollar. Alternatively, given this point estimate, an increase
government grants of a dollar crowds out 80 cents, rather than a full dollar, of the last donated dollar, and the remaining reduction of 25 cents is due to a decrease in fund-raising effort. Based on the earlier discussion about this interpretation, we can treat this estimate as an upper bound (in
absolute value) of the net-of-fund-raising effect of government grants on private contributions. If the average return to fund-raising is higher than a dollar of private giving, government grants will crowd out less than 80 cents of private contributions.
As a check for the identification strategy, Table (6) examines the relationship between government grants and private contributions for the FY 1994-1995 period. If the results in Tables (4) and (5) reflect a spurious correlation between the variable of interest and government grants, it is likely for that correlation to be present in other years. Table (6) indeed illustrates that there is no significant relationship between private and government contributions to arts organizations during this period when estimating Equations (11) and (13).28 As would be the case if an organization's quality influenced its receipt of government grants, Table (6) is also suggestive of an endogeneity bias working in a positive direction since the point estimates are closer to zero, and suggestive of partial crowding out, than the estimates of crowding out in Table (4).
7 Conclusion
While at first glance, it appears that government grants completely crowd out private contributions to the arts, further examination suggests that this finding should be taken with a grain of salt. Because organizations increased their fund-raising effort in response to the NEA's funding cuts in FY 1996, they were able to attract private support and somewhat recuperate their funding losses. Non-profit arts organizations reduced increased their fund-raising efforts by roughly 25 cents for every dollar reduction in government support, and without additional information on the return to fund-raising, it is difficult to know how much fund-raising contributed to the increase in private contributions. If organizations fund-raised to the point where a dollar of fund-raising expenditures brought in a dollar of private contributions, we can surmise that the increase in fund-raising was responsible for roughly 25 cents of the increase in private giving, leaving crowding out net-of-fund-raising at about 80 cents.
The traditional interpretation of the estimate of crowding out is that the supply of arts activity remained unchanged. This interpretation is, however, subject to caveats namely because if organizations spend money from the government differently than that from private donors, the level of arts activity may change even when organizations can increase their private contributions in the face of reduced government funding. The NEA, for instance, mandates how organizations can spend public funds, whereas private donors rarely do so. To the extent that private donations fund administrators' salaries and overhead costs, the conclusion that the estimate of crowding out indicates how effective government spending is in raising the supply of a public good should remain dubious.
The results of this study also qualify the canonical belief that the optimal subsidy rate should be higher the larger is the magnitude of crowding out. The relevant parameter to inform this policy tool is the total effect of government grants on private contributions. It may, therefore, be optimal to implement a large subsidy on a public good when the pure crowding out effect is small if the fund-raising effect is large. In addition, because the magnitudes of the pure crowding out and fund-raising effects differ across public goods, there may be a case for applying different subsidy rates depending on the specific type of donation.
In light of the high visibility of NEA funding cuts and the large level of private support by patrons of the arts, the generalizability of this paper's main results to other types of public goods is questionable. Furthermore, the response of private donors and organizations to the government decreasing its role in funding a public good may be asymmetric from their response to an increase in the government's role. This asymmetry also questions the generalizability of the results. A direction for further research possibly entails applying this model to other organizations providing public goods, like social service organizations or public universities.
Further research is also needed to better understand the optimal policy design of government grants. If government funding only partially crowds out private giving but the fund-raising response lowers private donations, then regulating the incentives of non-profits may allow the first effect to dominate. In regulating the incentives of non-profits, it is important to understand whether fund-raising changes the amount that private donors contribute or whether fund-raising changes the pool of donors, which is a distinction this paper does not make. Finally, an estimate of the welfare loss (if indeed there is any) from fund-raising could be useful for policy. A final avenue for further research involves evaluating the efficiency of government grants in light of the fund-raising costs vis-a-vis the efficiency of government subsidies to private giving.
Bibliography
"Impure Altruism and Donations to Public Goods: a Theory of Warm Glow Giving," Economic Journal, 100, 464-477.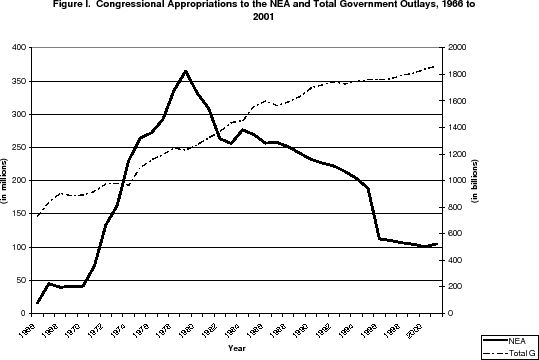
| 1995 - Mean: All | 1995 - Mean: Both | 1996 - Mean: All | 1996 - Mean: Both | % Change | % Change | |
|---|---|---|---|---|---|---|
| NEA Grant Amount | 4,114 | 4,118 | 1,900 | 2,117 | -53.8% | -48.6% |
| NEA Grant Amount S.E. | (258) | (283) | (160) | (192) | ||
| NEA Grant Amount, Among Receiving | 49,270 | 48,882 | 34,668 | 34,567 | -29.6% | -29.3% |
| NEA Grant Amount, Among Receiving S.E. | (2,830) | (2,865) | (2,737) | (2,933) | ||
| % Receiving | 8.4% | 9.0% | 5.5% | 6.1% | -34.5% | -32.3% |
| State Grant Amount | 6,648 | 7,156 | 6,170 | 6,852 | -4.4% | -4.2 |
| State Grant Amount S.E. | (290) | (334) | (246) | (297) | ||
| State Grant Amount, Among Receiving | 22,539 | 23,557 | 21,576 | 22,907 | -4.3% | -2.9% |
| State Grant Amount, Among Receiving S.E. | (946) | (1,060) | (823) | (949) | ||
| % Receiving | 29.9% | 24.5% | 28.6% | 24.2% | -4.5% | -1.3% |
| Private Contributions | 409,091 | 462,861 | 412,596 | 488,113 | 1.0% | 5.5% |
| Private Contributions S.E. | (27,299) | (32,123) | (26,415) | (34,085) | ||
| Private Contributions, Among Receiving | 444,008 | 500,856 | 448,410 | 529,745 | 1.0% | 5.8% |
| Private Contributions, Among Receiving S.E. | (29,613) | (34,738) | (28,682) | (36,971) | ||
| % Receiving | 92.1% | 92.4% | 92.0% | 92.1% | 0.0% | 0.0% |
| Private Contributions & Dues | 439,968 | 498,219 | 444,005 | 525,739 | 1.0% | 5.5% |
| Private Contributions & Dues S.E. | (31,145) | (36,658) | (30,057) | (38,809) | ||
| Private Contributions & Dues, Among Receiving | 458,960 | 518,678 | 463,716 | 548,455 | 1.0% | 5.7% |
| Private Contributions & Dues, Among Receiving S.E. | (32,481) | (38,154) | (31,383) | (40,473) | ||
| % Receiving | 95.9% | 96.7% | 95.7% | 95.9% | 0.0% | 0.0% |
| Sample Size | 17,472 | 14,824 | 19,244 | 14,824 |
All amounts are in 1995 dollars. Source: IRS 990 Core Files, NEA Grant Award Data, NASAA Grant Award Data.
| 1995 | 1996 | % Change | |
|---|---|---|---|
| Accessability/Research | 143,900 | ||
| Accessability/Research Median Grant Size | 6,000 | ||
| Advancement | 1,393,844 | ||
| Advancement Median Grant Size | 50,131 | ||
| Arts Education | 13,703,953 | 4,279,200 | -68.8% |
| Arts Education Median Grant Size | 684,836 | 418,853 | -39.0% |
| Challenge | 7,618,450 | 2,953,700 | -61.2% |
| Challenge Median Grant Size | 225,000 | 151,000 | -32.9% |
| Dance | 8,558,300 | 2,947,050 | -65.6% |
| Dance Median Grant Size | 17,000 | 12,100 | -65.6% |
| Design Arts | 2,162,818 | ||
| Design Arts Median Grant Size | 25,000 | ||
| Expansion Arts | 5,605,466 | 1,264,700 | -77.4% |
| Expansion Arts Median Grant Size | 11,000 | 11,000 | 0.0% |
| Folk & Trad'l Arts | 7,293,736 | 6,121,050 | -16.1% |
| Folk & Trad'l Arts Median Grant Size | 22,500 | 22,000 | -2.2% |
| International | 52,000 | 109,308 | 110.2% |
| International Median Grant Size | 2,000 | 8,560 | 328.0% |
| Literature | 5,394,571 | 1,834,400 | -66.0% |
| Literature Median Grant Size | 20,000 | 15,000 | -25.0% |
| Local Arts | 10,065,598 | 724,000 | -92.8% |
| Local Arts Median Grant Size | 44,140 | 21,435 | -92.8% |
| Media Arts | 8,770,174 | 3,598,200 | -59.0% |
| Media Arts Median Grant Size | 20,000 | 11,000 | -45.0% |
| Museums | 9,474,700 | 3,768,100 | -60.2% |
| Museums Median Grant Size | 30,000 | 20,000 | -33.3% |
| Music | 13,235,030 | 4,564,568 | -65.6% |
| Music Median Grant Size | 7,300 | 4,700 | -35.6% |
| Opera-Musical Theater | 4,974,521 | 2,705,500 | -45.6% |
| Opera-Musical Theater Median Grant Size | 12,500 | 8,000 | 36.0% |
| Presenting | 6,718,662 | 4,477,530 | -33.4% |
| Presenting Median Grant Size | 12,500 | 12,250 | -2.0% |
| State & Regional | 10,472,490 | 16,057,577 | 53.3% |
| State & Regional Median Grant Size | 533,000 | 377,200 | 53.5% |
| Theater | 8,066,652 | 3,273,500 | -59.4% |
| Theater Median Grant Size | 10,500 | 6,000 | -42,9% |
| Visual Arts | 4,904,198 | 1,315,000 | -73.2% |
| Visual Arts Median Grant Size | 18.625 | 10,000 | -43.4% |
For a detailed description of these categories, see the NEA Annual Report, 1995. Source: NEA Grant Award Data. Total Amounts in Bold; Median Grant Size in Italics. All amounts are in 1995 dollars.
| Characteristic | All | No Change | Small Change | Large Change |
|---|---|---|---|---|
| Average Change in Govt. Grants | -2,605 | 0 | -266 | -13,308 |
| Average Change in Govt. Grants S.E. | (328) | - | (32) | (1,695) |
| Lagged Program Rev.(as % of revenue)* | .435 | .408 | .596 | .592 |
| Lagged Program Rev.(as % of revenue) S.E. | (.004) | (.007) | (.008) | (.007) |
| Assets (as % of revenue - beginning of 1995)* | 2.325 | 2.829 | 1.524 | 1.568 |
| Assets (as % of revenue - beginning of 1995) S.E. | (.286) | (.47) | (.049) | (.048) |
| Revenue 1995 | 942,008 | 666,463 | 513,967 | 2,254,757 |
| Revenue 1995 S.E. | (56,063) | (69,302) | (51,434) | (180,138) |
| Program Revenue 1995 | 264,305 | 162,155 | 163,726 | 692,840, |
| Program Revenue 1995 S.E. | (14,369) | (14,166) | (18,112) | (55,948) |
| Revenue 1996 | 1,018,448 | 709,567 | 589,045 | 2,439,571 |
| Revenue 1996 S.E. | (63,115) | (73,942) | (68,658) | (214,996) |
| Program Revenue 1996 | 273,903 | 168,816 | 170,873 | 714,320 |
| Program Revenue 1996 S.E. | (14,795) | (14,091) | (17,951) | (59,086) |
| Northeast Region | .305 | .292 | .29 | .372 |
| Northeast Region S.E. | (.002) | (.005) | (.009) | (.009) |
| South Region | .219 | .202 | .232 | .214 |
| South Region S.E. | (.002) | (.004) | (.008) | (.008) |
| Midwest Region | .229 | .241 | .241 | .214 |
| Midwest Region S.E. | (.002) | (.004) | (.008) | (.008) |
| Mountain Region | .07 | .066 | .084 | .063 |
| Mountain Region S.E. | (.001) | (.003) | (.005) | (.005) |
| Pacific Region | .177 | .198 | .153 | .137 |
| Pacific Region S.E. | (.002) | (.004) | (.007) | (.006) |
| Sample Size | 14,824 | 9133 | 2846 | 2845 |
| Dependent Variable | (1) Donations |
(2) Donations |
(3) Don's & Dues |
(4) Don's & Dues |
|---|---|---|---|---|
| -.566* | -.630** | -1.040*** | -1.065*** | |
| (.298) | (.318) | (.298) | (.319) | |
| Lagged Program Rev. |
- | 6,038 | - | 4,401 |
| Lagged Program Rev. |
(21,458) | (21,489) | ||
| Assets (as % of revenue - beginning of 1995) |
- | 47 | - | 46.3 |
| Assets (as % of revenue - beginning of 1995) |
(370) | (371) | ||
| Constant | 23,778** | 21,782 | 24,820 | 23,668 |
| Constant S.E. | (11,926) | (16,416) | (11,944) | (16,440) |
| State Dummies | No | Yes | No | Yes |
| Adjusted |
0.0002 | 0.0001 | 0.0008 | 0.0005 |
| F-Stat from test that
|
2.12 | 1.35 | 0.02 | 0.04 |
| (p-value) | (0.15) | (0.25) | (0.89) | (0.84) |
Source: IRS 990 Core Files, NEA Grant Award Data, NASAA Grant Award Data.
* denotes statistical significance from zero at the 10% level, two-tailed test.
** denotes statistical significance from zero at the 5% level, two-tailed test.
*** denotes statistical significance from zero at the 1% level, two-tailed test.
![]() For a description of these variables, see text. All amounts are in 1995 dollars.
For a description of these variables, see text. All amounts are in 1995 dollars. ![]() signifies that the variable is the difference between its 1996 and 1995 values.
signifies that the variable is the difference between its 1996 and 1995 values.
| Dependent Variable | (1) |
(2) |
(3)
|
(4)
|
|---|---|---|---|---|
| -.246*** | -.267*** | -.794*** | -.799*** | |
| (.074) | (.079) | (.307) | (.328) | |
| Lagged Program Rev. |
- | -2,604 | - | 7,004 |
| Lagged Program Rev. |
(5,347) | (22,093) | ||
| Assets (as % of revenue - beginning of 1995) |
- | -3.3 | - | 49.6 |
| Assets (as % of revenue - beginning of 1995) |
(92) | (381) | ||
| Constant | 5,508** | 6,934* | 19,312 | 16,733 |
| Constant S.E. | (2,970) | (4,090) | (12,279) | (16,902) |
| State Dummies | No | Yes | No | Yes |
| Adjusted |
.0007 | .0023 | .0004 | .0002 |
| F-Stat from test that
|
103.24 | 85.43 | .45 | .38 |
| (p-value) | 0 | 0 | .5 | .54 |
Source: IRS 990 Core Files, NEA Grant Award Data, NASAA Grant Award Data.
* denotes statistical significance from zero at the 10% level, two-tailed test.
** denotes statistical significance from zero at the 5% level, two-tailed test.
*** denotes statistical significance from zero at the 1% level, two-tailed test.
![]() For a description of these variables, see text.
For a description of these variables, see text.
![]() The measure of net donations used here is donations and dues less the fund-raising expenses. All amounts are in 1995 dollars.
The measure of net donations used here is donations and dues less the fund-raising expenses. All amounts are in 1995 dollars. ![]() signifies that the variable is the difference between its 1996 and 1995 values.
signifies that the variable is the difference between its 1996 and 1995 values.
| Dependent Variable | Coefficient on |
|---|---|
| Donations | -.002 |
| Donations S.E. | (.376) |
| Donations & Dues | -.332 |
| Donations & Dues S.E. | (.379) |
| Fund-raising | -.006 |
| Fund-raising S.E. | (.032) |
| Net Donations | .004 |
| Net Donations S.E. | (.337) |
| Net Donations & Dues | -.326 |
| Net Donations & Dues S.E. | (.380) |
| Dependent Variable | Coefficient on |
|---|---|
| Donations | -.007 |
| Donations S.E. | (.406) |
| Donations & Dues | -.337 |
| Donations & Dues S.E. | (.409) |
| Fund-raising | -.011 |
| Fund-raising S.E. | (.034) |
| Net Donations | .003 |
| Net Donations S.E. | (.408) |
| Net Donations & Dues | -.326 |
| Net Donations & Dues S.E. | (.410) |
All dependent variables are measured as the change between 1994 and 1995. Coefficients are obtained from an OLS regression of the dependent variable on the change in government grants between 1994 and 1995. All amounts are in 1995 dollars. ![]() signifies that the variable is the difference between its 1995 and 1994 values.
signifies that the variable is the difference between its 1995 and 1994 values.
![\displaystyle \frac{\left [ f_{i1}(p(e) - 1) + f_{i2} \right ] d\tau_i + (f_{i1}p(e) + f_{i2} -1) dY}{f_{i1}p(e) + f_{i2}} +](img112.gif)
![\displaystyle \frac{\left [ f_{i1}(Y - y_i + \tau_i) + f_{ip} \right ] p^{\prime}(e) de}{f_{i1}p(e) + f_{i2}}](img113.gif)
![\displaystyle \sum_{i=1}^{N} \frac{\left [ f_{i1}(p(e) - 1) + f_{i2} \right ] d\tau_i + (f_{i1}p(e) + f_{i2} -1) dY + \left [ f_{i1}(Y - y_i + \tau_i) + f_{ip} \right ] p^{\prime}(e) de}{f_{i1}p(e) + f_{i2}}](img114.gif)
9 Data Remarks
This section describes the matching process across the IRS 990 Core Files and the grant-making files from the National Endowment for the Arts (NEA) and the National Assembly of State Arts Agencies (NASAA). The IRS 990 Core Files contain detailed financial information on the universe of non-profit arts organizations filing a Form 990. Variables in the Core Files include total government and private contributions to an organization, but not each one separately. As a result, I infer the contributions of private donors by subtracting government grants, given in the NEA and NASAA files, from total contributions.
This process requires merging three data sets with observations that do not have a unique numerical identifiers but instead have just a name. Because names are often spelled differently (e.g. "theater" v. "theatre"), I wrote a program to render consistent various spellings, abbreviations, and methods of punctuation. Wherever possible, I made these corrections in a general manner but on occasion, I had to make corrections by hand, and these are noted in the program.
I assumed that the Core Files described the universe of organizations, and so matched the NEA and NASAA observations to those in the Core Files. This means that if an observation was in the NEA or NASAA file(s) but not in the Core Files, it was dropped from the analysis. Dropped observations primarily include individuals, colleges, and universities. In the end, over 80% of the observations in the NEA and NASAA files found a match in the Core Files.
I used both the edited versions of the organizations' names as well as the state indicator to perform the merge. An organization's full name was used in merging across the three data sets as were the first 20, 18, 16, 14, 12, 10, and nine characters of the name along with the state indicator.
Further details of the matching process are available upon request.