
Giving Credit where Credit is Due?
The Community Reinvestment Act and Mortgage Lending in Lower Income Neighborhoods
November, 2008
JEL Codes: G21, G28, R13
1. Introduction
The U.S. government has long intervened in credit markets to improve credit access. Economic and sociological theories suggesting that credit access and homeownership generate important individual and social benefits such as improved self-esteem and child outcomes, reduced crime and increased voter turnout often motivate such policies.2 Congress passed the Community Reinvestment Act (CRA) in 1977 to ensure that lower-income, often predominantly minority, communities have adequate access to mortgage credit. CRA stipulates that federally insured banks have an affirmative obligation to supply credit throughout their local market. In practice, regulators evaluate banks' lending record in lower-income neighborhoods and can penalize non-compliant banks.
CRA's impact on credit supply is cast in doubt, especially since it does not subsidize banks and does not set explicit lending goals, leaving the determination of bank compliance to individual regulators' discretion. But changes in CRA enforcement in the early and mid 1990's likely mounted pressure on banks to expand their CRA-qualified activity. Indeed, banks increasingly established flexible lending programs and entered into "CRA lending agreements" since the mid 1990's (see Figure 1; Avery et al 2000). At the same time, homeownership and household mortgage debt rose dramatically, drawing attention to CRA.3 But CRA's impact has not been clearly differentiated from other major financial market changes, and Federal Reserve Chairman Ben Bernanke (2007) recently declared, "Distinguishing with certainty the effects that the CRA had on 'CRA-type' activity from the effects of simultaneous regulatory and market changes over this period has not been possible."
This paper utilizes a simple yet compelling strategy for identifying CRA's impact. I take advantage of a discontinuity in CRA's eligibility rule to identify its effect on credit flow in targeted neighborhoods. CRA targets census tracts with a median family income less than 80% of its MSA's median family income, hereafter "low and moderate income" (LMI) tracts. This rule provides the basis for a regression discontinuity (RD) design where the essential idea is that tracts just below and above the cutoff are identical except for CRA-eligibility and so a substantive difference in lending across the two groups can be attributed to CRA. Given the considerable transformation of financial markets over the past two decades, the importance of exploiting this discontinuity to identify CRA's effects cannot be overemphasized.
Policy makers have recently debated CRA fiercely (Golberg 2000, Chen 2004) and it will likely re-emerge as policy makers rethink mortgage market regulations and policies to avoid future crises (e.g. Bowyer 2008). This paper informs this debate not only by providing estimates of CRA's effect on bank (regulated) lending, but also its indirect effect on non-bank (unregulated) lending. While CRA may spark increased bank lending, crowd-out of non-banks could negate these benefits. On the other hand, non-bank lending could increase if targeted neighborhoods improve or information spillovers exist (e.g. Lang and Nakamura 1993), a frequently cited rationale for government intervention in credit markets (Lacker 1995).4
More broadly, studying CRA may yield insights into the costs and benefits of expanding credit supply. For example, CRA could provide an experimental framework to study the impact of credit access on crime (e.g. Garmaise and Moskowitz 2006). And measuring the performance and profitability of marginal CRA mortgages could improve our understanding of the sustainability of increased lending and homeownership, and as a result also provide evidence on the competitiveness of the banking industry, a key regulatory issue as this industry consolidates.
To implement the analysis, I use comprehensive mortgage application data collected under the Home Mortgage Disclosure Act (HMDA). For all MSA's between 1994 and 2002, I find that bank mortgage origination volume was 3% higher in LMI tracts at the cutoff. Further analysis reveals that CRA's impact is concentrated entirely in large MSA's, where banks are most likely to be heavily scrutinized by regulators and community groups. In this subsample, the discontinuity in bank lending grows from 4% between 1994 and 1996 to 8% between 1997 and 2002, consistent with a reform implemented by 1997 strengthening CRA.5 Notably, this reform added incentives for banks to target LMI households and in a companion paper (Bhutta 2008a) using a similar RD strategy I find that CRA's effect on this margin is also concentrated in large MSA's.
For non-banks, I find evidence of "crowd-in". In large MSAs in post-reform years, I find non-bank lending increased by 3%. Further, the increase in credit by unregulated lenders is concentrated in tracts that have had relatively low previous home sales, while the discontinuity in bank lending occurs in both low and high sales tracts. These results are consistent with a model of information externalities inhibiting credit flow in thin markets (see Section 3).
It is important to note that these results are sensitive to controlling for MSA and tract size. However, conditional on MSA and tract size, other covariates that explain an additional 20-25% of the variation in loan volume are very well-balanced across the cutoff, making a strong case for a causal interpretation of the results. Also important to this interpretation, the RD strategy does not readily identify discontinuities at non-CRA points.
Finally, I take advantage of the change in LMI status of some tracts following the release of 2000 Census data by formulating a "two-dimensional" regression discontinuity design - the change in treatment status depends on two variables instead of one - to assess the effects of CRA in 2004 and 2005. While summary statistics reveal extraordinary growth in loan volume in "switching" tracts, indicative of the explosion in credit supply at this time, the RD strategy identifies a modest effect of CRA on bank lending of 4-5% to these tracts. As this finding is for a set of newly targeted census tracts, it strengthens the causal interpretation of the earlier results.
In the next section, I discuss CRA in more detail and review previous research trying to identify CRA's effect on credit supply. Section 3 describes CRA's potential effects, including a short discussion of the information externality model. Section 4 discusses the data and regression discontinuity strategy. Section 5 presents the results and discusses the "two-dimensional" regression discontinuity approach, and Section 6 concludes.
2. Background & Related Literature
Congress passed the CRA in response to claims that banks were continuing to irrationally redline low-income, urban neighborhoods.6 To ensure that banks and thrifts (hereafter banks) supply credit in both higher and lower income neighborhoods within their operating market, regulators periodically inspect their lending records. Importantly, CRA does not cover non-deposit independent mortgage companies or credit unions. And, CRA does not automatically cover non-deposit mortgage subsidiaries of banks, but banks have the option of including their subsidiaries' lending in their CRA evaluation.
Examiners rate banks in each of their "assessment area(s)" - generally the MSAs and/or counties where they have branches - separately and then combine these ratings into an overall grade (e.g. outstanding, needs to improve, etc.).7 For multi-MSA institutions, examiners pay close attention to the largest markets they serve (see discussion in Section 5.2). Regulators can then penalize banks earning a poor CRA rating by denying applications for bank mergers, opening and closing new branches and other activities.
Interest in CRA as a tool to help expand homeownership opportunities grew in the late 1980's and early 1990's. Lawmakers pushed regulators to improve enforcement, beginning with an 1989 amendment forcing regulators to publicly disclose CRA evaluations and culminating in a 1995 reform (phased in
by mid-1997) that shifted examiners' focus towards banks' actual record of lending rather than procedural efforts to meet CRA, such as spending time meeting with community groups.8![]() 9 A strengthened CRA
combined with accelerating bank merger activity following bank deregulation may have made CRA more effective during the late 1990's.
9 A strengthened CRA
combined with accelerating bank merger activity following bank deregulation may have made CRA more effective during the late 1990's.
Community organizations also play a role in enforcement. Regulators must solicit and weigh public comments on a bank before deciding on its merger application. Community groups can and often do use the HMDA data and other resources to build a case against a bank.10 In response, banks have entered into "CRA Agreements" with community groups where banks pledge resources to targeted neighborhoods. Consistent with CRA becoming more salient for banks during the 1990's, the value of new CRA agreements rose considerably at this time (Figure 1). And bankers interviewed by Harvard's Joint Center for Housing Studies (JCHS) said that many banks have taken considerable steps to increase CRA-qualified loans to avoid CRA-associated difficulties and bad press (Belsky et al 2000).
A major component of the CRA evaluation is a bank's volume of lending to LMI neighborhoods compared to that of its peers as well as to the bank's non-LMI lending volume. Regulators therefore give banks "CRA-credit" as a discontinuous function of tract income. Therefore, to identify CRA's effect, I will measure the jump in loan volume at the point where CRA-credit jumps.
This strategy differs from most other studies of CRA. A few studies test for bank-specific reactions to particular CRA incentives, with mixed results. Dahl et al (2002) show that changes in CRA-type lending is uncorrelated with CRA rating downgrades in the early 1990's. In contrast, Bostic and Robinson (2005) find that banks increase targeted lending during the years in which they have a CRA agreement in effect, and Bostic et al (2005) find that merging banks' CRA-qualified lending increases prior to acquisitions of other banks.
Other studies, as this one, try to estimate CRA's impact more broadly. JCHS researchers (2002) show that banks make a higher fraction of their loans to and are less likely to deny loan applications from CRA-targeted populations inside the bank's assessment area (i.e. where banks get "CRA credit") compared to outside those geographic boundaries. But because bank operations likely differ in areas where they have branches relative to where they do not - for instance, better knowledge of the local market and population which may allow more lending to lower-income borrowers - this test lacks a causal interpretation.11
A few studies (Schill and Wachter 1994, Evanoff and Segal 1996, Bostic and Surette 2004) find that unregulated LMI loan growth exceeds that of regulated lenders, implying CRA's effect has been limited. But excessive unregulated loan growth suggests that the trend in unregulated lending is not likely to provide a valid counterfactual to test CRA's effect on bank behavior, perhaps because unregulated lending operates under a different business model. Another concern is that reductions in underreporting during the 1990's likely inflate loan growth for independent mortgage companies more so than for banks (JCHS 2002).
Berry and Lee's (2008) approach is most similar to the one taken in this paper. They create a set of "matched pair" neighborhoods - pairs of tracts sharing a physical boundary where one tract is just above the CRA threshold and one just below. They then calculate the average pair-difference in several credit outcomes, controlling for the pair-difference in the "assignment variable" (tract-to-MSA median family income). BL fail to find evidence of a treatment effect, but their matched-pair design generates very imprecise results. For instance, the implied percentage effect of CRA on origination volume from their design is roughly between -17% and 23%.12 The strategy in this paper uses the data much more efficiently, allowing important exploration of heterogeneous effects over time and across space, while maintaining a causal interpretation.
Berry and Lee also test whether CRA affects credit supply to LMI borrowers. Again, they exploit the CRA discontinuity, testing for a discontinuity in loan rejection rates and find no effect. Their test assumes that banks respond to CRA by lowering credit standards, which may not be the case (see Section 3). Even if banks do lower credit standards, testing for a discontinuity in the denial rate will be biased if average applicant credit quality changes in response. For instance, more high-risk types might apply as the probability of acceptance rises. Indeed, Canner et al (1999) shows that during the 1990's, the expansion of subprime credit led to an increase in credit supply and denial rates. Both in this paper and its follow-up (Bhutta 2008a), I detect a jump in application volume at the CRA cutoff, calling into question Berry and Lee's assumptions.
3. Neighborhood Credit Supply and the CRA13
Two types of lenders generally supply mortgage credit: banks, which take deposits, and mortgage companies (non-banks) that get loanable funds from a secondary market of investors. Roughly, banks serve prime (low-risk) borrowers, while non-banks provide FHA (government insured) and subprime loans in addition to conventional prime loans (Nichols et al 2005). The availability of prime, FHA and subprime mortgages suggests that a variety of risk types can obtain credit (Pennington-Cross et al 2000). Still, a large fraction of applications are denied indicating that many may have difficulty obtaining a mortgage.
The effect of CRA on targeted-neighborhood credit supply depends on how banks respond to CRA. Banks may attract applications away from non-banks, for instance through increased neighborhood advertising or by providing incentives to mortgage brokers and real estate agents to recommend customers to them, leaving credit supply basically unchanged.
Alternatively, banks may offer credit at a lower price in targeted areas. Some crowd-out may occur, but an overall increase in credit flow would result as demand would rise in response and more borrowers would meet payment-to-income ratio requirements. This scenario would raise consumer welfare and potentially generate positive neighborhood externalities as borrowers would be less likely to default (e.g. Immergluck and Smith 2006).
Banks may also lower their credit standards, which could crowd-out non-banks' FHA and subprime lending. Otherwise, such marginal loans might have differing effects over time, at first increasing credit supply and homeownership but subsequently resulting in more defaults and perhaps destabilizing neighborhoods.
Other research indicates that banks often work with community groups and state agencies to help provide credit to marginal borrowers (see Avery et al 2000, Campen and Callahan 2001, Quercia et al 2001). For instance, banks may allow a lower credit score but would require the borrower to attend a third party's financial literacy course. Banks might also conduct more thorough credit checks, on their own or with the help of a third party, allowing them to extend more credit to marginal borrowers.
Increased credit supply due to CRA that generates more home sales and/or increased homeownership could result in observed increases in non-bank lending. For instance, as homeownership rises the demand for refinance and home improvement credit should rise - demand that would likely be met by both banks and non-banks.
Lang and Nakamura (L-N 1993) provide a more subtle reason for "crowd-in". They hypothesize that increased home sales generates public information about neighborhood home values that can increase appraisal precision and lead to greater equilibrium credit supply. Uncertainty about home values negatively affects credit supply even if lenders are risk neutral because of the asymmetry in payoffs: expected gains due to undervaluation fail to offset expected losses due to overvaluation. The public nature of home transaction information diminishes lenders' incentive to gain experience in neighborhoods through more lending. Thus, neighborhoods experiencing a negative shock to home sales in one period might suffer suboptimal credit supply in subsequent periods due to this information externality.
A few studies establish a positive relationship between home sales in one period and subsequent credit access, but none have a quasi-experimental setup.14 This study may provide evidence of the L-N hypothesis by taking advantage of the shock to home sales induced by CRA, combined with data on historical tract-level sales volume. Specifically, if the L-N hypothesis is true, then an increase in bank home purchase loans due to CRA should have a greater subsequent effect on non-bank home purchase lending in previously low-sales areas than in high-sales areas.
4. Data & Empirical Strategy
4.1. Overview
I take advantage of a sharp discontinuity in the CRA eligibility rule to identify its impact on credit flow. Census tracts with a median family income less than 80% of MSA median family income qualify as "low-and-moderate" income (LMI) under CRA regulatory procedures and are targeted by banks. In the regression discontinuity (RD) analysis that follows, this income ratio (TM) is the "assignment" (or "running") variable. The impact of the CRA at the cutoff will be identified by measuring the jump in loan volume at TM = 0.80.
Importantly, the value of TM used in this paper is identical to that used by bank regulators. As such, the key right-hand-side variable in the regressions to follow is measured precisely. Tract and MSA median family income are based on decennial Census income data and MSA definitions, which change periodically. Between 1994 and 2002 almost all census tracts had a constant value of TM based on the 1990 Census and 1993 MSA definitions (by OMB).15 In 2003, 2000 Census data was used to calculate TM. TM changed again in 2004 as MSA definitions changed considerably (see Section 5.2). I perform two separate analyses - one for 1994 to 2002 and another for 2004-2005.
4.2. Data & Summary Statistics
Data on census tract level mortgage activity comes from information submitted by lenders under the Home Mortgage Disclosure Act (HMDA 1977). Since 1990, lenders covered by HMDA have been required to compile and submit detailed information on the individual mortgage applications they receive. And in 1993 a large number of independent mortgage companies previously exempt began reporting under HMDA.16
HMDA provides a unique lender ID that I use to separate loans by three lender types: banks, mortgage subsidiaries of banks and independent mortgage companies. Credit unions, which extend a very small share of mortgage credit, are included in this last group because they also fall outside the reach of CRA. I also use the census tract of the property, the loan amount, the disposition of the loan (e.g. approved, originated, denied, etc.), the loan purpose (e.g. refinance), and whether the loan was sold in the secondary market and to whom it was sold. Finally, lenders report some borrower characteristics such as race, gender, and income, which I use to measure changes in portfolio risk. See Table 1 for a full list and description of the variables available in HMDA.
I also use census tract-level characteristics from the 1990 and 2000 Censuses, compiled and distributed by Geolytics. I merge these characteristics to the HMDA loan data using the census tract codes to create a tract-level dataset, with yearly mortgage activity variables from HMDA summed up by tract for different periods.
The analysis focuses on census tracts in MSAs as HMDA data are unreliable in rural areas (Avery et al 2007). In terms of MSA coverage, I provide evidence in the follow-up paper using Census and CPS data that HMDA accounts for the vast majority of home purchase lending activity at least by 1999 and that coverage increased considerably since 1994. Further, although independent banks in MSAs with less than $30 million in assets are exempt from reporting, using FDIC Call Report and Summary of Deposit data I find that these small banks held only 1.6% of the value of all 1-4 family residential loans held by all banks with at least one branch in an MSA at the end of 1998.
In addition to rural tracts, I exclude census tracts in MSAs in Hawaii and Alaska. Of the remaining states, I use only census tracts that have been in an MSA since 1994 in order to maintain a constant set of geographies. Of tracts in eligible MSAs around the cutoff (0.75 ![]() TM
TM ![]() 0.85), I use just over 96% in the analysis. I keep census
tracts with at least 100 housing units, at least one "specified" owner-occupied unit, less than 30% of the population in group quarters, at least one application of any type in each year, and those with between 0.25 and 20 originations per (1990) owner-occupied unit from 1994 to 2002.
0.85), I use just over 96% in the analysis. I keep census
tracts with at least 100 housing units, at least one "specified" owner-occupied unit, less than 30% of the population in group quarters, at least one application of any type in each year, and those with between 0.25 and 20 originations per (1990) owner-occupied unit from 1994 to 2002.
Table 2 provides means of tract-level mortgage activity and tract characteristics for three groups of tracts: those just below the cutoff (column 2), those just above the cutoff (column 3), and those with median family income close to that of the MSA (column 1). Panel A shows average mortgage volume by loan type and the three lender types between 1994 and 2002. Column 4 provides the p-Value for a test of the equality of the means in columns 2 and 3.
Table 2 makes clear that loan volume is highly correlated with tract relative income. Summing all loans by all lenders, total loan volume for median income tracts is around 30% higher than for the CRA-ineligible group and more than 60% higher than the CRA-eligible group. The differences in terms of owner-occupied housing units are 18% and 39%, respectively. In fact, substantive differences across the cutoff occur for nearly all the housing and demographic variables in panel B. The regression discontinuity strategy discussed next provides a reliable way in theory to deal with the apparent selection problem when trying to identify the impact of CRA.
4.3. Regression Discontinuity
Consider the following tract-level regression of potential outcomes (e.g. log total originations by banks between 1994 and 2002) on a CRA treatment indicator variable, ![]()
![]() = 1[TM
= 1[TM![]()
![]() 0.80]:
0.80]:
(4.1)
![]()
The essential premise of the regression discontinuity design is that:
(4.2)
![]()
In words, CRA targeted and not-targeted tracts arbitrarily close to the cutoff (TM = 0.80) are identical in expectation with the exception of their eligibility status. As such, any substantive difference in outcomes across the cutoff for tracts "near" the cutoff can be attributed to a CRA treatment effect. Crucially, under assumption (4.2) the major changes in mortgage markets over the study period and the substantial differences between LMI and non-LMI census tracts do not threaten identification of CRA's effect at the tract-eligibility threshold.
One approach to estimating ![]() is to compare the outcome mean for tracts "just below" the cutoff to that for tracts "just above" the cutoff. But because
loan volume is highly correlated with the assignment variable, as illustrated in Table 2, a more attractive strategy is to model the underlying relationship between loan volume and TM in the vicinity of the cutoff, and
is to compare the outcome mean for tracts "just below" the cutoff to that for tracts "just above" the cutoff. But because
loan volume is highly correlated with the assignment variable, as illustrated in Table 2, a more attractive strategy is to model the underlying relationship between loan volume and TM in the vicinity of the cutoff, and ![]() will be measured as the difference in the right and left limits of this function at the cutoff (Imbens and Lemieux 2007).
will be measured as the difference in the right and left limits of this function at the cutoff (Imbens and Lemieux 2007).
To see this, rewrite (4.1) as
(4.3)
![]()
And since ![]() is determined entirely by TM (4.3) becomes
is determined entirely by TM (4.3) becomes
(4.4)
![]()
And finally, the RD estimating equation is given by
(4.5)
![]()
where
![]() .
.
![]() is the "control function" - it controls for the expected value of all excluded variables that affect
is the "control function" - it controls for the expected value of all excluded variables that affect ![]() and are correlated with
and are correlated with ![]() . It will be approximated by linear and polynomial functions of TM.
. It will be approximated by linear and polynomial functions of TM.
5. Results
5.1. Testing the Identification Assumption
If observable, "pre-treatment" tract characteristics change smoothly across the cutoff, that would lend credence to the identification assumption that all tract characteristics affecting lending, except for CRA-eligibility status, change smoothly across the cutoff. Figure 2 displays a test of the identification assumption. It plots the predicted values from a regression of the (log) total number of originations (all lenders and loan types) between 1994 and 2002 for tracts with TM between 0.75 and 0.85 on the set of 1990 tract characteristics listed in Panel B of Table 2.17 Each data point shown in Figure 2 represents the mean of the predicted values for tracts in a half-percentage point interval of TM. Also shown is an estimated regression line fit to the underlying tract-level predicted values that allows for an intercept shift at the cutoff. Importantly, the set of tract characteristics used explains more than 75% of the variation in tract loan volume and so this test is quite informative about loan volume around the cutoff in the absence of CRA.
A few features stand out. One is the steep slope of the data, reflecting the quick change in tract characteristics over TM around the cutoff. Second, the pattern of the data suggests that the ex-ante relationship between loan volume and TM around the cutoff is approximately linear. Finally, the data do not indicate any sharp change in tract characteristics at the cutoff.18 There does appear to be considerable variation in tract characteristics just to the left of the cutoff and near TM = 0.75 that may make estimating CRA's effect more difficult.
5.2. RD Estimates of CRA's Effect on Bank Lending
Figure 3, which is analogous to Figure 2 except that the Y-axis variable is (log) total bank originations, mirrors the patterns observed in Figure 2. However, the data to the left of the cutoff have shifted up relative to the data for the control tracts when compared with Figure 2, suggesting a positive CRA effect. For instance, the first point to the left of the cutoff is well above the points just to the right, unlike in Figure 2. And the next two points, while being considerably lower, as they are in Figure 2, appear to lie along the dashed trend line whereas they fall below the dashed line in Figure 2.
The top left corner of Table 3 shows the regression result corresponding to Figure 3, and indicates a discontinuity estimate (standard error) in bank loan volume of nearly 7% (5%). The variance estimates throughout the paper allow for within-MSA spatial correlation. Column 2 shows estimates after including MSA fixed effects. The R2 increases substantially and the standard error falls by about 25%, but the point estimate is also cut nearly in half, implying that the MSA composition of tracts is not well-balanced across the cutoff. Columns 3 and 4 add in tract-level controls, helping bring down the standard error substantially. At the same time, the point estimates across these columns are stable suggesting that within MSA tracts are comparable across the cutoff.
Columns 5 thru 7 use larger bandwidths to help estimate the control function more precisely. The power gained by using more data will be offset to some degree by using a higher order polynomial control function. In addition, to account for a potential discontinuity in loan volume due to the GSE Act, I allow for an intercept shift at TM = 0.90.19 The estimates in Columns 5 thru 7 are relatively precise - all are significant at the 5% level. The point estimates range from 2.7% (Column 6) to 3.8% (Column 3). This stability suggests that the conditional relationship between loan volume and TM around the cutoff is well-behaved.
Panels B, C and D show RD estimates separately for census tracts grouped by three MSA size classes. Although CRA applies to all MSAs, banks in large cities are more likely to face pressure under CRA for several reasons. First, while large, multi-MSA banks dominate the credit and banking markets in cities of all sizes20, regulators tend to focus on these banks' activity in the largest cities to help conserve regulatory resources.21
In addition, community groups that may challenge bank applications and negotiate CRA agreements are active mainly in large cities. Indeed, an historical list of CRA agreements provided by the National Community Reinvestment Coalition (NCRC 2005) suggests that large cities such as Boston, Washington DC, New York City, Detroit, and Philadelphia have commanded a large proportion of bank commitments.22
Finally, the higher probability of public scrutiny in large cities may affect the response to CRA of relatively small banks operating in large cities. First, because smaller banks generally operate in a single market, negative publicity in their sole market could be quite harmful. And secondly, smaller banks may hope to position themselves as acquisition targets23, and they might be relatively more attractive if a potential buyer can be sure regulators will not place costly delays or conditions on the application because of negative public comments.
Panels B and C show results for census tracts in small (1990 population less than 500,000) and medium (1990 population between 500,000 and 2 million) MSAs, respectively. After controlling for both MSA and tract size (log number of housing units in 1990) the point estimates in Column 3 show no discontinuity in loan volume, although the standard errors are large (5.6% and 4.1%). Including all the other covariates does not affect the point estimates substantively, and subsequently increasing the bandwidth again increases precision. Overall, there is little evidence of a CRA effect on bank lending in both small and medium size MSAs.
Panel D indicates that CRA's effect is concentrated in the largest MSAs - those with at least 2 million people (in 1990), of which there are 23 (out of 321 MSAs in the sample) accounting for nearly 40% of census tracts. Columns 3 thru 7 indicates a discontinuity in bank lending of more than 7% with last three estimates have p-Values under 0.01. However, the estimates are again sensitive to MSA and tract size controls, which is troubling in terms of satisfying the RD identifying assumption. But the robustness of the point estimate to additional controls that explain a considerable amount loan volume variation (e.g. the R2 increases by more than 25% from Columns 3 to 4 in Panel D) makes a strong case for a causal interpretation of the estimates in Columns 3 thru 7.
Figure 4 provides results of a falsification exercise where I test for discontinuities in large MSA bank lending at non-CRA cutoffs - i.e. points where there should not be a discontinuity.24 Each point in Figure 4 represents the estimated discontinuity at the given value of TM using the Column 5 specification of Table 3. Nearly all of the estimates away from the CRA cutoff fall close to the zero line, indicating that discontinuities in the data are not easily generated. These results also reinforce the causal interpretation of the discontinuity at 0.80.
A discontinuity does appear at TM = 0.75. In testing more than twenty points, it is not surprising to find one statistically significant discontinuity. Probing deeper, I find that pre-existing tract characteristics change rapidly around 0.75. Performing an analysis similar to that in Figure 2, I find a discontinuity in predicted loan volume at TM = 0.75, conditional on tract size and MSA, of -8.4% (standard error of 4.3%). In contrast, this same exercise yields no discontinuity at the CRA cutoff (point estimate of -0.7%).
Table 4 shows separate estimates (using the Column 6 specification in Table 3) of CRA's effect on different loan types - home purchase loans and refinance/home improvement loans - and for two different periods that represent years before and after full implementation of the 1995 CRA reform. As in Table 3, Panel A shows estimates for loan originations. The point estimate for all loans combined (Columns 1 and 2) is about twice as large in the second period, consistent with the reform strengthening CRA's effect.25 The results also show a relatively large effect after 1997 in both home purchase lending (8.5%) and refinance/home improvement lending (8.1%).
Panel B shows estimates for CRA's effect on the number of loan applications to banks. As argued earlier, applications may react to CRA if banks, for instance, increase their advertising in targeted neighborhoods or borrowers perceive their chances of obtaining a loan to be greater. Indeed, Table 4 indicates that applications for both loan types do rise in response to CRA. Finally, Panel C shows estimates for the discontinuity in dollars lent. While the point estimates in Panels A and C suggest that home purchase lending rises by a similar proportion in both number and value, the point estimate at the bottom of Column 4 is somewhat lower than the rise in refinance/home improvement originations (0.081 versus 0.057). This result coincides with anecdotal evidence that community groups push banks to increase the supply of small loans to help provide liquidity to homeowners (NCRC 2005). 26
5.3. Risk Characteristics of Marginal Loans
An ideal way to discern the risk of marginal loans would be to look at how the distribution of borrower credit scores changes across the CRA cutoff. Unfortunately, borrower credit score is not available in HMDA. Instead, I create a risk measure by using the available loan and borrower characteristics along with application outcomes (e.g. application denied by lender) to predict each application's probability of being denied given those characteristics. Of course, predicted denial probabilities will reflect underlying risk as well as other factors. For instance, high denial rates for minorities could reflect both lower average credit scores as well as lender discrimination.
To estimate the risk of an application, I first run the following regression:
(5.1)
![]()
where deny![]() is an indicator variable equal to one if application
is an indicator variable equal to one if application ![]() in MSA
in MSA ![]() and year
and year ![]() was denied, x is a vector of loan and borrower characteristics,
was denied, x is a vector of loan and borrower characteristics, ![]() is a set of MSA by year fixed effects and the coefficients on x are allowed to
vary by MSA and year. (5.1) is run using home purchase applications at banks between 1997 and 2002 with TM between 0.50 and 1.10 and for which a credit decision was made.27 In this sample, about 18% of applications were denied.
is a set of MSA by year fixed effects and the coefficients on x are allowed to
vary by MSA and year. (5.1) is run using home purchase applications at banks between 1997 and 2002 with TM between 0.50 and 1.10 and for which a credit decision was made.27 In this sample, about 18% of applications were denied.
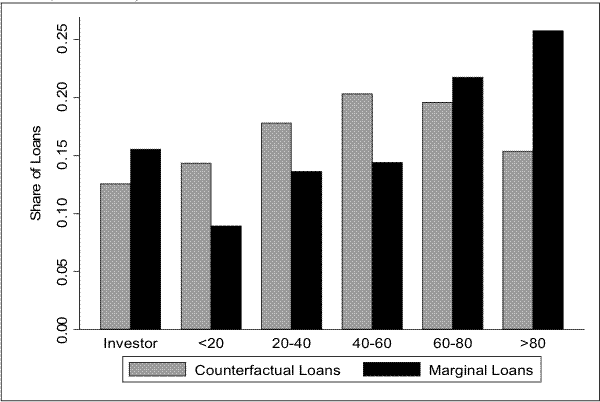
Using the estimated coefficients I generate predicted values and then I identify each application's quintile within its MSA-by-year (predicted) distribution. To be surehe predicted values are informative: applications predicted to be in the lowest risk (bottom quintile) have a 15% denial rate while applications predicted to be the highest risk (top quintile) have a 50% denial rate.
The gray bars in Figure 5 show the share of home purchase originations to each of the five risk groups as well as to investors (non-owner-occupiers) in tracts just above the CRA cutoff (0.80 ![]() TM
TM ![]() 0.82). The modal owner-occupying borrower in these tracts is in the middle risk quintile.28 The black bars show the estimated risk distribution of marginal loans. I generate this distribution by first estimating the discontinuity in the share of home purchase originations to a
particular risk group. In other words, I obtain six estimates from six regressions, one for each risk class. And then I calculate the proportion of marginal loans for each risk class implied by these estimates. 29
0.82). The modal owner-occupying borrower in these tracts is in the middle risk quintile.28 The black bars show the estimated risk distribution of marginal loans. I generate this distribution by first estimating the discontinuity in the share of home purchase originations to a
particular risk group. In other words, I obtain six estimates from six regressions, one for each risk class. And then I calculate the proportion of marginal loans for each risk class implied by these estimates. 29
Figure 5 is consistent with notion that marginal loans tend to go to marginal borrowers. In contrast to the counterfactual distribution (grey bars), the distribution of marginal loans is skewed towards those with the highest ex-ante likelihood of being denied credit. The share of marginal loans for investment units (not owner-occupied), which typically represents greater risk, is also slightly higher than normal.
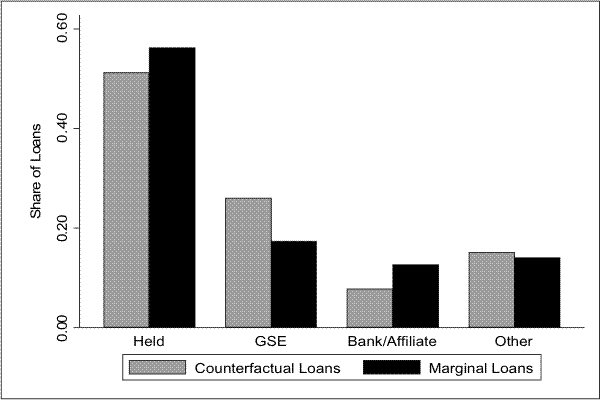
Figure 6 complements the results shown in Figure 5. This figure is generated in an analogous way to Figure 5, except that I estimate the discontinuities in the share of loans held or sold to a particular type of purchaser, information which is available for each loan in the HMDA. Figure 6 indicates that banks hold a somewhat higher share of marginal loans in portfolio, which would be expected if these loans do not conform to the usual standards of secondary market participants.30 A relatively high share of marginal loans are also sold to other banks and affiliate institutions, consistent with the possibility that banks may use secondary market purchases to meet their CRA responsibilities. Indeed, using data on loan purchases reported in HMDA, I find a 13% discontinuity in loan purchases by banks in large MSA's. Also, importantly, I find that these marginal purchased loans are more likely to be held in portfolio by the purchasing bank rather than resold within the same year of the purchase.31
5.3. RD Estimates of CRA's Effect on Non-Bank Lending
The results thus far show that banks have expanded their credit supply - both for home purchase and refinance/home improvement - in CRA-targeted areas. Also, they are getting more applications but do not appear to take on more risk. As mentioned earlier, these results may reflect banks attracting applications away from non-banks. Crowd-out seems especially likely in the case of increased home purchase lending since an underlying good (i.e. a house) must be supplied. I next test for whether bank lending substitutes for or compliments non-bank lending.
Table 5 provides estimates of CRA's effect for independent mortgage companies (IMC) and mortgage bank subsidiaries (BMC) separately. The positive discontinuity in BMC lending (Columns 3 and 4) is difficult to interpret because CRA may affect these lenders directly (see Sections 2). Nevertheless, this result rejects the concern some have raised of banks obtaining CRA loans from their subsidiaries to improve their CRA grade (e.g. Marsico 2006).
The results for IMCs (Columns 1 and 2) suggest that CRA generated an equilibrium with greater lending. In post-reform years, IMC lending is 3% higher at the cutoff. Importantly, there is no pre-existing discontinuity in non-bank lending - the IMC point estimate for 1994-1996 is 0.006. Also, the modest discontinuity in originations after 1997 does not appear to be driven by any single year. When I divide the 1997-2002 period into two sub-periods (1997-1999 and 2000-2002), I find a discontinuity in originations of similar magnitude in both sub-periods (the point estimates are 0.032 and 0.033, respectively; both are significant at the 10% level).
As discussed in Section 3, if the L-N hypothesis is true, then the increase in bank home purchase loans due to CRA would have a greater subsequent effect on non-bank lending in areas with relatively few past home sales. To test this hypothesis, I divide large MSA
census tracts into two groups based on tract home purchase loan volume by all lenders in 1993 and 1994 per (1990) owner-occupied unit. I define a "low-sales" (high-sales) group of tracts as those with a home purchase loan rate below (above) the median in their MSA-by-income cell, where tract
income takes three values: low (50![]() TM
TM![]() 70), medium
(70
70), medium
(70![]() TM
TM![]() 90) or high (90
90) or high (90![]() TM
TM![]() 110).
110).
Columns 1 and 2 of Table 6 show estimates of the discontinuity in bank home purchase lending in low-sales and high-sales tracts. For both groups of tracts there is a similar (proportional) effect. Analogous estimates for IMCs (Columns 3 and 4) show a large discontinuity in home purchase lending in low-sales tracts, but no effect in high-sales tracts. These results are consistent with predictions of the L-N model.
5.4. Exploring Alternative Explanations for Crowd-In
Low-sales and high-sales tracts are different, which may lead to differential effects of CRA for reasons other than an information externality. For instance, the population of low-sales tracts around the cutoff (0.78 ![]() TM
TM ![]() 0.82) is 24% African-American, compared to 13% for high-sales tracts. If minority neighborhoods are better represented by
community groups, CRA's direct effect on banks may be stronger in the low-sales group. But Table 6 shows that the discontinuity in bank home purchase lending is similar for both groups, and I also find a similar effect across both groups for home-improvement/refinance lending.32
0.82) is 24% African-American, compared to 13% for high-sales tracts. If minority neighborhoods are better represented by
community groups, CRA's direct effect on banks may be stronger in the low-sales group. But Table 6 shows that the discontinuity in bank home purchase lending is similar for both groups, and I also find a similar effect across both groups for home-improvement/refinance lending.32
Another possibility is a differential effect in bank purchases of loans in the secondary market, for which banks get "CRA-credit" if the purchase is for a loan originated in an LMI tract. Interestingly, I find a large discontinuity in bank secondary market purchases - for 1997 and 2002 in large MSAs, the point estimate is 0.125 with a standard error of 0.020.33 However, I do not find a difference in that effect across high and low sales tracts. The difference in the point estimates across the two groups is 0.005.
Along these same lines, I test whether non-banks are more likely to sell their loans to banks in low-sales LMI neighborhoods.34 Specifically, I test for a discontinuity in non-banks' share of home purchase loans in low-sales tracts sold to banks. While the point estimate is positive, it is very small - 0.0035 with a standard error of 0.0024. Likewise, the discontinuity in home purchase loans sold to banks as a share of all such loans sold is similar (0.0053).
A final reason that I explore for increased non-bank lending in CRA-targeted tracts stems from the GSE Act, which establishes funding goals for secondary market institutions Freddie Mac and Fannie Mae (the GSEs). The "Special Affordable Goal" (SAG) in particular targets census tracts with
TM ![]() 0.80, similar to the CRA. However, the SAG also requires that the purchased loan be to a borrower with income less than 80% of the MSA median family income
to count towards the GSEs' goal.
0.80, similar to the CRA. However, the SAG also requires that the purchased loan be to a borrower with income less than 80% of the MSA median family income
to count towards the GSEs' goal.
A few considerations suggest that the SAG will not explain the results thus far. First, I know of no reason that the GSE Act should have a differential effect in large MSAs. And second, direct tests suggest that the GSE Act's effect on credit supply is small (Bhutta 2008b). Nevertheless, I test for a confounding GSE effect by measuring the discontinuity in non-bank home purchase lending in low-sales tracts to borrowers with income above the SAG limit. The point estimate (standard error) of 0.103 (0.039) is nearly the same as that in Table 6 (Column 3), suggesting that the SAG is not driving the earlier results.35
5.5. The Effect of CRA on Bank and non-Bank Lending, 2004-2005
In addition to cross-sectional variation in treatment status, TM also varies over time. After each Census, CRA regulators update each tract's assignment variable value (I will refer to the new value as TM![]() and the old value as TM
and the old value as TM![]() . This change generated a set of tracts targeted by CRA
beginning in 200436 that were not targeted in prior years (i.e. TM
. This change generated a set of tracts targeted by CRA
beginning in 200436 that were not targeted in prior years (i.e. TM![]()
![]() 0.80 and TM
0.80 and TM![]()
![]() 0.80) that can be used to estimate CRA's effect more recently.37 For a sample of tracts not targeted prior to 2004, consider the following regression model:
0.80) that can be used to estimate CRA's effect more recently.37 For a sample of tracts not targeted prior to 2004, consider the following regression model:
(5.2)
![]()
where ![]() represents the change across 2004. Equation (5.2) is not identified if unobserved factors drive both changes in treatment status and changes in mortgage activity (i.e.
unobserved deterioration in neighborhood quality could cause both treatment status and mortgage activity to change). However, this situation is similar to the previous case, except that the regressor of interest (
represents the change across 2004. Equation (5.2) is not identified if unobserved factors drive both changes in treatment status and changes in mortgage activity (i.e.
unobserved deterioration in neighborhood quality could cause both treatment status and mortgage activity to change). However, this situation is similar to the previous case, except that the regressor of interest (![]()
![]() is now a deterministic function of two variables instead of just one: TM
is now a deterministic function of two variables instead of just one: TM![]() and TM
and TM![]() . This observation leads to an estimating equation analogous to (4.5) above:
. This observation leads to an estimating equation analogous to (4.5) above:
(5.3)
![]()
where
![]() . To implement (5.3) I substitute for the third term on the right-hand-side a flexible function of TM
. To implement (5.3) I substitute for the third term on the right-hand-side a flexible function of TM![]() and TM
and TM![]() :
:
(5.4)
![]()
where ![]() indexes the polynomial order. The idea of the identification strategy is to compare the change in lending for tracts that just switched to LMI to those
that almost switched into the treatment group - in other words, a difference-in-difference estimate at the cutoff. In order to use more data away from the cutoff, I control for the relationship between the assignment variable
indexes the polynomial order. The idea of the identification strategy is to compare the change in lending for tracts that just switched to LMI to those
that almost switched into the treatment group - in other words, a difference-in-difference estimate at the cutoff. In order to use more data away from the cutoff, I control for the relationship between the assignment variable![]() and loan growth using (5.4).
and loan growth using (5.4).
Table 7 provides group means of various housing and credit flow variables for tracts that switched status in 2004 from non-LMI to LMI ("switchers") versus tracts that remained non-LMI ("non-switchers"). I limit the sample to tracts with TM![]() between 80 and 90 because the vast majority of switchers come from this group. While TM
between 80 and 90 because the vast majority of switchers come from this group. While TM![]() is similar across the two groups (first row, panel A), their TM
is similar across the two groups (first row, panel A), their TM![]() values indicate two groups are trending in opposite
directions. Other characteristics in panels A and B provide further evidence of these divergent trends.38
values indicate two groups are trending in opposite
directions. Other characteristics in panels A and B provide further evidence of these divergent trends.38
The difference between the two numbers in the first row of Panel C provides a basic difference-in-difference (DD) estimate of CRA's effect - a remarkable 15% despite the fact that switching tracts are getting poorer. IMC mortgage growth in switching tracts also exceeds that in non-switching tracts, again implying crowd-in, assuming the DD estimate is well-identified.
Table 8 shows estimates of (5.3). Column 1 provides a DD estimate controlling for MSA and TM![]() , which lowers the coefficients relative to the baseline DD
estimates calculated from Table 7. Columns 2 thru 6 adopt progressively more flexible control function specifications and include covariates in columns 4 and 6 (see table notes for list of covariates). Controlling for TM
, which lowers the coefficients relative to the baseline DD
estimates calculated from Table 7. Columns 2 thru 6 adopt progressively more flexible control function specifications and include covariates in columns 4 and 6 (see table notes for list of covariates). Controlling for TM![]() and its interaction with TM
and its interaction with TM![]() in column 2 reduces the point estimates substantially.
in column 2 reduces the point estimates substantially.
The estimates in columns 2-6 are stable over the various specifications and suggest CRA had a marginal effect of nearly 5% on bank lending. As this result is for a new set of targeted tracts, it bolsters the causal interpretation of the earlier results.
In contrast, Panel B shows that CRA did not affect IMC lending this period. The absence of crowd-in might be explained by the fact that these tracts have just begun being targeted by CRA. Earlier, it was found that CRA did not have an effect on non-bank lending until after 1996. Also, the magnitude of the CRA effect for banks is similar to what it was in the 1994-1996 period (Table 4), and in these years there is no evidence of positive spillovers to IMCs (Table 5).
6. Summary & Discussion
The CRA is a longstanding and large scale government credit market intervention to expand credit market access in low and moderate income (LMI) communities. Much controversy surrounds this regulation because its impact is not well understood. This paper helps inform this debate by exploiting the fact that CRA targets census tracts below a known income cutoff to estimate CRA's causal effect on mortgage credit flow to LMI neighborhoods.
The results indicate that CRA's marginal effect on bank lending is about 3% on average across all MSAs between 1994 and 2002, but the effect appears to be entirely concentrated in large MSAs where banks are most likely to be heavily scrutinized. Separate discontinuity estimates for small and medium MSAs suggest no impact of CRA, in contrast to a 7% discontinuity in large MSAs. I also find, using a modified RD design, a 4-5% increase in bank lending between 2004 and 2005 in large MSA tracts newly targeted due to the release of 2000 Census data.
Focusing on large MSAs, there is no evidence that increased bank lending crowds-out unregulated or partially regulated lenders. On the contrary, I find small increases at the cutoff in lending by banks' mortgage subsidiaries, which may be due directly to CRA, and by unregulated independent mortgage companies. Consistent with a theory of information externalities hampering credit flow in thin markets, the increase in unregulated lending is found only in a subset of census tracts that have had a historically low rate of home sales.
The estimated discontinuity (standard error) for all loan types by all lenders in large MSAs between 1994 and 2002 is 5% (1%), translating into a little more than 65 extra loans and about $8 million ($2007) of additional credit per tract at the cutoff. 39 A notable limitation of the RD design is that it only identifies CRA's impact at the eligibility cutoff. Without making additional assumptions, the RD results say little about CRA's effect away from the cutoff. A reasonable assumption may be that the proportional effect holds for tracts within at least 0.05 of the cutoff. Deflating total credit flow for the 824 sample large MSA tracts with TM between 0.75 and 0.80 establishes a lower bound total impact of 53,000 loans at a value of $6.3 billion.
It is unclear whether increased lending by banks in targeted tracks is efficient. While crowd-in by non-banks points to information externalities generating suboptimal credit supply, the CRA seems too blunt to be motivated primarily as a response to this problem. Credit may be undersupplied more generally because of externalities, inadequate competition in mortgage markets or discrimination. Additional data from other sources on longer term, tract-level outcomes such as loan performance, crime and home values could shed light on these issues.
CRA may also be motivated simply along equity lines. In this regard its success may be clearer, although the possibility exists that CRA encourages banks to engage in deceptive ("predatory") lending practices that harm CRA's intended beneficiaries or excessively risky lending leads to neighborhood decline. Indeed, I do find some evidence that marginal loans are made to atypical borrowers. Nevertheless, analysis of other outcomes as they become available is needed to help us understand more clearly the broader consequences of CRA. This paper establishes motivation for further analysis and a strategy for conducting it.
References
Avery, Robert B., Raphael W. Bostic, and Glenn B. Canner. 2000. "CRA Special Lending Programs" Federal Reserve Bulletin, 86(11): 711-731.
Avery, Robert B., Paul S. Calem, and Glenn B. Canner. 2003. "The Effects of the Community Reinvestment Act on Local Communities" Proceedings.
Avery, Robert B., Kenneth P. Brevoort, and Glenn B. Canner. 2007. "Opportunities and Issues in using HMDA Data" Journal of Real Estate Research, 29(4): 351-380.
Barr, Michael S. 2005. "Credit Where it Counts: The Community Reinvestment Act and its Critics" New York University Law Review, 80(2): 513-652.
Belsky, Eric S., Matthew Lambert, Alexander Von Hoffman, and Nicolas P. Retsinas. 2000. "Insights into the Practice of Community Reinvestment Act Lending: A Synthesis of CRA Discussion Groups" , Joint Center for Housing Studies Working Paper CRA00-1.
Bernanke, Ben S. 2007. "The Community Reinvestment Act: Its Evolution and New Challenges." Speech at The Community Affairs Research Conference, Washington, DC.
Berry, Christopher R. and Sarah L. Lee. 2007. "The Community Reinvestment Act: A Regression Discontinuity Analysis" , Harris School Working Paper Series 07.04.
Bhutta, Neil. 2008a. "The Impact of the Community Reinvestment Act on Mortgage Lending to Lower-Income Borrowers" Ph.D. MIT.
Bhutta, Neil. 2008b. "Regression Discontinuity Estimates of the Effects of the GSE Act of 1992" Ph.D. MIT.
Bostic, Raphael W. and Breck L. Robinson. 2005. "What Makes Community Reinvestment Act Agreements Work? A Study of Lender Responses" Housing Policy Debate, 16(3/4): 513-545.
Bostic, Raphael, Anna Paulson, Hamid Mehran, and Marc Saidenberg. 2005. "Regulatory Incentives and Consolidation: The Case of Commercial Bank Mergers and the Community Reinvestment Act" Advances in Economic Analysis & Policy, 5(1): 1392-1392.
Bostic, Raphael and Brian J. Surette. 2004. "Market Forces Or CRA-Induced Externalities: What Accounts for the Increase in Mortgage Lending to Lower-Income Communities?" Lusk Center for Real Estate Working Paper No. 2004-1013.
Bowyer, Jerry. 2008. "Don't Blame the Markets" The New York Sun. April 18.
Calem, Paul S. and Susan M. Wachter. 1999. "Community Reinvestment and Credit Risk: Evidence from an Affordable-Home-Loan Program" Real Estate Economics, 27(1).
Calem, Paul S. 1996. "Mortgage Credit Availability in Low- and Moderate-Income Minority Neighborhoods: Are Information Externalities Critical?" The Journal of Real Estate Finance and Economics, 13(1): 71-89.
Campen, James T. and Thomas M. Callahan. 2001. "Boston's Soft Second Program: Reaching Low-Income and Minority Home Buyers in a Changing Financial-Services Environment" Proceedings: 363-399.
Canner, Glenn B., Wayne Passmore, and Elizabeth Laderman. 1999. "The Role of Specialized Lenders in Extending Mortgages to Lower-Income and Minority Homebuyers" Federal Reserve Bulletin: 709-726.
Caplin, Andrew and John Leahy. 1998. "Miracle on Sixth Avenue: Information Externalities and Search" Economic Journal, 108(446): 60-74.
Capozza, Dennis R., Ryan D. Israelsen, and Thomas A. Thomson. 2005. "Appraisal, Agency and Atypicality: Evidence from Manufactured Homes" Real Estate Economics, 33(3): 509-537.
Carow, Kenneth A. and Edward J. Kane. 2001. "Event-Study Evidence of the Value of Relaxing Longstanding Regulatory Restraints on Banks, 1970-2000" , NBER 8594.
Chen, David W. 2004. "U.S. Set to Alter Rules for Banks Lending to Poor" New York Times. October 20.
Cleary, Yahonnes and Ken Zimmerman. 2006. "House Rich, Pocket Poor and Under Threat: Home Repair Financing and Homeownership Preservation in New Jersey" , New Jersey Institute for Social Justice Report.
Dahl, Drew, Douglas D. Evanoff, and Michael F. Spivey. 2002. "Community Reinvestment Act Enforcement and Changes in Targeted Lending" International Regional Science Review, 25(3).
Evanoff, Douglas D. and Lewis M. Segal. 1996. "CRA and Fair Lending Regulations: Resulting Trends in Mortgage Lending" Economic Perspectives: 19-46.
Fishbein, Allen J. 1992. "The Ongoing Experiment with 'Regulation from Below': Expanded Reporting Requirements for HMDA and CRA" Housing Policy Debate, 3(2): 601-636.
Garmaise, Mark J. and Tobias J. Moskowitz. 2006. "Bank Mergers and Crime: The Real and Social Effects of Credit Market Competition" Journal of Finance, 61(2): 495-538.
Goldberg, Deborah B. 2000. "The Community Reinvestment Act and the Modernized Financial Services World" ABA Bank Compliance, 21(1): 13.
Gotham, K. F. 2000. "Separate and Unequal: The Housing Act of 1968 and the Section 235 Program" Sociological Forum, 15: 13-37.
Guttentag, Jack M. and Susan M. Wachter. 1980. Redlining and Public Policy. New York: New York University, Graduate School of Business Administration, Salomon Brothers Center for the Study of Financial Institutions.
Harrison, David M. 2001. "The Importance of Lender Heterogeneity in Mortgage Lending" Journal of Urban Economics, 49(2): 285-309.
Haurin, Donald R., Robert D. Dietz, and Bruce A. Weinberg. 2003. "The Impact of Neighborhood Homeownership Rates: A Review of the Theoretical and Empirical Literature" Journal of Housing Research, 13(2).
Imbens, Guido and Thomas Lemieux. 2007. "Regression Discontinuity Designs: A Guide to Practice" , NBER 0337.
Immergluck, Dan and Geoff Smith. 2006. "The External Costs of Foreclosure: The Impact of Single-Family Mortgage Foreclosures on Property Values" Housing Policy Debate, 17(1): 57-79.
Jackson, Kenneth T. 1985. Crabgrass Frontier: The Suburbanization of the United States. New York: Oxford University Press.
Joint Center for Housing Studies. 2002. "The 25th Anniversary of the Community Reinvestment Act: Access to Capital in an Evolving Financial Services System." Ford Foundation Sponsored Report.
Kubrin, Charis E. and Gregory D. Squires. "The Impact of Capital on Crime: Does Access to Home Mortgage Money Reduce Crime Rates?" Paper presented at Annual Meeting of the Urban Affairs Association, Washington, DC.
Lacker, Jeffrey M. 1995. "Neighborhoods and Banking" Economic Quarterly: 13-38.
LaCour-Little, Michael and Stephen Malpezzi. 2003. "Appraisal Quality and Residential Mortgage Default: Evidence from Alaska" The Journal of Real Estate Finance and Economics, 27(2): 211-233.
Lang, William W. and Leonard I. Nakamura. 1993. "A Model of Redlining" Journal of Urban Economics, 33: 223-234.
Li, Wenli. 2005. "Moving Up: Trends in Homeownership and Mortgage Indebtedness" Business Review: 26-34.
Ling, David C. and Susan M. Wachter. 1998. "Information Externalities and Home Mortgage Underwriting" Journal of Urban Economics, 44(3): 317-332.
Litan, Robert E., Noclas P. Retsinas, Eric S. Belsky, and Susan W. Hagg. 2000. "The Community Reinvestment Act After Financial Modernization: A Baseline Report" , U.S. Department of the Treasury Report.
Marsico, Richard D. 2006. "The 2004-2005 Amendments to the Community Reinvestment Act Regulations: For Communities One Step Forward and Three Steps Back" Clearinghouse Review, 39.
Martin-Guerrero, Alvaro. 2002. "Financing Home Improvement Projects: The use of Home-Secured Credit" , Joint Center for Housing Studies Working Paper N02-1.
Meeker, Larry and Forest Myers. 1995. "Community Reinvestment Act Lending: Is it Profitable?" Financial Industry Perspectives: 13-35.
Millon Cornett, Marcia and Sankar De. 1991. "Medium of Payment in Corporate Acquisitions: Evidence from Interstate Bank Mergers" Journal of Money, Credit and Banking, 23(4): 767-76.
National Reinvestment Coalition. 2005. "CRA Commitments: 1977-2005"
---. 2002. "CRA Manual" .
Nichols, Joseph, Anthony Pennington-Cross, and Anthony Yezer. 2005. "Borrower Self-Selection, Underwriting Costs, and Subprime Mortgage Credit Supply" The Journal of Real Estate Finance and Economics, 30(2): 197-219.
Pennington-Cross, Anthony, Anthony Yezer, and Joseph Nichols. 2000. "Credit Risk and Mortgage Lending: Who Uses Subprime and Why?" , Research Institute for Housing America Working Paper No. 00-03.
Quercia, Roberto G., Michael A. Stegman, Walter R. Davis, and Eric Stein. 2001. "Community Reinvestment Lending: A Description and Contrast of Loan Products and their Performance" , Joint Center for Housing Studies Working Paper LIHO-01.11.
Schill, Michael H. and Susan M. Wachter. 1994. "Borrower and Neighborhood Racial and Income Characteristics and Financial Institution Mortgage Application Screening" The Journal of Real Estate Finance and Economics, 9(3): 223-239.
Thomas, Kenneth H. 1998. The CRA Handbook. New York: McGraw-Hill.
Zinman, Jonathan. 2002. "The Efficacy and Efficiency of Credit Market Interventions Evidence from the Community Reinvestment Act" , Joint Center for Housing Studies CRA02-2.
Test of Identification Assumption -
Mortgage Originations Predicted by 1990 Tract Characteristics
Notes: Y-axis values are predicted from coefficients on tract characteristics estimated in a regression of (log) originations between 1994 and 2002 on tract characteristics and MSA fixed effects. Data points represent mean of predicted values for tracts within 0.5 percentage point intervals of TM. Fitted lines generated from regression of predicted values on TM and dummy for CRA cutoff.
Discontinuity in Bank Originations, 1994-2002
Notes: Each data point represents the mean of the Y-axis variable for tracts in 0.5 percentage point bins of TM. Lines are fit from a tract-level regression of the Y-axis variable on TM and a treatment dummy variable.
Falsification Exercise: Discontinuity in Bank Lending at Non-CRA Cutoffs
Notes: Each point represents an estimated discontinuity from a separate regression using a bandwidth of 0.15 around each point and a cubic control function.
Estimated Risk Distribution of Banks' Marginal Home Purchase Loans
(Large MSA's, 1997-2002)
Notes: Labels along X-axis define borrower risk groups. The first group refers to loans not for owner-occupancy. The other five groups refer to quintiles of the estimated risk distribution. See text for estimation strategy and full description of figure.
Estimated Distribution of Banks' Marginal Home Purchase Loans Across Loan Purchasers (Large MSAs 1997-2002)
Notes: Labels along X-axis refer to loan purchaser categories. The first group refers to loans held in portfolio. "GSE" refers to Fannie Mae, Freddie Mac and Ginnie Mae. "Other" refers to loans sold to financial and insurance companies, sold for private securitization or sold to unclassified purchasers. See text for estimation strategy and full description of figure.
| Availability | Description | |
|---|---|---|
| Year | all years | Year of mortgage application or purchase |
| Institution ID | all years | 10 Character Lender Identifier |
| Regulatory Agency ID | all years | Code indicating OCC, Fed, FDIC, OTS, NCUA (credit unions) or HUD as supervisory agency |
| Loan Type | all years | Conventional or government insured (e.g. FHA, VA) |
| Loan Purpose | all years | Home purchase, refinance, home improvement or multifamily (i.e. 5+ family property) |
| Property Type | 2004-2005 | 1-4 Family, manufactured housing or multifamily structure |
| Occupancy | all years | Owner-occupied or investment property/second home |
| Loan Amount | all years | Dollar amount of loan |
| Rate Spread | 2004-2005 | APR spread above comparable Treasury, conditional on the spread exceeding 3 percentage points for first-lien mortgages and 5 percentage-points for subordinate-lien loans |
| HOEPA Status | 2004-2005 | Indicator for high-cost loan (e.g. APR at consummation exceeds yield for comparable Treasury by more than 8 percentage points). |
| Lien Status | 2004-2005 | Loan secured by first or subordinate lien |
| Action Taken | all years | Six possibilities: (1) Loan originated, (2) Borrower rejects lender offer (3) Application denied, (4) Application withdrawn by applicant (5) Application incomplete, (6) Loan purchased by the institution |
| Denial Reason (optional) | all years | Institution can provide primary reason(s) for denial (e.g. credit history, insufficient collateral, debt load, etc) |
| Geography | all years | State, county and census tract of property |
| Income | all years | Gross annual family income, rounded to the nearest thousand dollar |
| Applicant(s) Ethnicity | 2004-2005 | Indicator for being Hispanic/Latino; may not be provided if telephone/internet application. "Hispanic" is a choice under Race variable in prior years |
| Applicant(s) Race | all years | Race of primary applicant; race of co-applicant if applicable. May not be provided if telephone/internet application |
| Applicant(s) Sex | all years | Sex of primary applicant; sex of co-applicant if applicable. May not be provided if telephone/internet application |
| Purchaser | all years | For loans sold at time of origination, specifies purchaser of loan (e.g. Fannie Mae, commercial bank, etc.) |
| (1) 0.95≤TM≤1.05 | (2) 0.70≤TM≤0.80 | (3) 0.80≤TM≤0.90 | (4) p-Value |
|
|---|---|---|---|---|
| Number of Tracts1 | 5826 | 3932 | 5297 |
| (1) 0.95≤TM≤1.05 | (2) 0.70≤TM≤0.80 | (3) 0.80≤TM≤0.90 | (4) p-Value | |
|---|---|---|---|---|
| Banks & Thrifts: Home Purchase Originations | 31.2 | 19.0 | 23.9 | <0.01 |
| Banks & Thrifts: Home Purchase Originations: standard dev. | (29.1) | (17.4) | (21.9) | |
| Banks & Thrifts: Refinance & Home Improvement Originations | 54.5 | 32.3 | 40.9 | <0.01 |
| Banks & Thrifts: Refinance & Home Improvement Originations: standard dev. | (40.0) | (24.8) | (31.3) | |
| Mort Co Subsid: Home Purchase Orig | 27.4 | 16.4 | 20.9 | <0.01 |
| Mort Co Subsid: Home Purchase Orig: standard dev. | (31.3) | (17.8) | (23.3) | |
| Mort Co Subsid: Refi & Home Imprv Orig | 27.3 | 15.1 | 19.5 | <0.01 |
| Mort Co Subsid: Refi & Home Imprv Orig: standard dev. | (26.6) | (14.1) | (18.9) | |
| Indep Mort Co: Home Purchase Orig | 30.5 | 20.0 | 25.0 | <0.01 |
| Indep Mort Co: Home Purchase Orig: standard dev. | (36.5) | (20.6) | (28.1) | |
| Indep Mort Co Refi & Home Imprv Orig | 34.6 | 22.8 | 27.5 | <0.01 |
| Indep Mort Co Refi & Home Imprv Orig: standard dev. | (32.2) | (19.2) | (24.2) |
| (1) 0.95<TM<1.05 | (2) 0.70<TM<0.80 | (3) 0.80≤TM<0.90 | (4) p-Value | |
|---|---|---|---|---|
| Total Housing Units in 1990 | 1917.2 | 1793.2 | 1860.9 | 0.01 |
| Total Housing Units in 1990: standard dev. | (1020.67) | (999.50) | (960.93) | |
| Owner-Occupied Units in 1990 | 1197.5 | 863.9 | 1016.6 | <0.01 |
| Owner-Occupied Units in 1990: standard dev. | (647.16) | (582.07) | (578.82) | |
| Med Value Own-Occ Units in 1990 ($2007) | 160,326.86 | 127,788.33 | 140,115.35 | <0.01 |
| Med Value Own-Occ Units in 1990 ($2007): standard dev. | (98,084.81) | (92,812.21) | (95,221.16) | |
| Prop Units Detached in 1990 | 0.629 | 0.496 | 0.549 | <0.01 |
| Prop Units Detached in 1990: standard dev. | (0.235) | (0.269) | (0.256) | |
| Prop Units Multifamily in 1990 | 0.149 | 0.197 | 0.175 | <0.01 |
| Prop Units Multifamily in 1990: standard dev. | (0.181) | (0.217) | (0.202) | |
| Prop Units Mobile/Trailer in 1990 | 0.067 | 0.069 | 0.076 | 0.04 |
| Prop Units Mobile/Trailer in 1990: standard dev. | (0.109) | (0.133) | (0.126) | |
| Prop Units Built 1980-1989 in 1990 | 0.162 | 0.121 | 0.140 | <0.01 |
| Prop Units Built 1980-1989 in 1990: standard dev. | (0.157) | (0.130) | (0.142) | |
| Prop Units Built 1940-1969 in 1990 | 0.435 | 0.438 | 0.444 | 0.41 |
| Prop Units Built 1940-1969 in 1990: standard dev. | (0.225) | (0.206) | (0.214) | |
| Prop Units Built <1940 in 1990 | 0.178 | 0.264 | 0.221 | <0.01 |
| Prop Units Built <1940 in 1990: standard dev. | (0.196) | (0.248) | (0.225) | |
| Prop non-Hisp Black in 1990 | 0.072 | 0.177 | 0.119 | <0.01 |
| Prop non-Hisp Black in 1990: standard dev. | (0.152) | (0.265) | (0.211) | |
| Prop Hispanic in 1990 | 0.060 | 0.124 | 0.087 | <0.01 |
| Prop Hispanic in 1990: standard dev. | (0.113) | (0.197) | (0.156) | |
| Prop of Pop 65+ Years in 1990 | 0.133 | 0.137 | 0.140 | 0.17 |
| Prop of Pop 65+ Years in 1990: standard dev. | (0.070) | (0.079) | (0.074) | |
| Prop Living in Group Qtrs in 1990 | 0.014 | 0.016 | 0.015 | 0.28 |
| Prop Living in Group Qtrs in 1990: standard dev. | (0.031) | (0.036) | (0.034) |
| (1) | (2) | (3) | (4) | (5) | (6) | (7) | |
|---|---|---|---|---|---|---|---|
| All MSA's: 1[TM < 0.80] (coeff) | 0.0680 | 0.0312 | 0.0381 | 0.0337* | 0.0348** | 0.0267** | 0.0301** |
| All MSA's: 1[TM < 0.80] (stnd error) | (0.0529) | (0.0388) | (0.0273) | (0.0187) | (0.0151) | (0.0113) | (0.0131) |
| All MSA's: R-Squared | 0.007 | 0.404 | 0.673 | 0.868 | 0.864 | 0.877 | 0.877 |
| All MSA's: # Tracts | 4708 | 4708 | 4708 | 4708 | 13633 | 25445 | 25445 |
| Small MSAs: 1[TM < 0.80] (coeff) | -0.0323 | -0.0637 | 0.0120 | -0.0045 | 0.0016 | -0.0048 | -0.0040 |
| Small MSAs: 1[TM < 0.80] (stnd error) | (0.0798) | (0.0779) | (0.0562) | (0.0348) | (0.0245) | (0.0189) | (0.0222) |
| Small MSAs: R-Squared | 0.011 | 0.473 | 0.748 | 0.889 | 0.873 | 0.883 | 0.883 |
| Small MSAs: # Tracts | 1266 | 1266 | 1266 | 1266 | 3716 | 7143 | 7143 |
| Medium MSAs: 1[TM < 0.80] (coeff) | 0.0837 | 0.0698 | 0.0061 | 0.0114 | 0.0146 | 0.0015 | 0.0030 |
| Medium MSAs: 1[TM < 0.80] (stnd error) | (0.0717) | (0.0642) | (0.0413) | (0.0299) | (0.0231) | (0.0173) | (0.0203) |
| Medium MSAs: R-Squared | 0.009 | 0.289 | 0.609 | 0.860 | 0.853 | 0.868 | 0.869 |
| Medium MSAs: # Tracts | 1642 | 1642 | 1642 | 1642 | 4796 | 8751 | 8751 |
| Large MSAs: 1[TM < 0.80] (coeff) | 0.1257 | 0.0506 | 0.0782* | 0.0764** | 0.0716*** | 0.0729*** | 0.0778*** |
| Large MSAs: 1[TM < 0.80] (stnd error) | (0.1111) | (0.0630) | (0.0431) | (0.0274) | (0.0222) | (0.0158) | (0.0182) |
| Large MSAs: R-Squared | 0.005 | 0.449 | 0.684 | 0.869 | 0.871 | 0.880 | 0.880 |
| Large MSAs: # Tracts | 1800 | 1800 | 1800 | 1800 | 5121 | 9551 | 9551 |
| Bandwidth | 0.05 | 0.05 | 0.05 | 0.05 | 0.15 | 0.30 | 0.30 |
| Control Function | linear | linear | linear | linear | cubic | cubic | quintic |
| MSA Fixed Effects | Y | Y | Y | Y | Y | Y | |
| Tract Size Control1 | Y | Y | Y | Y | Y | ||
| Other Tract Covariates2 | Y | Y | Y | Y |
1 log total number of housing units in 1990.
2 See Table 2 for list of covariates and description in text. Regressions in columns 5-7 include variable indicating for TM≤ 0.90 to control for potential effects of the GSE Act. Small MSAs are those with popualation <500k, medium MSAs have population between 500k and 2 million, and large MSAs are those with population >2 million according to 1990 Census. Mean of outcome variable (per year) for selected sample in italics and measured using tracts just above cutoff (0.80 ≤ TM <0.82)
| (1) All Loan Types, 1994-96 | (2) All Loan Types, 1997-02 | (3) Home Purchase Loans, 1994-96 | (4) Home Purchase Loans, 1997-02 | (5) Refi & Home Imprv Loans, 1994-96 | (6) Refi & Home Imprv Loans, 1997-02 |
|
|---|---|---|---|---|---|---|
| Originations: mean1 | 41.4 | 64.9 | 17.3 | 22.1 | 24.1 | 42.8 |
| Originations: 1[TM < 0.80] (coeff) | 0.0424** | 0.0821*** | 0.0430** | 0.0845*** | 0.0303 | 0.0812*** |
| Originations: 1[TM < 0.80] (stnd error) | (0.0198) | (0.0195) | (0.0183) | (0.0207) | (0.0248) | (0.0247) |
| Originations: R-Squared | 0.856 | 0.865 | 0.770 | 0.785 | 0.851 | 0.875 |
| Originations: N | 9548 | 9551 | 9518 | 9547 | 9539 | 9551 |
| Applications: mean | 67.9 | 118.0 | 24.9 | 33.4 | 43.1 | 84.6 |
| Applications:: 1[TM < 0.80] (coeff) | 0.0319* | 0.0633*** | 0.0213 | 0.0713*** | 0.0327* | 0.0585*** |
| Applications: 1[TM < 0.80] (stnd error) | (0.0164) | (0.0150) | (0.0174) | (0.0172) | (0.0174) | (0.0165) |
| Applications: R-Squared | 0.860 | 0.870 | 0.773 | 0.782 | 0.866 | 0.883 |
| Applications: N | 9551 | 9551 | 9540 | 9551 | 9550 | 9551 |
| Amount Originated: mean ($000's)2 | 3,620.77 | 7,744.20 | 2,056.80 | 3,202.10 | 1,563.97 | 4,542.10 |
| Amount Originated: 1[TM < 0.80] (coeff) | 0.0436* | 0.0699*** | 0.0427* | 0.0872*** | 0.0277 | 0.0571** |
| Amount Originated: 1[TM < 0.80] (stnd error) | (0.0235) | (0.0202) | (0.0240) | (0.0229) | (0.0278) | (0.0220) |
| Amount Originated: R-Squared | 0.811 | 0.837 | 0.763 | 0.780 | 0.784 | 0.853 |
| Amount Originated: N | 9548 | 9551 | 9518 | 9547 | 9539 | 9551 |
1 Means of outcome variables in levels (per year), calculated using tracts just above cutoff (0.80 ≤TM <0.82).
2 Adjusted to year 2007 dollars using CPI-U.
| (1) Indep Mort Co, 1994-96 |
(2) Indep Mort Co, 1997-02 |
(3) Mort Co Subsid, 1994-96 |
(4) Mort Co Subsid, 1997-02 |
|
|---|---|---|---|---|
| Originations: mean1 | 37.9 | 63.3 | 18.8 | 53.9 |
| Originations: 1[TM < 0.80] (coeff) | 0.0060 | 0.0335** | 0.0496** | 0.0376** |
| Originations: 1[TM < 0.80] (stnd error) | (0.0196) | (0.0143) | (0.0177) | (0.0181) |
| Originations: R-Squared | 0.782 | 0.825 | 0.804 | 0.856 |
| Originations: N | 9548 | 9551 | 9514 | 9551 |
| Applications: mean | 71.5 | 142.5 | 28.1 | 87.0 |
| Applications: 1[TM < 0.80] (coeff) | -0.0043 | 0.0229 | 0.0500** | 0.0363** |
| Applications: 1[TM < 0.80] (stnd error) | (0.0202) | (0.0159) | (0.0185) | (0.0164) |
| Applications: R-Squared | 0.780 | 0.821 | 0.811 | 0.850 |
| Applications: N | 9551 | 9551 | 9536 | 9551 |
| Amount Originated: mean ($000's)2 | 41,694.33 | 82,478.17 | 22,533.33 | 78,939.33 |
| Amount Originated: 1[TM < 0.80] (coeff) | -0.0043 | 0.0376* | 0.0556** | 0.0381 |
| Amount Originated: 1[TM < 0.80] (stnd error) | (0.0257) | (0.0182) | (0.0229) | (0.0238) |
| Amount Originated: R-Squared | 0.761 | 0.791 | 0.792 | 0.838 |
| Amount Originated: N | 9548 | 9551 | 9514 | 9551 |
1 Means of outcome variables in levels, calculated using tracts just above cutoff (0.80 ≤ TM < 0.82).
2 Adjusted to year 2007 dollars using CPI-U.
| (1) Banks, Low Sales Tracts |
(2) Banks, High Sales Tracts |
(3) Indep Mort Co, Low Sales Tracts |
(4) Indep Mort Co, High Sales Tracts |
|
|---|---|---|---|---|
| mean | 19.5 | 24.8 | 24.6 | 32.6 |
| 1[TM < 0.80] (coeff) | 0.0876*** | 0.0922*** | 0.0882** | 0.0037 |
| 1[TM < 0.80] (stnd error) | (0.0293) | (0.0278) | (0.0317) | (0.0320) |
| R-Squared | 0.801 | 0.792 | 0.770 | 0.778 |
| N | 4759 | 4788 | 4762 | 4785 |
| Switchers | non-Switchers | P-Value | |
|---|---|---|---|
| Tract Characteristics: TM, 1990 | 84.47 | 85.49 | < 0.01 |
| Tract Characteristics: TM, 1990 stnd error | (0.11) | (0.12) | |
| Tract Characteristics: TM, 2000 | 71.36 | 91.96 | < 0.01 |
| Tract Characteristics: TM, 2000 stnd error | (0.63) | (0.66) | |
| Tract Characteristics: Med. Fam Inc, 1990 | $35,028.21 | $35,961.18 | 0.17 |
| Tract Characteristics: Med. Fam Inc, 1990 stnd error | (1053.85) | (1254.41) | |
| Tract Characteristics: Med. Fam Inc, 2000 | $41,313.65 | $53,035.66 | < 0.01 |
| Tract Characteristics: Med. Fam Inc, 2000 stnd error | (1723.38) | (1839.21) | |
| Tract Characteristics: Owner-Occ Units, 1990 | 813.55 | 955.72 | 0.02 |
| Tract Characteristics: Owner-Occ Units, 1990 stnd error | (104.37) | (59.32) | |
| Tract Characteristics: Owner-Occ Units, 2000 | 833.33 | 1097.99 | < 0.01 |
| Tract Characteristics: Owner-Occ Units, 2000 stnd error | (103.46) | (83.06) | |
| Tract Characteristics: Total Housing Units, 1990 | 1756.06 | 1708.48 | 0.34 |
| Tract Characteristics: Total Housing Units, 1990 stnd error | (82.89) | (66.91) | |
| Tract Characteristics: Total Housing Units, 2000 | 1812.24 | 1881.11 | 0.29 |
| Tract Characteristics: Total Housing Units, 2000 stnd error | (80.80) | (91.60) | |
| Tract Characteristics: Med House Value, 1990 | $111,486.50 | $115,514.20 | 0.67 |
| Tract Characteristics: Med House Value, 1990 stnd error | (16,380.98) | (13,126.07) | |
| Tract Characteristics: Med House Value, 2000 | $135,655.60 | $153,274.10 | 0.11 |
| Tract Characteristics: Med House Value, 2000 stnd error | (17,466.56) | (12,803.15) | |
| Bank Lending: Change (log) Originations, 2001/02 - 2004/05 | 0.3057 | 0.1555 | < 0.01 |
| Bank Lending: Change (log) Originations, 2001/02 - 2004/05 stnd error | (0.060) | (0.057) | |
| Bank Lending: Bank Originations, 2001/02 | 118.66 | 193.71 | < 0.01 |
| Bank Lending: Bank Originations, 2001/02 stnd error | (18.51) | (20.34) | |
| Bank Lending: Change (log) Bank Originations, 1998/99 - 2001/02 | 0.2373 | 0.317 | 0.03 |
| Bank Lending: Change (log) Bank Originations, 1998/99 - 2001/02 stnd error | (0.056) | (0.047) | |
| Indep Mort Co Lending: Change (log) Originations, 2001/02 - 2004/05 | 0.486 | 0.381 | < 0.01 |
| Indep Mort Co Lending: Change (log) Originations, 2001/02 - 2004/05 stnd error | (0.062) | (0.046) | |
| Indep Mort Co Lending: Originations, 2001/02 | 115.30 | 162.54 | < 0.01 |
| Indep Mort Co Lending: Originations, 2001/02 stnd error | 18.83 | 20.50 | |
| Indep Mort Co Lending: Change (log) Originations, 1998/99 - 2001/02 | 0.079 | 0.179 | < 0.01 |
| Indep Mort Co Lending: Change (log) Originations, 1998/99 - 2001/02 stnd error | (0.053) | (0.035) |
| (1) | (2) | (3) | (4) | (5) | (6) | |
|---|---|---|---|---|---|---|
| Banks: 1[switch=1] (coefficient) | 0.1086*** | 0.0588* | 0.0385 | 0.0473** | 0.0476* | 0.0450* |
| Banks: 1[switch=1] (stnd. error) | (0.0216) | (0.0338) | (0.0251) | (0.0205) | (0.0251) | (0.0223) |
| Banks: R-Squared | 0.462 | 0.466 | 0.471 | 0.570 | 0.472 | 0.570 |
| Banks: N | 1662 | 1662 | 1662 | 1660 | 1662 | 1660 |
| Independent Mortgage Company: 1[switch=1] (coefficient) | 0.0664** | -0.0208 | 0.0087 | 0.0031 | 0.0205 | 0.0018 |
| Independent Mortgage Company: 1[switch=1] (stnd. error) | (0.0282) | (0.0281) | (0.0291) | (0.0223) | (0.0237) | (0.0193) |
| Independent Mortgage Company: R-Squared | 0.292 | 0.302 | 0.305 | 0.411 | 0.306 | 0.411 |
| Independent Mortgage Company: N | 1651 | 1651 | 1651 | 1645 | 1651 | 1645 |
| Control Function Specification1 | k=0 | k=1 | k=3 | k=3 | k=4 | k=4 |
| Covariates2 | no | no | no | yes | no | yes |
1 See text (Section 5.5) for details on control function specification.
2 Covariates include (log) number owner-occ units in 2000, (log) med house value in 2000, (log) total housing units in 1990, change in (log) median family income from 1990 to 2000 and growth in originations between 1998/99 and 2001/02.