
The Role of the Securitization Process in the Expansion of Subprime Credit
Keywords: Securitization, subprime mortgages, financial intermediation.
Abstract:
We analyze the structure and attributes of subprime mortgage-backed securitization deals originated between 1997 and 2007. Our data set allows us to link loan-level data for over 6.7 million subprime loans to the securitization deals into which the loans were sold. We show that the securitization process, including the assignment of credit ratings, provided incentives for securitizing banks to purchase loans of poor credit quality in areas with high rates of house price appreciation. Increased demand from the secondary mortgage market for these types of loans appears to have facilitated easier credit in the primary mortgage market. To test this hypothesis, we identify an event which represents an external shock to the relative demand for subprime mortgages in the secondary market. We show that following the SEC's adoption of rules reducing capital requirements on certain broker dealers in 2004, five large deal underwriters disproportionately increased their purchasing activity relative to competing underwriters in ZIP codes with the highest realized rates of house price appreciation but lower average credit quality. We show that these loans subsequently defaulted at marginally higher rates. Finally, using the event as an instrument, we demonstrate a causal link between the demand for mortgages in the secondary mortgage market and the supply of subprime credit in the primary mortgage market.
1 Introduction
It is widely believed that a misallocation of resources to the real estate sector, facilitated by the practice of securitization, is one of the causes of the current financial crisis (Diamond and Rajan (2009)). Krugman (2007) summarized the issue, "....in the later stages of the great 2000-2005 housing boom, banks were making a lot of dubious loans. Yet the banks making the loans weren't stupid: they passed the buck to other people. Subprime mortgages and other risky loans were securitized." Nonetheless, despite the obvious intuitive link, little empirical evidence exists on the relationship between the securitization process (i.e., how deals are put together and assigned credit ratings) and the extension of subprime credit.
This paper provides empirical evidence on the linkage between the securitization process and the extension of subprime credit. It relies on a sample of 1,267 subprime mortgage-backed securitization deals originated between 1997 and 2007 as well as data on the 6.7 million loans which serve as collateral within these deals. The data set allows us to analyze the attributes of subprime securitization deals and deal ratings as a function of the deal collateral. Our sample identifies the deal underwriter for each of the securitized loans, allowing for an investigation of the loan purchasing decisions of investment banks involved in securitization as well as the performance of the loans purchased by each securitizing bank. Finally, our data set also allows us to link securitization activity in the secondary market to data on the extension of subprime loans in the primary mortgage market.
Our empirical analysis examines a number of hypotheses motivated by theories of securitization. Ratings arbitrage implies that banks seek to structure the cheapest portfolio of loans that would deliver favorable credit ratings (Coval, Jurek, and Stafford (2007), Brennan, Hein, and Poon (2008)) . We investigate empirically how the structure and ratings of subprime residential mortgage-backed securitization deals affect the incentives driving the loan purchase decisions of investment banks that underwrite securitization deals. A second hypothesis suggests that because secondary markets seek to efficiently diversify risk across investor preferences and regions, a healthy secondary market should increase borrowers' access to credit. We examine how the process of selling loans to the secondary market impacts the extension of credit in the primary market.
Our analysis yields three key results. First, all else equal, mortgage pools concentrated in areas with higher than average realized rates of house price appreciation received AAA ratings on a larger percentage of their deal's principal. Our results imply that, on average, a 5% increase in the deal's average one-year lagged rate of house price appreciation (one of our proxies for expected appreciation) is associated with a 1.0% to 3.5% increase in the percentage of a deal's principal receiving a AAA rating (one standard deviation in the percent rated AAA is 6.4%). This is an economically meaningful result because deals with a larger portion of the deal principal rated AAA can fund the purchase of the underlying loan collateral at a lower cost. The cost of funds is lower because the structured investment vehicle (SIV) which issues the bonds can issue bonds with lower average coupon payments (higher prices).2 If higher rates of house price appreciation can lower the cost of funding a deal by delivering better credit ratings, the secondary mortgage market should demand loans in rapidly appreciating housing markets.
Our second key result provides evidence consistent with the hypothesis that investment banks would seek to purchase the cheapest portfolio of loans that would deliver marketable credit ratings. To the extent that house price appreciation delivers favorable credit ratings, deal underwriters would seek to purchase mortgages of a lower credit quality (and thus "cheap") that are concentrated in areas with high rates of house price appreciation. Using an event to deal with the endogeneity of mortgage demand from the primary market, we show that certain investment banks increased their relative demand for subprime loans disproportionately in ZIP codes with the highest rates of house price appreciation but lower average credit quality (e.g., in the form of loans with high loan-to-value ratios). We demonstrate that investment banks purchased 6% more loans than their competitors in ZIP codes that experienced 5% higher realized rates of house price appreciation. While higher rates of house price appreciation deliver favorable credit ratings, poor credit quality loans would presumably be cheaper to purchase. Our results show that investment banks, on average, purchased 5% more loans than their competitors in ZIP codes with 5% higher loan-to-value ratios. We believe our evidence on the purchasing activity of investment banks provides some evidence consistent with a theory of "ratings arbitrage." We also acknowledge that because we do not have wholesale prices of the underlying mortgage loan collateral, we cannot convincingly demonstrate that poor quality loans in areas with higher house price appreciation are indeed cheaper to purchase.3 However, the loans purchased by investment banks which increased their relative demand for subprime loans defaulted at marginally higher rates.
In theory, increased demand from the secondary mortgage market for loans should facilitate easier credit in the primary market. Secondary markets, when functioning properly, efficiently allocate risk across geographies and risk preferences and consequently lower the cost of credit in the primary market. However, little empirical evidence exists regarding the impact of secondary market activity on access to credit in the primary mortgage market.4 Using our sample of subprime mortgages only, and an event which identifies a relative shift in the demand for subprime loans from the secondary mortgage market, we identify a causal relationship between mortgage demand in the secondary market and credit supply in the primary mortgage market. Our third key result is that in 2005, on average, a 10% increase (close to one standard deviation) in the percentage of originated subprime loans being sold to the secondary market results in the origination of an additional 4 subprime loans per 100 housing units (over one-half standard deviation). Though the result is intuitive, we believe a careful identification of the impact of securitization on the extension of mortgage credit is an important contribution given the recent boom in securitization activity.
To address concerns about the endogeneity of mortgage demand between the primary and secondary mortgage markets, we identify an event which represents an external shock to the relative demand for subprime mortgages in the secondary market.5 In October 2003, the SEC proposed amending a series of rules which reduced capital requirements on certain broker-dealers.6 The rule change came in response to The European Union's (EU) Conglomerates Directive which required that affiliates of U.S. broker-dealers be subject to consolidated supervision by a U.S. regulatory authority. Formally adopted in April 2004, the rule change established an alternative method of calculating capital requirements for the largest independent broker-dealers that were not already subject to capital regulation from a regulatory authority. Broker-dealers taking advantage of the alternative capital contribution would be classified as a "Consolidated Supervised Entity (CSE)" and would realize an estimated 30-40% reduction in capital deductions. In short, we argue that in 2004 the event endowed five of the largest broker-dealers with additional capital which could be used to increase production of securitization deals.7 Because we know which banks owned which loans serving as collateral in securitization deals, we examine whether the five CSE banks did indeed increase their demand for subprime mortgages relative to competitor banks that did not experience a change in capital requirements. Further, we can analyze the attributes of the ZIP codes where the five CSE banks increased their purchasing activity following the event, and how those loans subsequently performed. Finally, because we know where the banks increased their relative demand, we can investigate how the increase in demand from the secondary market (which is, by the nature of the event, presumed to be exogenous to primary mortgage market demand) impacted the supply of subprime credit in the primary market.
Aside from the considerable interest subprime loans have received from the media and investment community, it is important to consider why the subprime experience should matter outside an isolated episode. We believe the subprime episode can be used as a laboratory in which we can better understand the practice of asset securitization. (After all, in a world of perfect capital markets, why should the repackaging of cash flows be a profitable enterprise?) Prior literature attributes the profitable practice of pooling and tranching cash flows to the presence of asymmetric information (DeMarzo (2005)), or incomplete markets (Gaur, Seshadri, and Subrahmanyam (2003)). Two recent studies, relying on the assumption that investors purchase bonds based solely on credit ratings, explain the proliferation of securitization activity to the potential for deal arrangers to deliver the cheapest possible set of assets that can obtain a high quality credit rating. Coval, Jurek, and Stafford (2007) conclude that "the growth of the credit tranche market can potentially be explained as an endogenous, institutional response to an arbitrage opportunity in the credit markets." In particular, the authors argue that because credit ratings do not account for the state in which defaults occur, "naïve" prices based solely on ratings will not account for systematic, priced risk factors. Brennan, Hein, and Poon (2008) also attribute the existence of pooling and tranching to potential "ratings arbitrage."
Recent literature on the subprime crisis addresses a number of questions relevant to this paper. Gorton (2008) explains the importance of house price appreciation in the design of subprime mortgage contracts when he argues, "the defining feature of the subprime mortgage is the idea that the borrower and lender can benefit from house price appreciation over short horizons." Our study identifies the importance of house price appreciation in the secondary market for subprime mortgage loans. Mian and Sufi (2008) argue that a shift in the supply of credit made to subprime borrowers caused an increase in house prices and subsequent default rates. They attribute the increase in credit supply to the existence of securitization. While an increase in the supply of credit caused an increase in house prices, our results show how rates of house price appreciation themselves could affect the supply of credit. Our results also build upon Mian and Sufi (2008) in that we identify how, and not just whether, the securitization process may have caused an unexpected increase in credit supply.
Dell'Ariccia, Igan, and Laeven (2008) demonstrate that lending standards declined in areas of high home price appreciation and attribute the decline in lending standards to increased competition among lenders. Keys, Mukherjee, Seru, and Vig (2008) show that securitized loans with a credit score slightly above the traditional subprime threshold (FICO 620) were 20% more likely to default than securitized loans slightly below the subprime threshold. The result is interpreted as evidence that the prospect of selling loans to secondary markets reduces lenders' incentives to screen borrowers carefully. Demyanyk and Van Hemert (2008) find that credit quality was inexplicably low during 2006-2007, even after controlling for house price appreciation. Ashcraft, Goldsmith-Pinkham, and Vickery (2009) investigate whether potential incentive conflicts of credit rating agencies led to ratings inflation. This paper, to the best of our knowledge, is unique in exploring empirically the subprime securitization process, the purchasing behavior of investment banks underwriting the securitization deals, and the resultant impact on the supply of subprime credit.
Our paper is organized as follows. Section 2 describes our data. In section 3 we motivate and test our hypotheses regarding the impact of home prices on the structure of securitization deals. Section 4 examines the purchasing behavior of underwriting banks. Section 5 evaluates the impact of secondary market demand on the extension of credit in the primary market. Section 6 concludes. Appendix 1 contains a detailed description of the institutional features involved in the securitization of subprime mortgage loans. Appendix 2 discusses data issues not discussed in the body of the paper.
Section 2: Data and Summary Statistics
Section 2a: Data
The majority of our empirical work analyzes the structure of securitization deals, the loan purchasing behavior of deal underwriters, and the performance of the purchased loans. In the context of this analysis, we rely on the intersection of two data sets provided by LoanPerformance and ABSNet. Our analysis of the link between activity in the secondary market and the extension of credit in the primary mortgage market employs mortgage origination data from the Home Mortgage Disclosure Act (HMDA) data set, as well as the secondary market activity from LoanPerformance. We next provide a description of the three main data sets, as well as a brief description of some of the ancillary data used in our analysis.
LoanPerformance, a subsidiary of First American Trust, reports borrower attributes and loan information for about 75% of all subprime securitization deals over the past 10 years.8 Important loan-level attributes include borrower FICO scores, cumulative loan-to-value ratios, debt-to-income ratios, loan type, and the level of income documentation supporting the loan. LoanPerformance also tracks the performance of subprime mortgage loans, a feature we exploit later in our analysis. ABSNet, a subsidiary of Standard and Poor's, contains summary information on the structure and rating of residential mortgage-backed securitization deals. The deal summary from ABSNet contains data on the total size of the securitization deal as well as the size and original credit rating of each tranche included in the deal. We measure rates of house price appreciation at the ZIP-code and state levels using house price indexes constructed by LoanPerformance.9 We obtain state-level unemployment data made available by the Bureau of Labor Statistics (BLS).
In analyzing deal structure and credit ratings, our primary unit of analysis is at the deal level. We take the following steps to identify and aggregate residential subprime loan data to the deal level. First, we obtain the deal summary for residential mortgage-backed securitization deals originated between 1997 and 2007 from ABSNet. The deal summary from ABSNet includes information on the date of issuance and the total deal amount. It also includes the original credit rating, original principal amount of each tranche, and tranche CUSIPs (each tranche, or bond, has a unique CUSIP). ABSNet does not classify the residential securitization deals as being subprime. We rely on the classification of subprime loans provided by LoanPerformance. No unique numerical identifier exists between the deal summary data from ABSNet and the LoanPerformance database, so we match these data by hand using deal names. The total number of subprime deals included in our sample is dictated by the number of subprime deals in the LoanPerformance database that can be matched to the universe of ABSNet deals by hand, which totals 1,315 subprime deals.10 We drop 48 deals from the sample because they do not have sufficient ratings information to properly quantify the structure of the deal. We double check that our hand-matching process correctly matched the LoanPerformance and ABSNet data by examining a sub-sample of deal names and deal summaries from Bloomberg.
We use the deal summary from ABSNet and complementary data from Bloomberg which classifies each tranche's bond type to compute the amount of each deal rated AAA or investment grade. When possible, we use the S&P rating to determine the original credit rating of each tranche. In the few cases where S&P ratings do not exist, we use ratings provided by Moody's. The proportion of a deal rated AAA is calculated as the sum of the tranches with AAA ratings divided by the total deal balance. We provide the details of a sample deal named GSAMP Trust 2006 NC-1 in Figure 1. Figure 1 reports the amount of principal contained in each tranche, the original credit rating, the first coupon payment that was made to investors, and the coupon spread over the relevant risk free reference rate (1-month LIBOR in the case of floating rate tranches).
The median securitization deal in our sample has 5,219 mortgage loans serving as collateral. We aggregate the loan data from LoanPerformance to the deal level by taking the loan-weighted average of each deal attribute. We outline this process in the data appendix. We match rates of house price appreciation to the data in three steps. First we match ZIP-code house price indexes to loans according to the ZIP code reported in the loan documentation from Loan Performance. If a house price index is not available for the ZIP code, we use state-level house price indexes.11 After matching individual loans with their respective rates of house price appreciation we aggregate the house price appreciation rates to the deal level using individual loan sizes within each deal as weights. Finally, we merge unemployment rates to the deal level using the state unemployment data. The final deal-level data set includes 1,267 securitization deals, 6.7 million loans that serve as collateral in the deals, unemployment rates from 50 states, and house price appreciation data at the ZIP-code and state levels. Some of the deals in our sample do not have data on certain attributes of the collateral. The most frequent attribute unavailable in the loan level data is the debt-to-income ratio of the borrower. Our final estimation sample of 1,225 deals only employs deals for which data on every attribute is available.12
Our analysis of mortgage originations requires the use of data made available under the Home Mortgage Disclosure Act, which requires mortgage originators to report statistics on the attributes of mortgage applications and originations. Avery, Brevoort, and Canner (2007) report that HMDA data cover an estimated 80% of all mortgage activity nationwide. In 2004, originators began reporting whether the interest rate being charged on a mortgage loan was three percentage points greater than the rate on a comparable-maturity Treasury security. Loans with at least a three percent rate spread are deemed "higher-priced" loans, and are frequently used as a proxy for subprime loans in the literature. We discuss the potential bias associated with using "higher-priced" loans as a proxy for subprime loans in the appendix. We also refer the interested reader to a more thorough description of the HMDA higher-priced data and various definitions of subprime mortgages provided by Mayer and Pence (2008).
Our analysis of the primary mortgage market also requires data on the credit attributes of all potential borrowers within a given ZIP code. Equifax provides a file of the share of tract residents (which we aggregate to ZIP codes) with high, medium, and low credit scores. In our effort to control for factors that influence mortgage demand in the primary market, we utilize data on median income levels, housing units, ownership rates, and construction permits made available from the Census Bureau. The data appendix contains a more detailed description of each of the data sources used in our final dataset.
Section 2b: Summary Statistics
Table 1 reports summary statistics on the attributes of securitization deals for the entire sample. The average subprime deal has a loan-weighted median FICO score of 621, a median combined loan-to-value ratio of 84% and a debt-to-income ratio of 41%. The median proportion of the deal with investment-grade ratings is 96.5%, while the median deal has an excess spread of 364 basis points.13 The median unemployment rate at deal origination was 5.1%, the median house price appreciation in the year preceding deal origination was 13.4%, and median overvaluation was 7%.14
Table 2 reports summary statistics through time and reveals a substantial increase in the number of securitization deals originated over the last decade. More deals were originated in 2005 and 2006 alone than in the entire preceding nine years combined. The principal included in the deals was also substantially larger, having increased from an average size of $478 million in 2000 to over $1 billion in 2006. Table 2 also highlights an important trend in the structure of securitization deals through time. The proportion of each deal that was rated investment grade declined almost monotonically since 2001.15 In 2001, the typical deal had 88.0% of the principal rated AAA, compared to just 75.5% in 2007. The monotonic decline is opposite of the marked inter-temporal decline in the amount of excess spread for the typical deal.16 Table 2 also documents the time series pattern in the default rate of loans in each deal. The default rate is calculated as the total number of loans in the process of foreclosure or already foreclosed in the year after the deal was originated divided by the total number of loans in the securitization deal. As an example, the numerator in the default rate for deals originated in 2006 is calculated as the total number of defaulted loans by the end of 2007.
Table 3 reports the time series attributes of the loan characteristics of each deal as well as average rates of house price appreciation. FICO scores generally increased through the sample period, as did loan-to-value and debt-to-income ratios. The percentage of loans originated with adjustable rates also increased substantially throughout the sample period. In general, aside from FICO scores, Table 3 reveals deterioration in the quality of the subprime loans being securitized through time, a pattern also identified by Demyanyk and Van Hemert (2008) and Mayer, Pence, and Sherlund (2009). Rates of house price appreciation rose dramatically over the sample period, reaching their peak in 2005. The unemployment rate varied little, ranging from a low of 3.97% in 2000 to a high of 6.13% in 2003. Table 4 documents the time series attributes of our bank-ZIP-year panel data set. While the time-series attributes of the bank-ZIP-year panel are similar to the time-series data at the deal level, the table provides a snapshot of the difference in ZIP-code attributes of loans owned by CSE banks and non-CSE banks.
Panel A of Table 5 reports statistics on the number of subprime originations per housing unit using higher-priced origination data from HMDA and housing unit data from the Census. We limit our analysis of origination patterns to a cross-section of ZIP codes in 2005 because of the timing of the SEC change in capital requirement rules and because of data availability. The remainder of the table reports the percent of originated subprime loans that are sold to the secondary market, mortgage denial rates, and data on changes in the market share of the five CSE banks. In 2005, on average, 5.8% of all housing units were financed with "higher-priced" loans, our proxy for subprime loans in the origination market. "Higher priced" loans were sold to the secondary market 68.5% of the time, on average. CSE banks increased their market share in each ZIP code by an average of 61% from 2003-2005, a feature of the data we exploit later in our analysis.
Section 3: The Determinants of Securitization Deal Structure and Deal Ratings
Section 3a: The Economics of the Securitization Structure
In this section we examine how the credit ratings of securitization deals are determined by the deal collateral. In particular, we focus on the role of house price appreciation in the rating and securitization process. We also analyze how the collateral impacts the cost of funds for the deal. Before discussing our empirical strategy and results, we briefly discuss an important institutional feature of a securitization structure.
The structured investment vehicle (SIV) established by investment banks for the purpose of issuing securitized bonds has cash outflows and inflows. The largest cash outflow is the cost of purchasing the portfolio of mortgage collateral from loan originators. The largest cash inflow is the gain on the sale of the bonds issued by the trust and sold to investors. It is in this way that the credit rating of a securitization deal impacts the cash inflows of the trust, also referred to as the cost of funds. Bonds rated AAA have lower coupon payments (higher prices) than bonds with worse ratings.17 Thus, the gains of a securitization deal should be increasing in the overall credit rating of the deal. This is the basis for our assumption that banks will seek to purchase loans that maximize the potential credit rating of a deal. Figure 1 presents the details of GSAMP Trust 2006 NC-1, a sample deal from our data. The figure documents a monotonic increase in coupon payments as tranche credit quality decreases. This pattern should be consistent across all the deals in our sample, as coupon payments should be positively related to tranche credit quality.
The structure of securitization deals matters for a second reason. On average, deal underwriters paid themselves an origination fee of 1 to 1.5% of the deal principal.18 In order for deals to receive high quality credit ratings, deals typically require some amount of over-collateralization, also known as the equity tranche. The size of the equity tranche depends on the quality of the underlying collateral - lower quality deals require a larger equity tranche. Funding the equity tranche requires capital from the bank sponsoring the underwriting. Given that the fee structure is relatively constant, and lucrative given the average size of a deal, underwriting banks have incentives to structure a deal that requires the smallest equity investment.
Section 3b: Credit Ratings, Default Correlation, and Housing Market Appreciation
In this section we explain how rates of house price appreciation and collateral diversification could impact the economics of a securitization deal. We begin with a discussion of the ratings process.19 In a cross section of subprime securitization deals, the proportion of a deal's principal assigned a AAA rating depends on two factors; the expected loss on the pool of mortgage collateral and the correlation of default in that collateral.20
Credit ratings reflect a rating agency's assessment of the likelihood of bond default. As an example, consider that a AAA rating assigned by a rating agency to a bond corresponds to a 1% probability that the bond will default over a given time period. Default on a AAA bond occurs when the entire principal that is junior to the AAA tranche is eroded on account of loan defaults. Thus, a bond with a AAA credit rating reflects an opinion of the agency that there exists a 1% probability that all the collateral junior to a senior tranche will be eroded within the expected life of the AAA bond. In order to determine the probability of default, a rating agency must estimate the expected loss on the pool of collateral. The expected loss in a pool of collateral is estimated as a function of loan attributes, such as FICO scores, loan-to-value ratios, mortgage type, income documentation, loan purpose (refinance versus purchase), and macroeconomic conditions, including house prices. The impact of specific loan attributes on loan default rates is documented by Deng, Quigley, and Van Order (2000), Pennington-Cross and Ho (2006), Sherlund (2008), and Gerardi, Lehnert, Sherlund, and Willen (2009). Loans with high FICO scores, low loan-to-value ratios, and low debt-to-income ratios default less frequently. It also has been shown that rates of house price appreciation have a strong negative association with default rates (Gerardi, Shapiro, and Willen (2007) and Sherlund (2008)).21
While the expected loss matters for the entire deal, the shape of the expected loss distribution impacts the amount of the deal principal that can be rated AAA. The shape of the loss distribution depends on the default correlation in the underlying collateral. If loan defaults are correlated, the probability of experiencing a greater percentage loss is higher, even though the expected loss remains the same. That is, default correlation simply shifts the shape of the loss distribution. Default correlation also matters in the pricing of CDOs. Longstaff and Rajan (2008) demonstrate that the expected clustering of corporate defaults explains 27% of the CDX spread. Cowan and Cowan (2004) document the degree of default correlation in a pool of subprime loans for one lender and find that the magnitude of default correlation increases as an internally assigned risk grade declines.
The importance of default correlation in the context of credit ratings may be best understood by example.22 Figure 2 serves as a helpful graphical reference for the following argument. First assume a scenario where the collateral has zero default correlation. If a deal has 80% of the principal rated AAA, the rating agency is estimating that the probability that the 20% of principal junior to the AAA tranche will be eroded due to defaults is 1%. Now assume a pool exists where collateral default is highly correlated. When collateral default is highly correlated, there exists a positive probability of a tail event which could trigger the loss of the 20% collateral junior to the senior tranche. Thus, when the default correlation is high, the structure requires more protection for the senior tranche. In this way, for a given expected loss distribution, default correlation impacts the amount of deal principal that can be rated AAA. We compute two empirical proxies of default correlation in our empirical tests. The first is a measure of geographic concentration of the mortgage collateral, and the second measures the covariance of housing returns in the mortgage collateral.
The preceding discussion addressing expected loss and default correlation is fundamental to our hypothesis regarding the impact of house price appreciation and deal structure. In a cross section of deals, if a rating agency determines that certain pools of loans are likely to benefit from high rates of house price appreciation relative to other mortgage pools, all else equal (including default correlation), the expected loss will be lower on the pool with higher expected rates of house price appreciation, and less subordination will be required of those deals. The cost of funding the deal will also be lower. To the extent that mortgage pools concentrated in areas with high rates of house price appreciation receive more favorable credit ratings (again, all else equal), deal arrangers could rationally purchase mortgages of a lower marginal credit quality that are concentrated in areas with high rates of high price appreciation and still obtain the credit ratings required to profitably market a securitization deal.
Empirically, we test the implications of this hypothesis in three ways. First, we test whether deals with loans concentrated in areas with high rates of expected house price appreciation are indeed able to get a larger portion of the securitization rated AAA and/or investment grade, controlling for default correlation. We next test whether house price appreciation impacts the cost of funds for a deal. Finally, we analyze whether rates of house price appreciation and loan quality impact the types of loans that investment banks targeted for the purpose of securitization.
Section 3c: Collateral Diversification and Expected House Price Appreciation
Our data set allows us to control for the traditional factors that influence the probability of default in a pool of loans, such as average FICO scores, average loan-to-value ratios, and loan documentation. The data do not come with "ready-made" measures of collateral diversification, or measures of expected house price appreciation. Accordingly, we construct two measures of diversification and two proxies for expected house price appreciation.
Our first measure of diversification is a Herfindahl index, which measures the percent of each deal's principal concentrated in a given state. Our second proxy for diversification, which we refer to as "housing market correlation", measures the covariance in the housing market returns for a portfolio of mortgage loans. Our motivation for constructing two separate measures of diversification is straightforward. Geographic diversification does not guarantee diversification in housing market returns. To the extent that the housing market is associated with the probability of loan default, a relevant measure of loan diversification is the correlation between the returns in housing markets of the loan collateral. As an illustration of this point consider that despite the geographic distance, returns on a California house price index have a correlation coefficient of 0.87 with returns on an index measuring house price returns in Washington DC.23
We construct a Herfindahl index of the geographic concentration in each deal as follows. For each deal, we calculate the percentage of the deal principal that is concentrated in each of the 50 states, plus Washington, DC. The deal-level Herfindahl index is then calculated as the sum of the squared weights, expressed as
![]() . We report summary statistics on deal-level Herfindahl measures of geographic diversification in Tables 1 and 3. Not reported in Table 3 is the fact that, in our sample, the average deal has 28% of total loan principal concentrated in California.24
. We report summary statistics on deal-level Herfindahl measures of geographic diversification in Tables 1 and 3. Not reported in Table 3 is the fact that, in our sample, the average deal has 28% of total loan principal concentrated in California.24
Our second measure of diversification in housing market returns is calculated in the following way. Again, for each deal, we calculate the percent of deal principal concentrated in each state. We then calculate the portfolio covariance in housing market returns as
![]() , where
, where ![]() is a 51x1 vector of loan concentration weights, and
is a 51x1 vector of loan concentration weights, and![]() is a 51x51 variance-covariance matrix of housing market returns. We subtract the variance of each housing market from the weighted variance-covariance matrix because we are only interested in the covariance of the housing market returns, not the variance of an individual market. Thus the variance-covariance matrix has zeros in the diagonal. The calculation results in a scalar summary measure of the covariance in housing market returns for each deal, where the covariance matrix is weighted by the loan concentration in each state. The intuition is as follows. A deal that is highly concentrated in two states whose housing markets are historically highly correlated (not geographically) will have a larger covariance, and thus a higher probability of experiencing housing market declines at the same time. Summary statistics of housing market correlation are also reported in Tables 1 and 3.
is a 51x51 variance-covariance matrix of housing market returns. We subtract the variance of each housing market from the weighted variance-covariance matrix because we are only interested in the covariance of the housing market returns, not the variance of an individual market. Thus the variance-covariance matrix has zeros in the diagonal. The calculation results in a scalar summary measure of the covariance in housing market returns for each deal, where the covariance matrix is weighted by the loan concentration in each state. The intuition is as follows. A deal that is highly concentrated in two states whose housing markets are historically highly correlated (not geographically) will have a larger covariance, and thus a higher probability of experiencing housing market declines at the same time. Summary statistics of housing market correlation are also reported in Tables 1 and 3.
Having constructed proxies for collateral diversification we turn our focus to expected rates of house price appreciation. Using actual rates of appreciation as a proxy for expected rates, a common approach in models of empirical asset pricing, is not a viable option. This is because our hypothesis suggests the existence of a relationship between deal structure in the secondary market and the eventual level of credit supplied to the primary market.25 To the extent that credit supply in the primary market influences subsequent rates of house price appreciation, an argument found in Mian and Sufi (2008), realized rates of house price appreciation measured over a given time period after deal origination may be endogenously determined by the securitization process itself. In our attempt to overcome this endogeneity, we use two proxies for expected rates of house price appreciation at the time of deal origination. The first proxy is the one-year lagged rate of house price appreciation and the second is a measure of housing market fundamentals.
Market participants (rating agencies possibly included) may have been strongly influenced by prior rates of house price appreciation. Forming expectations via extrapolation is not without precedent. In citing and explaining the results of a series of surveys measuring consumers' expectations of future home price gains, Shiller (2007) observes, "times and places with high home price increases show high expectations of future home price increases and when the rate of price increases changes, so too do expectations of future price increases, in the same direction" (page 12). Our primary proxy for expected rates of appreciation, the one-year lagged rate of house price appreciation, is motivated by an extrapolation hypothesis. Explaining deal structure with lagged rates of house price appreciation is valid econometrically because it addresses the possible endogenous relationship between deal structure, the supply of credit, and future house prices. Relying on lagged rates of appreciation as a proxy for expected appreciation does have a potential weakness. To the extent that rates of house price appreciation are persistent through time, a documented empirical attribute of the data, our estimation could be biased. The existence of an omitted variable that influences rates of house price appreciation and the structure of securitization deals over all the years of our sample is also possible.
In Table 6 we estimate an OLS regression using the pooled 1997-2007 sample, where the proportion of a deal rated AAA is regressed on lagged rates of house price appreciation and other controls. We expect the sign on each of the control variables to be consistent with the variable's influence on the expected loss on the pool of mortgage loans. Deals with higher levels of housing market covariance and higher geographic concentration should be associated with lower levels of AAA-rated principal. FICO scores, and the income documentation, owner occupied, and purchase dummy variables should all be positively related to the proportion rated AAA. Loan-to-value, unemployment, and adjustable-rate loans should be negatively related to the proportion rated AAA. All else equal, deals with external bond insurance should have more AAA-rated principal. The controls also include year fixed effects to account for any structural changes in the securitization and ratings process that may have occurred through time.
The pooled results reported in column 1 indicate the existence of a positive, significant, and economically meaningful relationship between past rates of house price appreciation and credit ratings. Table 6 also reports year-by-year results for the years 2003-2007 estimated separately. In the pooled and cross-sectional regressions we cluster standard errors by the deal arranger to account for correlation in standard errors that is specific to a deal arranger. The results on lagged house price appreciation are robust for the majority of the years when estimated separately, and appear strongest for deals originated in 2003, 2005, 2006, and 2007. The results for 2007 suggest that a 5% increase in the average lagged rate of house price appreciation (one standard deviation) increases the size of a deal rated AAA by about 1.5% (about one-quarter standard deviation in the percent of a deal rated AAA).26 Our results suggest that, conditional on observable deal attributes, the proportion of a deal rated AAA increases with rates of lagged house price appreciation.27
Results from the pooled estimation also indicate that deals with a higher geographic concentration of collateral receive a lower percentage of the deal rated AAA, though the result is not particularly robust when estimated in the later years of the sample. The lack of a consistent negative coefficient on our measure of housing market covariance in the model is surprising. The two measures of collateral diversification have a correlation coefficient of -0.04, suggesting our measures are not collinear. While a measure of the correlation in housing market returns (regardless of geography) is theoretically and intuitively appealing, the results suggest that geographic diversification is the more relevant measure in our sample, perhaps because it is easier to measure. FICO scores and loan-to-value ratios have the expected impact on deal ratings, and deals that have external bond insurance receive a substantially larger fraction of the deals principal rated AAA.
We briefly consider a second proxy for expected price appreciation, but do not report the full set of results for the sake of brevity. Our second proxy relies on housing market fundamentals to construct a measure of whether a housing market is "expensive" or "cheap" relative to its long run equilibrium. Theoretically, home prices should demonstrate an equilibrium relationship with rents and the "user costs" of housing, as discussed in Gallin (2004) and Himmelberg, Mayer, and Sinai (2005). We assign each individual loan in our sample an imputed-to-actual rent ratio that has been calculated for the MSA in which the loan resides using data provided by Mayer (2008). We report summary statistics on the imputed-to-actual rent ratio in Tables 1 and 3 for the purposes of comparison with statistics on lagged house price appreciation. In unreported results, we find that the relationship between the percentage of a deal rated AAA and a deal-level imputed-to-actual rent ratio is positive, but not as robust as the results when estimated with lagged rates of price appreciation.28
Section 3d: Bondholders Exposure to House Price Declines
The results presented in Table 6, and those unreported that use an alternative proxy, suggest that rates of house price appreciation have a meaningful economic impact on the structure of securitization deals. Yet, the results are striking for another reason. If expectations of future house price appreciation are indeed strongly influenced by prior rates of price appreciation, then securitization deals originated at the peak of a housing cycle could be structured most aggressively precisely at the time they should be structured most conservatively. This is because deals originated at the peak of a housing cycle will, by definition of a cycle peak, be exposed to subsequent house price declines, thereby increasing the probability of default in the underlying loans. Holders of bonds issued from deals with the highest past rates of house price appreciation have the least amount of protection against default when it is needed most. Because of this, investors are exposed to the ability of investment banks and rating agencies to forecast turns in the housing cycle, a caution first raised by Ashcraft and Schuermann (2008) and confirmed empirically in Table 6.
The results also highlight a potential weakness in the use of lagged rates of house price appreciation as a proxy for expected rates of house price appreciation. The fact that lagged rates of house price appreciation impact deal structure does not guarantee that rating agencies or investment banks held irrational expectations about future rates of house price appreciation. Poor ex post outcomes could simply represent a bad draw from a reasonable distribution of expectations formed ex ante, as alluded to by Gerardi, Lehnert, Sherlund, and Willen (2009).
Section 3e: Deal Structure and the Cost of Funds
The proportion of a securitization deal rated AAA should impact the cost of funding the underlying portfolio of mortgage loans. A deal with better credit ratings should be able to issue a larger fraction of bonds at a lower coupon rate, on average. In this section, we test whether rates of house price appreciation and our measures of loan diversification impact the cost of funds for a deal. Deals with a lower expected loss on account of higher expected house price appreciation should have a lower cost of funds, while higher levels of collateral correlation should be positively related to the cost of funds.
Empirically, we measure the cost of funds for a deal as the spread of each bond's coupon payment over the interest rate on the relevant risk-free asset. For floating rate tranches, the spread is calculated as the first coupon payment over one-month LIBOR at the time of deal close. In our sample of subprime securitizations, 96.5% of the average principal in a deal is in the form of a floating-rate bond.29 For the small percentage of tranches that pay fixed rates, the relevant risk-free reference rate is less clear. The ideal reference asset would be the yield to maturity on a risk-free asset selling at par with the exact maturity of the mortgage-backed security. However, because of unknown prepayment and default activity, the expected life of a fixed-rate MBS is unknown. To overcome this problem, we use an estimate of the life of each fixed-rate bond produced by Bloomberg, and use the rate on the Treasury note with the closest maturity as the risk-free rate of reference.30
We take the following steps to create a measure of the deal-level cost of funds. First, for each bond, we subtract the bond's first scheduled coupon rate from the relevant risk-free reference asset. We then aggregate the tranche spreads to the deal level using the size of each tranche's principal as weights. As an example, Figure 1 reports the spread of each tranche over the reference asset and the tranche-weighted cost of funds for the entire deal, which is about 25 bps.
Table 7 reports the results of a pooled OLS regression using the 1997-2007 sample and separate cross-sectional regressions by year. The deal-level cost of funds is regressed on lagged house price appreciation, our deal-level measures of diversification, and other measures of deal credit quality. Our estimates suggest that deals with high lagged rates of house price appreciation appear to have a statistically significant lower cost of funds in years 2003, 2004, and 2007. A 5% increase in lagged house price appreciation decreases the cost of funds by 10-20 basis points (one standard deviation in deal-level coupon spread is equal to 24 basis points). However, the result is not consistent in every year, nor is it significant in the pooled sample. Deals with high rates of appreciation actually had a statistically higher cost of funds in 2006, though the magnitude is quite small economically (a 5% increase in house prices led to a 3 basis point increase in cost of funds).31 Taken together, the results provide some evidence that rates of house price appreciation are negatively related to a deal's cost of funds for the bulk of our sample.
Section 4: Demand for Loans from the Secondary Mortgage Market
Section 4a: Consolidated Supervisory Entities
In this section we explore whether rates of house price appreciation impact the types of loans deal arrangers purchase for the purpose of securitization. Theoretically, our motivation is related to the argument found in Coval, Jurek, and Stafford (2007) and Brennan, Hein, and Poon (2008), which suggests that arbitrage profits are possible for a deal arranger in a securitization market if investors purchase collateralized bonds based solely on credit ratings. If ratings arbitrage existed, deal arrangers would seek to purchase the cheapest portfolio of loans that would deliver AAA credit ratings. In a subprime MBS setting, the cheapest portfolio of mortgage loans that would deliver AAA credit ratings could be loans of a poor credit quality that are concentrated in areas with high rates of house price appreciation.
We take advantage of a unique event in order to identify the factors that influence the demand for subprime mortgage loans from the secondary market. In October 2003, the SEC proposed amending a series of rules which reduced capital requirements on certain independent broker-dealers.32 The rule change came in response to the European Union's (EU) Conglomerates Directive which required that affiliates of U.S. broker-dealers demonstrate that they were subject to consolidated supervision by a U.S. regulator. U.S. broker-dealers with subsidiaries operating in the EU that could not meet this requirement would have faced significant restrictions on their European operations beginning January 2005. Broker-dealers who voluntarily adopted the rule change would be classified as a Consolidated Supervised Entity (CSE), thereby subjecting themselves and their internal risk models to the scrutiny of the SEC, while satisfying the regulatory requirements of the EU.
The proposed change would establish a voluntary, alternative method of calculating capital requirements for the largest independent broker-dealers that were not already subject to capital regulation from a regulatory authority. As stated by the SEC, "this alternative method [for calculating capital requirements] permits a broker-dealer to use mathematical models to calculate net capital requirements for market and derivative-related credit risk" (SEC 2004, page 34428). Prior to the rule change, independent broker dealers were subject to the standard net capital rule, which required their net worth-to-assets ratio exceed 2%. Under the rule change, banks would essentially be allowed to use their internal risk-based models to calculate a capital adequacy measure consistent with international standards adopted by the Basel Committee on Banking Supervision. In particular, banks adopting the rule would be required to, "maintain an overall Basel capital ratio of not less than the Federal Reserve's 10 percent `well capitalized' standard for bank holding companies" (SEC 2008, page 3). In a document detailing the rule amendment, the SEC estimated that "broker-dealers taking advantage of the alternative capital contribution would realize an average reduction in capital deductions of approximately 40%" (SEC 2004, page 34445).33 The SEC further estimated that a broker-dealer could reallocate capital to fund business for which the rate of return would be approximately 20 basis points higher. The rule change did not come without a cost to the broker-dealers. In exchange for being allowed to use internal risk-based models, CSE banks would be required to submit their risk models to an SEC audit each month.
Though announced in October 2003, the SEC adopted the CSE rules on April 28, 2004. Although seven firms adopted CSE status, the SEC only regulated five because Citigroup and JPMorgan were already subject to the regulation of the Federal Reserve on account of their status as depository institutions. Thus, for five of the largest independent broker-dealers--Bear Stearns, Goldman Sachs, Lehman Brothers, Merrill Lynch, and Morgan Stanley--the adoption of CSE status satisfied the regulatory requirements of the EU. Adoption of CSE status also resulted in preferential capital treatment. In effect, adopting CSE status freed up a substantial fraction of capital which the banks could subsequently use to increase their presence in the subprime securitization market.
Section 4b: Why a Regulatory Capital Shock Would Increase Secondary Market Demand for Subprime Loans
Despite the increased availability of capital, it is not obvious that the CSE investment banks would deploy the capital to increase their production of subprime securitization deals. In this section we present two arguments describing why a change in regulatory capital requirements would increase CSE banks' demand for subprime mortgage loans. First, we argue that the five investment banks would find it beneficial to originate and hold portions of AAA-rated securitizations. Holding AAA-rated securities would increase the overall credit quality of their capital base, in turn freeing up additional capital. Second, we discuss why capital is necessary in the production function of securitization deals.
In a regulatory environment in which capital charges are based on asset quality, banks are incentivized to either purchase or manufacture the cheapest portfolio of loans that will receive a high quality credit rating. Referred to as "regulatory capital arbitrage," banks, on the basis of their private information, can exploit the difference between the true economic risk of a portfolio of loans and the risk assessed by regulators (Jones (2000) and Erel (2005)). The incentive to engage in regulatory arbitrage is clear. Lower capital charges result in freed-up capital with which profits can be generated via increased lending on positive NPV loans, or through the fees generated by underwriting new asset-backed securities.34 Acharya and Schnabl (2009) present two pieces of evidence consistent with banks having engaged in regulatory capital arbitrage over our sample period. First, the authors argue that between the years 2004-2007, "bank balance-sheets grew twofold, [while] the regulatory assessment of risk-weighted assets grew at a far more sluggish pace. Put another way, banks were deemed by regulatory assessment to have been investing in relatively safer assets over this period." In order for regulatory arbitrage to result in more freed-up capital, banks would desire to hold some of the "highly rated" assets on their books. Consistent with this argument, using data on the holdings of mortgage debt produced by Krishnamurthy (2008), Acharya and Schnabl (2009) further argue that banks kept as much as 30% of all real estate-related, non-agency, AAA-rated assed backed securities and CDOs on their balance sheet, with broker/dealers holding over 10%, a surprisingly large amount if the intent of securitization is the transferring of risk.
Capital is required in the production of securitization deals for at least two reasons. First, the average subprime mortgage loan is warehoused for 2-4 months by the underwriting bank before it is placed into a securitizing SIV. Thus, securitization involves the carrying costs associated with purchasing and owning mortgages before the structure can be funded by the sale of the asset-backed securities produced by the deal. Second, most deals require overcollateralization, which comes in the form of an equity tranche funded by the underwriting bank. In our sample of 1,267 securitizations, the average deal benefitted from 1.75% overcollateralization. Given that the average deal was comprised of $985 million in mortgage principle, funding the equity tranche would require a capital outlay of over $17 million, on average. In short, the increased availability of capital could allow the five CSE banks to purchase and warehouse more subprime loans, as well as to fund the equity tranche required by subprime securitization structures.
Section 4c: Measuring Increased Secondary Market Demand for Subprime Loans
We exploit the SEC rule change in order to identify an external shock to the relative demand for subprime loans in the secondary mortgage market. The use of this event is designed to control for the possibility that changes in demand conditions in the primary mortgage market are the primary driver of activity in the secondary mortgage market. That is, the event identifies a relative change in demand between investment banks in the secondary market which is presumed to be uncorrelated with any changes in demand for mortgages from borrowers in the primary market. Because we are able to quantify the relative purchasing activity of each bank involved in subprime securitization deals, we can test whether the five CSE banks changed their purchasing behavior in a systematic way relative to the non-CSE banks in the years after the rule change.
In Figure 3 we plot the average share of all securitized subprime loans that are owned by the five CSE banks in each ZIP code. In 2001, CSE banks owned about 20% of the securitized subprime loans in our sample, on average. Beginning in 2003, the CSE banks began increasing their relative market share until 2005, at which point they owned greater than 40% of the securitized loans in our sample, on average. Figure 3 also plots 95% and 5% confidence intervals, which confirm that an increase from 20% to 40% market share over the event period is a statistically significant increase. Table 8 also documents the deal activity of each bank involved in a securitization deal in our sample. We tabulate the total activity of the five CSE investment banks and compare their activity with the market activity of the competing banks that did not adopt CSE status. In 2003, the five CSE banks were responsible for 32 percent of the total subprime deals that were originated. That number jumped to 43 percent in 2004 and 48 percent by 2005. The CSE banks' market share then remained elevated through 2007.
Results from earlier tests suggest why banks might demand poor quality mortgage loans from areas with high rates of house price appreciation. Our hypothesis suggests that following the event, CSE banks would increase their demand for subprime loans the most in ZIP codes with higher realized rates of house price appreciation and lower average credit quality. In order to test this hypothesis we construct a panel dataset of the purchasing activity by each bank in our sample at the ZIP code level. In each bank-ZIP-year, we calculate the number of subprime loans owned by the five CSE investment banks and the total number of subprime loans owned by the non-CSE banks involved in securitization underwriting. We assign a bank-ZIP-year an indicator variable equal to one if the bank is a CSE bank. We also assign years 2004-2007 a post-2003 indicator variable.
We estimate an OLS regression using our bank-ZIP-year panel, where the log-number of loans purchased by each bank in a given bank-ZIP-year is the dependent variable. We control for the average credit and housing market characteristics of the loans in each year in each ZIP code that could influence secondary market demand. Results are presented in Table 9. Standard errors are clustered by year to account for correlation in subprime loan demand common across ZIP codes in a given year. We also cluster our standard errors by deal underwriter to account for correlation across deal underwriters through time. In order to identify the effect of the event on the purchasing behavior of the five CSE banks we create an interaction of the post-event indicator with the CSE bank indicator. In our final specification, we create an interaction of the bank identifier with the event identifier and variables measuring ZIP-code attributes. The interactions are designed to identify the attributes of ZIP-codes where CSE banks increased their purchasing following the event.
We first estimate the relationship between purchasing activity and ZIP-code attributes using the entire sample of bank-ZIP-years. In column 1 we estimate the model controlling for average ZIP-code attributes only. In column 2 we estimate the model with our event indicator, the CSE bank indicator, and the interaction of the two indicators. The results in column 2 suggest that all banks increased their purchasing activity following the event, but that CSE banks increased their purchasing activity relative to competing banks in a significant manner. On average, CSE banks purchased 35% more loans than non-CSE banks following the event. In column 3 we control for ZIP-code factors that impact mortgage demand. Controlling for ZIP-code factors reduces the significance of the post-2003 variable, but the coefficient on the interaction of the post-2003 and CSE bank dummy variables indicate that CSE banks after 2003 purchased 31% more subprime loans than their non-CSE counterparts.
We are interested in testing the hypothesis that CSE banks increased their purchasing activity in ZIP codes with higher rates of house price appreciation after the event. To test this hypothesis, we interact the event and CSE bank dummy variables with the average bank-zip-year FICO score, loan-to-value ratio, and the one-year lagged rate of house price appreciation. The results of the full specification presented in columns 4 and 5 can be interpreted as the marginal difference in purchasing activity between the CSE banks and non-CSE banks after the event as a function of average ZIP-code attributes. Column 4 is estimated on the entire bank-ZIP-year sample. The coefficient on the interaction of the event and CSE dummy's with rates of house price appreciation is positive, as predicted, but not significant. However, after the event, CSE banks owned more loans than their counterparts in ZIPs with higher loan-to-value ratios.35
Over 500,000 of our bank-ZIP-year observations only have one subprime loan. As a result, our estimates of the average ZIP-code characteristics of the bank-ZIP-year are the attributes of the one loan in the given bank-ZIP-year. In order to have a more precise estimate of the ZIP-code attributes impacting banks purchasing decisions, we restrict the estimation sample in column 5 to bank-ZIP-years with more than one loan. Though we lose one-third of our sample, we feel that focusing on bank-ZIP-years with more than one subprime loan allows us to highlight the economic forces driving subprime activity in areas where the activity was most heavily concentrated. We re-estimate the model on the bank-ZIP-year sample with more than one loan and report the results in column 5. The results indicate that at the margin, after 2003, and relative to their peers, CSE banks increased their purchasing activity the most in ZIP codes with higher realized rates of house price appreciation and higher average loan-to-value ratios. Drawing on the results presented in column 5, we calculate that CSE banks, on average, purchased 6% more loans than their competitors in ZIP codes that experienced a 5% higher rate of growth in house prices in the previous year. Further, CSE banks, on average, purchased 6% more loans than their competitors in ZIP codes with 5% higher average loan-to-value ratios.
Overall, the bulk of the evidence presented in Table 9 is consistent with the hypothesis that the five banks which elected CSE status behaved differently than their counterparts after the event which changed their capital requirements. The results indicate that they increased their investment in loans with higher average rates of house price appreciation, but lower average credit quality in the form of higher loan-to-value ratios. To the extent that poor credit quality loans are cheaper in the wholesale market, this type of purchasing behavior is consistent with a ratings arbitrage hypothesis.
Admittedly, our simple analysis of purchasing activity lacks the power to rule out all competing hypothesis. The most compelling competing hypothesis is that once the market observed that house prices delivered favorable credit ratings at the deal level, house prices would be "priced" in the wholesale loan market. We do not have data on the wholesale prices of loan portfolios. However, we briefly consider the alternative hypothesis that rates of house price appreciation are "priced" in the origination market for the underlying mortgage loans, thereby negating any arbitrage gains that could be made in the secondary market through the purchase of poor quality loans in areas with high price appreciation.
We can test the relative importance of credit attributes and house price appreciation in mortgage spreads at the origination level. In unreported tests, we evaluate the determinants of the average spread in origination mortgage rates over the risk-free rate at the ZIP-code level. In each of the years 2003-2006 separately, FICO scores, the loan-to-value ratio of the borrower, and loan documentation were the primary economic determinants of mortgage spreads. Rates of house price appreciation had the fourth largest economic impact. The results provide limited evidence that although house price appreciation is the primary economic determinant of rate spreads at the deal level, they are not the primary determinant of interest rate spreads at the ZIP-code level.
Section 4d: Did CSE Banks Purchase Loans "Down the Credit-Quality Curve"?
Our results from the previous section suggest that CSE banks increased their ownership of subprime loans the most in ZIP codes with higher average rates of house price appreciation and higher average loan-to-value ratios. We exploit our panel of bank-ZIP-year data and data on the performance of subprime mortgages to analyze bank-specific default rates. The numerator in our bank-ZIP-year default rate calculation is the total number of loans owned by each bank in each ZIP-code in each year that defaulted by July 2008. The denominator is the total number of loans owned by each bank in each ZIP-code in each year. Thus, in this analysis we are considering the total default rate, as opposed to comparing default rates across loan vintages. In this way, we can capture the sensitivity of each loan's performance to the recent turn in macroeconomic conditions, rather than simply comparing performance across vintages. As before, we assign an indicator variable equal to one for CSE bank ZIP-years, a post-2003 indicator equal to one for the years following the SEC event, and an interaction of the CSE indicator and post-2003 event indicator.
A substantial fraction of our bank-ZIP-year observations have a default rate equal to zero. To adjust for this issue, we estimate a Tobit regression with bank-ZIP-year default rates as our dependent variable. As in Table 9, we control for credit and housing market factors that are associated with loan credit quality. We report the results in Table 10. Column 1 reports the results when controlling for average rates of house price appreciation, average FICO scores, average debt-to-income ratios, average loan-to-value ratios, and the percentage of loans that have an adjustable-rate feature. As expected, ZIP-codes with higher FICO scores and higher rates of house price appreciation have lower average default rates, though the coefficient on FICO scores is not significant. Debt-to-income ratios, loan-to-value ratios, and the average number of adjustable rate loans are positively related to default rates. Column 2 analyzes default rates as a function of the event and bank dummy variables. While the coefficient suggests a positive relationship between default rates and CSE banks after the event, the result is not statistically significant, even when controlling for average ZIP-code attributes in column 3.
In columns 4 and 5 we estimate a full specification of average ZIP-code attributes, the CSE bank dummy, the event dummy, and the full set of interactions. The test is designed to capture the marginal difference in default rates for CSE banks after the event as a function of average ZIP-code attributes. When estimated with the full sample, subprime loans owned by CSE banks after the event appear to have marginally higher default rates than their non-CSE counterparts in ZIP codes with higher loan-to-value ratios. Consistent with the estimation procedure presented in Table 9, we restrict the estimation sample in column 5 to bank-ZIP-years with more than one loan in order to obtain more precise estimates of average bank-ZIP-year attributes. Column 5 suggests the results are robust to the bank-ZIP-years with only one subprime loan.
In order to consider the economic magnitude of the results from our Tobit regression, we multiply the regression coefficients by the adjustment factor, `sigma', reported at the bottom of Table 10.36 Drawing on the results from column 5, a 10% increase in the ZIP-average loan-to-value ratio results in 1.2% (.334*10%*.0037) higher default rates for CSE banks after the event relative to non-CSE banks after the event. In sum, the results suggest that the performance of loans owned by CSE banks after the event were more sensitive to borrower leverage than the non-CSE counterparts. Though not overwhelming, this result could be interpreted as consistent with the notion of CSE banks purchasing loans further down the quality curve in order to increase their market share.
Section 5: Secondary Market Demand and Access to Mortgage Credit
So far, we have shown that following an event which changed the capital requirements for five of the largest securitizers of subprime loans, these five CSE banks increased their purchasing of subprime loans in ZIP codes with higher average realized rates of house price appreciation and ZIP codes with higher average loan-to-value ratios. We also demonstrated that, at the margin, the performance of loans owned by CSE banks was differentially sensitive to changes in borrower leverage.
In this section, we explore the impact of an increase in demand from the secondary mortgage market on the extension of credit in the primary mortgage market. The central question is whether the practice of securitization increases borrowers' access to mortgage credit. At issue is the endogeneity of mortgage demand. An observed increase in secondary market activity could simply be driven by an increase in demand for mortgage credit from borrowers in the primary mortgage market. Thus, demonstrating an association between the extension of mortgage credit and increased secondary market activity does not clarify causality. We exploit the SEC-related change in capital requirements for the five independent broker-dealers discussed in the previous section to gain identification. The event identifies one potential source of a relative change in demand between competing banks in the secondary market which is presumed to be uncorrelated with any changes in demand for mortgages from borrowers in the primary market.
The traditional measure of access to mortgage credit in the primary market has been the mortgage denial rate (Mian and Sufi (2008), Dell'Arricia et al (2008), Gabriel and Rosenthal (2007)). As suggested by Mayer and Pence (2008), denial rates may not accurately reflect borrowers' access to credit because of potential problems with the measurement of mortgage applications, which serve as the denominator in the denial rate calculation. Subprime mortgage originators may aggressively market to potential borrowers, thereby endogenously increasing the number of applications. If mortgages are not originated at the same rate as applications endogenously increase, the denial rate may be biased upward. In addressing this issue, Mayer and Pence (2008) propose scaling mortgage originations by the total number of housing units in a ZIP code. We follow this convention in calculating our measure of access to mortgage credit.
We rely on mortgage origination rates in the year 2005 from the HMDA data set to measure the extension of credit in the primary mortgage market. We calculate the number of originated "higher-priced" loans as a fraction of the total housing units in a ZIP code.37 We employ the percentage of "higher-priced" loans that are subsequently sold as a proxy for activity in the secondary mortgage market. We control for factors that affect the demand for mortgage credit in the primary mortgage market, such as average MSA income, the ZIP-code credit attributes of all potential borrowers (not just the credit attributes of originated loans used in previous specifications), unemployment rates, homeownership rates, and building permits.38 We instrument for secondary market demand using changes in CSE-bank market share surrounding the event. The final sample used in our regressions is constrained by the number of ZIP codes in which the CSE banks owned loans as of 2003. Thus, despite having borrower attribute data for over 15,000 ZIP codes, our final estimation sample consists of the intersection of the 2,981 ZIP codes in which CSE banks owned loans as of 2003 and the 15,264 ZIP codes for which we have borrower attribute data. The final cross-section of 2,786 ZIP codes in 2005 includes ZIP codes from 44 states, but is most heavily concentrated in California, Florida, and Texas.
In estimating the impact of securitization on borrower's access to mortgage credit, economists have estimated the following relationship using a cross section of ZIP-code specific mortgage origination rates, specified as:
where
Aside from the endogeneity of the denial rate calculation, if the equation is estimated using OLS, the estimates on beta may suffer from simultaneity bias because demand for mortgage loans, which impacts mortgage denial rates, and secondary market demand are likely jointly determined.
We address the endogeneity of mortgage demand by estimating the relationship using a two-stage least squares approach, where a change in the relative demand for loans in the secondary market between underwriting banks is used to identify demand in the secondary mortgage market. We quantify the change in relative demand for loans in the secondary market by calculating the change in market share of the five CSE banks in each ZIP code surrounding the event. That is, for each ZIP code in our sample for which enough data is available in the year 2005, we calculate the change in the market share of the 5 CSE banks relative to their market share at the end of 2003. In each specification our dependent variable is specified in log form on account of positive skewness in the distribution of subprime originations per housing unit.
We specify and estimate our instrumental variable analysis on a cross-section of ZIP codes in the year 2005. We focus our analysis on the cross-section of ZIP codes in 2005 for two reasons. First, we want to limit the bias that is introduced into the HMDA "higher-priced" sample on account of changes in the yield curve through time.39 Second, we seek to isolate the impact of changes in secondary market demand on the extension of subprime credit surrounding the event. The first stage regression is estimated as:
where
The instrumented percentage of originated loans in each ZIP code sold to the secondary market is then used as the key explanatory variable in the estimation of interest, which we specify as:
![]()
We report the results of the second stage estimation in column 3 of Table 11. The magnitude of the relationship between secondary market activity and origination rates is almost twice as large when compared with the standard OLS estimate presented in column 1 of Table 11. The results presented in column 3 suggest that a 10% increase (about one standard deviation) in the percentage of originated loans sold to the secondary market results in a 70% increase (over one-half standard deviation) in the average number of subprime loans per housing unit (an additional 4 subprime loans per 100 housing units). Overall, we interpret these results as evidence that the demand for loans from the secondary market is at least one of the channels that drives the extension of credit in the primary mortgage market.
We briefly discuss a potential bias introduced into our sample by using the HMDA "higher-priced" classification as a proxy for subprime activity. Loans classified as "higher-priced" are considered higher-priced relative to a reference asset of comparable maturity. This becomes a problem when considering the interest rate on adjustable-rate loans, which technically have a 30-year maturity but whose interest rate is based on short-term rates. The result is that adjustable-rate mortgages might be underreported in the HMDA sample, and the magnitude of the bias will change through time depending on the shape of the yield curve. Underreporting adjustable-rate mortgages likely biases the sample against our results. Futhermore, because we are not comparing origination rates across years, we have no reason to suspect the presence of a systematic bias in the reporting of "higher-priced" loans that are originated or sold that would adversely affect results in a cross-section of ZIP codes in year 2005.
Section 6: Conclusion
This paper analyzes the structure and attributes of subprime mortgage-backed securitization deals originated between 1997 and 2007, the purchasing activity of banks underwriting the deals, and the impact of that purchasing activity on the extension of mortgage credit. We show that the securitization process, including the assignment of credit ratings, provided incentives for securitizing banks to purchase loans of poor credit quality in areas with high rates of house price appreciation. Increased demand from the secondary mortgage market for these types of loans appears to have facilitated easier credit in the primary market. Deals comprised of loans concentrated in areas that exhibited high rates of house price appreciation in the year prior to deal origination received more favorable credit ratings, all else equal. We also demonstrate that deals with loans concentrated in areas with high rates of house price appreciation have a lower cost of funds, in most years. The impact of price appreciation on deal structure and deal cost of funds is relevant for two reasons. First, rating agencies have been vague about the magnitude with which house price appreciation impacts deal ratings. Second, and perhaps more importantly, the structure of securitization deals matters because the economics of the structuring process creates incentives for deal arrangers to purchase a portfolio of loans that will provide the cheapest funding for a deal.
Using an event which identifies an external shock to the demand for subprime loans from the secondary market, we demonstrate that deal arrangers increased their relative demand for subprime loans with higher loan-to-value ratios and high rates of house price appreciation. We show that loan-to-value ratios have a larger marginal impact on the default rate of CSE loans relative to non-CSE loans after the event. Finally, we use the event to identify a relative shift in the demand for subprime loans from the secondary mortgage market. The relative demand shift allows us to identify a causal relationship between demand in the secondary market and credit supply in the primary mortgage market. We believe a careful identification of the impact of securitization on credit supply is an important result given the recent boom in securitization activity and the relative dearth of academic evidence regarding the impact of securitization on the primary market of the asset being securitized.
References
Acharya, V., Schnabl, P., 2009. "How Banks Played the Leverage Game", Chapter 2 in "Restoring Financial Stability: How to Repair a Failed System", edited by Viral Acharya and Matthew Richardson, John Wiley and Sons, March 2009.
Ashcraft, Goldsmith-Pinkman, Vickery 2009,"Incentives and the Ratings of Mortgage-Backed Securities," Working Paper.
Ashcraft, A., Schuermann, T., 2008. "Understanding the Securitization of Subprime Mortgage Credit", Federal Reserve Bank of New York Working Paper.
Avery, R., Brevoort, K., Canner, G., 2007. "Opportunities and Issues in Using HMDA Data." Journal of Real Estate Research., 29(4): 351-79.
Bailey, M., Muth, R., Nourse, R., 1963. "A Regression Method for Real Estate Price Index Construction," American Statistical Association Journal, 933-942.
Barclays Capital. 2007. "Correlation Modelling - from Vanilla to Exotic", Structured Credit Strategist, April 19, 2007.
Brennan, M., Hein, J., Poon, S., 2008. "Tranching and Rating," Unpublished Working Paper.
Case, K., Shiller, R., 1989. "The Efficiency of the Market for Single Family Homes," American Economic Review, 79 (1), 125-137.
Coval, J., Jurek, J., Stafford, E., 2007. "Economic Catastrophe Bonds," Unpublished Working Paper.
Cowan, A., Cowan C., 2004. "Default Correlation: An Empirical Investigation of a Subprime Lender" Journal of Banking and Finance, 28, pg. 753-771.
Dell'Ariccia, G., Igan, D., Laeven, L., 2008. "Credit Booms and Lending Standards: Evidence from the Subprime Mortgage Market," IMF Working Paper.
Demyanyk, Y.,Van Hemert, O., 2008. "Understanding the Subprime Mortgage Crisis," Unpublished Working Paper.
DeMarzo, P. 2005. "The Pooling and Tranching of Securities: A Model of Informed Intermediation," The Review of Financial Studies, 18, 1-35.
Deng, Y., Quigley, J., Van Order, R., 2000. "Mortgage Terminations, Heterogeneity and the Exercise of Mortgage Options," Econometrica, 68, 275-307.
Diamond, D. Rajan, R. 2009. "The Credit Crisis: Conjectures about Causes and Remedies", University of Chicago GSB Working Paper.
Erel, I. 2005. "Incentive Based Regulation of Banks: An Interpretation of Basel II", Ohio State Working Paper.
Gabriel, S., Rosenthal, S., 2007. "Secondary Markets, Risk, and Access to Credit: Evidence From the Mortgage Market," Unpublished Working Paper.
Gallin, J., 2004. "The Long-Run Relationship between House Prices and Rents," Federal Reserve Board Working Paper 2004-50.
Gaur, V, Seshadri, S., Subrahmanyam, M., 2003. "Market Incompleteness and Super Value Additivity: Implications for Securitization," mimeo, New York University.
Gerardi, Lehnert, Sherlund, and Willen (2009). "Making Sense of the Subprime Crisis." Brookings Panel on Economic Activity, forthcoming.
Gerardi, K., Shapiro, A., and Willen, P., 2007. "Subprime Outcomes: Risky Mortgages, Homeownership Experiences, and Foreclosures," Federal Reserve Bank of Boston Working Paper No. 07-15.
Gorton, G. 2008, "The Panic of 2007," Yale University and NBER Working Paper.
Himmelberg, C., Mayer, C., Sinai, T., 2005. "Assessing High House Prices: Bubbles, Fundamentals and Misperceptions," Journal of Economic Perspectives, 19(4), pg. 67-92.
Jones, D., 2000. "Emerging Problems with the Basel Capital Accord: Regulatory
Capital Arbitrage and Related Issues." Journal of Banking and Finance 24, 35-58.
Keys, B., Mukherjee, T., Seru, A., Vig, V., 2008. "Securitization and Screening: Evidence From Subprime Mortgage Backed Securities," Unpublished Working Paper.
Krishnamurthy, A. 2008, "The Financial Meltdown: Data and Diagnoses," Working Paper.
Krugman, P. 2007, "Just Say AAA", New York Times Op. Ed., July 2, 2007.
Longstaff, F., Arvind R., 2008. "An Empirical Analysis of the Pricing of Collateralized Debt Obligations," The Journal of Finance, 43(2) pg. 529-563.
Mayer, C. 2008. "A note: The Mortgage Meltdown and House Prices," mimeo, Columbia University.
Mayer, C. Pence, K., 2008. "Subprime Mortgages: What, Where and to Whom?" NBER Working Paper #14083.
Mayer, C. Pence, K. and Sherlund, S.(2009). "The Rise in Mortgage Defaults." Journal of Economic Perspectives, 23, 27-50.
Mian, A., Sufi, A., 2008. "The Consequences of Mortgage Credit Expansion: Evidence from the 2007 Mortgage Default Crisis,"Quarterly Journal of Economics, forthcoming.
Moody's Investor Services, 2004. "Introduction to Moody's Structure Finance Analysis and Modelling." Presentation given by Frederic Drevon, May 13.
Pagano, M. and Volpin, P. 2008. "Securitization, Transparency, and Liquidity," Working Paper.
Pennington-Cross, A., Ho, G., 2006. "The Termination of Subprime Hybrid and Fixed Rate Mortgages," Federal Reserve Bank of St. Louis Working Paper 2006-042A.
SEC 2004. Federal Register, Vol. 69, No. 118, Monday, June 21, 2004, Rules and Regulations, page 29.
SEC. 2008. "SEC's Oversight of Bear Stearns and Related Entities: The Consolidated Supervised Entity Program," Report 446-A, September 25, 2008.
Sherlund, S., 2008. "The Past, Present, and Future of Subprime Mortgages,"Finance and Economics Discussion Series 2008-63, Federal Reserve Board.
Shiller, R., 2007. "Understanding Recent Trends in House Prices and Home Ownership," Cowles Foundation Discussion Paper No. 1630.
Standard and Poor's, 2007. "Principles-Based Rating Methodology for Global Structured Finance Securities." Standard & Poor's Ratings Direct Research, N.Y.
Figure 1. The Structure of a Subprime Securitization Deal.
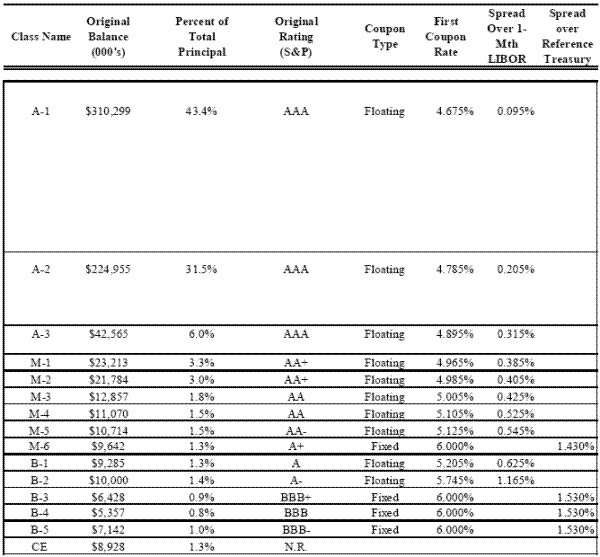
Figure 2 Default Correlation and Expected Loss Distribution.
This figure uses a hypothetical distribution of expected loss to demonstrate how default correlation changes the shape of the loss distribution, but not the expected loss. Expected loss in the two distributions is equal.
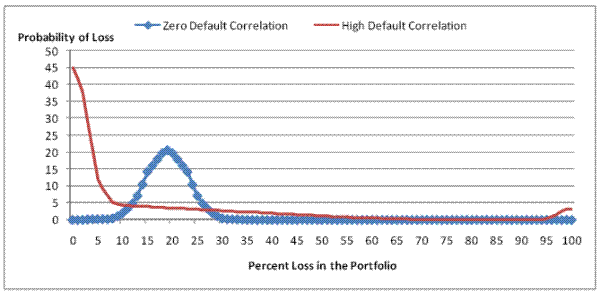
Figure 3 CSE Bank Leverage and CSE Market Share
This solid line represents the average share of all securitized subprime loans that are owned by the five CSE banks in each ZIP code of our sample, while the dotted lines represent the 95th and 5th percentile.
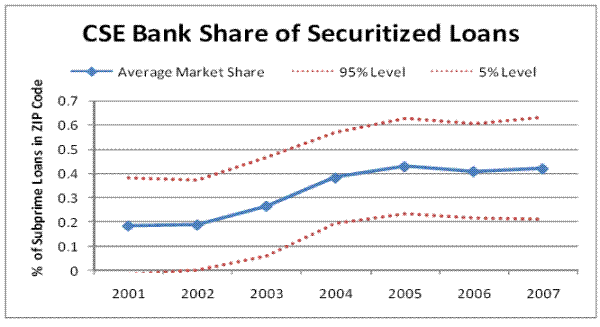
Figure 4
These charts plot the average bank-ZIP-year attributes of subprime loans owned by CSE banks and non-CSE banks through time.
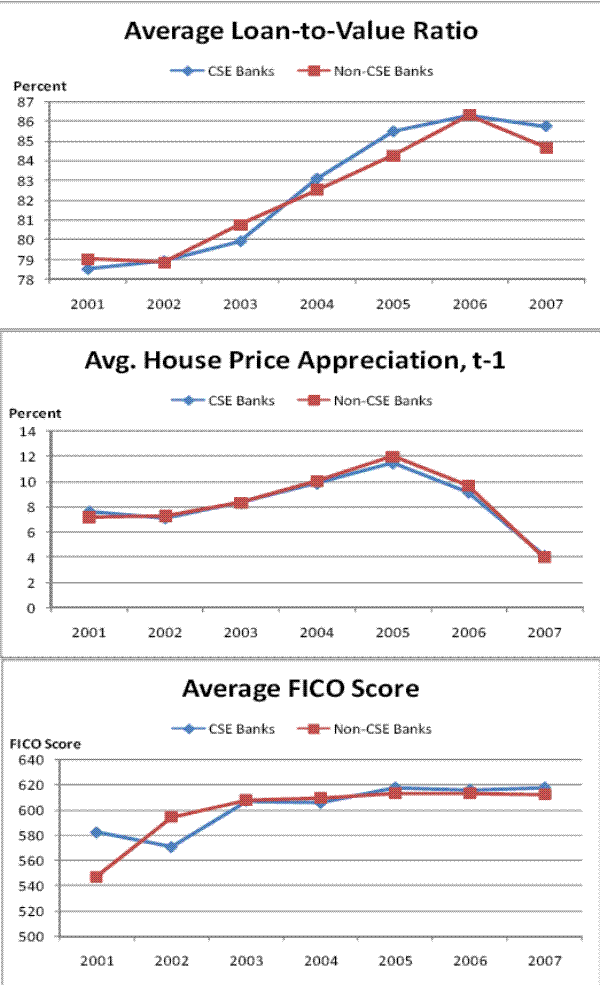
Table 1. Deal Summary Statistics.
| N | Mean | Med | Std. Dev. | 5% | 95% | |
|---|---|---|---|---|---|---|
| Size of AAA Tranche | 1267 | 0.805 | 0.798 | 0.073 | 0.717 | 0.929 |
| Size of Investment Grade Tranche | 1267 | 0.950 | 0.965 | 0.062 | 0.872 | 0.994 |
| Excess Spread | 1250 | 4.04 | 3.64 | 1.38 | 2.43 | 6.37 |
| Deal Coupon Spread | 1267 | 0.442 | 0.405 | 0.294 | 0.176 | 0.832 |
| Deal FICO | 1254 | 623.7 | 621.3 | 21.7 | 564.1 | 657.2 |
| Deal CLTV | 1266 | 83.91 | 83.95 | 6.06 | 76.68 | 92.58 |
| Deal DTI | 1030 | 40.71 | 41.01 | 2.68 | 37.82 | 43.33 |
| Deal ARM | 1267 | 0.777 | 0.817 | 0.178 | 0.414 | 0.951 |
| Deal Unemployment Rate | 1267 | 5.17 | 5.05 | 0.65 | 4.31 | 6.24 |
| House Price Appreciation t-1 | 1267 | 12.95 | 13.41 | 4.25 | 5.07 | 18.85 |
| Housing Market Correlation | 1264 | 0.307 | 0.313 | 0.043 | 0.236 | 0.370 |
| Geographic Concentration | 1264 | 0.134 | 0.117 | 0.074 | 0.051 | 0.281 |
| Implied-to-Actual Rent Ratio | 1249 | 1.090 | 1.072 | 0.109 | 0.947 | 1.262 |
| Percent with Prepayment Penalty | 1267 | 0.711 | 0.745 | 0.186 | 0.134 | 0.897 |
| Average Prepayment Term | 1267 | 19.83 | 19.98 | 6.380 | 2.060 | 28.61 |
This table reports summary statistics related to the structure of subprime securitization deals. The sample runs from 1997-2007. Size of the AAA tranche is defined as the total principal balance of tranches with a "AAA" rating at the time of deal origination divided by the total principal of the deal. Size of the investment-grade tranche is the sum of all tranches with an original credit rating of "BBB+" or higher (or the Moody's equivalent when relevant), divided by the total principal balance of the deal. Excess spread is calculated as the difference between the deal origination loan-weighted mortgage rate and the first coupon promised to investors. Deal FICO is a loan-weighted average of the deal FICO scores at origination. Deal CLTV is the loan-weighted average of a borrower's combined loan-to-value ratio at deal origination. Deal DTI is the loan-weighted average of a borrower's debt-to-income ratio at deal origination. The deal unemployment rate is calculated as the loan-weighted state unemployment rate at the time of deal origination. House Price Appreciation t-1 is calculated as the one-year growth rate in residential house prices in the ZIP-code or state of loan origination and is aggregated to the deal level using loan sizes as weights. Housing market diversification is a measure of the correlation of the housing markets in which the loans were originated. Geographic diversification is a Herfindahl index measuring the geographic concentration of loans in the deal. The text of the paper contains a detailed description of how the two measures of diversification are computed. The implied-to-actual rent ratio is a measure of how "expensive" a housing market is relative to its 25-year average. The ratio is calculated and made publicly available by Chris Mayer at http://www4.gsb.columbia.edu/realestate/research/housing. The text outlines how we aggregate MSA-level measures of housing market fundamentals to the deal level. Deal coupon spread is the spread between coupon rates being paid to bond investors over 1-month libor (where 1-month libor is measured as the monthly average in the month of deal close). Deal coupon spread is calculated for tranches that pay floating coupon payments to bond investors. The coupon spread is aggregated to the deal level using tranche sizes as weights.
Table 2. Deal Summary Statistics through Time.
| Year | Avg. Deal Size ($ Mill.) | N | Proportion of Deal Rated AAA | Proportion of Deal Rated Investment Grade | Excess Spread (%) | Deal Mortgage Rate at Origination (%) | Rate of First Coupon (%) | Deal Coupon Spread | Default Rate* (%) |
|---|---|---|---|---|---|---|---|---|---|
| 1997 | $189 | 5 | 0.872 | 0.884 | 2.693 | 9.665 | 6.900 | . | 0.230 |
| 1998 | $378 | 6 | 0.987 | 0.996 | 3.585 | 9.716 | 6.126 | 0.597 | 6.340 |
| 1999 | $540 | 13 | 0.874 | 0.942 | 4.160 | 9.912 | 5.848 | 0.721 | 4.410 |
| 2000 | $478 | 16 | 0.848 | 0.923 | 4.661 | 11.094 | 6.433 | 0.805 | 8.940 |
| 2001 | $828 | 32 | 0.880 | 0.984 | 5.953 | 9.981 | 3.984 | 0.555 | 7.340 |
| 2002 | $773 | 69 | 0.868 | 0.979 | 6.199 | 8.647 | 2.452 | 0.575 | 5.220 |
| 2003 | $870 | 135 | 0.856 | 0.983 | 5.749 | 7.679 | 1.955 | 0.657 | 4.110 |
| 2004 | $1,103 | 233 | 0.821 | 0.966 | 5.094 | 7.136 | 2.041 | 0.533 | 4.010 |
| 2005 | $1,107 | 302 | 0.794 | 0.956 | 3.457 | 7.207 | 3.750 | 0.419 | 5.630 |
| 2006 | $1,018 | 321 | 0.774 | 0.933 | 2.915 | 8.037 | 5.121 | 0.268 | 13.740 |
| 2007 | $854 | 135 | 0.755 | 0.901 | 2.927 | 8.232 | 5.305 | 0.374 | . |
This table documents key subprime securitization deal summary statistics through time. The sample runs from 1997-2007. Size of the AAA tranche is defined as the total principal balance of tranches with a "AAA" rating at the time of deal origination divided by the total principal of the deal. Size of the investment-grade tranche is the sum of all tranches with an original credit rating of "BBB+" or higher (or the Moody's equivalent when relevant), divided by the total principal balance of the deal. Excess spread is calculated as the difference between the origination loan-weighted mortgage rate and the first coupon promised to investors. The origination deal mortgage rate is the mortgage rate being paid by the borrower at loan origination, loan-weighted to the deal level. Rate of first coupon is the first coupon payment being paid to bondholders, and is weighted by the size of each tranche. Default rate calculates the total number of loans in foreclosure or default by the end of the year after the loan was originated. Housing market diversification is a measure of the correlation of the housing markets in which the loans were originated. Geographic concentration is a Herfindahl index measuring the geographic concentration of loans in the deal. The text of the paper contains a detailed description of how the two measures of diversification are computed. The implied-to-actual rent ratio is a measure of how "expensive" a housing market is relative to its 25 year average. The ratio is calculated and made publicly available by Chris Mayer at http://www4.gsb.columbia.edu/realestate/research/housing. The text outlines how we aggregate MSA-level measures of housing market fundamentals to the deal level. Deal coupon spread is the spread between coupon rates being paid to bond investors over 1-month libor (where 1-month libor is measured as the monthly average in the month of deal close). Deal coupon spread is calculated for tranches that pay floating coupon payments to bond investors. The coupon spread is aggregated to the deal level using tranche sizes as weights.
Table 3. Deal-Level, Loan Attribute Summary Statistics through Time.
| Year | N | FICO | L.T.V. (%) | D.T.I.* (%) | Owner Occ. | Full Doc. | ARM | H.P.A.t-1(%) | H.P.A.t-1 Std Dev. (%) | Unemployment Rate (%) | Housing Market Correlation | Geographic Concentration | Implied-to-Actual Rent Ratio |
|---|---|---|---|---|---|---|---|---|---|---|---|---|---|
| 1997 | 5 | 76.3 | 0.784 | 0.365 | 2.796 | 1.188 | 5.16 | 0.225 | 0.081 | 0.882 | |||
| 1998 | 6 | 612.9 | 74.7 | 0.933 | 0.625 | 0.242 | 4.435 | 1.130 | 4.73 | 0.257 | 0.079 | 0.788 | |
| 1999 | 13 | 598.2 | 77.1 | 35.8 | 0.936 | 0.483 | 0.463 | 6.359 | 1.214 | 4.48 | 0.252 | 0.078 | 0.838 |
| 2000 | 16 | 590.0 | 77.7 | 35.2 | 0.923 | 0.691 | 0.545 | 7.777 | 1.273 | 3.97 | 0.246 | 0.099 | 0.971 |
| 2001 | 32 | 597.2 | 78.5 | 39.2 | 0.934 | 0.745 | 0.669 | 9.476 | 1.262 | 4.62 | 0.256 | 0.102 | 0.975 |
| 2002 | 69 | 613.6 | 79.5 | 38.7 | 0.941 | 0.680 | 0.704 | 8.803 | 1.589 | 5.94 | 0.279 | 0.134 | 0.993 |
| 2003 | 135 | 623.5 | 79.9 | 39.3 | 0.941 | 0.679 | 0.674 | 10.838 | 2.048 | 6.13 | 0.287 | 0.142 | 0.983 |
| 2004 | 233 | 622.9 | 83.5 | 40.2 | 0.935 | 0.612 | 0.765 | 13.840 | 2.388 | 5.77 | 0.299 | 0.158 | 1.030 |
| 2005 | 302 | 628.8 | 85.1 | 40.7 | 0.932 | 0.580 | 0.840 | 16.643 | 2.274 | 5.14 | 0.313 | 0.142 | 1.078 |
| 2006 | 321 | 626.2 | 86.4 | 42.0 | 0.933 | 0.557 | 0.844 | 14.560 | 2.950 | 4.65 | 0.326 | 0.126 | 1.208 |
| 2007 | 135 | 624.3 | 85.0 | 41.9 | 0.927 | 0.581 | 0.756 | 6.401 | 3.150 | 4.42 | 0.326 | 0.107 | 1.212 |
* Debt-to-income data is only available for about 80% of the deals. The missing data is distributed evenly across time.
Table 3 reports deal-level attributes of the loans included in subprime securitization deals. The sample runs from 1997-2007. Deal FICO is a loan-weighted average of the borrower FICO scores at origination. Deal CLTV is the loan-weighted average of a borrower's combined loan-to-value ratio at deal origination. Deal DTI is the loan-weighted average of a borrower's debt-to-income ratio at deal origination. Owner occ. is reported at the loan level as a dummy variable equal to one if the borrower lives in the home for which the loan was originated. Full doc is a dummy variable equal to one if the borrower presented full documentation in support of reported income at the time of origination. ARM is a dummy variable equal to one if the loan is an adjustable-rate mortgage. Each of these dummy variables is aggregated to the deal level by taking the loan-weighted average. House Price Appreciation t-1 is calculated as the one-year growth rate in residential house prices of the ZIP-code or state of loan origination and is aggregated to the deal level by summing the loan-weighted average one-year appreciation rate. The deal unemployment rate is calculated as the loan-weighted state unemployment rate at the time of deal origination.
Table 4. Summary Statistics on Bank-ZIP-Year Panel Data
| Year | # Bank-ZIP-Years | CSE Bank Average: LTV | CSE Bank Average: H.P.A.t-1 | CSE Bank Average: FICO | CSE Bank Average: D.T.I. | # Bank-ZIP-Years | Non CSE-Bank Average:LTV | Non CSE-Bank Average: H.P.A.t-1 | Non CSE-Bank Average: FICO | Non CSE-Bank Average: D.T.I. |
|---|---|---|---|---|---|---|---|---|---|---|
| 1997 | 1716 | 72.46 | 3.09 | - | - | 5345 | 74.69 | 2.99 | - | - |
| 1998 | 5092 | 75.97 | 5.09 | - | - | 9473 | 73.75 | 4.45 | 374 | - |
| 1999 | 24884 | 76.60 | 5.87 | 440 | 25.07 | 16122 | 76.49 | 6.46 | 459 | 31.33 |
| 2000 | 13408 | 60.17 | 7.25 | 524 | 19.15 | 28298 | 76.99 | 7.44 | 519 | 24.60 |
| 2001 | 19312 | 78.51 | 7.64 | 582 | 17.99 | 53848 | 79.01 | 7.17 | 547 | 28.87 |
| 2002 | 26047 | 78.92 | 7.09 | 571 | 28.35 | 91400 | 78.86 | 7.26 | 595 | 21.64 |
| 2003 | 48830 | 79.92 | 8.28 | 607 | 28.24 | 129681 | 80.75 | 8.31 | 608 | 26.17 |
| 2004 | 74950 | 83.10 | 9.82 | 605 | 31.39 | 150535 | 82.52 | 10.03 | 610 | 26.67 |
| 2005 | 80511 | 85.49 | 11.43 | 617 | 32.49 | 168461 | 84.27 | 11.97 | 613 | 25.23 |
| 2006 | 78076 | 86.32 | 9.13 | 616 | 36.26 | 176853 | 86.32 | 9.68 | 613 | 33.07 |
| 2007 | 55653 | 85.76 | 4.13 | 617 | 35.86 | 97113 | 84.68 | 4.00 | 613 | 35.63 |
Our panel data set of bank-zip-years runs from 1997-2007. The final dataset is created by identifying the total number of subprime loans in each ZIP code in each year that were owned by the five CSE investment banks and the total number of subprime loans owned by the non-CSE banks involved in loan securitization. This table reports the average attributes of the bank-ZIP-year data through time. The text outlines the details associated with the assignment of CSE bank indicator. Data on FICO scores and debt-to-income ratios are missing early in the sample period.
Table 5. Summary Data on "Higher-Priced" Mortgage Originations
| Year | # Zip Codes | 10% | Median | Mean | 90% | Std Dev | |
|---|---|---|---|---|---|---|---|
| Panel A: Number of Subprime Loans/Total Housing Units | 2005 | 15139 | 0.017 | 0.037 | 0.058 | 0.116 | 0.076 |
| Panel B: Loans Sold as a Percent of Loans Originated | 2005 | 15259 | 0.500 | 0.720 | 0.685 | 0.814 | 0.129 |
| Panel C: ZIP Code Denial Rates | 2005 | 15264 | 0.171 | 0.266 | 0.277 | 0.400 | 0.090 |
| Panel D: Change in Mkt Share of 5 CSE Banks | 2005 | 2923 | 0.182 | 0.549 | 0.609 | 1.096 | 0.396 |
Table 6. Rates of House Price Appreciation and Deal Credit Ratings.
| Year | 1997-2007 | 2003 | 2004 | 2005 | 2006 | 2007 |
|---|---|---|---|---|---|---|
| Deal H.P.A. t-1 | 0.002*** | 0.017*** | -0.007 | 0.011*** | 0.002** | 0.003* |
| Deal H.P.A. t-1, robust t statistic | (4.28) | (2.95) | (1.55) | (3.28) | (2.46) | (1.68) |
| Housing Market Correlation | -0.062 | -0.414* | 0.171 | -0.131 | -0.054 | -0.007 |
| Housing Market Correlation, robust t statistic | (0.96) | (1.80) | (1.14) | (1.65) | (0.92) | (0.07) |
| Geographic Concentration | -0.090*** | -0.221** | 0.178 | -0.270*** | -0.038 | -0.009 |
| Geographic Concentration, robust t statistic | (2.87) | (2.48) | (1.49) | (3.55) | (1.39) | (0.06) |
| FICO | 0.001*** | 0.000 | 0.001** | 0.001*** | 0.001*** | 0.001** |
| FICO, robust t statistic | (6.49) | (0.36) | (2.65) | (3.90) | (12.17) | (2.12) |
| Loan-to-value | -0.001* | -0.003*** | -0.003* | -0.001 | -0.001 | -0.002 |
| Loan-to-value, robust t statistic | (1.84) | (3.65) | (1.78) | (1.13) | (1.69) | (1.54) |
| ARM | -0.016 | 0.036 | 0.004 | -0.093*** | -0.024 | -0.007 |
| ARM, robust t statistic | (0.95) | (1.41) | (0.17) | (3.22) | (1.12) | (0.19) |
| Owner Occ. | 0.005 | 0.097 | -0.031 | -0.013 | -0.116 | -0.055 |
| Owner Occ., robust t statistic | (0.11) | (0.45) | (0.20) | (0.31) | (1.20) | (0.37) |
| Full Doc. | 0.026* | 0.052 | 0.064* | 0.042** | 0.030 | 0.067 |
| Full Doc., robust t statistic | (1.70) | (0.91) | (1.89) | (2.43) | (1.46) | (1.45) |
| Purchase | -0.009 | 0.052** | -0.050 | -0.056** | -0.011 | 0.126* |
| Purchase, robust t statistic | (0.58) | (2.47) | (1.06) | (2.24) | (0.47) | (1.99) |
| Unemployment | 0.003 | -0.024 | -0.049** | 0.058*** | -0.023* | -0.142*** |
| Unemployment, robust t statistic | (0.54) | (1.40) | (2.75) | (3.30) | (1.72) | (3.46) |
| Excess Spread | 0.000 | -0.013** | 0.008 | 0.002 | -0.006 | -0.004 |
| Excess Spread, robust t statistic | (0.00) | (2.32) | (0.79) | (0.38) | (1.13) | (0.35) |
| External Insurance Dummy | 0.048*** | 0.075*** | 0.028 | 0.073** | -0.027 | 0.075** |
| External Insurance Dummy, robust t statistic | (5.66) | (5.02) | (1.46) | (2.76) | (1.48) | (2.46) |
| Prepayment Penalty | -0.053*** | -0.074 | -0.051 | 0.002 | -0.045* | -0.203*** |
| Prepayment Penalty, robust t statistic | (3.27) | (1.52) | (1.20) | (0.08) | (1.90) | (2.91) |
| Prepayment Term | 0.001 | 0.001 | 0.000 | -0.001 | 0.001* | 0.005** |
| Prepayment Term, robust t statistic | (1.54) | (0.94) | (0.28) | (0.62) | (1.74) | (2.48) |
| Constant | 1225 | 132 | 227 | 298 | 317 | 134 |
| Constant, robust t statistic | 0.573 | 0.461 | 0.243 | 0.346 | 0.448 | 0.467 |
| Year Fixed Effects | Yes | - | - | - | - | - |
| Std. Err. Clustered by Issuer | Yes | Yes | Yes | Yes | Yes | Yes |
| Observations | 1225 | 132 | 227 | 298 | 317 | 134 |
| Adjusted R-squared | 0.573 | 0.461 | 0.243 | 0.346 | 0.448 | 0.467 |
* significant at 10%; ** significant at 5%; *** significant at 1%
This table presents the results of OLS regressions using deal data from 1997-2007. The dependent variable is the proportion of the deal's principal rated AAA. The key independent variable, labeled Deal H.P.A. t-1 is a measure of house price appreciation in markets where individual loans were originated. The variable is aggregated to the deal level by size of the loan. Housing market diversification is a measure of the correlation of the housing markets in which the loans were originated. Geographic concentration is a Herfindahl index measuring the geographic concentration of loans in the deal. The text of the paper contains a detailed description of how the two measures of diversification are computed. The remaining independent variables are loan-level borrower attributes that have been aggregated to the deal level. The deal-level unemployment rate is included to control for macroeconomic conditions in local markets at the time of deal origination. We also include time fixed effects to control for other macroeconomic factors that may change through time. Tables 1-3 contain summary statistics and units for each of the variables used in the regression.
Table 7. Rates of House Price Appreciation and the Cost of Funds.
| Year | 1997-2007 | 2003 | 2004 | 2005 | 2006 | 2007 |
|---|---|---|---|---|---|---|
| Deal H.P.A. t-1 | -0.005 | -0.049* | -0.021** | 0.005 | 0.007*** | -0.025** |
| Deal H.P.A. t-1, robust t statistic | (1.21) | (2.63) | (2.72) | (0.67) | (3.27) | (2.83) |
| Housing Market Correlation | -0.468* | 0.871 | -0.001 | -0.006 | 0.042 | 0.259 |
| Housing Market Correlation, robust t statistic | (1.76) | (0.64) | (0.00) | (0.02) | (0.18) | (0.50) |
| Geographic Concentration | 0.298* | 1.179 | 0.580 | -0.186 | 0.188 | 0.175 |
| Geographic Concentration, robust t statistic | (1.97) | (1.70) | (1.51) | (0.87) | (1.07) | (0.40) |
| FICO | 0.000 | 0.003 | -0.001 | -0.001 | -0.001* | 0.001 |
| FICO , robust t statistic | (0.26) | (1.10) | (1.24) | (1.47) | (1.74) | (0.55) |
| Loan-to-value | 0.002 | 0.015** | 0.003 | -0.001 | -0.000 | -0.003 |
| Loan-to-value, robust t statistic | (0.90) | (2.78) | (1.09) | (0.24) | (0.15) | (0.42) |
| ARM | -0.552*** | -0.074 | -0.101 | -0.488*** | -0.483*** | -0.877*** |
| ARM, robust t statistic | (8.67) | (0.34) | (1.06) | (3.64) | (4.12) | (3.58) |
| Owner Occ. | -0.652** | -3.488** | -0.634* | 0.050 | -0.133 | 1.188** |
| Owner Occ., robust t statistic | (2.67) | (2.09) | (1.79) | (0.29) | (0.72) | (2.13) |
| Full Doc. | 0.054 | 0.022 | 0.002 | 0.037 | 0.045 | -0.161 |
| Full Doc. , robust t statistic | (0.97) | (0.08) | (0.04) | (0.65) | (0.79) | (1.09) |
| Purchase | -0.054 | -0.148 | -0.036 | 0.134 | 0.114 | -0.438 |
| Purchase, robust t statistic | (0.82) | (0.56) | (0.54) | (1.64) | (1.30) | (1.00) |
| Unemployment | 0.019 | -0.170 | -0.058 | 0.193*** | 0.087** | 0.786*** |
| Unemployment, robust t statistic | (0.75) | (1.27) | (0.79) | (4.11) | (2.18) | (3.03) |
| Excess Spread | -0.042*** | -0.113* | -0.103*** | -0.040* | 0.013 | -0.045 |
| Excess Spread, robust t statistic | (3.15) | (1.76) | (8.74) | (1.75) | (0.78) | (0.97) |
| External Insurance Dummy | -0.028 | -0.153** | -0.086*** | -0.044 | -0.009 | 0.059 |
| External Insurance Dummy, robust t statistic | (0.58) | (2.28) | (3.24) | (1.72) | (0.20) | (0.89) |
| Prepayment Penalty | 0.237** | 0.621 | -0.039 | -0.021 | 0.211** | 0.979*** |
| Prepayment Penalty, robust t statistic | (2.10) | (1.12) | (0.44) | (0.15) | (2.16) | (4.21) |
| Prepayment Term | -0.002 | -0.002 | 0.003 | -0.002 | -0.009*** | -0.032*** |
| Prepayment Term, robust t statistic | (1.18) | (0.35) | (0.64) | (0.64) | (2.99) | (2.92) |
| Constant | 1.420*** | 3.224 | 2.507*** | 0.500 | 0.780 | -3.628 |
| Constant, robust t statistic | (3.92) | (1.52) | (5.46) | (0.80) | (1.61) | (1.36) |
| Year Fixed Effects | Yes | - | - | - | - | - |
| Std. Err. Clustered by Issuer | Yes | Yes | Yes | Yes | Yes | Yes |
| Observations | 1225 | 132 | 227 | 298 | 317 | 134 |
| Adjusted R-squared | 0.379 | 0.228 | 0.209 | 0.155 | 0.233 | 0.445 |
* significant at 10%; ** significant at 5%; *** significant at 1%
This table presents the results of OLS regressions using deal data from 1997-2007. The dependent variable is the spread of coupon rates being paid to bond investors over 1-mth libor. Deal coupon spread is calculated for tranches that pay floating coupon payments to bond investors. The coupon spread is aggregated to the deal level using tranche sizes as weights. Deal H.P.A. t-1 is a measure of house price appreciation in markets where individual loans were originated. The variable is aggregated to the deal level by size of the loan. Housing market diversification is a measure of the correlation of the housing markets in which the loans were originated. Geographic diversification is a Herfindahl index measuring the geographic concentration of loans in the deal. The text of the paper contains a detailed description of how the two measures of diversification are computed. The remaining independent variables are loan-level borrower attributes that have been aggregated to the deal level. The deal-level unemployment rate is included to control for macroeconomic conditions in local markets at the time of deal origination. We also include time fixed effects to control for other macroeconomic factors that may change through time. Tables 1-3 contain summary statistics and units for each of the variables used in the regression.
Table 8. Number of Deals per Underwriter
| Underwriter | 1997 | 1998 | 1999 | 2000 | 2001 | 2002 | 2003 | 2004 | 2005 | 2006 | 2007 | Total |
|---|---|---|---|---|---|---|---|---|---|---|---|---|
| Lehman Brothers | 0 | 0 | 4 | 3 | 3 | 8 | 16 | 20 | 31 | 31 | 14 | 130 |
| Bear Stearns & Co. Inc | 0 | 0 | 3 | 1 | 1 | 1 | 6 | 23 | 34 | 27 | 16 | 112 |
| Greenwich Capital | 0 | 0 | 1 | 5 | 11 | 9 | 13 | 18 | 20 | 24 | 9 | 110 |
| Morgan Stanley | 1 | 1 | 0 | 1 | 0 | 4 | 12 | 29 | 29 | 20 | 13 | 110 |
| Credit Suisse | 0 | 1 | 1 | 0 | 8 | 10 | 13 | 23 | 25 | 13 | 6 | 100 |
| Merrill Lynch | 0 | 0 | 2 | 0 | 1 | 0 | 4 | 12 | 31 | 34 | 9 | 93 |
| Deutsche Bank Securities Inc. | 0 | 0 | 1 | 1 | 2 | 7 | 13 | 15 | 20 | 24 | 8 | 91 |
| Goldman Sachs | 0 | 0 | 0 | 0 | 0 | 3 | 5 | 17 | 20 | 22 | 9 | 76 |
| Bank of America | 0 | 0 | 0 | 2 | 3 | 8 | 14 | 18 | 11 | 6 | 5 | 67 |
| Citigroup Global Markets Inc. | 0 | 0 | 0 | 0 | 0 | 2 | 6 | 9 | 16 | 17 | 14 | 64 |
| JP Morgan | 0 | 0 | 0 | 0 | 5 | 7 | 7 | 4 | 8 | 21 | 8 | 60 |
| UBS | 0 | 0 | 0 | 0 | 0 | 1 | 8 | 13 | 15 | 20 | 3 | 60 |
| Barclays | 0 | 0 | 0 | 0 | 0 | 0 | 0 | 8 | 15 | 19 | 8 | 50 |
| RBS Greenwich | 0 | 0 | 0 | 0 | 0 | 1 | 3 | 10 | 10 | 6 | 8 | 38 |
| Countrywide Securities Corp. | 0 | 0 | 0 | 0 | 0 | 4 | 8 | 14 | 5 | 0 | 0 | 31 |
| HSBC | 0 | 0 | 0 | 0 | 0 | 0 | 0 | 0 | 4 | 13 | 6 | 23 |
| Residential Funding Corp. | 0 | 0 | 0 | 0 | 0 | 0 | 0 | 0 | 5 | 8 | 1 | 14 |
| Washington Mutual | 0 | 0 | 0 | 0 | 0 | 0 | 0 | 0 | 0 | 9 | 0 | 9 |
| Others | 4 | 4 | 2 | 3 | 0 | 5 | 7 | 2 | 5 | 10 | 1 | 43 |
| Total | 5 | 6 | 14 | 16 | 34 | 70 | 135 | 235 | 304 | 324 | 138 | 1281 |
| 5 CSE Broker-Dealers Total | 1 | 1 | 9 | 5 | 5 | 16 | 43 | 101 | 145 | 134 | 61 | 521 |
| 5 CSE Broker-Dealers Share of Total | 20.0% | 16.7% | 64.3% | 31.3% | 14.7% | 22.9% | 31.9% | 43.0% | 47.7% | 41.4% | 44.2% | 40.7% |
| All Other Banks Total | 4 | 5 | 5 | 11 | 29 | 54 | 92 | 134 | 159 | 190 | 77 | 760 |
| All Other Banks Share of Total | 80.0% | 83.3% | 35.7% | 68.8% | 85.3% | 77.1% | 68.1% | 57.0% | 52.3% | 58.6% | 55.8% | 59.3% |
Table 9. Analyzing the Purchasing Activity of Deal Underwriters.
| ZIP Code H.P.A. t-1 | 0.035*** | 0.034*** | 0.030*** | 0.024*** | |
|---|---|---|---|---|---|
| ZIP Code H.P.A. t-1: Standard Error | (13.62) | (14.46) | (5.18) | (4.81) | |
| ZIP Code Avg. FICO | 0.000*** | 0.000** | 0.000 | 0.000 | |
| ZIP Code Avg. FICO: Standard Error | (2.93) | (1.99) | (1.45) | (1.00) | |
| ZIP Code Avg. DTI | 0.004* | 0.003 | 0.003 | 0.002 | |
| ZIP Code Avg. DTI: Standard Error | (1.79) | (1.38) | (1.42) | (1.12) | |
| ZIP Code Avg. L.T.V. | 0.010*** | 0.009*** | 0.010*** | 0.011*** | |
| ZIP Code Avg. L.T.V.: Standard Error | (5.73) | (5.05) | (5.65) | (5.50) | |
| ZIP Code Percent Adj. Rate | 0.181*** | 0.163*** | 0.171*** | 0.175*** | |
| ZIP Code Percent Adj. Rate: Standard Error | (5.89) | (5.85) | (5.79) | (4.93) | |
| CSE Bank Indicator | -0.106 | -0.065 | 0.537** | 0.624** | |
| CSE Bank Indicator: Standard Error | (1.16) | (0.63) | (2.17) | (2.26) | |
| Post-2003 Indicator | 0.234** | 0.060 | -0.192 | -0.151 | |
| Post-2003 Indicator: Standard Error | (2.21) | (0.70) | (0.66) | (0.43) | |
| Post-2003 * CSE Bank Indicator | 0.355*** | 0.316*** | -0.898* | -0.942 | |
| Post-2003 * CSE Bank Indicator: Standard Error | (3.91) | (3.07) | (1.67) | (1.32) | |
| CSE Bank Indicator * ZIP Code H.P.A. t-1 | 0.001 | 0.001 | |||
| CSE Bank Indicator * ZIP Code H.P.A. t-1: Standard Error | (0.20) | (0.22) | |||
| CSE Bank Indicator * ZIP Code Avg. FICO | -0.000 | -0.000 | |||
| CSE Bank Indicator * ZIP Code Avg. FICO: Standard Error | (0.88) | (0.54) | |||
| CSE Bank Indicator * ZIP Code Avg. L.T.V. | -0.006*** | -0.007*** | |||
| CSE Bank Indicator * ZIP Code Avg. L.T.V.: Standard Error | (3.52) | (3.76) | |||
| Post-2003 * ZIP Code H.P.A. t-1 | 0.001 | 0.003 | |||
| Post-2003 * ZIP Code H.P.A. t-1: Standard Error | (0.23) | (0.58) | |||
| Post-2003 * ZIP Code Avg. FICO | 0.001* | 0.000 | |||
| Post-2003 * ZIP Code Avg. FICO: Standard Error | (1.91) | (1.18) | |||
| Post-2003 * ZIP Code Avg. L.T.V. | -0.001 | -0.002 | |||
| Post-2003 * ZIP Code Avg. L.T.V.: Standard Error | (0.52) | (0.49) | |||
| CSE Bank Indicator * Post-2003 * ZIP Code H.P.A. t-1 | 0.011 | 0.012** | |||
| CSE Bank Indicator * Post-2003 * ZIP Code H.P.A. t-1: Standard Error | (1.58) | (2.25) | |||
| CSE Bank Indicator * Post-2003 * ZIP Code Avg. FICO | 0.001 | 0.000 | |||
| CSE Bank Indicator * Post-2003 * ZIP Code Avg. FICO: Standard Error | (0.95) | (0.25) | |||
| CSE Bank Indicator * Post-2003 * ZIP Code Avg. L.T.V. | 0.010*** | 0.012*** | |||
| CSE Bank Indicator * Post-2003 * ZIP Code Avg. L.T.V.: Standard Error | (3.38) | (2.82) | |||
| Constant | -0.689*** | 0.762*** | -0.530*** | -0.584*** | 0.015 |
| Constant: Standard Error | (4.06) | (9.06) | (3.12) | (2.69) | (0.06) |
| Standard Error Clustered by Underwriter | Yes | Yes | Yes | Yes | Yes |
| Standard Error Clustered by Year | Yes | Yes | Yes | Yes | Yes |
| Observations | 1355608 | 1355608 | 1355608 | 1355608 | 816114 |
| Adjusted R-squared | 0.098 | 0.035 | 0.111 | 0.115 | 0.128 |
In this table we estimate an OLS regression where the natural log of the total number of subprime loans purchased in each ZIP code in each year by each underwriting bank is the dependent variable. Our panel data set of bank-zip-years runs from 1997-2007. The final dataset used in the estimation is created by identifying the total number of subprime loans in each ZIP code in each year that were owned by the five CSE investment banks and the total number of subprime loans owned by the non-CSE banks involved in loan securitization. Column 5 restricts the sample to bank-ZIP-years with more than one subprime loan in order to get a more precise estimate on average ZIP-code loan attributes. The text outlines the details associated with the assignment of CSE bank indicator. The estimation controls for ZIP-code fixed effects, and clusters standard errors by year.
Table 10. Bank-Specific Default Rates
| ZIP Code H.P.A. t-1 | -0.0021 | -0.0015 | -0.0234*** | -0.0179*** | |
|---|---|---|---|---|---|
| ZIP Code H.P.A. t-1: Standard Error | (-0.591) | (-0.418) | (-13.55) | (-12.13) | |
| ZIP Code Avg. FICO | -0.0006*** | -0.0005*** | -0.0003* | -0.0003* | |
| ZIP Code Avg. FICO: Standard Error | (-4.262) | (-3.207) | (-1.659) | (-1.655) | |
| ZIP Code Avg. DTI | 0.0010* | 0.0012** | 0.0015*** | 0.0008** | |
| ZIP Code Avg. DTI: Standard Error | (1.706) | (2.354) | (3.108) | (2.044) | |
| ZIP Code Avg. L.T.V. | 0.0062*** | 0.0068*** | 0.0065*** | 0.0040*** | |
| ZIP Code Avg. L.T.V.: Standard Error | (4.315) | (5.508) | (7.822) | (4.610) | |
| ZIP Code Percent Adj. Rate | 0.1773*** | 0.1922*** | 0.1930*** | 0.1382*** | |
| ZIP Code Percent Adj. Rate: Standard Error | (8.105) | (8.642) | (8.696) | (5.574) | |
| CSE Bank Indicator | 0.0052 | 0.0043 | 0.4486*** | 0.3453*** | |
| CSE Bank Indicator: Standard Error | (0.269) | (0.202) | (3.355) | (3.005) | |
| Post-2003 Indicator | -0.0391 | -0.0886 | -0.2213 | -0.3274 | |
| Post-2003 Indicator: Standard Error | (-0.689) | (-1.503) | (-1.064) | (-1.542) | |
| Post-2003 * CSE Bank Indicator | 0.0330 | 0.0293 | -0.3018** | -0.1305 | |
| Post-2003 * CSE Bank Indicator: Standard Error | (1.394) | (1.216) | (-2.088) | (-0.927) | |
| CSE Bank Indicator * ZIP Code H.P.A. t-1 | 0.0024 | 0.0009 | |||
| CSE Bank Indicator * ZIP Code H.P.A. t-1: Standard Error | (1.498) | (1.117) | |||
| CSE Bank Indicator * ZIP Code Avg. FICO | 0.0000 | 0.0001 | |||
| CSE Bank Indicator * ZIP Code Avg. FICO: Standard Error | (0.258) | (0.470) | |||
| CSE Bank Indicator * ZIP Code Avg. L.T.V. | -0.0061*** | -0.0049*** | |||
| CSE Bank Indicator * ZIP Code Avg. L.T.V.: Standard Error | (-3.541) | (-4.031) | |||
| Post-2003 * ZIP Code H.P.A. t-1 | 0.0260*** | 0.0176*** | |||
| Post-2003 * ZIP Code H.P.A. t-1: Standard Error | (6.411) | (6.427) | |||
| Post-2003 * ZIP Code Avg. FICO | -0.0006* | -0.0003 | |||
| Post-2003 * ZIP Code Avg. FICO: Standard Error | (-1.925) | (-0.789) | |||
| Post-2003 * ZIP Code Avg. L.T.V. | 0.0035*** | 0.0034*** | |||
| Post-2003 * ZIP Code Avg. L.T.V.: Standard Error | (4.479) | (4.335) | |||
| CSE Bank Indicator * Post-2003 * ZIP Code H.P.A. t-1 | -0.0012 | -0.0004 | |||
| CSE Bank Indicator * Post-2003 * ZIP Code H.P.A. t-1: Standard Error | (-0.723) | (-0.443) | |||
| CSE Bank Indicator * Post-2003 * ZIP Code Avg. FICO | -0.0001 | -0.0003 | |||
| CSE Bank Indicator * Post-2003 * ZIP Code Avg. FICO: Standard Error | (-0.829) | (-1.465) | |||
| CSE Bank Indicator * Post-2003 * ZIP Code Avg. L.T.V. | 0.0053*** | 0.0037*** | |||
| CSE Bank Indicator * Post-2003 * ZIP Code Avg. L.T.V.: Standard Error | (2.978) | (2.858) | |||
| Constant | -0.5797*** | -0.2488*** | -0.6469*** | -0.5482*** | -0.1054 |
| Constant: Standard Error | (-4.457) | (-4.683) | (-5.183) | (-5.112) | (-0.936) |
| Sigma | 0.5901*** | 0.5980*** | 0.5884*** | 0.5836*** | 0.3338*** |
| Sigma: Standard Error | (14.46) | (15.00) | (14.77) | (15.22) | (19.05) |
| Standard Error Clustered by Year | Yes | Yes | Yes | Yes | Yes |
| Observations | 1356972 | 1356972 | 1356972 | 1356972 | 816452 |
| Psuedo R-squared | .018 | .001 | .020 | .028 | .048 |
In this table we estimate a Tobit regression where the default rate on subprime mortgage loans owned by each of the securitizing banks is the dependent variable. We estimate a Tobit regression to account for the large number of bank-ZIP-year observations with zero defaults. Our bank-ZIP-year default rate is calculated as the total number of defaults as of July 2008 on loans purchased by a given bank in a given ZIP in a given year as a percentage of the total number of subprime loans purchased by a bank in a given year in a given ZIP code. The panel data set of bank-ZIP-years runs from 1997-2007. We assign a dummy variable equal to one for the bank-ZIP-years of the five CSE investment banks. The text outlines the details associated with the assignment of CSE bank status. Columns 1-4 estimate the model with the full sample. Column 5 restricts the sample to bank-ZIP-years with more than one subprime loan in order to get a more precise estimate on average ZIP-code loan attributes.
Table 11. The Impact of Securitization on Access to Credit: Instrumenting for Secondary Mortgage Market Demand.
| OLS Log Number of Subprime Loans/Housing Unit | First Stage IV Subprime Percent Sold | Second Stage IV Log Number of Subprime Loans/Housing Unit | |
|---|---|---|---|
| 2-Year Change in CSE Mkt. Share | 0.014*** | ||
| 2-Year Change in CSE Mkt. Share: Standard Error | (3.176) | ||
| Subprime Percent Sold | 3.403*** | 7.364** | |
| Subprime Percent Sold: Standard Error | (8.761) | (2.246) | |
| House Price Appreciation t-1 | 0.024*** | 0.003*** | 0.013 |
| House Price Appreciation t-1: Standard Error | (5.469) | (6.206) | (1.523) |
| Medium Income in Bottom Quartile | 0.656 | 0.119** | 0.226 |
| Medium Income in Bottom Quartile: Standard Error | (1.435) | (2.117) | (0.352) |
| Medium Income in Second Quartile | 0.358 | 0.285*** | -0.719 |
| Medium Income in Second Quartile: Standard Error | (0.738) | (4.243) | (-0.683) |
| Medium Income in Third Quartile | 0.429 | 0.275*** | -0.652 |
| Medium Income in Third Quartile: Standard Error | (0.957) | (3.768) | (-0.640) |
| Medium Income in Fourth Quartile | 0.608 | 0.190*** | -0.118 |
| Medium Income in Fourth Quartile: Standard Error | (1.346) | (3.405) | (-0.169) |
| % of ZIP Pop with Low Credit | 2.713*** | -0.073*** | 2.986*** |
| % of ZIP Pop with Low Credit: Standard Error | (10.54) | (-3.714) | (8.791) |
| % of ZIP Pop with Medium Credit | 9.395*** | -0.004 | 9.397*** |
| % of ZIP Pop with Medium Credit: Standard Error | (15.44) | (-0.0635) | (15.96) |
| Ownership Rate | 0.009*** | 0.000 | 0.008*** |
| Ownership Rate: Standard Error | (5.449) | (0.532) | (4.864) |
| Lagged Housing Permits in County/Housing Units | 0.093*** | 0.001 | 0.089*** |
| Lagged Housing Permits in County/Housing Units: Standard Error | (6.473) | (0.572) | (5.730) |
| Unemployment Rate | 0.033* | -0.001 | 0.039 |
| Unemployment Rate: Standard Error | (1.660) | (-0.436) | (1.467) |
| Constant | -8.744*** | 0.576*** | -11.072*** |
| Constant: Standard Error | (-21.39) | (11.61) | (-5.426) |
| Std. Errors Clustered at MSA | Yes | Yes | Yes |
| Observations | 2786 | 2786 | 2786 |
| Adjusted R-squared | 0.622 | 0.371 | 0.558 |
In this table we estimate a two-stage least squares regression using an instrument for the demand for mortgage loans from the secondary mortgage market. The results are estimated on a cross-section of 2,786 ZIP codes in the year 2005 only. The first stage regression, reported in column 2, estimates the relationship between the percent of originated subprime mortgage loans that are sold to the secondary market as a function of our instrument for secondary market demand, controlling for economic and demographic variables. The instrument for secondary market demand is computed as the prior 2-year change (2003-2005) in subprime market share for the 5 CSE banks. The second stage regression, reported in column 3, is then estimated using the fitted value from the first stage regression, and the same set of economic and demographic control variables. We cluster standard errors at the MSA level. For purposes of comparison, we estimate an OLS regression using the same specification and report the results in Column 1.
Appendix 1: Institutional Features of the Securitization Market
Appendix Section 1a: Deal Structure
In order to understand how the securitization process can impact mortgage markets, we provide a brief outline of some of the key institutional features of the subprime securitization structure. Though no strict definition of a subprime mortgage exists, the term usually refers to a mortgage loan with poor credit quality, excessive leverage, or no income documentation. Borrowers who "state" a monthly income without documentation to verify the income can also be considered subprime.40 High loan-to-value or debt-to-income ratios are also typical of subprime borrowers. Until the late 1990s, subprime loans represented a very small portion of total residential mortgage originations.
Pools of subprime loans are originated by retail banks or mortgage brokers and subsequently sold to private financial intermediaries, who are frequently Wall Street firms or their subsidiaries, and who are referred to as deal arrangers or deal underwriters.41 The pool of loans is then placed into a bankruptcy remote trust, which is a separate legal entity and which owns the rights to each mortgage. Servicing of the mortgages is outsourced to a loan servicer. The pool of loans is separated into different "tranches" against which bonds are issued and sold to investors. Mortgage payments from the pool of loans are "passed through" to the bond holders and are the source of the bond's coupon payment. The type of bonds issued against securitized mortgages varies substantially. Bond coupon payments can be fixed or variable rate. Some bonds are issued as interest only, so that the bondholder receives only the interest from an underlying mortgage pool, while others are issued as principal only. Bonds referred to as the "equity tranche" generally do not receive any principal.42
Individual loans are not assigned to specific tranches. Rather, tranches are organized in a seniority structure that assigns a priority payment scheme to payment streams emanating from the underlying loans. The prioritized payment of principal and interest varies by deal. Typically, the principal from loans that "prepay" (refinance or sell) before their stated maturities flows first to holders of senior tranches, while defaults first reduce the principal of the most junior tranches until their principal is exhausted. Holders of junior tranches are subject to default risk, or the risk that the principal balance of mortgages from which coupon payments flow will be eroded. Figure 2 displays a simple diagram of a sample securitization structure from our data. The deal, originated by Goldman Sachs in February 2006 had a total deal principal of $714.2 million. The figure reports the size of each tranche, its original credit rating and the rate of the first scheduled coupon payment. For a more detailed discussion of the institutional features of the subprime securitization market, we refer the interest reader to Ashcraft and Schuermann (2008).
Appendix 1b: Subordination, Excess Spread, and Other Forms of Credit Enhancement
Pre-specified cash flow rules are designed to ensure that bonds with investment-grade ratings receive the promised coupon payments with a very high probability, ex ante. In order to ensure that holders of investment-grade bonds receive the promised payments, deals receive "credit support" against the potential for mortgage defaults. The credit support works to protect senior tranches against the loss of coupon payments stemming from default. The two most prevalent forms of credit support are subordination and excess spread.43
For any given tranche, subordination is the sum of the amount of principal that exists in any junior tranches. For example, if all tranches with an S&P credit rating of AAA represented 80% of the total principal in a deal, the AAA tranches are said to benefit from 20% subordination. Subordination for investment-grade tranches, which are those with an S&P credit rating of BBB+ (or Moody's equivalent) or higher, is defined in the same way. In our sample, the median proportion of deal principal rated AAA is 79.8%. The median proportion of principal rated investment grade is 96.5%. Portions of the securitization structure not rated investment grade are generally made up of one or two very small non-investment grade bonds that pay high coupons, and a tranche referred to as "over-collateralization." The over-collateralization tranche does not pay a coupon and exists solely to provide credit protection to more senior tranches. Loans that default first will destroy the principal balance of the over-collateralization piece before touching any tranche more senior. Only after the over-collateralization principal has been fully exhausted will defaults accrue to the next most junior tranche. Thus, senior tranches benefit from "thick" junior tranches, and in this way, subordination acts as a form of credit protection.
Excess spread is the second form of credit protection that exists to insure senior tranches against mortgage default. Excess spread is defined as the difference between the payments coming into the securitization structure from the underlying mortgage collateral and the rate being paid to coupon holders. Excess spread is calculated net of fees paid to mortgage servicers and other intermediaries, such as interest-rate swap counterparties. As Ashcraft and Schuermann (2008) explain, "...[excess spread] is the first line of defense for investors against credit losses, as no amount of principal of any tranche is reduced by any amount until credit losses reduce excess spread to a negative number." In this way, higher levels of excess spread provide more credit protection to holders of senior tranches.
Deals benefit from other forms of credit enhancement such as "shifting interest," "performance triggers," and interest rate swaps. Shifting interest requires that all prepaid principal be applied only to senior tranches for a pre-specified period (typically the first 36 months). The practice of shifting interest serves to increase the subordination of senior tranches because prepayments reduce their principal balance, leaving their principal as a smaller percentage of the total deal principal. Performance triggers exist to ensure that prepaid principal is not released to any class until the deal passes prespecified performance tests.44 Thus, if a deal is not performing well, the priority rules can be shifted to ensure senior tranches receive proper credit support. Finally, deals with floating coupon payments manage the risk that coupon payments to bondholders might rise faster than rates on the underlying mortgages by means of interest rate swaps.45
Appendix 2: Deal Structure Data from ABSNet and Bloomberg
ABSNet, a subscription based subsidiary of Standard and Poor's, contains deal-level information on securitization deals from numerous asset classes, including prime, Alt-A, and subprime residential mortgage-backed securities. ABSNet's primary service is in tracking the performance of aggregate loan pools, but it also reports summary information on the structure of securitization deals at the time of origination. Deal-level summary information includes the name of the deal originator, the original balance of the deal in total, and the original balances, credit rating, and coupon of each tranche in the deal. In most cases, the deal summary also contains information on the existence of credit supports like overcollateralization, and sometimes contains data on the existence of interest rate swaps, and other forms of third party credit support like external insurance.
We supplement the ABSNet deal summary data using Bloomberg. In particular, we use Bloomberg to identify the type of bond associated with each tranche. Differing bond types include interest or principal only bonds, or bonds that are associated with the equity tranche of a deal. Bond type can vary, even within a deal. Understanding the bond type is necessary when computing deal subordination rates because interest only tranches should not be included in the capital structure of a deal. We also use Bloomberg to confirm the types of credit support associated with each deal. Some deals in the later stages of our sample had third party credit enhancement in the form of credit insurance.
LoanPerformance Data
LoanPerformance, a subsidiary of First American Trust, is the primary source of information on subprime and Alt-A loans at the borrower-level. LoanPerformance claims to cover over 90% of recent subprime and Alt-A securitization deals. The database contains detailed information on subprime loans at the time of origination and tracks the performance of individual loans through time. Most relevant for our purpose is loan-level information on the original loan balance, FICO score, combined loan-to-value ratio, debt-to-income ratio, and loan type. Also crucial to our analysis is the location of the borrower, which is reported at the ZIP-code level.
Because the unit of analysis is at the deal level, we are required to aggregate loan level data to the deal level. In this way, deal structure is computed as a function of the average loan characteristics. We compute value-weighted sums, where the weights are determined by the size of each
individual loan relative to the size of the total deal. The loan level data for attribute ![]() of loan
of loan ![]() in deal
in deal ![]() is aggregated to the deal level as follows:
is aggregated to the deal level as follows:
![\begin{displaymath} Loan\,Attribute_{i,k,j} \;=\;Attribute_{i,k} \ast \left[ {\frac{loan\,principal_k }{\sum\limits_{k=1}^N {principal_k } }} \right]. \end{displaymath}](img21.gif)
House Price Appreciation and Local Area Economic Conditions
The LoanPerformance repeat-sales house price data is available at the ZIP-code level. Repeat-sales indexes capture changes in house prices by comparing how home prices have changed among a sample of repeat-sales transactions. In this way home quality is kept somewhat constant. An extensive literature exists on the estimation of repeat-sales house price indexes, beginning with Bailey, Muth, and Nourse (1963) and substantially improved by Case and Shiller (1989). The most notable drawback of repeat-sales indexes is that they are estimated with considerable error in smaller samples. Also, some states, referred to as non-disclosure states, are not required to report public housing transactions. Thus, there are some ZIP codes for which repeat-sales price indexes are not available. Our house price appreciation variable is aggregated to the deal level by computing the loan-weighted growth in the house price index in the year prior to deal origination. Where available we use ZIP-code level appreciation rates. If a ZIP-code index is not available, we use the state-level repeat-sales index. The Bureau of Labor Statistics reports unemployment rates at the state level. State unemployment data is aggregated to the deal level by computing the loan-weighted average state unemployment rate at the time of loan origination.
Mortgage Origination Data from HMDA
Our borrower attribute data has been generously provided by Mayer and Pence (2008). Though discussed in more detail in their research, we briefly recap the construction of the data for the purposes of this paper. Equifax Inc. provides data on the share of tract residents with high, medium, and low credit scores. High credit scores are classified has having a VantageScore greater than 700. Medium credit scores range from 640 to 700, and low scores are below 640. The tract data is aggregated to the ZIP-code level using geolytics software provided by http://mcdc2.missouri.edu/websas/geocorr2k.html. Tract-level medium income, homeownership rates, and housing units are provided by the 2000 Census. Medium income is aggregated to the ZIP level and sorted into quintiles in the following way. Within each MSA, ZIP-code medium incomes are sorted and then split into quartiles according to their relative income ranking and assigned corresponding indicator variables indicating their respective income quintile. The house price indexes used in the mortgage origination regressions are measured at the MSA level, and come from FHFA. The Census Bureau provides county-level data on permits for the construction of residential 1-4 family housing units. Unemployment data comes from the BLS.
We briefly discuss some of the potential bias introduced into our sample using the HMDA "higher-priced" classification as a proxy for subprime activity. Loans classified as "higher-priced" are considered higher-priced relative to a reference asset of comparable maturity. This becomes a problem when considering the interest rate on adjustable-rate loans, which technically have a 30-year maturity but whose interest rate is based on short-term rates. The result is that adjustable rate mortgages will be underreported in the HMDA sample, and the magnitude of the bias will change through time depending on the shape of the yield curve. Avery, Brevoort, and Canner (2007) argue that between 2004 and 2005, at least 13 percent of the increase in the number of higher-priced loans in the HMDA data is attributable to a flattening of the yield curve. We believe the fact that adjustable-rate mortgages are underrepresented in the HMDA sample likely weakens our results. Another issue worthy of mention is that no unique identifier exists between HMDA origination data and subprime data from LoanPerformance. Our primary measure of subprime origination activity is the HMDA "higher-priced" data, not LoanPerformance. We use the LoanPerformance data and ABSNet data on the bank ownership of subprime loans to calculate a proxy for mortgage demand from the secondary market.