Financial Statistics for the United States and the Crisis: What Did They Get Right, What Did They Miss, and How Should They Change?
Keywords: Financial statistics, financial stability analysis, financial crisis
Abstract:
JEL Classification: E01, E60, E58
I. Introduction
Although the instruments most closely associated with the financial crisis of 2008 and 2009, including option adjustable-rate mortgages, structured investment vehicles (SIVs), and "CDO squareds," were novel, the underlying themes were familiar from previous episodes: Competitive dynamics resulted in excessive leverage and risk-taking by large, interconnected firms, in heavy reliance on short-term sources of funding to finance long-term and ultimately terribly illiquid positions, and in common exposures of many major financial institutions to specific credit and liquidity risks. Understandably, in the wake of the crisis, financial supervisors and policymakers want to expand and improve the information infrastructure so as to obtain better and earlier indications regarding these critical, and apparently recurring, core vulnerabilities in the financial system. One expression of this appetite to collect more data is the belief that had the community of policymakers, analysts, and investors had such data in "real time," the vulnerabilities amassing in the years before the crisis may have been recognized and possibly diffused before the systemic crisis took hold.
Being empirical economists by training, we are hugely sympathetic to the desire for more and better real-time data, and we are optimistic about the development of models that will allow those data to be put to use in highlighting emerging imbalances of potentially systemic effect. Indeed, we emphasize in this paper that gauging vulnerabilities in the financial system requires targeted analysis by specialized research teams with expertise and data tailored to particular areas (such as specific financial instruments and transaction types) that might be identified by unusual trends observed in aggregate statistics.
That said, we harbor no illusions about the difficulty of collecting all the "right" data in a timely fashion, particularly because the dynamic nature of our financial system implies that the relevant set of data is a moving target. Major data collection projects naturally take quite a while to design and implement, and, more importantly, are generally predicated on the proposition that the systems being analyzed remain fairly stable over time.
Moreover, standard approaches to aggregate data collection and analysis may simply not be consistent with the dynamism of the financial system, particularly in light of the tendency of innovation to continually shift to outside of the areas to which analysis and scrutiny are most directed. Indeed, a key point we make later in this paper is that many of the products most closely identified with the recent crisis and the near-collapse of the financial system--including ABS CDOs (asset-backed securities collateralized debt obligations), SIVs, and subprime securitizations relying on excess spread and overcollateralization--scarcely existed just a few years ago and now cease to exist again (except as "legacy" positions).
We would not want to push the point too far, but we note that the assemblage of relationship that stood at the center of the crisis was termed the "shadow banking system"--a moniker that was coined after the crisis began. Gaps in data and analysis, in a sense, defined the shadows in which this system grew and prevented the building vulnerabilities from being recognized.
Thus, in this paper, we emphasize that, while very important, collecting more data is only part of the process of developing early warning systems. More fundamental, in our view, is the need to use data in a different way--in a way that can deliver more flexibility in targeting than static data collection can allow.
As we will describe, certain aggregate data collected through processes well-established prior to the crisis sent signals suggesting material changes in the nature of flows between different parts of the U.S. economy. Yet fully understanding the implications of these developments and associated risks required a tactical approach that not only used the aggregate data as signals of where to look, but expanded to include granular and specialized information that may have been collected for purposes other than financial stability analysis or even microprudential supervision. Although such an idiosyncratic approach is not customarily part of the empirical economics toolkit--and would have been foreign to our more academically oriented colleagues--it may have offered the best chance to highlight in real time what later proved to be misplaced confidence on the part of a wide range of market participants in the efficacy of risk-transfer mechanisms. For example, data collected and sold for very specialized commercial purposes, notably targeting solicitations to borrowers, provided the best, and possibly the only, way to understand the rapid decline of underwriting standards for U.S. residential mortgages subsequent to 2004. But these data probably did not exist, and probably would not have appeared worth examining in detail, prior to 2004.
To resort to a metaphor, the information delivered by expanded and improved, but essentially static, aggregate data can (and should) be relied on for signals akin to grainy images captured by reconnaissance satellites: Images that are suggestive, but not dispositive. Improved data collections can provide the greatest value by highlighting changes and inconsistencies that bear further investigation using other, more-focused tools mobilized to deal with a particular anomaly. A key challenge, of course, is that the appropriate tools cannot generally be specified ahead of time but must be designed in response to the particular signals teased from the aggregate data. In fact, we are concerned that specifying the tools suited for this second stage generically and prior to considering the first-stage signals will not be fruitful: We can easily imagine specifying ex ante a program of data collection that would look for vulnerabilities in the wrong place, particularly if the actual act of looking by macro- or microprudential supervisors causes the locus of activity to shift into a new shadow somewhere else.
In the following pages, we flesh out these ideas. We begin by reviewing macroeconomic data from the system of national accounts developed in recent years to better illuminate high-level financial flows among different sectors of the U.S. economy. These aggregate data backtest fairly well against the recent crisis, sending discernible but grainy signals of substantial shifts in flows across sectors that preceded the crisis.
Subsequently, we offer several examples highlighting why collection of formal time series may fail to bring these grainy signals into better focus, and could possibly turn out to be counterproductive. We argue that the focus on a fixed set of metrics changes behavior in a way that diminishes the usefulness of the indicators. Given the dynamic nature of the financial system, the process of specifying these metrics inevitably leads to active management of these metrics, at which time they cease to fully reflect the risks that they were intended to capture. Finally, we conclude with some comments about the shape of a more dynamic process of analysis that we argue is more likely to bring into clearer focus the signals sent by more aggregated data.
II. What Did Financial Statistics for the United States Get Right in the Prelude to the Crisis?
In this section, we present information about the U.S. economy that is drawn from an innovative set of macroeconomic accounts that integrates data on real and financial economic activity from distinct primary sources using the System of National Accounts (SNA; 1993). 1 In particular, we present data from the Integrated Macroeconomic Accounts for the United States (US-SNA)--an implementation of SNA for the U.S. economy resulting from joint research by staff at the Bureau of Economic Analysis (BEA) and the Federal Reserve Board (FRB). Data in the US-SNA are constructed primarily from information reported in the national income and product accounts (NIPA), which measure the production of, use of, and income generated by newly produced goods and services, and the Flow of Funds Accounts (FFA), which measure net flows and balances of financial and certain tangible assets for the major sectors of the U.S. economy.2
We use data from the US-SNA to document certain important trends and developments in the period leading up to and during the financial crisis that began in 2007 and severe recession of 2008 and 2009. First, we track the secular and recent changes in saving, financial investment, and real investment through the capital and current accounts for the household and other SNA sectors of the U.S. economy. In the period leading up to the financial crisis, the macroeconomic data showed large increases in household-sector leverage brought about by rapid increases in mortgage debt and financed, in large part, with funds obtained from the rest of the world.3 But, while certainly suggestive, these signals provided only limited aid to anyone seeking to distinguish among hypotheses regarding the causes of the trends carrying very different implications for financial stability analysis. We emphasize, though, that the aggregate nature of data in the national financial and real statistical accounts left them unsuited for illuminating the extent of vulnerability that had evolved in the U.S. financial system. In particular, data in the national accounts did not illuminate substantial increases in the underlying riskiness of mortgage loans in the years leading up to the financial crisis, nor did they convey the extent to which maturity transformation was being undertaken by the shadow financial system.
A. Some background on the US-SNA data
Compared with the NIPA and the FFA, the US-SNA data have two principle advantages: First, they contain a full set of macroeconomic information broken down to correspond to sectors of the economy that are economic units of interest--households (including nonprofit organizations serving households); nonfinancial noncorporate businesses (sole proprietorships and limited partnerships); nonfinancial corporate businesses; financial businesses; federal government; state and local governments; and the rest of the world (foreign governments and businesses that engage in trade or financial transactions with domestic counterparts). Second, the US-SNA integrates financial and real information. For each sector, US-SNA follows: a current account that tracks the flows of production/income and consumption; a capital account that tracks saving and capital formation; a financial account that tracks net acquisition of financial assets and net incurrence of debts; a revaluation account that tracks gains and losses on tangible and financial assets; and a balance sheet account that tracks the outstanding stocks of tangible assets, financial assets, and liabilities.
A novel aspect of US-SNA is its focus on sectoral net lending or borrowing, which, for each sector of the macroeconomy, is presented in both the capital account and the financial account. In the NIPA-based capital account, a sector's net lending or borrowing position is defined as the difference between its net saving--disposable income less current spending--and its net investment (gross purchases of physical capital less depreciation on its existing capital stock). Sectors that invest on net more than they save out of current income are net borrowers. In the FFA-based financial account, a sector's net lending or borrowing position is defined as the difference between its net acquisition of financial assets and its net incurrence of debt. Except for statistical discrepancies--actual measurement differences coming from the independently constructed capital and financial accounts in the United States--each sector's net lending or borrowing position should be the same, whether measured from its capital account or its financial account.
B. Key trends in the household sector of the US-SNA leading up to and during the financial crisis
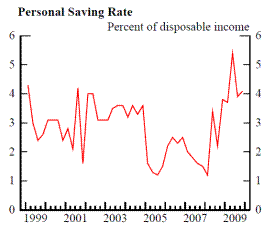
Data in the US-SNA clearly document the considerable rise in household-sector leverage in the years leading up to the financial crisis, and they also show the extent to which leverage has dropped back during the crisis and recession of 2008 and 2009. The black line in figure 1 shows the well-known fact that, after having fluctuated in the neighborhood of 9 percent from the early 1960s through the mid-1980s, the household saving rate dropped sharply and averaged only about 2 percent in the mid-2000s. The household saving rate increased some in 2008 and, based on the personal saving rate in the national income accounts, appears to have risen further last year. What is perhaps more interesting is that households' net physical investment, plotted as the red line in figure 1, did not decline along with the saving rate--either in the earlier period of declining saving (from the late 1980s through the late 1990s) or in the more recent period when the saving rate was consistently very low (from 2000 through 2007). Indeed, during the recent boom years of the U.S. housing market (2002 through 2006), the household sector's rate of net tangible investment, mainly comprising net residential investment, actually increased from about 4 percent of disposable personal income to nearly 6 percent at the peak. The downturn in the U.S. housing market has certainly left its imprint on the rate of households' net investment--the red line dropped to sharply in 2007 and 2008, and the net investment rate is estimated to have fallen again last year.
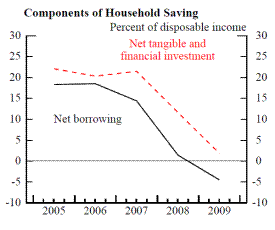
Figure 1 shows that the boom years leading up to the financial crisis represented the first time since the early 1960s (and before, we think) that the household sector's rate of net tangible investment (red) exceeded its rate of saving (black). Thus, as can be seen in figure 2, the boom years of the housing market were the first in which the U.S. household sector was in a net borrowing position with respect to the other domestic sectors and the rest of the world, on balance. The green-shaded region shows that from the early 1960s through the early 1990s, the household sector typically was in the position of lending about 4 percent of its income to help finance investment by other domestic sectors and the rest of the world. From 2003 through 2007, however, the U.S. household sector, on net, borrowed at an average rate of nearly 3 percent (of disposable income) to finance the excess of net tangible investment over its net saving. During the financial crisis and recession, the household sector swung back to a slight net lending position in 2008, and last year, household-sector lending appears to have risen to a level more typical of the average pace from the 1960s through the 1990s.
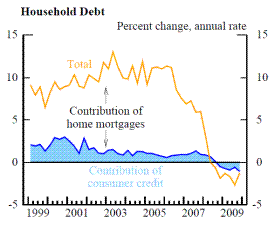
Because of its substantial detail regarding each sector's net acquisition of financial assets and net incurrence of debts, the US-SNA provide much more information about household-sector trends before and during the financial crisis. A key element was that the decline in household saving and, thus, a sizable portion of the consequent rise in net household borrowing reflected a rapid increase in new residential mortgages; indeed, borrowing in the form of other types of consumer credit (auto loans, credit card loans, and other consumer loans) was relatively light in the years leading up to the financial crisis, in part because home equity loans and cash-out mortgage refinancing provided a cheaper source of funding for consumers. The upper-right panel of exhibit 3 shows the rapid growth of overall household debt from 2002 through 2006 (the orange line) and the relatively small contribution to the growth rate that was accounted for by (nonmortgage) consumer credit (the blue-shaded region). Analogously, the area between the orange line and blue-shaded region shows that the substantial deceleration in household borrowing since 2006--and the outright decline in household debt that occurred for much of 2008 and 2009--was due to changes in mortgage borrowing, rather than consumer credit.
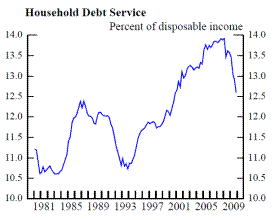
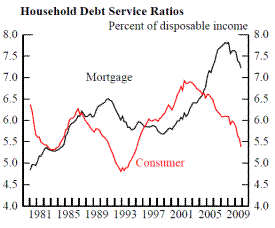
The lower-left panel of exhibit 3 plots a key indicator of leverage in the household sector--the ratio of debt service payments (principal and interest) to disposable income.4 Even though interest rates on home mortgages and consumer loans were generally low by historical standards, from 2002 through 2007, growth of household debt exceeded growth of income by enough to drive up the measured share of disposable income needed to service debt. Over this period, the share of aggregate disposable income needed to service consumer credit was actually trending down significantly, meaning that more and more income was needed to cover principal and interest on home mortgages. The sharp deceleration in borrowing in recent years--and the outright contraction in debt seen for much of 2008 and 2009--resulted in a significant deleveraging for the household sector and, by the end of last year, is estimated to have brought down the aggregate debt service ratio to a level not seen since late 2000.
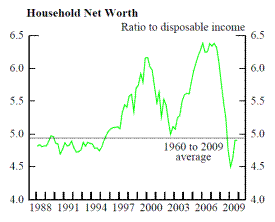
It is noteworthy that even as the debt service ratio--and its mortgage debt component--surged to indicate greater household leverage in the years leading to the financial crisis and recession, measures of balance sheet leverage did not signal imminent problem--in fact, even during the years of rapid household borrowing, typical indicators of balance sheet leverage did not rise much at all, on net. The bottom-right panel shows that the ratio of aggregate household net worth to disposable personal income climbed from 2002 through 2007, as the arithmetic contribution to wealth from rising home prices and equity prices far outstripped increases in households' disposable income. Meanwhile, measures of housing leverage--such as the ratio of homeowners' equity (aggregate home values less mortgage debt outstanding) to home value--fluctuated in a fairly high, very narrow range from 2000 through 2005. However, as home prices in many parts of the United States began to fall in 2006--and as they subsequently fell almost everywhere in the country in 2007 and 2008--housing leverage and balance sheet leverage turned down severely. In 2009, home values stabilized and corporate equity values rose markedly, raising the ratio of household net worth to disposable income to about its longer-run average level. That said, homeowners' equity ratio remained far below any value registered before 2007.
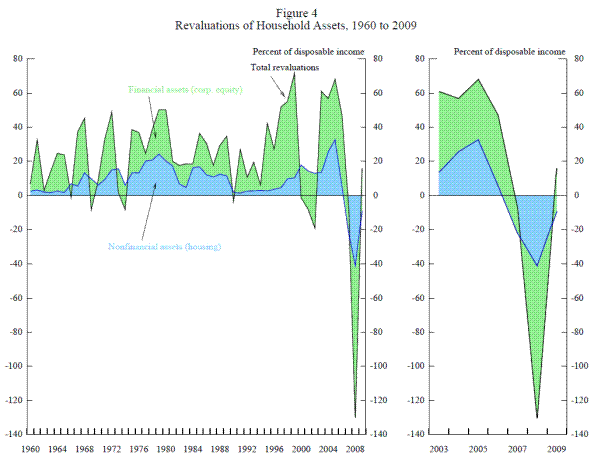
Figure 4 puts into a historical context the size of the revaluations of household assets experienced in the years leading up to the financial crisis and during 2008 and 2009. The figure shows that from 2003 through 2006, the combination of rising equity prices (which show through to the green-shaded region) and rising home prices (affecting the blue-shaded region) added to aggregate household net worth on the order of 50 to 60 percent of disposable income each year. However, equity prices were about unchanged over 2007 while home prices fell significantly that year, so that, arithmetically, asset revaluations subtracted from net worth at a rate of about 25 percent of income. Of course, the situation worsened substantially in 2008: A further drop in equity prices cut into household net worth by about 40 percent of income, while plunging home prices contributed more than 80 percentage points (of income) to the decrease in net worth.5 Although asset revaluations typically result in large swings in household net worth--very large in relation to personal income or saving--the 2008 realizations were unmatched in the postwar period (flow of funds data extend back to 1947).
C. Sectoral net lending and borrowing, 1960 to 2009
Table 1 reports data from the US-SNA capital account to document where the funds came from to finance the sizable net borrowing by U.S. households, as well as borrowing by the other nonfinancial domestic sectors, during the years of the mortgage credit and housing boom. In particular, table 1 compares net lending or borrowing across all the major sectors of the US-SNA from 2000 to 2007 with patterns from the earlier decades (1960 to 1979 and 1980 to 1989); it also shows the extent to which sectoral net lending and borrowing had reversed course in 2008 and 2009. 6 Note that, except for the statistical discrepancy (line 9), net lending and borrowing across all sectors (lines 1 through 8) sum to zero each period.
Table 1 shows that in the 1960s and 1970s, the two nonfinancial business sectors (lines 3 and 4), the two government sectors (lines 6 and 7), and the rest of the world were, on average (and, according to the underlying annual data, consistently from year to year until the late 1970s), net borrowers, meaning that their rates of investment typically exceeded their rates of saving. In those decades, the household and the financial business sectors served as net lenders to the others.
The key sectoral development that occurred over the course of the 1980s and 1990s was that the rest of the world sector shifted from a net borrowing position vis-à-vis the U.S. domestic sectors to a net lending position. On average over the 1980s and 1990s, real net borrowing by the federal government and the nonfinancial business sectors rose so much that even a larger real volume of net lending by the U.S. household sector ($199 billion per year in the 1980s and 1990s compared with $127 billion in the 1960s and 1970s) was not enough to provide funding, on average; the difference, thus, was funded by foreign official and private-sector entities (to $54 billion per year in the 1980s and 1990s, from negative $14 billion in the prior two decades).
From 2000 to 2007, net lending to the domestic sectors of the economy by the rest of the world ballooned to $594 billion per year. Even though, in real terms, the average pace of net borrowing by the nonfinancial business sectors (lines 3 and 4) decreased in the 2000s while net lending by financial businesses picked up (line 5), these developments only partly offset the very large real increases in borrowing by the federal and municipal governments (lines 6 and 7). Meanwhile, on average, the U.S. household sector shifted from having lent an average of almost $200 billion per year, on net, over the 1980s and 1990s to borrowing an average of almost $190 billion per year from 2000 through 2007.
In sum, the years leading up to the financial crisis and recession were characterized by an increase in net investment by the U.S. household sector that was funded by borrowing rather than saving. The household sector's shift from its role from the 1960s through the 1990s as a net funding source for other sectors' investment to a net borrowing position is something that appears to have been unprecedented in the U.S. postwar period.
III. What Elements of the Crisis Did the Aggregate Financial Statistics Not Convey?
Although financial statistics for the U.S. economy conveyed some important information about rising household leverage more or less in real time, their aggregate nature masked the buildup of important underlying risk factors and did not convey the overall vulnerability of the financial system to a reversal of the flows that had supported economic activity and promoted liquidity and financial risk-taking during the credit expansion. In this section, we highlight two key elements that contributed to the severity of the financial crisis that were not conveyed in aggregate financial statistics for the U.S. economy: First, a material increase in the underlying credit risk associated with the rapid growth of home mortgages and a consequent increase in the vulnerability of borrowers to a downturn in home prices or incomes; and second, the growth of maturity transformation outside the traditional banking sector (where a significant proportion of the funding comes from insured deposits held at institutions having explicit access to external liquidity support)--that is, a greater reliance on short-term funding for longer-term financial instruments--that left the financial system highly vulnerable to a withdrawal of liquidity.
A. Mounting credit risk during the mortgage boom
As home mortgage debt was expanding at double-digit rates in the mid-2000s, the composition of mortgage lending began to shift markedly, with subprime borrowers and loans with nontraditional terms ("alt-A" loans) becoming more and more prevalent and with loans containing "multiple layers of risk" over time. It now seems fairly clear that loans were being increasingly originated without full regard to borrowers' underlying ability to repay their loans from household income; rather, while home prices were marching up and underwriting was becoming easier, borrowers were generally able to refinance into new loans before encountering problems making their monthly payments.7
For example, Mayer, Pence, and Sherlund (2009) note that the overwhelming majority (more than 75 percent) of subprime mortgages originated from 2003 to 2007 were "short-term hybrid" loans, in which the initial interest rate was usually fixed for a two- or three-year period, then became adjustable and tied to market interest rates thereafter (with a substantial rate margin). The initial rate on these subprime loans was often referred to as a "teaser" rate because it was held a few percentage points below the "fully indexed rate" during the initial, fixed-rate term of the contract. The idea behind this underwriting appeared to be to extend loans to homeowners who might not currently qualify for a "prime" or traditional mortgage, but who could refinance into such mortgages after having established a record of making on-time payments for a couple of years and after their homes had appreciated in value, raising their equity positions. Meanwhile, the expansion of so-called alt-A mortgages that was occurring at roughly the same time as the subprime lending boom was also associated with a significant shift in the underlying risk characteristics of those loans. In particular, the growth of alt -A mortgages was disproportionate in the "floating rate" category of loans, including interest-only mortgages (in which borrowers did not have to make payments to reduce their loan balance during the few several years of the contract) and negatively amortizing mortgages (in which not even the "minimum payments" to cover interest were required). Although this type of alt-A mortgage was very rare through 2003, it grew to compose about one-quarter of originations in 2005 and 2006.
One indication--albeit an indirect one--that mortgage origination was expanding without sufficient regard to a borrowers' underlying ability to repay their loans or afford their homes is that the median loan for purchased homes (as opposed to refinanced loans) in subprime mortgage pools from 2005 through the first half of 2007 carried a combined loan-to-value ratio of 100 percent; for loans for purchased homes in alt-A pools, the median combined loan-to-value ratio was 95 percent in 2006 and the first half of 2007 (up slightly from 90 percent in the prior three years; Mayer, Pence, and Sherlund, 2009; table 2.B). Mayer, Pence, and Sherlund (2009; figures 1 and 2) report two other indications of how the latest vintage of borrowers in subprime and alt-A mortgage pools very soon ran into trouble making their monthly mortgage payments. First, they show how later vintages of loans in subprime mortgage pools experienced larger frequencies of "early payment defaults"--which reached about 8 percent for the 2007 vintage--where borrowers had fallen 90 days or more delinquent in their monthly mortgage payments less than one year after receiving their loan. Second, they show how later vintages of borrowers with option adjustable-rate mortgages--interest-only loans in which borrowers have the option of making less than the "minimum" monthly payment and rolling the unpaid interest into their loan balance (for a period of time)--took the option: Within six months of having taken out an option adjustable-rate mortgage that was securitized in an alt-A mortgage pool in 2007, almost 95 percent of borrowers had exercised their option to pay less than the monthly interest on their mortgage.
Thus, while the SNA clearly signaled household sector's transformation from a net supplier to a net user of credit, the aggregate measures of housing leverage (such as homeowners' equity to home values) and balance sheet leverage (households' debt service ratio) did not clearly signal imminent mortgage credit risks. In particular, these aggregate time-series data simply could not capture the fundamental transformation of the mortgage market that is described above, with the increasing prevalence of instruments that embedded a reliance on increasing real estate values. While there was anecdotal information regarding changes in mortgage products (and while the shift in mortgage funding to so-called private-label mortgage-backed securities (MBS) was also recognized), a point we emphasize later is that disaggregated information derived specifically from the mortgage origination process was needed to understand more fully the extent to which underwriting standards had deteriorated and, thus, the extent to which a drop in home prices and a shift back to more restrictive underwriting could amplify the initial effects.
B. Funding mechanisms that amplified and propagated the "mortgage credit shock" through the financial system
The decline in underwriting standards and proliferation of new instruments was predicated on the ability of borrowers to refinance as their equity increased with home prices was one significant driver of the growth in mortgage credit in the years prior to the crisis. Another, which proved to be of great importance as conditions deteriorated, was the widespread availability of low-cost funding for mortgages from vehicles that engaged in significant amounts of maturity transformation. While underwriting was deteriorating, the funding available for these loans was increasing through expansion of securitization channels and, in part, more- complex and more-opaque financial products structured to appeal to short-term, risk-averse investors. Effectively, a significant fraction of the longer-term securitized mortgages was held by vehicles that obtained a considerable share of their funding from short-term sources, and those sources were quickly withdrawn when confidence disappeared.
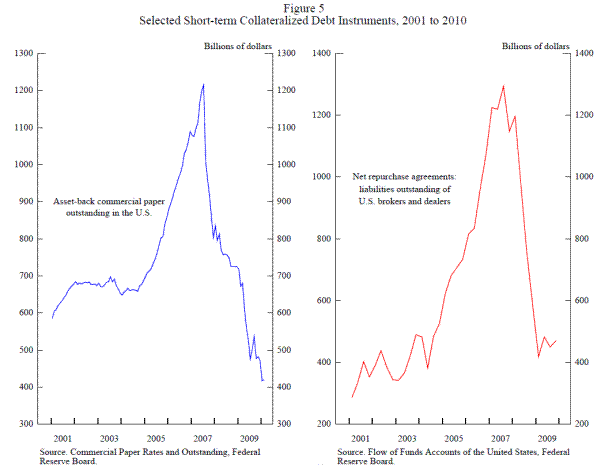
A new form of asset-backed commercial paper (ABCP) conduit called a structured investment vehicle (SIV) became the "poster child" for the type of maturity transformation just discussed that developed outside the traditional banking sector. SIVs issued short-term debt (as well as medium-term and capital notes) and used the proceeds to purchase residential MBS, among other structured financial products and primary debt. However, unlike other ABCP conduits, SIVs had only limited contractual liquidity support, meaning that SIVs would need to sell assets to repay investors if they ran into difficulties placing (or "rolling over") their commercial paper. At the onset of the financial crisis in August and September of 2007, investors lost confidence in the values of subprime and alt-A MBS that were held by SIVs, leaving them unable to roll over their commercial paper and leaving them short of funding.8 The flight of short-term, risk-averse investors resulted in pressure on sponsor institutions to support SIVs and other ABCP programs, even in the absence of explicit legal obligations to do so, and thus contributed to growing doubts about the condition of the commercial and investment banks at the center of the financial system. Aggregate data--including those presented in the FFA and the US-SNA, plotted in figure 5--documented the rapid expansion of ABCP that occurred between 2004 and 2007 and the withdrawal of $350 billion from the ABCP market that occurred from August to December 2007.9 However, the aggregate data did not illuminate (or provide any indication of) the more subtle shift in the funding strategies of ABCP conduits that were, for example, associated with the development of SIVs (in the extreme case; see Covitz, Liang, and Suarez, 2009). Nor were the aggregate data capable of (or at all designed to) document material shifts in the underlying collateral purchased by ABCP conduits. Of course, the years in which ABCP was growing rapidly were also the years in which mortgage lending and issuance of residential MBS were soaring, and there is reason to believe those trends were related. That is, while ABCP was becoming more prevalent, the underlying collateral funded through ABCP conduits was shifting from more traditional assets (such as trade receivables and "standard" ABS) to newer and riskier securities (such as senior tranches of ABS CDOs collateralized by mezzanine tranches of subprime and alt-A MBS; again, see Covitz, Liang, and Suarez, 2009). A key point is that, as in the case of residential mortgages, ongoing shifts in ABCP structures that were material to their systemic vulnerability could not be gleaned from the aggregate data.
Despite the considerable attention paid to SIVs and other ABCP programs in many narratives of the crisis, SIVs actually had quite a small footprint relative to the size of the money markets as a whole. Rather, a much more important source of short-term funding for MBS (as well as many other classes of structured financial products) in the years preceding the crisis was the market for repurchase agreements (repos). Repos serve as a collateralized source of short-term lending and borrowing that began as a way for institutional investors and broker-dealers to earn small returns by lending Treasury and agency securities on a short-term basis. But, as we describe in more detail below, in the years preceding the financial crisis, the repo market evolved slowly, but substantially, to become a major funding source for structured financial products, including some of the more complex and systemically risky instruments (such as senior tranches of ABS CDOs).
As emphasized by Brunnermeier (2009) and Gorton and Metrick (2009), repo funding was a major factor behind the expansion of the shadow banking system prior to the financial crisis and the sudden withdrawal of repo funding--and a pullback in repo transactions with certain counterparties (including Bear Stearns in March 2008), against specific collateral classes (ABS CDOs), and a rise in repo haircuts played a major role in propagating the subprime/alt-A mortgage shock throughout the financial system.
Aggregate financial statistics, such as the FFA and (to a lesser extent) the US-SNA, contain some information about repo transaction volumes. As can be seen in the right-hand panel of figure 5, these aggregate data indeed show rapid increases in the net liability positions of U.S. brokers and dealers through repo agreements in the years preceding the financial crisis and the severe drop that occurred in 2008.10
As dramatic as the movements in the aggregate series are, they materially understate the actual level of activity (and risk) in the repo market because the individual firms report to the Securities and Exchange Commission repo positions that have been netted with respect to counterparties and security types. In times of normal market functioning, it makes sense for brokers and dealers to net such positions in their financial statements and regulatory reports. However, in times of stress, information about gross positions, and thus about the overall volume of outstanding short-term funding trades, are more relevant for sizing the potential market frictions that could become destabilizing, amplifying and propagating even small disturbances (Brunnermeier, 2009; and Gorton and Metrick, 2009). Hordahl and King (2008) cite a figure of about $10 trillion of gross repos outstanding in the U.S. market at the end of 2007, roughly twice the size of the market five years earlier and more than seven times the net aggregate position reported in the FFA. Finally, as we describe below, the period of rapidly rising repo volumes was associated with a material shift in the underlying collateral away from the most stable government and agency securities that tend to rise in price and liquidity during periods of market turmoil and toward a more heterogeneous mix that included a range of structured financial products.
IV. Beyond Augmented Financial Statistics-Or, What Other Analytic Approaches Are Called For, and What Additional Lessons from the Crisis Are Critical for Future Financial Stability Analyses?
The growth of nontraditional mortgages and novel funding vehicles did not go unnoticed during the period preceding the crisis. However, enormous comfort was taken by both policymakers and market participants in the degree to which the associated risks were broadly dispersed through various transfer mechanisms. Of course, the crisis revealed that far more of the exposure remained in the core financial sector than was apparent to most observers beforehand. To better understand the failure of risk mitigation and transfer mechanisms, specialized data were required about mortgage contracts and underwriting criteria and about the maturity transformation that became ubiquitous outside of the traditional banking sector.
In the wake of the financial crisis, there is understandable appetite to fill those gaps and collect more information about activities that might place large institutions and, ultimately, the broader economy at risk. Without discounting the importance of such efforts, we emphasize the need to proceed in a manner that also recognizes that the remedy is not merely to collect data going forward on mortgage origination standards and the prevalence of certain funding vehicles. Rather, to diminish the likelihood of future crisis, we must change the way that we focus data collection for financial stability analysis. In fact, and as explained further below through several examples, a massive data collection effort focused on filling the gaps that became evident after the recent crisis will not only fail to make things better, measured against the goal of a more stable financial system, but can also arguably make things worse when data collections are static while financial markets are dynamic.
A. A first example: Consequences of Drexel Burnham Lambert's failure in 1990
Prior to the near-collapse of Bear Stearns in March 2008 and its sale to JP Morgan Chase, the lessons on the vulnerabilities of broker-dealer firms were mostly extracted from the Drexel failure in 1990. While other broker-dealers failed both before and after Drexel, these situations involved firms with limited involvement in the capital markets. With few exceptions, these failures had few effects other than on brokerage customers, whose assets and interests were protected by the actions of the Securities and Exchange Commission and Securities Investors Protection Corporation. Drexel, on the other hand, played a major role in the fixed income markets, and in fact had been a pioneer in creating an active market for the debt of below-investment-grade issuers.
And, of the lessons drawn from the Drexel failure, none were more influential over the ensuing 15 years than those related to funding. Postmortems on Drexel revealed that the firm had relied very heavily on the use of short-term, confidence-sensitive commercial paper in funding its business. Further, much of that funding had been raised at the parent level and, in some instances, downstreamed into the broker-dealer entity in the form of equity, which then supported further leverage.
These lessons were quickly incorporated into the approaches taken by securities firms, by their supervisors, and by the community of equity analysts that follows securities firms. Firms began to carefully limit their use of unsecured short-term funds--commercial paper, in particular. Regulators tracked the use of short-term unsecured borrowings, and the firms themselves emphasized their minimal dependence on such funding in their public filings and touted their reliance on secured funding. For example, one firm included the following language in its 2006 10-K filing the statement:
In financing its balance sheet, the Company attempts to maximize its use of secured funding where economically competitive. Short-term sources of cash consist principally of collateralized borrowings, including repurchase transactions, sell/buy arrangements, securities lending arrangements and customer free credit balances. Short-term unsecured funding sources expose the Company to rollover risk, as providers of credit are not obligated to refinance the instruments at maturity. For this reason, the Company seeks to prudently manage its reliance on short-term unsecured borrowings by maintaining an adequate total capital base and extensive use of secured funding.11
Similar statements could be found in the annual reports of many other institutions that were active dealers in securities and over-the-counter derivatives.
But the comfort taken in this reliance on short-term secured funding, while explicitly rejecting short-term unsecured funding as highly confidence-sensitive and fickle, proved to be gravely misplaced during the crisis. At least two realities were not sufficiently appreciated by firms, their supervisors, and other observers before 2008. First, the composition of the collateral in the years leading up to the crisis changed slowly but steadily and fundamentally. When Drexel failed in 1990, the collateral that was funded through repos and other types of secured funding arrangements was almost exclusively U.S. Treasury and agency securities. Such collateral embedded a "right way risk" in the sense that the collateral was likely to rise in value and liquidity during a flight to quality, at precisely the time when institutions lending against and borrowing against such collateral faced stress.
Over time, however, the repo collateral pool evolved to include a much wider range of instruments, many of which were not likely to benefit during a flight to quality. According to some estimates, by 2007, the fraction of the more pristine collateral types had fallen to about one-third of the overall funding market. Particularly insidious, of course, were structured products tied to mortgages. Not only were these instruments, it is now clear, less likely than debt issued by the Treasury or agencies to remain liquid during a stress scenario, but, because of the assumptions about default correlations that were fundamental to their design, they were particularly exposed precisely to the sort of systemic risk event that would also negatively affect financial institutions that were funding these instruments on a secured basis.
The other reality that was driven home by the crisis involved a fundamental disconnect between the perspective of secured lenders and secured borrowers, notably securities firms (including those affiliated with commercial banking organizations). As evidenced in the statement quoted earlier, secured borrowers financing positions for themselves and their customers viewed repos and other such transactions as asset-backed lending, where the comfort of the lender was tied exclusively to the presence and amount of collateral, meaning the degree to which a "haircut" reduced the amount financed below the market value of the collateral. Such asset-backed lending models were familiar to dealers and reflected their approach to conducting business with, in particular, hedge funds. In such relationships, the dealers placed little reliance on the financial condition of the counterparty or its overall portfolio of positions. Rather, credit risk was managed by assuring that the amount of funding provided was always less, again by some haircut, than the amount of collateral held by the dealer, and which the dealer could quickly liquidate if necessary. But, unfortunately, such a model was not consistent with the manner in which secured lenders, including money market mutual funds and other institutions, viewed and managed their credit exposure. As became clear in the course of the crisis, they drew comfort from the collateral, but also very much from the capacity of the counterparty, as reflected in market-based indicators like credit spreads and equity price as well as less-objective signals including market "noise." The effect of this sensitivity would also be amplified, of course, by the manner in which the composition of the collateral had evolved away from consisting exclusively of Treasury securities and other similar, highly liquid instruments.
B. A second example: Consequences of losses on collateralized mortgage obligations in the early 1990s
If overconfidence in the reliance of secured funding was one recurrent theme in the crisis, the overconfidence in the capacity of pooling and tranching to manage default risk stood at the absolute epicenter. Here, too, lessons from previous adverse events made a lasting impression on the psyches of market participants, regulators, and analysts. This experience led to careful tracking of certain metrics, not only externally, as evidenced by the questions that rating agencies asked when reviewing financial institutions' ratings and by equity analysts on earnings calls, but internally as well. And, unfortunately, the tracking of these metrics, and their incorporation into the internal risk control systems of financial institutions, was not sufficiently resilient to the dynamic nature of the financial markets.
In the early 1990s, a number of financial institutions, including some investment banks like Solomon Brothers, experienced outsized losses related to holdings of certain tranches of mortgage-backed bonds known as collateralized mortgage obligations, or CMOs. More particularly, the losses were related to the holding of certain tranches that concentrated interest rate risk. This spate of losses followed an earlier incident in 1987 when a trader at Merrill Lynch lost the then-stunning sum of $377 million trading similar positions. In the years that followed, both internal and external watchdogs became very focused on these tranches. While creation of these bonds that concentrated exposure to certain risks was critical to bringing lucrative securitization deals to market, it was understood that not distributing these products to parties willing and able to bear these risks placed structuring banks in jeopardy of one sort or another: If the bonds were sold to unwitting or unsophisticated parties, there were clear reputational and compliance consequences. If the bonds were held by the firm, the consequences were potentially financial. As the securitization market grew and evolved, including by increasingly securitizing assets that entailed not only interest rate risk but also credit risk, the mantra remained that distribution of the most risky tranches must be carefully managed and monitored. And so they were, with management providing assurances and supporting metrics to regulators, rating agencies and, on a more limited scale, to the public through filings and commentary on conference calls.
However, the structures devised for securitizations are anything but static. The underlying assets generate finite cash flows that are distributed to purchasers of the asset-backed bonds. The design of a structure is an exercise in allocating those cash flows to different liability holders, with many different possible methodologies. If certain liabilities over time come to be referred to as "toxic waste," if their retention immediately raises red flags and if there are significant penalties for not distributing those instruments cleanly and promptly, market participants naturally respond by ensuring that those bonds find willing purchasers, typically by adopting allocation rules that pay potential holders generously.
Of course, where the underlying assets generate finite cash flows, making one tranche of liabilities richer must, by definition, make some other piece of the capital structure less attractive to hold. As market practices evolved over the past 15 years, often the so-called mezzanine tranches became the key to getting securitizations done. Investors, such as hedge funds and other specialists, were paid generously to own the lowest pieces of the capital structure. The most senior securities, on the other hand, were attractive at moderate yields to any number of investors. The middle ranges often proved the most difficult to place, as these did not pay like the lower tranches yet were clearly significantly more risky than the most senior liabilities.
As the pace of securitization activity continued to accelerate after the turn of the century, some institutions found it increasingly difficult to distribute the mezzanine bonds. Although free of the stigma accorded to the "residual" or "equity" tranches, there was enough sensitivity to any buildup of these marginally investment-grade instruments that pressure built for some solution, either developing new distribution channels or slowing the speed with which the factory was churning out product. Appetite to slow the factory was of course limited by the profitability of the enterprise. So, several institutions solved the problem in a different way that ultimately had very profound consequences for themselves and the broader financial system.
By relying not just once but also a second time on the pooling and tranching technology, mezzanine bonds could be resecuritized and thus supported by a new capital structure. As this process played out at the firms most affected, the lower tranches of the resecuritization were small in size and priced to move. The bulk of the liabilities from the resecuritization consisted of bonds receiving the highest possible rating. Not only was the normal diversification benefit from pooling assets relied on when assessing the likelihood that different parts of the capital structure would experience losses through defaults, but in many cases, additional diversification effects were recognized, as multiple pools of assets, or pools of different types of assets, were combined to back a single resecuritization deal. But, given the finite cash flows generated by the underlying assets, the need to direct cash flows with sufficient generosity to the lower tranches to ensure distribution, and the large proportion of senior bonds, the yields on the highly rated bonds produced through resecuritization were anemic.
The combination of high ratings and low yields turned out to be a very dangerous one for financial institutions. If the yields had been greater, more of the product would presumably have been sold to investors with the capacity to assess the relevant risks. If the ratings had been lower, the securities would have looked more like residual tranches, and a number of internal and external risk control processes would have likely engaged to quickly sound alarm bells at a dangerous buildup of undistributed product. But those systems were not as attuned to concentrations of highly rated instruments as they were to lower tranches in the capital structure. Financial controllers were less likely to aggressively force markdowns of highly rated product to levels at which sales would be possible to sophisticated investors. The regulatory capital signals were also muted, given the heavy reliance on ratings in most regulatory capital regimes. And risk managers, who carefully watched the balance sheet footings of traditional "residuals," were less alarmed by highly rated bonds. As a result, Citi, Merrill Lynch, and UBS ended up with tens of billions of dollars of super senior ABS CDO on their balance sheet, and large volumes of similar instruments held in less obvious ways--for example, in SIVs or conduits that were highly dependent on the secured funding discussed above.
C. Discussion
Through two examples, one focusing on secured funding and the other focusing on resecuritization, we have made the argument for a regulatory and supervisory analog to Heisenberg's Uncertainty Principle. In physics, the principle is rather remarkable, given that physical systems are generally stationary and invariant. It is therefore somewhat surprising that efforts to measure the movement of a particle actually change its trajectory. In the world of finance, where institutions and markets are continually evolving and individuals are highly sensitive to incentives, it seems less shocking that focusing on certain metrics would erode their usefulness. Nor is it surprising that elements of the financial system should evolve such that risks migrate toward instruments and strategies less likely to sound alarms.
But these points should not constitute an argument against an empirical approach to understanding risks in the financial system, or data collection exercises. It does, however, underscore the dangers of static data collection, in an effort to understand a financial system that is highly dynamic. It also suggests that those wishing to understand the system need to imagine themselves less like the physicist, who has the luxury of dealing with a system that is not continuously changing and where measurements relevant in one decade will continue to shed light during the next decade, and more like the intelligence analyst who must combine a variety of signals to form a mosaic that sheds light on the plans of an adversary. Key to this latter methodology is a fundamental recognition that the system being considered is dynamic, and more attention devoted to any one signal increases the likelihood that this signal will cease to be relevant, or perhaps even mislead.12
This realization suggests a paradigm for expanding the use of data in financial stability analysis. We have argued that aggregate statistics usefully signal unusual patterns of financial flows across sectors and emerging imbalances that should stimulate targeted analysis reliant upon additional sources of information collected specifically to investigate anomalies that presumably differ each time and cannot be predicted in advance. Just like intelligence analysts who begins by staring at a grainy satellite image, but follow up by bringing other resources to bear to understand what they are seeing, changes in some of these aggregate measures could be impetus for further work that would elucidate what particular instruments and activities are driving the change. Thus, we are in favor of collecting additional comprehensive and timely aggregate financial data. But given how quickly transactional forms evolve, particularly when they are tied to metrics against which firms or positions are judged, this approach must be complemented with a second stage of more-targeted analysis relying on less traditional sources of information that are specifically utilized to illuminate trends and potential anomalies visible in the aggregate data.
An approach that relies on these two distinct stages, expanded collection of aggregate data followed by collection of more-targeted and specialized information, could have been helpful in the period leading up to the recent crisis. In theory, such an approach could have identified signs in the aggregate data that credit provision to the non-financial sectors of the economy was growing rapidly. Likewise, aggregate data could have offered hints that the transfer of risk from the core financial system to other sectors was not growing commensurately with the increase in the securitization of assets. Such signals might have motivated earlier efforts, using specialized granular data, to drill down into the types of transactions that, over a short period of time, came to dominate the mortgage and secured-funding markets prior to the crisis.
The approach we prefer might have allowed regulators and supervisors to develop a holistic understanding of the shadow banking system earlier. Although regulators and supervisors had a good understanding of some of its key elements, when confidence in this parallel system suddenly disappeared in August 2007, they generally lacked the perspective on the system as a whole--that is, how the various parts were linked together.
A better understanding of the shadow banking system, as it developed from, say, 2004 to 2007, was certainly not a sufficient condition for the crisis to have been averted. That would also have required timely judgments and forceful actions by policymakers, regulators, and financial institution executives, and surely the solution to a number of very difficult collective action problems as well. But, at the least, a better understanding of the shadow banking system could have played a critical role in effectively mitigating consequences of the crisis once it took hold.
V. Conclusions
The market turmoil of 2008 and 2009 demonstrated once again that, while the particular instruments and transactions are novel in each crisis, the underlying themes are recurring. In general, financial crises create and are then perpetuated by illiquidity: Triggering "shocks" cause critical funding to be suddenly withdrawn from some institutions or activities, and concerns about liquidity rapidly become concerns about solvency. And only at this point does the degree to which major institutions share common exposures suddenly become clear. As market participants struggle to reduce leverage in an atmosphere of vanishing liquidity and correlated exposures, market participants become reluctant, even unwilling, to transact with one another. Pressures quickly spread through the financial system.
In the recent crisis, the evolution of the financial system away from traditional banking--portfolio lending funded heavily with insured deposits--toward a system dominated by a complex network of collateralized lending relationships served only to increase the primacy of liquidity. Once the spreading illiquidity of formerly highly liquid instruments called into question the value of the underlying collateral, as well as the strength of many counterparties, the shadow banking system proved extremely fragile.
The task at hand for supervisors and policymakers is to better understand future changes in the financial system and the associated vulnerabilities with the new institutional arrangements and transactional forms that are created. These efforts will in turn require expanded and improved measurement and analysis of financial activity--efforts that, we believe, should be structured around two basic principles: First, work on and analysis of aggregate data and more-specialized data must proceed in tandem. Much good work has been done, both before and after the onset of the crisis. But we believe that relatively little of these efforts have been sufficiently coordinated across analyses of macro- and micro-data. In fact, we believe that such coordination, with the analysis of aggregate data leading to the identification of those areas where work with more-specialized data should be targeted, should be a key aspect of the paradigm in future financial stability work. Second, and in a similar vein, we believe that the analysis of aggregate data should be structured to be neutral with regard to transactional form, and focused instead on the recurring underlying themes associated with financial instability--competitive dynamics leading to greater leverage and risk-taking, correlated exposures among interconnected firms, and maturity transformation that results in a critical vulnerability to sudden withdrawals of funding. That said, the targeted work must be organized around awareness of and expertise in the prevalent transactional forms and the specialized data needed to understand their subtleties and implications. Substantial efforts reflecting both of these principles, including projects aimed at assessing leverage and maturity transformation, are now under way at the Federal Reserve and other central banks.
References
Acharya, Viral V., Philipp Schnabl, and Gustavo A. Suarez (2010). "Securitization without Risk Transfer," National Bureau of Economic Research Working Paper 15730.
Adrian, Tobias, and Hyun Song Shin (Forthcoming). "Liquidity and Leverage," Journal of Financial Intermediation; www.newyorkfed.org/research/staff_reports/sr328.pdf.
Bowman, David, and Daniel Covitz (2008). "Foundations of the Financial Market Turmoil," unpublished manuscript, Federal Reserve Board.
Brunnermeier, Markus K. (2009). "Deciphering the Liquidity and Credit Crunch of 2007-08," Journal of Economic Perspectives 23, no. 1, Winter, pp. 77-100.
Chrystal, Alec, and Paul Mizen (2003). "Goodhart's Law: Its Origins, Meaning and Implications for Monetary Policy." In Essays in Honour of Charles Goodhart. Volume 1. Central Banking, Monetary Theory and Practice, 221-43. Cheltenham, U.K., and Northampton, Mass.
Commission of the European Communities, International Monetary Fund, Organization of Economic Cooperation and Development, United Nations, and the World Bank (1993), System of National Accounts. Brussels/Luxembourg, New York, Paris, and Washington, D.C.
Covitz, Daniel M., Nellie Liang, and Gustavo A. Suarez (2009). "The Evolution of a Financial Crisis: Panic in the Asset-Backed Commercial Paper Market," Finance and Economic Discussion Series Paper No. 2009-36, Federal Reserve Board; www.federalreserve.gov/pubs/feds/2009/200936/200936pap.pdf.
Dynan, Karen E., and Donald L. Kohn (2007). "The Rise in U.S. Household Indebtedness: Causes and Consequences," Finance and Economic Discussion Series Paper No. 2007-37, Federal Reserve Board; www.federalreserve.gov/pubs/feds/2007/200737/200737pap.pdf.
Dynan, Karen E. (2009). "Changing Household Financial Opportunities and Economic Security," Journal of Economic Perspectives 23, no. 2, Fall, pp. 49-68.
Goodhart, Charles A. E. (1975). "Monetary Relationships: A View from Threadneedle Street," in Papers in Monetary Economics, Volume I, Reserve Bank of Australia. Sydney Australia.
Gorton, Gary B., and Andrew Metrick (2009). "Securitized Lending and the Run on Repo," National Bureau of Economic Research Working Paper No. 15223.
Christopher Mayer, Karen Pence, and Shane M. Sherlund (2009). "The Rise in Mortgage Defaults," Journal of Economic Perspectives 23, no. 1, Winter, pp. 27-50.
Dokko, Jane, Brian Doyle, Michael T. Kiley, Jinill Kim, Shane Sherlund, Jae Sim, and Skander Van den Heuvel (2009). "Monetary Policy and the Housing Bubble," Finance and Economics Discussion Series Paper No. 2009-49, Federal Reserve Board; www.federalreserve.gov/pubs/feds/2009/200949/200949pap.pdf.
Hordahl, Peter, and Michael R. King (2008). "Developments in Repo Markets during the Financial Turmoil," BIS Quarterly, December; http://ssrn.com/abstract=1329903.
Moore, Kevin B., and Michael G. Palumbo (2010). "The Finances of American Households in the Past Three Recessions: Evidence from the Survey of Consumer Finances," Finance and Economics Discussion Series Paper No. 2010-06, Federal Reserve Board; www.federalreserve.gov/pubs/feds/2010/201006/201006pap.pdf.
Palumbo, Michael G., and Jonathan A. Parker (2009). "The Integrated Financial and Real System of National Accounts for the United States: Does It Presage the Financial Crisis?" American Economic Review 99, no. 2, May, pp. 80-86.
Teplin, Albert M., Rochelle Antoniewicz, Susan Hume McIntosh, Michael G. Palumbo, Genevieve Solomon, Charles Ian Meade, Karin Moses, and Brent Moulton (2006), "Integrated Macroeconomic Accounts for the United States: Draft SNA-USA." In A New Architecture for the U.S. National Accounts, ed. Dale W. Jorgenson, J. Steven Landefeld, and William D. Nordhaus, Chicago: University of Chicago Press, pp. 471-540.
Table 1. SNA-Based Sectoral Net Lending and Borrowing in the United States Capital Account Data, 1960 through 2009
| Net lending (+) or borrowing (-) by sector (billions of $2005) | 1960-79 | 1980-99 | 2000-07 | 2008-09* |
| 1. All U.S. sectors | -16 | -110 | -522 | -679 |
| 2. All U.S. sectors, Households | 127 | 199 | -189 | 209 |
| 3. All U.S. sectors, Nonfinancial noncorporate businesses | -57 | -66 | -48 | -5 |
| 4. All U.S. sectors, Nonfinancial corporations | -31 | -40 | -30 | 83 |
| 5. All U.S. sectors, Financial businesses | 15 | -9 | 66 | 190 |
| 6. All U.S. sectors, Federal government | -56 | -185 | -228 | -1030 |
| 7. All U.S. sectors, Municipal governments | -15 | -10 | -94 | -126 |
| 8. Rest of the world | -14 | 54 | 594 | 519 |
| 9. Statistical discrepancy | 30 | 56 | -73 | -159 |
Note: Current-dollar estimates have been converted to 2005 dollars using the BEA's GDP deflator.
* Figures for 2009 are rough estimates based on the available (but incomplete) data in the financial and capital accounts.
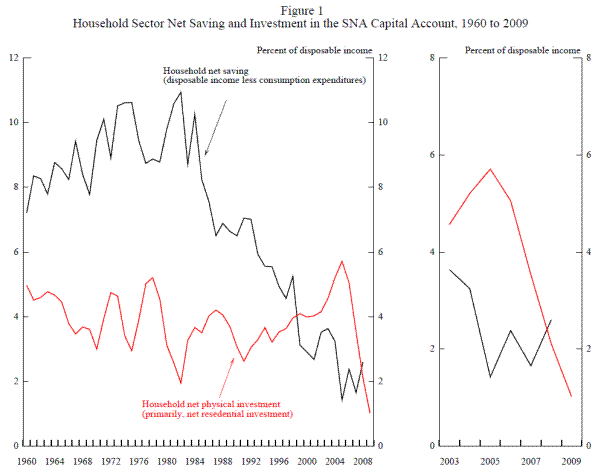
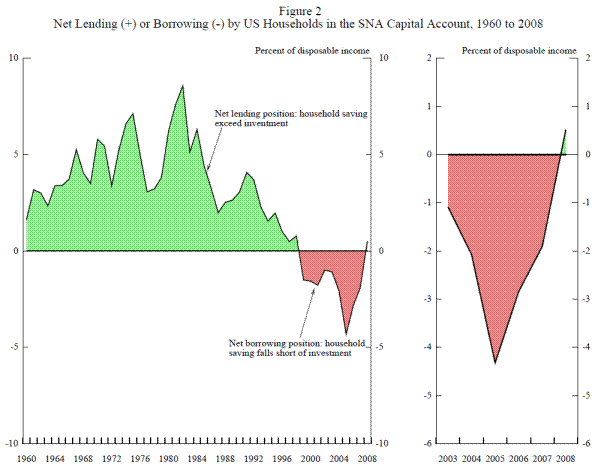
Figure 3
 |
 |
 |
 |
 |
 |
Sources. Personal saving rate: Bureau of Economic Analysis; all other series: Federal Reserve Board.
Figure 3 Data