
What Should Core Inflation Exclude?*
Keywords: Inflation, price level, core inflation
Abstract:
Consumer price inflation excluding food and energy often performs worse than other measures of underlying inflation in out-of-sample tests of predicting future inflation or tracking an ex-post measure of underlying trend inflation. Nonetheless, inflation excluding food and energy remains popular for its simplicity and transparency. Would excluding different items improve performance while maintaining the simplicity and transparency? Unfortunately, probably not. Averaging across a series of tests suggests that knowing what items to exclude before seeing the data is problematic and excluding food and energy is not a bad ex-ante guess. However, ex-post it is not difficult to construct an index which performs considerably better than excluding food and energy.
Faced with the high volatility of monthly and quarterly overall consumer price inflation, some economists and policy makers have sought an inflation measure which reduces the transitory volatility while maintaining the signal that changes in inflation can imply for the state of the economy. The
most common of these "core" measures is consumer price inflation excluding food and energy, a type of exclusion index. Exclusion indexes are created by taking an overall price index, dropping a pre-determined subset of items, and creating a new price index with the remaining items. While consumer
prices excluding food and energy is the most common exclusion index, other countries emphasize different exclusion indexes. For example, the core price index at the Bank of Canada excludes indirect taxes and eight of the most volatile components.2 The Bank of Japan excludes only fresh food.
Key features of an exclusion index are that the excluded items are determined before the release of the monthly inflation data and that the list of excluded items does not change often. Further, for the items that remain in the index, there is no down weighting or up weighting of individual items - their relative weights are the same weights used to construct the overall index. These features make exclusion indexes fairly easy for the general public to understand and for analysts outside the statistical agencies to replicate, and they are important reasons for the popularity of exclusion indexes as core inflation measures.
However, exclusion indexes are just one of many possible ways of a constructing an index of "core" inflation, a concept coined by Gordon (1975) to describe an underlying inflation rate as opposed to a temporary inflation movement. Further, it is not clear that exclusion indexes are the best way to construct a core inflation index, or that the consumer prices excluding food and energy is the best exclusion index for the US. Rich and Steindel (2007) suggest that no core inflation measure consistently performs better than other measures at tracking an ex-post measure of trend inflation or predicting future inflation over time. While other studies have supported this point, they have generally found consumer prices excluding food and energy to perform somewhat worse than other inflation measures. Among studies using US data, Smith (2004) found that weighted median inflation performs better than consumer prices excluding food and energy at predicting future inflation, both in-sample and out-of-sample. Similarly, Meyer and Pasaogullari (2010) found that either the trimmed mean CPI or inflation expectations from the Survey of Professional Forecasters generally were better predictors of future CPI inflation than the CPI excluding food and energy. Further, Detmeister (2011) found that PCE inflation excluding food and energy performed worse at matching a handful of ex-post PCE inflation benchmarks than a number of alternative approaches to core inflation. 34
One response to the relatively poor performance of inflation excluding food and energy is to emphasize a different type of measure, such as the trimmed mean, which removes the items with the highest and lowest inflation rates each month, or variance-weighted inflation, which puts less weight on items which have highly variable inflation. However, given the popularity and simplicity of consumer prices excluding food and energy, this note attempts to improve that index rather than abandon it. The primary method used to tease out an index which better predicts future US headline inflation and better tracks ex-post trend inflation is to simply sequentially remove items one by one.
The lessons from this attempt to create a better exclusion index of US PCE inflation are:
- An optimized in-sample exclusion index would exclude nearly all energy items, but less than half of food consumption. Aside from food and energy, it would also exclude around 2/3 of other goods consumption and 1/3 of other services consumption-dropping items such as used car margins, tobacco, furniture, life and car insurance, imputed financial services, and most transportation services. This index performs better in-sample than all other core inflation measures to which it is compared.
- Out-of-sample, however, an exclusion index optimized based on in-sample fit performs no better than excluding food and energy, or excluding only energy. It also performs far worse than many alternative core inflation measures such as trimmed means and component smoothing. Instability in the covariance of inflation rates across items suggests an exclusion index approach is unlikely to be a fruitful method of creating a substantially better core inflation measure for out-of-sample use.
I reach these conclusions by examining a combination of 60 different specifications to decide which items to exclude from the index. These specifications differ along three dimensions: 1. the sampling interval used (price changes over 1, 3, 6, or 12-months), 2. the time period examined (December 1978 to September 2009, March 1991 to September 2009, or January 2000 to September 2009), and 3. the ex-post benchmark that the index is design to fit (a centered 36-month moving average of overall inflation, a Baxter-King band-pass filtered version of overall inflation, overall inflation over the next 12 months, overall inflation 12 to 24 months ahead, or forecasting 12-month ahead overall PCE inflation in regression which includes Phillips curve driving variables).
The items and the share of the consumption bundle excluded are sensitive to the choice of specification. However, the finding that an optimized exclusion index performs little better than standard exclusion indexes in out-of-sample exercises, and worse than some other methods such as trimmed means and component smoothing, appears robust to a number of alternatives.
The focus here is only on US inflation and specifically on inflation in the personal consumption expenditures (PCE) price index published by the Department of Commerce's Bureau of Economic Analysis (BEA) as part of the National Income and Product Accounts.5 However, since the majority of PCE prices are derived from items in the more-well-known Consumer Price Index (CPI) published by the Department of Commerce's Bureau of Labor Statistics, the main conclusions of this note are likely to hold for the CPI as well.
Constructing an optimized exclusion index
Previous studies by Clark (2001) and Dolmas (2009) looked at the effects of excluding different item from overall inflation.6 Clark (2001) used a 36-category breakdown of CPI prices, ranked them by their monthly volatility over the 1967-1997 period, and excluded the eight most volatile categories. He found the resulting core index less appealing than either a trimmed mean or the CPI excluding energy. Dolmas (2009) used a 186-component disaggregation of PCE prices to exclude 19 items for which their individual exclusions from the headline index lead to a reduction in the cyclical volatility of the inflation index over the 1987 to 2008 period. He found that these exclusions led to an index which more closely tracked an ex-post measure of trend inflation and better forecasts of future inflation over the 1987 to 2008 period. Dolmas did not try his procedure on an out-of-sample basis, but did find that the list of items excluded in a 1997 to 2008 sample differed only slightly from the full 1987 to 2008 sample.
Similar to these studies, this current note uses a more disaggregated price structure than simply food, energy and other items. Using a disaggregated categorization of PCE can provide a better sorting of the individual components into items that should be included and items that should be excluded from inflation to make the resulting index best match future or current trend inflation. The 205-item breakdown of PCE prices used in this note-the most disaggregated breakdown available over the time periods examined-is similar to the disaggregation used in Dolmas.7
The studies of Clark and Dolmas determined which items to exclude by focusing on variance. Clark excluded the items with the most volatile monthly inflation rates. The idea is that the high volatility of these items adds noise to the inflation index. Dolmas took this variance approach a step further by recognizing that the increased variance that an item adds to the inflation index depends on what other items are in the index. He examined changes in the variance of the aggregate inflation index resulting from excluding items one at a time. However, by focusing on reducing volatility these studies ignore that volatility is not the only important aspect for a core inflation index. Besides volatility (noise) price changes also contain a signal for future inflation, and reducing the variance of the resulting index can also reduce its signal.
To see the signal-noise trade off more clearly, assume that we measure the usefulness of the core inflation index by the standard error of the core index from some benchmark inflation series, perhaps a measure of ex-post trend inflation or top line inflation over the next twelve months.8 This standard error can be written as
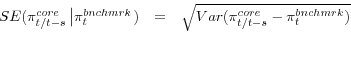
where
The standard error of equation 1 is minimized by reducing the noise of the core index,
![]() , while maximizing its signal,
, while maximizing its signal,
![]() . (The variance of the benchmark,
. (The variance of the benchmark,
![]() , is the same regardless of the composition of the core index.)
, is the same regardless of the composition of the core index.)
Decomposing these last two terms in equation 1 into individual items in the inflation index we can write9:
| (2) |
where
![]() is the annualized percent change in price for item i in the index between time t-s and t,
and w
is the annualized percent change in price for item i in the index between time t-s and t,
and w![]() is the weight of the item in the core inflation index. The last line of this equation shows that the standard error in equation (1) is minimized by
excluding items which co-vary strongly with other items in the index, but do not co-vary strongly with the inflation benchmark. In other words, items that add more noise (
is the weight of the item in the core inflation index. The last line of this equation shows that the standard error in equation (1) is minimized by
excluding items which co-vary strongly with other items in the index, but do not co-vary strongly with the inflation benchmark. In other words, items that add more noise (
![]() ) than signal (
) than signal (
![]() ) to the core index should be excluded.
) to the core index should be excluded.
Note that the basis for the approach used by Clark, and also used to determine the Bank of Canada's core index, is a special case of the result in equation 2. To see this, assume that the noise is uncorrelated across items,
![]() for all items in equation (2), and that the underlying signal contained in each item is the same,
for all items in equation (2), and that the underlying signal contained in each item is the same,
![]() for all items. Then the right-hand side of equation 2 could be re-written as
for all items. Then the right-hand side of equation 2 could be re-written as
![]() , which is minimized by removing the items with the highest variance.
, which is minimized by removing the items with the highest variance.
The more general approach taken in this note does not assume either a common signal or uncorrelated noise across items. Instead, it directly minimizes equation (1) by sequentially eliminating items. As a result the procedure takes into account both differences in signal and correlations in noise across items.
The procedure starts with all items in the PCE price index and iteratively removes the item which gives the maximum reduction in the standard error per unit of consumption. That is, at each step all components in the index are ranked by
| standard error of the core index after excluding item - standard error prior to excluding item average consumption share of index after excluding item - consumption share prior to excluding ite |
(3) |
where the standard error of the core index is defined as in first line of equation (1). The item at the top of this ranking is removed and a new core index is constructed which takes all previous exclusions as given. All items are re-ranked using the new core index as the baseline and the process is repeated until there are no more exclusions that will reduce the standard error of the index.10 This process is similar to a steepest ascent gradient method of optimization with the goal of maximizing the fit of the index while minimizing the share of the consumption basket excluded.11
In-sample results for a sequential exclusion price index
Following the procedure outlined above, table 1 lists the first 20 items (out of 205) excluded using four different specifications. These specifications differ in the interval used to determine the inflation rate in the core index (1- or 12-month price changes) and in the benchmark used to determine the fit of the core index (a centered 36-month moving average of top line inflation and inflation over the next 12 months). All four specifications use the same time period which runs from the beginning of 1978 through September 2009.
Five items are among the first 20 removed in all specifications: Gasoline and other motor fuel, natural gas, fuel oil, pork, and dishes and flatware. Five other items are among the first 20 items excluded in three of the four specifications: intercity buses, household linens, information processing equipment, public air transportation, and telephone and facsimile equipment. The remainder of the first 20 items removed varies significantly by the specification.
| Benchmark Headline inflation over next 12 months (1-month Sampling Interval) | Benchmark Headline inflation over next 12 months (12-month Sampling Interval) | Benchmark Centered 36-month moving average of headline inflation (1-month Sampling Interval) | Benchmark Centered 36-month moving average of headline inflation (12-month Sampling Interval) |
|---|---|---|---|
| 1 Gasoline and other motor fuel | Fuel oil | Gasoline and other motor fuel | Fuel oil |
| 2 Life insurance | Gasoline and other motor fuel | Life insurance | Other fuels |
| 3 Fuel oil | Net health insurance - Income loss | Fuel oil | Gasoline and other motor fuel |
| 4 Natural gas | Information processing equipment | Net motor vehicle and other transportation insurance | Net health insurance - Income loss |
| 5 Net motor vehicle and other transportation insurance | Natural gas | Public air transportation | Information processing equipment |
| 6 Public air transportation | Telephone and facsimile equipment | Natural gas | Telephone and facsimile equipment |
| 7 Vegetables (fresh) | Railway transportation | Financial service charges, fees, and commissions | Railway transportation |
| 8 Dishes and flatware | Net transactions in used autos | Eggs | Video and audio equipment - Other video equipment |
| 9 Financial service charges, fees, and commissions | Intracity mass transit | Dishes and flatware | Natural gas |
| 10 Household linens | Video and audio equipment - Other video equipment | Vegetables (fresh) | Public water transportation |
| 11 Children's and infants' clothing | Other fuels | Household linens | Net transactions in used autos |
| 12 Telephone and facsimile equipment | Intercity buses | Poultry | Intracity mass transit |
| 13 Information processing equipment | Public air transportation | Children's and infants' clothing | Employment agency services |
| 14 Eggs | Employment agency services | Watches | Games, toys, and hobbies |
| 15 Electricity | Public water transportation | Luggage and similar personal items | Intercity buses |
| 16 Intercity buses | Electricity | Jewelry | Pork |
| 17 Poultry | Communication services | Tobacco | Dishes and flatware |
| 18 Luggage and similar personal items | Dishes and flatware | Pork | Sugar and sweets |
| 19 Tobacco | Pork | Financial services furnished without payment by commercial banks | Recreational books |
| 20 Pork | Games, toys, and hobbies | Used auto margin | Household linens |
The four specifications shown in table 1 are just a small sampling of possible specifications that could be used and the results suggests that different specifications will lead to different items being excluded, though some items are likely to be excluded in most specifications. To create a fairly general specification that is not over-optimized for one particular specification this note examines 60 specifications which differ by the time period examined, the interval used to determine the inflation rate in the core index, and the benchmark used to determine the fit of the core index.
Three different time periods are examined: January 1980 to September 2009, March 1991 to September 2009, and January 2000 to September 2009. These time periods were chosen to align with Detmeister (2011), which will be helpful in comparing the core index created here with alternative measures of core inflation. The last time period, January 2000 to September 2009, represents the data available since a considerable revision to the CPI methodology in 1999.
Four different sampling intervals are used: 1, 3, 6, and 12-month price changes. These intervals are the most common at which inflation is referenced.12
Five different benchmarks are consulted to judge the fit of the core index: a centered 36-month moving average of overall inflation, a Baxter-King band-pass filtered version of overall PCE inflation, overall PCE inflation over the next 12 months, overall PCE inflation 12 to 24 months ahead, and forecasting overall PCE inflation in next 12-months using regression which includes Phillips curve driving variables. These benchmarks are meant to align with the main uses of a core inflation index as either an indicator of the current inflation rate purged of transitory factors (centered 36-month moving average of overall inflation and a Baxter-King band-pass filtered version of overall inflation) or a predictor of future inflation (overall inflation over the next 12 months, overall inflation 12 to 24 months ahead, and forecasting overall PCE inflation over the next 12 months in regression which includes Phillips curve driving variables13). These tests are more fully described in Detmeister (2011).14
Mixing and matching these choices leads to 60 unique specifications. We can get an idea of how similar to specifications are, and hence what choices are the most important, by examining cross-correlations in the order of when an item was excluded over the specifications. The 60 specifications result in 1,770 bilateral correlations.
The average rank-order correlation across the specifications is 0.29, suggesting that different specifications lead to quite different exclusion indexes. If two specifications differ by only one dimension the average correlation is 0.46, if they differ across two dimensions the average correlation drops to 0.30, and if they differ across all three dimensions the average correlation falls to 0.22. Panels A, B, and C of table 2 show the average rank-order correlations for specifications that differ along one dimension.
Table 2. Bilateral Rank-Order Correlations for Specifications which Differ by a Single Dimension
Panel A. Average correlations where specifications differ only by benchmark
| Benchmark: Centered 36-month moving average | Benchmark: Inflation in next 12 months | Benchmark: Inflation 12 to 24 months ahead | Benchmark: Phillips curve | |
|---|---|---|---|---|
| Baxter-King band pass filter | .70 | .72 | .31 | .15 |
| Centered 36-month moving average | .66 | .51 | .18 | |
| Inflation in next 12 months | .41 | .17 | ||
| Inflation 12 to 24 months ahead | .14 |
Panel B. Average correlations where specifications differ only by sampling interval
| Length of sampling interval: | 3 months | 6 months | 12 months |
|---|---|---|---|
| 1 month | .73 | .46 | .33 |
| 3 months | .68 | .48 | |
| 6 months | .71 |
Panel C. Average correlations where specifications differ only by time period
| Time period starting date: | March 1991 | January 2000 |
|---|---|---|
| January 1980 | .49 | .31 |
| March 1991 | .54 |
Using either the Baxter-King band pass filter of inflation, a centered 36-month moving average of inflation, or inflation in the next 12 months as the benchmark inflation series seems to give roughly similar results. Rank order cross correlations for specifications which only differ among these
three benchmarks average about 0.7. However, changing the benchmark to either inflation over months 12 to 24 in the future or a Phillips curve lowers the rank order correlation, suggesting that that these benchmarks may lead a considerably different core inflation index than the other
benchmarks.
Similarly, small changes in the sampling interval lead to roughly comparable core inflation indexes, but large changes in the sampling interval can lead to consequently larger changes in the resulting index. For example, the rank order correlation is .7 between specifications which differ only by the sampling interval being 1 or 3 months, but falls to .3 when the difference in sampling interval is 1 and 12 months. Differences in time periods, panel C, can also lead to quite different core inflation bundles. These results suggest all three specification choices-benchmark, time period, and sampling interval - are important and can lead to quite different bundles of items to exclude.
The low correlation of the list of items to remove suggests that a stable group of items to exclude may be elusive. It also creates a bit of a dilemma: Given the number of different ways that core inflation is used, there is no obvious way to choose which of these 60 specifications, or numerous other possible specifications, makes the most sense to use to determine which items to exclude. Therefore, instead of choosing a single specification, the 60 different specifications are averaged. Averaging should result in a price index that is generally applicable across different benchmarks, time periods, and sampling intervals.
To average across the specifications equation 3 is modified to
| ∑j specifications ln(std. dev. in specification j after excluding item i - ln(std. dev. in specification j prior to excluding item i) ∑j specifications average consumption share of index in spec. j after excluding item i - consumption share in spec. j prior to excluding item i |
(4) |
and the sequential exclusion process is re-run using this average criteria to determine which items to remove at each step. The logarithm of the deviations are used when averaging across specifications to keep specifications with high standard errors, such as specifications with a one-month sampling interval, from dominating which items should be excluded.
The full order of exclusion using this combined specification is shown in the appendix table. Not surprisingly, gasoline, fuel oil, and natural gas are the first three items removed out of 205. Electricity is the twenty-second item removed. These four items comprise more than 98 percent of consumer energy expenditures and they are all removed in the first 12 percent of the consumption bundle excluded. Their early exclusion suggests that the normal practice of simply excluding the all energy items has some merit.
On the other hand, only some food products are among the earlier items removed. The first food items removed are fats and oils (10), processed dairy products (13), eggs (15), fresh vegetables (18), and pork (24). Many food items are not removed until much later. Sugar and sweets (171), beer (174), and fish and seafood (183) are among the last 20 percent of the consumption bundle excluded.15 Further, food purchased at restaurants (food in purchased meals - other purchased meals (205)), is the very last items removed using this sequential exclusion procedure.16
Aside from food and energy, many of the exclusions are consistent with informal views of which items have highly transitory shocks that can swing around PCE prices: Used car margins, imputed banking services, airline fares, and tobacco are among the first 15 percent of the consumption bundle excluded. Similarly, some items which are informally thought of as being more persistent are among the later items removed, such as owner's equivalent rent (166), tuition for higher education (195), and a number of other services.17 There are, however, some surprises: Lodging away from home (hotels & motels - 141) and new cars (foreign - 170 and domestic - 176) are removed much later than would be suggested by simply looking at the variability of the items' price changes.
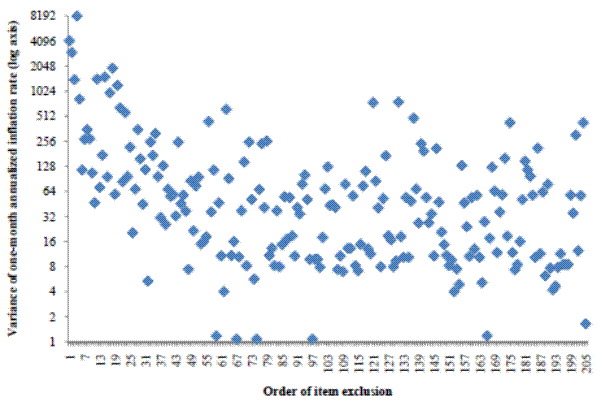
Figure 1 shows how the order of the items exclusion using this average criteria compares to the variance of that item's monthly inflation rate over the March 1991 to September 2009 period, which proxies for the type of criteria used by Clark. As can be seen from this figure there is some relationship between how quickly an item is excluded and the variance of its one-month inflation rate, but the relationship only holds for the first 40 to 50 items excluded. This suggests that the methodology used here will lead to a somewhat different price index than using only the item's variance to determine whether it should be excluded or not.
To show how well this new measure fits, figure 2 shows the how the geometric average of the standard errors for the sixty specifications changes as the share of consumption excluded increases. As can be seen from the figure, the average standard errors from the newly-created exclusion index drop quickly as the first few items are removed and are minimized when just over half of the consumption bundle is excluded (and 128 of the 205 items) - marked by the small vertical line. However, the average change in error is pretty small once a third of the consumption basket has been removed. Simply removing gasoline or energy items improves the fit of the index a large amount without removing much of the consumption basket. At the point where the average standard error from the sequential exclusion procedure hits its minimum the standard error of the index is about half of the standard error of the all-item PCE index. Once more than about half of the consumption basket is removed the average standard error increases, but the pattern is not uniform.
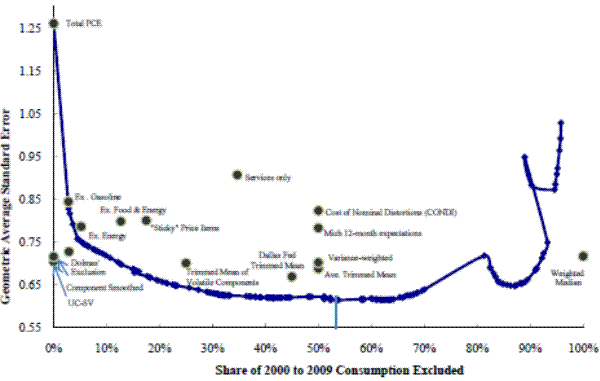
Table 3 shows the categorization of the items excluded at the minimum point. All energy items are removed, and around three-quarters of food consumption is excluded. Between two-thirds and three-quarters of other goods consumption is removed, but only between one-third and one-half of non-energy services. Among the goods, non-durable goods are more likely to be removed than durable goods. Among services, housing services are less likely to be removed than other services.
Table 3. Classification of Items Excluded from the In-Sample Version of the Sequential Exclusion Price Index
| Category Share of 2000 to 2009 Overall PCE | Share of Category Consumption Excluded | Number of Category Items Excluded/ Category Total | |
|---|---|---|---|
| Overall PCE | 100 | 54 | 128 / 205 |
| Energy | 5 | 100 | 6 / 6 |
| Food and Beverages | 7 | 75 | 15/22 |
| Food | 6 | 83 | 14 / 19 |
| Alcohol | 1 | 26 | 1 / 3 |
| Excluding Food and Energy | 87 | 49 | 107/177 |
| Goods | 24 | 72 | 42 / 67 |
| Durable Goods | 12 | 68 | 25 / 40 |
| Motor Vehicles | 4 | 49 | 4 / 9 |
| Other Durable Goods | 8 | 79 | 21 / 31 |
| Nondurable Goods | 12 | 77 | 17 / 27 |
| Apparel | 4 | 82 | 3 / 6 |
| Other Nondurables ex. Food and Energy | 8 | 75 | 14 / 21 |
| Services ex. Food and Energy | 63 | 40 | 65 / 110 |
| Housing | 16 | 24 | 6 / 9 |
| Medical Care Services | 15 | 50 | 4 / 8 |
| Other Services | 33 | 44 | 55 / 93 |
| Market-based | 20 | 47 | 29 / 50 |
| Non-market | 13 | 39 | 26 / 43 |
In-sample results also suggest that the sequential exclusion procedure also performs better than a number of alternative measures of underlying PCE inflation, which are also shown on figure 2.18 At its minimum point the error from the sequential exclusion procedure is below the error of all of the other measures. The majority of these other measures do not use an exclusion-based framework, and as noted at the beginning of this paper, the exclusion based measures (excluding gasoline, excluding energy, excluding food and energy, sticky price items, services only, and Dolmas' exclusion) generally perform worse than many of the other measures. However, Dolmas' exclusion performs notably better than the other exclusion indexes and, arguably, begins to approach the performance of the trim-based measures (Dallas Fed trimmed mean, average trimmed mean, trimmed mean of volatile components, weighted median), though it still does not perform as well as the sequential exclusion procedure.19
Much like the results in Dolmas (2009), these results show that once all the data are known we can construct an exclusion index of core inflation that is much better than simply excluding food and energy. In fact, once the data is known we can create an exclusion index of core inflation that performs better than any of the other any of the other main indexes of underlying inflation. A much harder test is to see whether we can create a better core index before observing all of the data.
Out-of-sample results for a sequential exclusion price index
Transforming the in-sample sequential exclusion index used above into an out-of-sample version requires some modification of how to determine the basket of items excluded. The primary choice is whether to hold the items excluded fixed or allow them change over time. A clearly defined and stable basket of items is one of the features that make an exclusion index transparent and popular. However, since the economy's structure is continuously changing it likely makes sense to allow the basket of excluded items to evolve over time. Trading off these two competing ideas suggests allowing the basket of items to change only occasionally. As a result when creating the out-of-sample version of the sequential exclusion index the basket of excluded items is allowed to update once every five years.
Specifically, the out-of-sample sequential exclusion index is constructed by determining the best-fitting index using data through December 1978 and then using this basket of items for January 1979 to December 1983. The basket is then updated using data through December 1983 and the new basket is used from January 1984 through December 1988. The process is repeated every five years. The same five benchmarks and four sampling intervals from the previous section are used here to construct the out-of-sample index, but the three time periods are altered to the most recent 8, 15, and 30 years (or all available data if less than 30 years is available).
Following this out-of-sample procedure the average standard error across the sixty specifications of the sequential exclusion rises to 0.80 percentage point on annualized PCE inflation. This 0.80 percentage point out-of-sample error compares poorly to the 0.62 percentage point obtained in the in-sample procedure and shown in figure 1. Also, this out-of-sample standard error is nearly identical to the standard error for excluding food and energy, shown in figure 1, and it is far worse than the best-fitting alternative index, the Dallas Fed trimmed mean which has an average standard error of 0.67 percentage point.20 Thus strong results obtained in-sample do not carry over out-of-sample and out-of-sample the sequential exclusion index performs no better than standard core inflation measures.
A number of variations on the procedure were examined in order to attempt to improve the out-of-sample results. These variants included: Excluding only the first 5, 10, 15, 20, or 25 percent of the consumption basket (rather than around 50 percent of the consumption basket that is excluded when maximizing fit in-sample); Averaging errors over different years when determining exclusions to reduce the influence from one or two outlier; Determining exclusions in a non-path dependent (i.e. non-sequential) manner, that is by looking at the effect of removing single items from the overall price index rather than the effect of removing the items from an index which has had previous exclusions; Altering the time periods used in determining which items to exclude; and increasing the frequency of updating the basket of items from once every five years to once year or once every 3 years. While some of these alternatives did slightly improve the fit of the resulting exclusion index, none resulted in an index which fitted more than small handful of basis points better.
The poor out-of-sample performance of exclusion indexes is not confined to the sequential exclusion methodology that has been the focus of this note. Clark did not find that excluding items based on their volatility led to out-of-sample performance that improved upon simply excluding energy. Similarly, an out-of-sample version of Dolmas' procedure also performs about the same as excluding food and energy.21
The fragility of out-of-sample exclusion indexes
Why do out-of-sample exclusion indexes perform poorly? In short, for most items the historical variances and covariances used in determining whether the item should be included or excluded are only moderately helpful for predicting those covariances in future periods.
For the sequential exclusion index that has been the focus of this note, equation 2 above shows that the determination of which item to exclude depends on the item's covariance with the current price index and its covariance with the benchmark used to proxy for underlying inflation. Strong out-of-sample results require these covariances to be relatively predictable, but in practice they are not.
To illustrate this point, figure 3 displays the covariances of an item's price change with total PCE inflation over the past 10 years (the horizontal axis) compared to the covariance over the following five years (the vertical axis). The top panel uses a one-month sampling interval, while the bottom panel uses a 12-month interval. These panels serve as a check of the noise component in equation 2. At either sampling interval there is a positive relationship, but the relationship is not terribly strong. At the one-month interval the slope coefficient is around two-thirds with a standard error of about 0.05 and an R-squared of 0.12. At the twelve-month interval the slope coefficient is much smaller at 0.2, with a standard error of 0.02, and an R-squared of 0.07. These results suggest that there is some predictive power from an item's past relationship with total inflation for the item's future relationship with total inflation. However, past covariances accurately predict only a small part of future covariances.
Figure 3: Stability of Covariance Between Price Changes of an Item and Overall PCE Inflation Panel A. One-month sampling interval
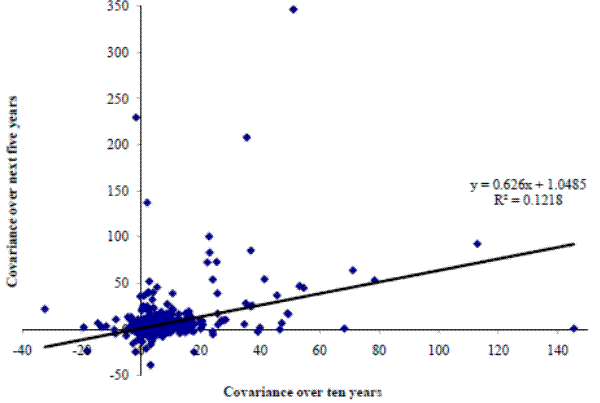 Figure 3a Data
Figure 3: Stability of Covariance Between Price Changes of an Item and Overall PCE Inflation Panel B. Twelve-month sampling interval
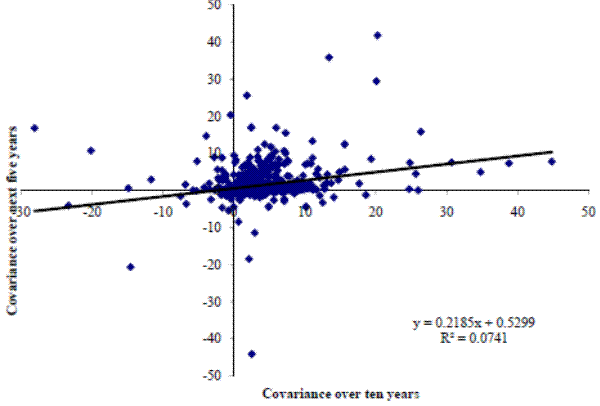 Figure 3b Data
The item's signal is even less stable. The covariance between the change in the price of an item and underlying inflation, measured here as a Baxter-King band pass filter of headline inflation, bears little relationship to that covariance in the next period. Figure 4 shows these covariances using the one-month sampling interval for the core index in the top panel and the 12-month sampling interval in the lower panel. Using one-month inflation rates the R-squared is .14, while it is a fairly dismal .01 using twelve month inflation rates. This suggests that the signal that an item has for future benchmark inflation is not closely correlated with the signal that the item had over the prior ten years.
Figure 4: Stability of Covariance Between Price Changes of an Item and Band-Pass Filtered Inflation Panel A. One-month sampling interval
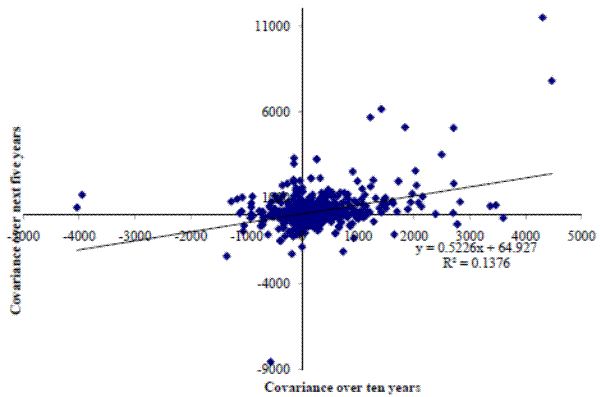 Figure 4a Data
Figure 4: Stability of Covariance Between Price Changes of an Item and Band-Pass Filtered Inflation Panel B. Twelve-month sampling interval
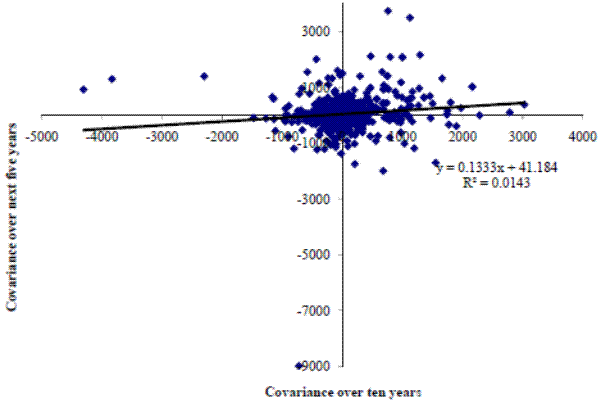 Figure 4b Data
These findings do suggest that past covariances are some help in predicting future covariances, thus exclusion indexes are likely to be of some use as a core inflation measure. However, the past covariances are not a strong proxy for future covariances. This relative instability suggests that the amount of improvement we would expect to see from an exclusion approach to core inflation is limited, and as a result alternative methods probably hold more promise for improving core inflation measurement.
Conclusion
Previous studies of core inflation measures suggest that no single core inflation measure consistently performs better than others, but inflation excluding food and energy has often been found to perform worse than other approaches to core inflation. Nonetheless, inflation excluding food and energy remains the most popular core inflation measure in the United States. This study attempted to tweak the basket of excluded items in order to improve the performance of the resulting index at predicting future inflation and at tracking an ex-post measure of trend inflation.
Changing the items excluded can lead to a better in-sample core index, with the items excluded similar to the items often judgmentally discounted because of their high variance. Nevertheless, the approach used to decide what items to exclude ultimately fails out-of-sample: The resulting index still performed no better than excluding food and energy. The reason for the failure appears to be that past covariances of individual items either with other items in the core index or with an inflation benchmark are only modestly helpful at predicting future covariances.
The instability of these covariances suggests that relying solely on an exclusion index approach is unlikely to yield significant improvements in the measurement of core inflation. Other approaches, such as the trimmed mean, may provide a better single measure of non-transitory inflation.
Brischetto, Andrea, and Anthony Richards (2007). "The Performance of Trimmed Mean Measures of Underlying Inflation," Revised version of Reserve Bank of Australia, RBA Research Discussion Paper 2006-10. Presented at Federal Reserve Bank of Dallas, Conference on Price Measurement for Monetary Policy, May 24-25, 2007.
Bryan, Michael F., and Stephen G. Cecchetti (1994). "Measuring Core Inflation," in Mankiw, N. G. ed., Monetary Policy. Studies in Business Cycles, vol. 29; Chicago and London; University of Chicago Press, pp. 195-215.
Bryan, Michael F., and Brent Meyer (2011). "Should We Even Read the Monthly Inflation Report? Maybe not. Then again...." Atlanta Fed Macroblog June 1, 2011.
Catte, Pietro, and Torsten Slok (2005). "Assessing the Value of Indicators of Underlying Inflation for Monetary Policy," OECD Economics Department Working Papers: 461.
Cecchetti, Stephen G. (1997). "Measuring Short-Run Inflation for Central Bankers," Federal Reserve Bank of St. Louis Review, vol. 79, no. 3, pp. 143-155.
Clark, Todd E. (2001). "Comparing Measures of Core Inflation," Federal Reserve Bank of Kansas City Economic Review, vol. 86, no. 2, pp. 5-31.
Cogley, Timothy (2002). "A Simple Adaptive Measure of Core Inflation," Journal of Money, Credit, and Banking, vol. 34, no. 1, pp. 94-113.
Crone, Theodore, N. Neil K. Khettry, Loretta J. Mester, and Jason A. Novak (2011). "Core Measures of Inflation as Predictors of Total Inflation," Federal Reserve Bank of Philadelphia Research Department Working Paper No. 11-24. June.
Detmeister, Alan (2011) "The Usefulness of Core PCE Inflation Measures." FEDS Working Paper Number 2011-56. December.
Dolmas, Jim (2009) "Excluding Items from Personal Consumption Expenditures Inflation." Federal Reserve Bank of Dallas Staff Papers. Number 7, June.
Freeman, Donald G. (1998). "Do Core Inflation Measures Help Forecast Inflation?" Economics Letters, vol. 58, no. 2, pp. 143-147.
Gordon, Robert 1975 "Alternative Responses of Policy to External Supply Shocks" Brookings Papers on Economic Activity, volume 1, pp. 183 - 206.
Hogan, Seamus, Marianne Johnson, and Therese Lafleche. (2001) "Core Inflation" Bank of Canada Technical Reports. Issue 89. January.
Meyer, Brent H., and Mehmet Pasaogullari (2010). "Simple Ways to Forecast Inflation: What Works Best?" Economic Commentary, Federal Reserve Bank of Cleveland,December 6.
Pedersen, Michael (2009). "An Alternative Core Inflation Measure," German Economic Review, vol. 10, no. 2, pp. 139-164.
Rich, Robert, and Charles Steindel (2007). "A Comparison of Measures of Core Inflation," FRBNY Economic Policy Review, December.
Robalo Marques, Carlos, Pedro Duarte Neves, and Luis Morais Sarmento (2003). "Evaluating Core Inflation Indicators," Economic Modelling, vol. 20, no. 4, pp. 765-775.
Smith, Julie K. (2004). "Weighted Median Inflation: Is this Core Inflation?" Journal of Money, Credit, and Banking, vol. 36, no. 2, pp. 253-263.
Appendix Table A. Items excluded from the In-Sample Sequential Exclusion Price Index (Listed from first item excluded to last item excluded)
| Cumulative Number of Items Excluded | Last Item Excluded | Geometric Average Standard Error of Index | Share of 2000 to 2009 Consumption Excluded |
|---|---|---|---|
| 0 | 1.27 | 0.00 | |
| 1 | Gasoline and other energy goods - Motor vehicle fuels, lubricants, and fluids - Gasoline and other motor fuel | 0.83 | 0.03 |
| 2 | Gasoline and other energy goods - Fuel oil and other fuels - Fuel oil | 0.82 | 0.03 |
| 3 | Household consumption expenditures - Housing and utilities - Household utilities - Electricity and gas - Natural gas | 0.79 | 0.04 |
| 4 | Household consumption expenditures - Financial services and insurance - Insurance - Life insurance | 0.76 | 0.05 |
| 5 | Household consumption expenditures - Financial services and insurance - Insurance - Net health insurance - Income loss | 0.76 | 0.05 |
| 6 | Other durable goods - Telephone and facsimile equipment | 0.76 | 0.05 |
| 7 | Other durable goods - Jewelry and watches - Jewelry | 0.75 | 0.05 |
| 8 | Furnishings and durable household equipment - Glassware, tableware, and household utensils - Dishes and flatware | 0.75 | 0.05 |
| 9 | Other nondurable goods - Household supplies - Household linens | 0.75 | 0.06 |
| 10 | Food and beverages purchased for off-premises consumption - Food and nonalcoholic beverages purchased for off-premises consumption - Food purchased for off-premises consumption - Fats and oils | 0.74 | 0.06 |
| 11 | Other nondurable goods - Recreational items - Pets and related products | 0.74 | 0.06 |
| 12 | Household consumption expenditures - Transportation services - Public transportation - Ground transportation - Railway transportation | 0.74 | 0.06 |
| 13 | Food and beverages purchased for off-premises consumption - Food and nonalcoholic beverages purchased for off-premises consumption - Food purchased for off-premises consumption - Milk, dairy products, and eggs - Processed dairy products | 0.74 | 0.07 |
| 14 | Household consumption expenditures - Financial services and insurance - Financial services - Financial services furnished without payment - Commercial banks | 0.73 | 0.08 |
| 15 | Food and beverages purchased for off-premises consumption - Food and nonalcoholic beverages purchased for off-premises consumption - Food purchased for off-premises consumption - Milk, dairy products, and eggs - Eggs | 0.73 | 0.08 |
| 16 | Motor vehicles and parts - Net purchases of used motor vehicles - Used autos - Net transactions in used autos | 0.73 | 0.08 |
| 17 | Other durable goods - Luggage and similar personal items | 0.73 | 0.08 |
| 18 | Food and beverages purchased for off-premises consumption - Food and nonalcoholic beverages purchased for off-premises consumption - Food purchased for off-premises consumption - Fresh fruits and vegetables - Vegetables (fresh) | 0.73 | 0.09 |
| 19 | Household consumption expenditures - Financial services and insurance - Insurance - Net motor vehicle and other transportation insurance | 0.72 | 0.09 |
| 20 | Household consumption expenditures - Transportation services - Public transportation - Air transportation | 0.72 | 0.10 |
| 21 | Other nondurable goods - Tobacco | 0.71 | 0.11 |
| 22 | Household consumption expenditures - Housing and utilities - Household utilities - Electricity and gas - Electricity | 0.70 | 0.12 |
| 23 | Motor vehicles and parts - Net purchases of used motor vehicles - Used autos - Used auto margin | 0.70 | 0.12 |
| 24 | Food and beverages purchased for off-premises consumption - Food and nonalcoholic beverages purchased for off-premises consumption - Food purchased for off-premises consumption - Meats and poultry - Pork | 0.70 | 0.13 |
| 25 | Clothing and footwear - Garments - Children's and infants' clothing | 0.70 | 0.13 |
| 26 | Household consumption expenditures - Other services - Communication | 0.69 | 0.15 |
| 27 | Household consumption expenditures - Professional and other services - Accounting and other business services - Employment agency services | 0.69 | 0.15 |
| 28 | Motor vehicles and parts - Net purchases of used motor vehicles - Used autos - Employee reimbursement | 0.69 | 0.15 |
| 29 | Recreational goods and vehicles - Video, audio, photographic, and information processing equipment and media - Video and audio equipment - Other video equipment | 0.69 | 0.15 |
| 30 | Food and beverages purchased for off-premises consumption - Food and nonalcoholic beverages purchased for off-premises consumption - Food purchased for off-premises consumption - Cereals and bakery products - Cereals | 0.68 | 0.16 |
| 31 | Food and beverages purchased for off-premises consumption - Food and nonalcoholic beverages purchased for off-premises consumption - Food purchased for off-premises consumption - Meats and poultry - Poultry | 0.68 | 0.16 |
| 32 | Receipts from sales of goods and services by nonprofit institutions - Education services to households | 0.68 | 0.15 |
| 33 | Household consumption expenditures - Financial services and insurance - Financial services - Financial service charges, fees, and commissions | 0.67 | 0.18 |
| 34 | Recreational goods and vehicles - Video, audio, photographic, and information processing equipment and media - Video and audio equipment - Audio equipment | 0.67 | 0.18 |
| 35 | Other nondurable goods - Recreational items - Flowers, seeds, and potted plants | 0.67 | 0.18 |
| 36 | Recreational goods and vehicles - Photographic equipment | 0.67 | 0.18 |
| 37 | Food and beverages purchased for off-premises consumption - Food and nonalcoholic beverages purchased for off-premises consumption - Food purchased for off-premises consumption - Food products, not elsewhere classified | 0.66 | 0.19 |
| 38 | Recreational goods and vehicles - Video, audio, photographic, and information processing equipment and media - Video and audio equipment - Televisions | 0.66 | 0.20 |
| 39 | Food and beverages purchased for off-premises consumption - Food and nonalcoholic beverages purchased for off-premises consumption - Food purchased for off-premises consumption - Cereals and bakery products - Bakery products | 0.66 | 0.20 |
| 40 | Household consumption expenditures - Transportation services - Motor vehicle services - Other motor vehicle services | 0.65 | 0.21 |
| 41 | Recreational goods and vehicles - Recreational books | 0.65 | 0.21 |
| 42 | Furnishings and durable household equipment - Furniture and furnishings - Furniture | 0.65 | 0.22 |
| 43 | Other nondurable goods - Household supplies - Household cleaning products | 0.65 | 0.23 |
| 44 | Household consumption expenditures - Transportation services - Public transportation - Ground transportation - Road transportation - Intercity buses | 0.65 | 0.23 |
| 45 | Household consumption expenditures - Housing and utilities - Housing - Rental of tenant-occupied nonfarm housing - Tenant landlord durables | 0.65 | 0.23 |
| 46 | Food and beverages purchased for off-premises consumption - Food and nonalcoholic beverages purchased for off-premises consumption - Food purchased for off-premises consumption - Processed fruits and vegetables | 0.65 | 0.23 |
| 47 | Household consumption expenditures - Recreation services - Other recreational services - Maintenance and repair of recreational vehicles and sports equipment | 0.65 | 0.23 |
| 48 | Household consumption expenditures - Health care - Outpatient services - Paramedical services | 0.64 | 0.26 |
| 49 | Clothing and footwear - Garments - Women's and girls' clothing | 0.64 | 0.27 |
| 50 | Motor vehicle output - Final sales of domestic product - Personal consumption expenditures (PCE) - New motor vehicles - Light trucks (including utility vehicles) | 0.63 | 0.29 |
| 51 | Other durable goods - Educational books | 0.63 | 0.29 |
| 52 | Recreational goods and vehicles - Video, audio, photographic, and information processing equipment and media - Video and audio equipment - Recording media | 0.63 | 0.29 |
| 53 | Household consumption expenditures - Household maintenance - Other household services | 0.63 | 0.30 |
| 54 | Household consumption expenditures - Personal care and clothing services - Personal care services - Miscellaneous personal care services | 0.63 | 0.30 |
| 55 | Food and beverages purchased for off-premises consumption - Alcoholic beverages purchased for off-premises consumption - Spirits | 0.63 | 0.30 |
| 56 | Food and beverages purchased for off-premises consumption - Food and nonalcoholic beverages purchased for off-premises consumption - Food purchased for off-premises consumption - Milk, dairy products, and eggs - Fresh milk | 0.63 | 0.31 |
| 57 | Recreational goods and vehicles - Musical instruments | 0.63 | 0.31 |
| 58 | Gasoline and other energy goods - Motor vehicle fuels, lubricants, and fluids - Lubricants and fluids | 0.63 | 0.31 |
| 59 | Household consumption expenditures - Housing and utilities - Housing - Imputed rental of owner-occupied nonfarm housing - Owner-occupied mobile homes | 0.63 | 0.31 |
| 60 | Other nondurable goods - Personal care products - Electric appliances for personal care | 0.63 | 0.31 |
| 61 | Household consumption expenditures - Recreation services - Gambling - Casino gambling | 0.63 | 0.32 |
| 62 | Receipts from sales of goods and services by nonprofit institutions - Social services to households | 0.63 | 0.31 |
| 63 | Food and beverages purchased for off-premises consumption - Nonalcoholic beverages purchased for off-premises consumption - Coffee, tea, and other beverage materials | 0.63 | 0.31 |
| 64 | Other nondurable goods - Household supplies - Household paper products | 0.63 | 0.32 |
| 65 | Final consumption expenditures of nonprofit institutions serving households (NPISHs) - Gross output of nonprofit institutions - Foundations and grantmaking and giving establishments, gross output | 0.63 | 0.32 |
| 66 | Household consumption expenditures - Personal care and clothing services - Clothing and footwear services - Clothing repair, rental, and alterations | 0.63 | 0.32 |
| 67 | Household consumption expenditures - Housing and utilities - Housing - Group housing | 0.63 | 0.32 |
| 68 | Household consumption expenditures - Housing and utilities - Household utilities - Water supply and sanitation - Garbage and trash collection | 0.63 | 0.32 |
| 69 | Household consumption expenditures - Household maintenance - Repair of household appliances | 0.63 | 0.32 |
| 70 | Furnishings and durable household equipment - Glassware, tableware, and household utensils - Nonelectric cookware and tableware | 0.63 | 0.33 |
| 71 | Household consumption expenditures - Health care - Hospital and nursing home services - Nursing homes - Nonprofit nursing homes' services to households | 0.63 | 0.33 |
| 72 | Household consumption expenditures - Transportation services - Public transportation - Ground transportation - Other road transportation service | 0.63 | 0.33 |
| 73 | Furnishings and durable household equipment - Tools and equipment for house and garden - Outdoor equipment and supplies | 0.63 | 0.33 |
| 74 | Household consumption expenditures - Professional and other services - Funeral and burial services | 0.63 | 0.33 |
| 75 | Household consumption expenditures - Housing and utilities - Housing - Rental of tenant-occupied nonfarm housing - Tenant-occupied stationary homes | 0.62 | 0.36 |
| 76 | Recreational goods and vehicles - Sporting equipment, supplies, guns, and ammunition | 0.62 | 0.37 |
| 77 | Other nondurable goods - Household supplies - Sewing items | 0.62 | 0.37 |
| 78 | Household consumption expenditures - Financial services and insurance - Financial services - Financial services furnished without payment - Pension funds | 0.62 | 0.37 |
| 79 | Recreational goods and vehicles - Information processing equipment | 0.62 | 0.38 |
| 80 | Household consumption expenditures - Social services and religious activities - Foundations and grantmaking and giving services to households | 0.62 | 0.38 |
| 81 | Household consumption expenditures - Social services and religious activities - Religious organizations' services to households | 0.62 | 0.38 |
| 82 | Household consumption expenditures - Health care - Hospital and nursing home services - Nursing homes - Proprietary and government nursing homes | 0.62 | 0.39 |
| 83 | Household consumption expenditures - Household maintenance - Repair of furniture, furnishings, and floor coverings | 0.62 | 0.39 |
| 84 | Receipts from sales of goods and services by nonprofit institutions - Civic and social organizations' services to households | 0.62 | 0.39 |
| 85 | Household consumption expenditures - Recreation services - Other recreational services - Package tours | 0.62 | 0.39 |
| 86 | Recreational goods and vehicles - Sports and recreational vehicles - Motorcycles | 0.62 | 0.39 |
| 87 | Household consumption expenditures - Recreation services - Audio-video, photographic, and information processing equipment services | 0.62 | 0.40 |
| 88 | Recreational goods and vehicles - Sports and recreational vehicles - Pleasure boats, aircraft, and other recreational vehicles - Other recreational vehicles | 0.62 | 0.40 |
| 89 | Household consumption expenditures - Professional and other services - Professional association dues | 0.62 | 0.40 |
| 90 | Household consumption expenditures - Recreation services - Gambling - Lotteries | 0.62 | 0.41 |
| 91 | Other nondurable goods - Pharmaceutical and other medical products - Other medical products | 0.62 | 0.41 |
| 92 | Receipts from sales of goods and services by nonprofit institutions - Recreation services to households | 0.62 | 0.41 |
| 93 | Household consumption expenditures - Recreation services - Membership clubs, sports centers, parks, theaters, and museums - Membership clubs and participant sports centers | 0.62 | 0.41 |
| 94 | Household consumption expenditures - Recreation services - Membership clubs, sports centers, parks, theaters, and museums - Admissions to specified spectator amusements - Spectator sports | 0.62 | 0.41 |
| 95 | Other nondurable goods - Magazines, newspapers, and stationery - Stationery and miscellaneous printed materials | 0.62 | 0.41 |
| 96 | Final consumption expenditures of nonprofit institutions serving households (NPISHs) - Gross output of nonprofit institutions - Social advocacy establishments, gross output | 0.62 | 0.41 |
| 97 | Household consumption expenditures - Housing and utilities - Housing - Rental of tenant-occupied nonfarm housing - Tenant-occupied mobile homes | 0.62 | 0.42 |
| 98 | Receipts from sales of goods and services by nonprofit institutions - Services of social advocacy establishments to households | 0.62 | 0.42 |
| 99 | Household consumption expenditures - Personal care and clothing services - Clothing and footwear services - Laundry and drycleaning services | 0.62 | 0.42 |
| 100 | Receipts from sales of goods and services by nonprofit institutions - Professional advocacy services to households | 0.62 | 0.41 |
| 101 | Household consumption expenditures - Professional and other services - Labor organization dues | 0.62 | 0.41 |
| 102 | Food and beverages purchased for off-premises consumption - Nonalcoholic beverages purchased for off-premises consumption - Mineral waters, soft drinks, and vegetable juices | 0.62 | 0.42 |
| 103 | Household consumption expenditures - Transportation services - Public transportation - Water transportation | 0.62 | 0.42 |
| 104 | Other nondurable goods - Pharmaceutical and other medical products - Pharmaceutical products - Nonprescription drugs | 0.62 | 0.43 |
| 105 | Household consumption expenditures - Household maintenance - Moving, storage, and freight services | 0.62 | 0.43 |
| 106 | Other durable goods - Therapeutic appliances and equipment - Therapeutic medical equipment | 0.62 | 0.43 |
| 107 | Household consumption expenditures - Professional and other services - Accounting and other business services - Other personal business services | 0.62 | 0.43 |
| 108 | Household consumption expenditures - Recreation services - Gambling - Pari-mutuel net receipts | 0.62 | 0.43 |
| 109 | Household consumption expenditures - Food services and accommodations - Food services - Purchased meals and beverages - Alcohol in purchased meals | 0.62 | 0.44 |
| 110 | Household consumption expenditures - Transportation services - Public transportation - Ground transportation - Intracity mass transit | 0.62 | 0.44 |
| 111 | Final consumption expenditures of nonprofit institutions serving households (NPISHs) - Gross output of nonprofit institutions - Religious organizations, gross output | 0.62 | 0.45 |
| 112 | Receipts from sales of goods and services by nonprofit institutions - Religious organizations' services to households | 0.62 | 0.45 |
| 113 | Other nondurable goods - Net expenditures abroad by U.S. residents - Expenditures abroad by U.S. residents - Personal remittances in kind to nonresidents | 0.62 | 0.45 |
| 114 | Receipts from sales of goods and services by nonprofit institutions - Health, gross outputHealth services to households - Nonprofit nursing homes' services to households | 0.62 | 0.44 |
| 115 | Household consumption expenditures - Education services - Nursery, elementary, and secondary schools - Elementary and secondary schools | 0.62 | 0.44 |
| 116 | Household consumption expenditures - Health care - Outpatient services - Physician services | 0.62 | 0.48 |
| 117 | Other nondurable goods - Household supplies - Miscellaneous household products | 0.62 | 0.48 |
| 118 | Food and beverages purchased for off-premises consumption - Food and nonalcoholic beverages purchased for off-premises consumption - Food purchased for off-premises consumption - Meats and poultry - Other meats | 0.62 | 0.48 |
| 119 | Household consumption expenditures - Household maintenance - Domestic services | 0.62 | 0.49 |
| 120 | Other nondurable goods - Pharmaceutical and other medical products - Pharmaceutical products - Prescription drugs | 0.62 | 0.51 |
| 121 | Gasoline and other energy goods - Fuel oil and other fuels - Other fuels | 0.62 | 0.51 |
| 122 | Household consumption expenditures - Net foreign travel - Foreign travel by U.S. residents | 0.62 | 0.52 |
| 123 | Household consumption expenditures - Net foreign travel - Expenditures in the United States by nonresidents | 0.62 | 0.51 |
| 124 | Final consumption expenditures of nonprofit institutions serving households (NPISHs) - Gross output of nonprofit institutions - Civic and social organizations, gross output | 0.62 | 0.51 |
| 125 | Clothing and footwear - Garments - Men's and boys' clothing | 0.62 | 0.52 |
| 126 | Furnishings and durable household equipment - Furniture and furnishings - Carpets and other floor coverings | 0.62 | 0.52 |
| 127 | Household consumption expenditures - Professional and other services - Legal services | 0.61 | 0.53 |
| 128 | Household consumption expenditures - Recreation services - Other recreational services - Veterinary and other services for pets | 0.61 | 0.54 |
| 129 | Household consumption expenditures - Social services and religious activities - Social advocacy and civic and social organizations | 0.61 | 0.54 |
| 130 | Final consumption expenditures of nonprofit institutions serving households (NPISHs) - Gross output of nonprofit institutions - Health, gross output - Nonprofit hospitals, gross output | 0.62 | 0.58 |
| 131 | Food and beverages purchased for off-premises consumption - Food produced and consumed on farms | 0.62 | 0.58 |
| 132 | Food and beverages purchased for off-premises consumption - Alcoholic beverages purchased for off-premises consumption - Wine | 0.62 | 0.58 |
| 133 | Household consumption expenditures - Food services and accommodations - Food services - Food furnished to employees (including military) - Food supplied to military | 0.62 | 0.58 |
| 134 | Recreational goods and vehicles - Sports and recreational vehicles - Pleasure boats, aircraft, and other recreational vehicles - Pleasure boats | 0.62 | 0.58 |
| 135 | Household consumption expenditures - Food services and accommodations - Food services - Purchased meals and beverages - Meals and nonalcoholic beverages - Meals at schools - Higher education school lunches | 0.62 | 0.59 |
| 136 | Household consumption expenditures - Financial services and insurance - Financial services - Financial services furnished without payment - Other depository institutions and regulated investment companies | 0.62 | 0.60 |
| 137 | Food and beverages purchased for off-premises consumption - Food and nonalcoholic beverages purchased for off-premises consumption - Food purchased for off-premises consumption - Fresh fruits and vegetables - Fruit (fresh) | 0.62 | 0.60 |
| 138 | Other nondurable goods - Recreational items - Games, toys, and hobbies | 0.62 | 0.61 |
| 139 | Motor vehicles and parts - Motor vehicle parts and accessories - Tires | 0.62 | 0.61 |
| 140 | Clothing and footwear - Other clothing materials and footwear - Clothing materials | 0.62 | 0.61 |
| 141 | Household consumption expenditures - Food services and accommodations - Accommodations - Hotels and motels | 0.62 | 0.62 |
| 142 | Recreational goods and vehicles - Sports and recreational vehicles - Pleasure boats, aircraft, and other recreational vehicles - Pleasure aircraft | 0.62 | 0.62 |
| 143 | Motor vehicles and parts - Motor vehicle parts and accessories - Accessories and parts | 0.61 | 0.62 |
| 144 | Household consumption expenditures - Housing and utilities - Housing - Rental value of farm dwellings | 0.61 | 0.62 |
| 145 | Final consumption expenditures of nonprofit institutions serving households (NPISHs) - Gross output of nonprofit institutions - Professional advocacy, gross output | 0.62 | 0.63 |
| 146 | Furnishings and durable household equipment - Furniture and furnishings - Clocks, lamps, lighting fixtures, and other household decorative items | 0.62 | 0.63 |
| 147 | Furnishings and durable household equipment - Household appliances - Major household appliances | 0.61 | 0.63 |
| 148 | Household consumption expenditures - Financial services and insurance - Insurance - Net household insurance - Household insurance normal losses | 0.61 | 0.63 |
| 149 | Household consumption expenditures - Recreation services - Membership clubs, sports centers, parks, theaters, and museums - Amusement parks, campgrounds, and related recreational services | 0.62 | 0.64 |
| 150 | Receipts from sales of goods and services by nonprofit institutions - Foundations and grantmaking and giving services to households | 0.62 | 0.64 |
| 151 | Household consumption expenditures - Education services - Nursery, elementary, and secondary schools - Day care and nursery schools | 0.62 | 0.64 |
| 152 | Final consumption expenditures of nonprofit institutions serving households (NPISHs) - Gross output of nonprofit institutions - Health, gross output - Nonprofit nursing homes, gross output | 0.62 | 0.64 |
| 153 | Household consumption expenditures - Transportation services - Motor vehicle services - Motor vehicle maintenance and repair | 0.62 | 0.66 |
| 154 | Receipts from sales of goods and services by nonprofit institutions - Health, gross outputHealth services to households - Outpatient services to households | 0.62 | 0.65 |
| 155 | Final consumption expenditures of nonprofit institutions serving households (NPISHs) - Gross output of nonprofit institutions - Social services, gross output | 0.62 | 0.66 |
| 156 | Food and beverages purchased for off-premises consumption - Food and nonalcoholic beverages purchased for off-premises consumption - Food purchased for off-premises consumption - Meats and poultry - Beef and veal | 0.63 | 0.67 |
| 157 | Other nondurable goods - Personal care products - Hair, dental, shaving, and miscellaneous personal care products except electrical products | 0.63 | 0.67 |
| 158 | Household consumption expenditures - Financial services and insurance - Insurance - Net household insurance - Household insurance premiums and premium supplements | 0.63 | 0.67 |
| 159 | Household consumption expenditures - Personal care and clothing services - Personal care services - Hairdressing salons and personal grooming establishments | 0.63 | 0.68 |
| 160 | Recreational goods and vehicles - Sports and recreational vehicles - Bicycles and accessories | 0.63 | 0.68 |
| 161 | Household consumption expenditures - Housing and utilities - Household utilities - Water supply and sanitation - Water supply and sewage maintenance | 0.63 | 0.69 |
| 162 | Household consumption expenditures - Recreation services - Membership clubs, sports centers, parks, theaters, and museums - Museums and libraries | 0.63 | 0.69 |
| 163 | Household consumption expenditures - Food services and accommodations - Food services - Purchased meals and beverages - Meals and nonalcoholic beverages - Meals at schools - Elementary and secondary school lunches | 0.63 | 0.69 |
| 164 | Household consumption expenditures - Social services and religious activities - Social assistance | 0.64 | 0.70 |
| 165 | Other nondurable goods - Magazines, newspapers, and stationery - Newspapers and periodicals | 0.64 | 0.70 |
| 166 | Household consumption expenditures - Housing and utilities - Housing - Imputed rental of owner-occupied nonfarm housing - Owner-occupied stationary homes | 0.72 | 0.81 |
| 167 | Household consumption expenditures - Financial services and insurance - Insurance - Net health insurance - Medical care and hospitalization | 0.69 | 0.82 |
| 168 | Household consumption expenditures - Transportation services - Public transportation - Ground transportation - Taxicabs | 0.69 | 0.82 |
| 169 | Clothing and footwear - Other clothing materials and footwear - Shoes and other footwear | 0.68 | 0.83 |
| 170 | Motor vehicles and parts - New motor vehicles - New autos - New foreign autos | 0.67 | 0.83 |
| 171 | Food and beverages purchased for off-premises consumption - Food and nonalcoholic beverages purchased for off-premises consumption - Food purchased for off-premises consumption - Sugar and sweets | 0.66 | 0.84 |
| 172 | Furnishings and durable household equipment - Tools and equipment for house and garden - Tools, hardware, and supplies | 0.66 | 0.84 |
| 173 | Household consumption expenditures - Financial services and insurance - Insurance - Net health insurance - Workers' compensation | 0.66 | 0.84 |
| 174 | Food and beverages purchased for off-premises consumption - Alcoholic beverages purchased for off-premises consumption - Beer | 0.65 | 0.85 |
| 175 | Other nondurable goods - Net expenditures abroad by U.S. residents - Expenditures abroad by U.S. residents - Private employees' expenditures abroad | 0.65 | 0.85 |
| 176 | Motor vehicles and parts - New motor vehicles - New autos - New domestic autos | 0.65 | 0.86 |
| 177 | Final consumption expenditures of nonprofit institutions serving households (NPISHs) - Gross output of nonprofit institutions - Health, gross output - Outpatient services, gross output | 0.65 | 0.86 |
| 178 | Household consumption expenditures - Health care - Hospital and nursing home services - Hospitals - Proprietary hospitals | 0.65 | 0.87 |
| 179 | Household consumption expenditures - Personal care and clothing services - Clothing and footwear services - Repair and hire of footwear | 0.65 | 0.87 |
| 180 | Household consumption expenditures - Education services - Commercial and vocational schools | 0.65 | 0.87 |
| 181 | Motor vehicle output - Final sales of domestic product - Personal consumption expenditures (PCE) - Net purchases of used autos and used light trucks - Used light trucks (including utility vehicles) | 0.65 | 0.88 |
| 182 | Furnishings and durable household equipment - Household appliances - Small electric household appliances | 0.65 | 0.88 |
| 183 | Food and beverages purchased for off-premises consumption - Food and nonalcoholic beverages purchased for off-premises consumption - Food purchased for off-premises consumption - Fish and seafood | 0.65 | 0.88 |
| 184 | Household consumption expenditures - Recreation services - Membership clubs, sports centers, parks, theaters, and museums - Admissions to specified spectator amusements - Motion picture theaters | 0.65 | 0.88 |
| 185 | Household consumption expenditures - Food services and accommodations - Food services - Food furnished to employees (including military) - Food supplied to civilians | 0.65 | 0.89 |
| 186 | Other durable goods - Jewelry and watches - Watches | 0.65 | 0.89 |
| 187 | Household consumption expenditures - Education services - Higher education - Nonprofit private higher education services to households | 0.66 | 0.89 |
| 188 | Other nondurable goods - Personal care products - Cosmetic/perfumes/bath/nail preparations and implements | 0.66 | 0.89 |
| 189 | Final consumption expenditures of nonprofit institutions serving households (NPISHs) - Gross output of nonprofit institutions - Education services, gross output | 0.68 | 0.91 |
| 190 | Other nondurable goods - Recreational items - Film and photographic supplies | 0.69 | 0.91 |
| 191 | Household consumption expenditures - Food services and accommodations - Accommodations - Housing at schools | 0.69 | 0.91 |
| 192 | Clothing and footwear - Other clothing materials and footwear - Standard clothing issued to military personnel | 0.69 | 0.91 |
| 193 | Household consumption expenditures - Health care - Outpatient services - Dental services | 0.71 | 0.92 |
| 194 | Household consumption expenditures - Social services and religious activities - Child care | 0.72 | 0.92 |
| 195 | Household consumption expenditures - Education services - Higher education - Proprietary and public higher education | 0.75 | 0.93 |
| 196 | Receipts from sales of goods and services by nonprofit institutions - Health, gross outputHealth services to households - Nonprofit hospitals' services to households | 0.95 | 0.89 |
| 197 | Household consumption expenditures - Health care - Hospital and nursing home services - Hospitals - Government hospitals | 0.88 | 0.90 |
| 198 | Household consumption expenditures - Health care - Hospital and nursing home services - Hospitals - Nonprofit hospitals' services to households | 0.87 | 0.95 |
| 199 | Household consumption expenditures - Recreation services - Membership clubs, sports centers, parks, theaters, and museums - Admissions to specified spectator amusements - Live entertainment, excluding sports | 0.89 | 0.95 |
| 200 | Other durable goods - Therapeutic appliances and equipment - Corrective eyeglasses and contact lenses | 0.91 | 0.95 |
| 201 | Furnishings and durable household equipment - Furniture and furnishings - Window coverings | 0.92 | 0.95 |
| 202 | Final consumption expenditures of nonprofit institutions serving households (NPISHs) - Gross output of nonprofit institutions - Recreation services, gross output | 0.96 | 0.95 |
| 203 | Household consumption expenditures - Professional and other services - Accounting and other business services - Tax preparation and other related services | 0.99 | 0.96 |
| 204 | Other nondurable goods - Net expenditures abroad by U.S. residents - Expenditures abroad by U.S. residents - Government employees' expenditures abroad | 1.03 | 0.96 |
| 205 | Household consumption expenditures - Food services and accommodations - Food services - Purchased meals and beverages - Meals and nonalcoholic beverages - Other purchased meals | 1.00 |