
The Empirical Implications of the Interest-Rate Lower Bound
Keywords: Zero lower bound, DSGE model, Bayesian estimation
Abstract:
Using Bayesian methods, we estimate a nonlinear DSGE model in which the interest-rate lower bound is occasionally binding. We quantify the size and nature of disturbances that pushed the U.S. economy to the lower bound in late 2008 as well as the contribution of the lower bound constraint to the resulting economic slump. Compared with the hypothetical situation in which monetary policy can act in an unconstrained fashion, our estimates imply that U.S. output was more than 1 percent lower, on average, over the 2009-2011 period. Moreover, around 20 percent of the drop in U.S. GDP during the recession of 2008-2009 was due to the interest-rate lower bound. We show that the estimated model generates lower bound episodes that resemble salient characteristics of the observed U.S. episode, including its expected duration.
1 Introduction
The last five years have witnessed a return of near-zero interest rates in many advanced economies. As a result of the recent financial crisis, the United States and other advanced economies joined Japan, experiencing a protracted period in which the lower bound constraint on nominal interest rates became a practical concern for policymakers. At the same time, researchers have been actively developing and applying dynamic stochastic general equilibrium (DSGE) models in order to understand how the economy works and responds to alternative policies under these circumstances.1 Because of the nonlinearity inherently entailed by the lower bound, a more challenging task has been to estimate a model incorporating this constraint. Accordingly, the empirical evidence regarding the role of the lower bound constraint has been limited.
To investigate the importance of this constraint on the macroeconomy, this paper estimates a nonlinear DSGE model in which the interest-rate lower bound is occasionally binding. Although we apply this methodology to the interest-rate lower bound, our approach is more general and could be used in many different contexts, including models with financial constraints. When applied to the interest-rate lower bound, the technique allows us to identify the nature and size of disturbances that pushed the interest rate to the lower bound in the United States in late 2008 and quantify the role of the constraint in exacerbating the resulting economic slump. We also quantify the likelihood of a zero lower bound event and its duration as well as the role that systematic monetary policy plays in affecting its likelihood and duration.
We estimate a nonlinear version of a model widely used in monetary economics and macroeconomics. The model is tractable but rich enough to provide an interpretation of recent economic developments of the U.S. economy. The model's key features include habit persistence in preferences, which helps deliver empirically-realistic dynamics, and price adjustment costs that make firms unwilling to make a complete immediate adjustment of nominal prices. In addition, monetary policy is governed by an interest rate rule that responds to changes in inflation, output growth, and the lagged interest rate; however, that policy is constrained by the lower bound.
Economic fluctuations in the model are driven by three aggregate disturbances: productivity shocks, monetary policy innovations, and--following (Eggertsson & Woodford, 2003) and (Christiano et al., 2011)--a shock to the economy's discount rate. The latter shock can increase an agents propensity to save, reducing current spending and the aggregate price level. We view this shock as standing in for a wide variety of factors that alter households' propensity to save that we do not explicitly model--including, for example, both financial and uncertainty shocks.
In the model, the lower bound constraint is potentially an important factor influencing the stance of monetary policy and hence economic behavior. By constraining the current interest rate, the lower bound may limit the degree of monetary stimulus. However, monetary policy can still be effective in influencing expectations about future output and inflation, thereby affecting the current level of prices and spending. Similarly, the current decisions of households and firms are influenced by the expectation that in future states the constraint may be binding.
Our solution algorithm takes into account the effect that uncertainty about the likelihood that the economy will be at the lower bound has on economic decisions of households and firms. In particular, following (Christiano & Fisher, 2000), the stochastic, nonlinear model is solved using a projection method, after which we estimate the nonlinear model using Bayesian methods.2 With these techniques, draws from the posterior distribution of parameters given the data are typically produced by constructing a Markov chain using the Metropolis-Hastings algorithm. Our nonlinear solution method yields a nonlinear state space system that requires a particle filter to evaluate the likelihood function.3 In the standard implementation of the Metropolis-Hastings algorithm, at each iteration the economic model must be solved and the likelihood function must be evaluated at the vector of proposed parameter values. In the context of our model, these two computationally intensive tasks leave a standard Random-Walk implementation of the Metropolis-Hastings algorithm impractical.
Instead of the standard Random-Walk implementation, we follow (Smith, 2011), who introduces a surrogate into the Metropolis-Hastings algorithm. The idea underlying the procedure in (Smith, 2011) is that different ways of solving an economic model yield different likelihood functions, and one can exploit easy-to-compute likelihood functions to `pre-screen' proposed parameter configurations using some first stage acceptance criteria. This easy-to-compute likelihood function is called a surrogate. Only after the parameters have been accepted in the first step is the nonlinear model solved and the likelihood function evaluated using the particle filter. The algorithm produces draws from the posterior distribution of parameters computed from the nonlinear solution method, but is substantially faster than a standard Random-Walk algorithm. In the present context, the surrogate is constructed by linearizing the equilibrium conditions of the model and using a Kalman filter to evaluate the surrogate likelihood function.
We use this technique to estimate the nonlinear model using U.S. quarterly data on output growth, inflation, and the nominal interest rate from 1983 through 2011. For this sample period, there is a single episode spanning from 2009 until the end of the sample, in which the nominal interest rate is effectively at the lower bound. We examine the model's estimated shocks during this episode and use them to construct empirically relevant initial conditions. This approach allows us to demonstrate how such conditions determine the likelihood and severity of a lower bound event as well as alter the propagation of the economy's shocks.
For the episode in which the interest rate was at the lower bound, a substantial fall in private demand or in the discount rate during the `Great Recession', 2008-2009, was the key force pushing the interest rate to the lower bound. The productivity shock also contributed to the large initial outcome contraction at the end of 2008 and remained low, on average, through 2010.4 However, the large and persistent fall in the discount rate shock was relatively more important in explaining the response of inflation and the nominal interest rate during the episode, while also contributing to the slow growth during this period. In addition, we find that the monetary shocks contributed little to the dynamics of inflation, output, and the nominal interest rate in the course of this episode and were generally small over our entire sample.
Using these estimates of the shocks, a central question we address is how much did the lower bound constrain the ability of monetary policy to stabilize the economy. We answer this question by comparing our estimated model in which the lower bound is imposed to the hypothetical case in which monetary policy can act in an unconstrained manner. In the latter case, the policy rule would have called for a negative nominal interest rate that falls to -4 percent in 2009 and subsequently rises but is still below -1 percent at the end of the sample. This counterfactual experiment implies that U.S. output is about 1 percent lower, on average, from 2009-2011 under the constrained policy rule relative to the hypothetical scenario without the lower bound. In addition, around 20 percent of the drop in U.S. GDP during the Great Recession was due to the interest-rate lower bound.
We examine the estimated model's implications for the probability of hitting the lower bound and the duration of a lower bound spell. While the duration of the U.S. spell at the end of our sample is 12 quarters, expectations of the duration at the beginning of this spell based on financial market data and private sector forecasts were much shorter. Most financial market participants and private sector forecasters anticipated a lower-bound spell of only 3 or 4 quarters in the first quarter of 2009 when the spell had just began. We find that our model is largely in line with these private sector expectations, as the median model forecast in the first quarter of 2009 is that the lower-bound spell lasts for four quarters. Thus, both from the perspective of the model and private sector forecasts, the protracted length of the U.S. lower bound spell was largely unanticipated. Though a spell of 12 quarters or longer occurs relatively infrequently in the model, we show that these long-lasting spells in the model generate outcomes for interest rates, inflation, and output resembling the movements of their empirical counterparts.
Our paper is closely related to other work that has estimated models to quantify the effects of the interest-rate lower bound. One approach has been to estimate a linearized DSGE model without the constraint and then interpret the residuals from the monetary policy rule as reflecting the effect of the constraint (e.g., (Ireland, 2011)). Such evidence is at best indirect, because these innovations reflect other factors. More importantly, this approach omits how the lower bound systematically changes monetary policy and thus the behavior of economic agents--a key aspect at the heart of our analysis.
Another approach is to estimate a linear model over a sample period in which the constraint does not bind and uses those estimates to simulate a nonlinear version of the model that imposes the constraint.5 Our estimation routine extracts information contained in the posterior of the linearized model without assuming that it is identical to the posterior distribution of the fully nonlinear model. In fact, our results suggest that there are important differences between these two posteriors. Moreover, linearizing the model and estimating it on a non binding subsample precludes estimating the shocks that occurred over the lower bound episode and using them to quantify the economic effects of the constraint, a central feature of our analysis.
In a recent paper, (Aruoba & Schorfheide, 2012) examine the disturbances that took the economy to the lower bound in a New Keynesian model and find that a sunspot shock is important to account for economic behavior at the lower bound. Our model differs from theirs along a number of dimensions including the types of shocks, preferences, and the monetary policy rule. Without a sunspot shock, our model can account for most of the observed fall in output and inflation while also generating an expected duration for the lower bound spell consistent with both financial market and survey data. In addition, the authors focus on evaluating alternative policy interventions at the lower bound instead of using the model to quantify the lower bound's role in exacerbating the Great Recession, a central question that we address.
The rest of the paper proceeds as follows. The next section presents the macroeconomic model that we estimate, while section 3 discusses how the model is solved and estimated. The next three sections present the model's results. Section 4 discusses the model's parameter estimates and impulse responses as well as assesses the model's fit. Section 5 examines the observed lower bound episode in detail, describing the estimated shocks that took the economy to the lower bound and quantifying the contribution of the lower bound to the Great Recession. The results regarding the model's implications for the probability and duration of lower bound events are presented in Section 6. Section 7 presents some conclusions. The technical details associated with both the solution and the estimation of the model are presented in an appendix.
2 The Model
The economy consists of a continuum of households, a continuum of firms producing differentiated intermediate goods, a perfectly competitive final goods firm, and a central bank in charge of monetary policy. We now lay out the objectives and constraints of the different agents.
2.1 Households
There is a representative household choosing consumption ![]() , a one period nominal bond,
, a one period nominal bond, ![]() , and labor services,
, and labor services, ![]() , that are supplied to the firm. The household seeks to maximize:
, that are supplied to the firm. The household seeks to maximize:
![\displaystyle E_{t}\sum_{t=1}^{\infty }\delta_{t-1}\left( \log \left[ C_{t}-\gamma C_{t-1}^{a}\right] -H_{t}\right)](img8.gif)
subject to the sequence of budget constraints,
Household nominal expenditures on consumption at date ![]() are given by
are given by
![]() , where
, where ![]() denotes the aggregate price level. A household also
purchases
denotes the aggregate price level. A household also
purchases ![]() units of the nominal bonds at the price
units of the nominal bonds at the price ![]() , where
, where ![]() denotes the gross nominal return on these bonds. The nominal bonds purchased by a household pay one unit of the numéraire next period with certainty. A household receives income from any
bonds carried over from last period in addition to its labor income,
denotes the gross nominal return on these bonds. The nominal bonds purchased by a household pay one unit of the numéraire next period with certainty. A household receives income from any
bonds carried over from last period in addition to its labor income,
![]() , from supplying its services to the economy's firms. A household also receives dividends,
, from supplying its services to the economy's firms. A household also receives dividends, ![]() , as an owner of the economy's firms and collects any lump-sum transfers,
, as an owner of the economy's firms and collects any lump-sum transfers, ![]() .
.
A feature of household preferences as specified in equation (1) are that they are intertemporally non-separable.
![]() represents previous period aggregate consumption that the household takes as given, and the parameter
represents previous period aggregate consumption that the household takes as given, and the parameter
![]() captures the importance of these external habits. Habit persistence, as discussed in (Christiano et al., 2005) and (Smets &
Wouters, 2007), allows for hump-shaped output dynamics in response to shocks, improving the model's empirical fit. The linear specification for labor services in equation (1) along with a competitive labor market implies that there is a perfectly elastic supply of
labor available to the economy's firms.
captures the importance of these external habits. Habit persistence, as discussed in (Christiano et al., 2005) and (Smets &
Wouters, 2007), allows for hump-shaped output dynamics in response to shocks, improving the model's empirical fit. The linear specification for labor services in equation (1) along with a competitive labor market implies that there is a perfectly elastic supply of
labor available to the economy's firms.
We follow (Eggertsson & Woodford, 2003) and (Christiano et al., 2011) in allowing for a shock to the discount rate. The discount factor at time ![]() is given by
is given by ![]() =
=
 where
where
![]() . Hence,
. Hence,
![]() , and
, and
![]() is a shock to the discount rate or the natural rate of interest that alters the weight of the future utility at time
is a shock to the discount rate or the natural rate of interest that alters the weight of the future utility at time ![]() in relation to the period utility at time
in relation to the period utility at time ![]() . The discount rate shock follows an AR(1) process:
. The discount rate shock follows an AR(1) process:
where
The first order conditions for bonds, consumption and labor can be written as follows:
where
2.2 Firms
There are a continuum of monopolistically competitive firms producing differentiated intermediate goods. The latter are used as inputs by a (perfectly competitive) firm producing a single final good. The final good is produced by a representative, perfectly competitive firm with a constant
returns technology,
 , where
 ![]() is the quantity of intermediate good
is the quantity of intermediate good ![]() used as an input, and
used as an input, and
![]() is the constant elasticity of substitution. Profit maximization, taking as given the final goods price
is the constant elasticity of substitution. Profit maximization, taking as given the final goods price ![]() and the prices for the intermediate goods
and the prices for the intermediate goods ![]() , for all
, for all
![]() , yields the set of demand schedules,
, yields the set of demand schedules,
 . Finally, the zero profit condition yields the price index:
 .
.
The production function for intermediate good ![]() is given by:
is given by:
where
where
Since intermediate goods substitute imperfectly for one another, the representative intermediate goods-producing firm sells its output in a monopolistically competitive market. During period ![]() , the firm sets its nominal price
, the firm sets its nominal price ![]() , subject to the requirement that it satisfies the demand of the representative final goods producer at that price. Following
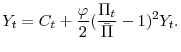
(Rotemberg, 1982), the intermediate good producer faces a quadratic cost of adjusting its nominal price between periods, measured in terms of the finished good and given by:
, subject to the requirement that it satisfies the demand of the representative final goods producer at that price. Following
(Rotemberg, 1982), the intermediate good producer faces a quadratic cost of adjusting its nominal price between periods, measured in terms of the finished good and given by:
![\frac{\varphi }{2}\left[\frac{P_{t}(j)}{\bar{\Pi} P_{t-1}(j)}-1\right] ^{2}Y_{t}](img54.gif) , where
, where ![]() governs the obstacles to price adjustment and
governs the obstacles to price adjustment and ![]() is the central bank's inflation target. The cost of price adjustment makes the problem of the intermediate good
producer dynamic; that is, it chooses
is the central bank's inflation target. The cost of price adjustment makes the problem of the intermediate good
producer dynamic; that is, it chooses ![]() to maximize its present discounted value of expected profits:
to maximize its present discounted value of expected profits:
![\displaystyle E_{0}\sum_{t=1}^{\infty }\delta_{t-1}\Lambda _{t}[\left( \frac{P_{t}(j)}{P_{t}}\right) ^{1-\varepsilon }Y_{t}-\left( \frac{P_{t}(j)}{P_{t}}\right) ^{-\varepsilon }w_{t}Y_{t}-\frac{\varphi }{2}\left[\frac{P_{t}(j)}{\bar{\Pi} P_{t-1}(j)}-1\right] ^{2}Y_{t}],](img57.gif) |
where
![\displaystyle (1-\varepsilon )\left( \frac{P_{t}(j)}{P_{t}}\right) ^{-\varepsilon }+\varepsilon \left( \frac{P_{t}(j)}{P_{t}}\right) ^{-\varepsilon -1}w_{t}-\varphi \left[ \frac{P_{t}(j)}{\bar{\Pi} P_{t-1}(j)}-1\right] \frac{P_{t}(j)}{ \Pi P_{t-1}(j)}](img60.gif)
![\displaystyle +\varphi \frac{\beta}{\eta_{t}}E_{t}\left\{ \frac{\Lambda _{t+1}}{\Lambda _{t}} \left[ \frac{P_{t+1}(j)}{\bar{\Pi} P_{t}(j)}-1\right] \frac{P_{t+1}(j)}{\bar{\Pi} P_{t}(j)}\frac{P_{t}}{P_{t}(j)}\frac{Y_{t+1}}{Y_{t}}\right\} =0.](img61.gif)
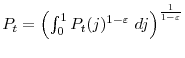
2.3 Monetary Policy
The central bank is assumed to set the nominal interest rate ![]() each period according to an interest rate rule:
each period according to an interest rate rule:
where,
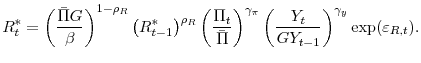
In the above,
2.4 Market Clearing and Aggregate Equilibrium
In symmetric equilibrium, all intermediate goods producing firms make the same decisions so that aggregate output satisfies
![]() and aggregate labor satisfies
and aggregate labor satisfies
![]()
![]() . It then follows that
. It then follows that
![]() and goods market clearing can be written in aggregate terms as:
and goods market clearing can be written in aggregate terms as:
Households trade the nominal bond amongst themselves so that bond market clearing implies
The random walk in the technology shock, expression (7), implies that some of the variables will inherit a unit root. As a result, it is convenient to define stationary representations of output, consumption, and the marginal utility of consumption as follows:
![]() ,
,
![]() , and
, and
![]() Rewriting the equilibrium conditions from households and firms as well as the goods market clearing condition in terms of the scaled variables
yields:
Rewriting the equilibrium conditions from households and firms as well as the goods market clearing condition in terms of the scaled variables
yields:

![\displaystyle \frac{\varphi \beta} {\eta_{t}} E_{t}\left\{ \frac{\tilde{\lambda}_{t+1}}{\tilde{\lambda}_{t}} (\frac{\Pi _{t+1}}{\bar{\Pi} }-1)\frac{\Pi _{t+1}}{\bar{\Pi} }\frac{\tilde{Y}_{t+1}}{\tilde{Y}_{t}}\right\} + (\epsilon-1 ) \left[ \frac{\epsilon}{\epsilon-1} \frac{1}{\tilde{\lambda}_{t}} - 1 \right],](img88.gif)
where
![\tilde{\lambda}_{t} = \left[ \tilde{C}_{t}-\widetilde{\gamma }\tilde{C}_{t-1}\exp (-\varepsilon_{Z,t}) \right]^{-1}](img89.gif) and
and
3 Solution and Econometric Inference
Using the resource constraint to substitute out consumption, the model can be rewritten so that it has three endogenous state variables (
![]() ,
, ![]() , and
, and ![]() ) and three exogenous ones (
) and three exogenous ones (![]() ,
,
![]() , and
, and
![]() ). The model is solved for a stationary solution (i.e., minimal rank solution) so that the model's decision rules can be written as:
). The model is solved for a stationary solution (i.e., minimal rank solution) so that the model's decision rules can be written as:
![]() , where
, where
![]() and
and
![]() .8
.8
The model is solved using a projection method. As discussed in the appendix, the shock processes are approximated following (Rouwenhorst, 1995) and (Kopecky & Suen, 2010), who show that the (Rouwenhorst, 1995) method can match the
conditional and unconditional mean and variance, and the first-order autocorrelation of any AR(1) process. The (Rouwenhorst, 1995) method is combined with approximating functions underlying the model's decision rule with Chebychev polynomials and using collocation to determine
the polynomial's coefficients. As discussed in the appendix, we do not approximate
![]() directly with Chebychev polynomials, because these functions have a kink associated with the the interest-rate lower bound. Instead, we build on the ideas in
(Christiano & Fisher, 2000) and approximate functions that are smoother and thus easier to approximate numerically while still allowing for a closed-form mapping into
directly with Chebychev polynomials, because these functions have a kink associated with the the interest-rate lower bound. Instead, we build on the ideas in
(Christiano & Fisher, 2000) and approximate functions that are smoother and thus easier to approximate numerically while still allowing for a closed-form mapping into
![]() .
.
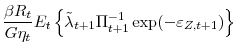
Because we are estimating the model, it might be tempting to use a computationally-efficient solution algorithm that respects the nonlinearity in the Taylor rule but log-linearizes the remaining equilibrium conditions. This approach has been used by (Christiano et al., 2011) and (Erceg & Lindé, 2012) among others. Unfortunately, we find that this approach performs poorly when applied to our model.9 As shown in the appendix, this solution algorithm can produce large quantitative differences in results from those arising from our approach along with relatively large Euler errors for empirically-realistic initial conditions. Accordingly, we choose to work with a projection method building on the insights of (Christiano & Fisher, 2000), which is more accurate and still computationally efficient enough to use for estimation purposes. Another attractive feature of our projection method is that it takes into account the uncertainty about the likelihood that the economy will be at the lower bound in the economic decisions of households and firms.
We estimate the model using Bayesian methods. To do so we build on (Fernandez-Villaverde & Rubio-Ramirez, 2007), who first proposed using a particle filter within a Metropolis-Hastings algorithm to estimate nonlinear DSGE models.10 Because this approach is computationally burdensome, we follow the methodology developed in (Smith, 2011), who avoids having to compute the nonlinear model's likelihood function at every iteration of the Metropolis-Hastings algorithm through the use of a surrogate. This surrogate guides our sampling algorithm targeting the posterior distribution of the nonlinear model.
In this section we briefly outline the estimation procedure, and refer the reader to the technical appendix for details. After solving for the decision rule,
![]() , our economic environment can be represented as a nonlinear state space model, where
, our economic environment can be represented as a nonlinear state space model, where
In the above,
Our goal is to draw from the posterior distribution of parameters given the data
![]() , where
, where
![]() is the likelihood function and
is the likelihood function and
![]() is a prior distribution of the parameters. We compute
is a prior distribution of the parameters. We compute
![]() using a particle filter (let
using a particle filter (let ![]() denote a
pdf that has been approximated by a particle filter) and embed it in a Metropolis-Hastings algorithm to draw from the posterior distribution of parameters. In light of the computational complexity involved in evaluating the policy functions and the likelihood function associated with the particle
filter, we use a surrogate to aid in sampling from this distribution.
denote a
pdf that has been approximated by a particle filter) and embed it in a Metropolis-Hastings algorithm to draw from the posterior distribution of parameters. In light of the computational complexity involved in evaluating the policy functions and the likelihood function associated with the particle
filter, we use a surrogate to aid in sampling from this distribution.
This surrogate requires the existence of some approximation to the posterior distribution,
![]() that can be evaluated quickly. We can use this approximation to pre-screen proposed parameter combinations in an otherwise standard
Metropolis-Hastings algorithm. Let
that can be evaluated quickly. We can use this approximation to pre-screen proposed parameter combinations in an otherwise standard
Metropolis-Hastings algorithm. Let
![]() be a proposal distribution with density
be a proposal distribution with density
![]() , the algorithm is described in the following box.
, the algorithm is described in the following box.
This algorithm produces a Markov chain whose invariant distribution is
![]() . The use of a surrogate allows us to avoid the expensive solution algorithm and particle filter evaluation at proposed parameter configurations
. The use of a surrogate allows us to avoid the expensive solution algorithm and particle filter evaluation at proposed parameter configurations
![]() that are not likely to be accepted. We choose as our surrogate,
that are not likely to be accepted. We choose as our surrogate,
![]() a tempered posterior distribution created from log-linearizing our model. The linearized surrogate was chosen since the lower bound only binds for
the last few years of our sample, so the resulting surrogate posterior (constructed from the linearized solution of the model) should be somewhat close to our posterior of interest (constructed from our nonlinear solution method). A second `accept/reject' step corrects for the difference in these
two distributions. We defer to the appendix many of the implementation details regarding the algorithm and the use of the particle filter to evaluate the likelihood function. Also, see (Smith, 2011) for a further discussion of this method.
a tempered posterior distribution created from log-linearizing our model. The linearized surrogate was chosen since the lower bound only binds for
the last few years of our sample, so the resulting surrogate posterior (constructed from the linearized solution of the model) should be somewhat close to our posterior of interest (constructed from our nonlinear solution method). A second `accept/reject' step corrects for the difference in these
two distributions. We defer to the appendix many of the implementation details regarding the algorithm and the use of the particle filter to evaluate the likelihood function. Also, see (Smith, 2011) for a further discussion of this method.
4.1 Parameter Estimates
We estimate the model using U.S. data on output growth (
![]() ), inflation (
), inflation (![]() ) and nominal interest rates (
) and nominal interest rates (![]() ) from 1983:Q1 through 2011:Q4. The focus on this sample helps abstract from changes in monetary policy regimes other than the lower bound episode at the end of the sample.12 The data for the three-month T-bill rate and other series are all publicly available from the Federal Reserve Bank of St. Louis' FRED database.
) from 1983:Q1 through 2011:Q4. The focus on this sample helps abstract from changes in monetary policy regimes other than the lower bound episode at the end of the sample.12 The data for the three-month T-bill rate and other series are all publicly available from the Federal Reserve Bank of St. Louis' FRED database.
The last three rows of Table 1 show the prior distributions of the structural parameters. These distributions are assumed to be independent across parameters, and their specification are based upon existing research. We do not estimate the average discount factor,
![]() , which is set equal to 0.9987 and the elasticity of demand,
, which is set equal to 0.9987 and the elasticity of demand, ![]() , which is fixed at 6.
, which is fixed at 6.
Columns two to four of Table 1 present the mean, standard deviation, and the 95 percent credible intervals from the posterior distributions of the parameters. The mean estimate of ![]() , is similar to our prior but the 95 percent credible interval--covering values between 0.35 to 0.59--is considerably tighter. To get a sense of how this estimate affects the dynamics of the model, it is useful to consider its interpretation from the linearized versions of
equations (12)-(14), which are shown in the appendix. In the linearized version of the consumption Euler equation,
, is similar to our prior but the 95 percent credible interval--covering values between 0.35 to 0.59--is considerably tighter. To get a sense of how this estimate affects the dynamics of the model, it is useful to consider its interpretation from the linearized versions of
equations (12)-(14), which are shown in the appendix. In the linearized version of the consumption Euler equation,
![]() implies that current output depends on lag-output with a coefficient of around
1/3 and on one-quarter expected future output with a coefficient of about
2/3, which is in line with the estimates of (Smets & Wouters, 2007) and (Ireland, 2011). In the linear version of the model,
implies that current output depends on lag-output with a coefficient of around
1/3 and on one-quarter expected future output with a coefficient of about
2/3, which is in line with the estimates of (Smets & Wouters, 2007) and (Ireland, 2011). In the linear version of the model,
![]() also governs the interest-rate elasticity of demand,
also governs the interest-rate elasticity of demand,
![]() , whose mean value is slightly higher than
1/3.
, whose mean value is slightly higher than
1/3.
The posterior mean of the price adjustment cost parameter, ![]() , is very close to 95, which implies a linearized slope coefficient for the New Keynesian Phillips curve of 0.052. Comparing the linearized version of our New Keynesian Phillip curve with one with Calvo-Yun staggered-price setting, this estimate implies that firms change their price on average slightly
more frequently than once a year. Accordingly, the mean estimate is in line with the microeconomic evidence on the frequency of price adjustment presented in (Klenow & Malin, 2011).
, is very close to 95, which implies a linearized slope coefficient for the New Keynesian Phillips curve of 0.052. Comparing the linearized version of our New Keynesian Phillip curve with one with Calvo-Yun staggered-price setting, this estimate implies that firms change their price on average slightly
more frequently than once a year. Accordingly, the mean estimate is in line with the microeconomic evidence on the frequency of price adjustment presented in (Klenow & Malin, 2011).
Our estimates imply considerable interest-rate smoothing, as embodied by the lagged coefficient in the rule, whose posterior mean is about 0.85. There is a significant, short-run interest-rate response to output growth, as the posterior mean of the coefficient ![]() is close to 0.25. The long-run response,
is close to 0.25. The long-run response,
![]() , is 1.77, which is in line with recent estimates by (Aruoba et al., 2012) and (Ireland, 2011). The estimate of the posterior mean of the short-run reaction of the policy rate to deviations of inflation from the target level,
, is 1.77, which is in line with recent estimates by (Aruoba et al., 2012) and (Ireland, 2011). The estimate of the posterior mean of the short-run reaction of the policy rate to deviations of inflation from the target level,
![]() , equals 0.79, which implies that the posterior mean of the long-run response,
, equals 0.79, which implies that the posterior mean of the long-run response,
![]() is about 5. This value is higher than estimates derived
from DSGE models using Bayesian techniques, as our priors cover a wider range of permissible values than typically used. Still, the 95 percent credible interval for the long-run response of the policy rate to inflation deviations includes values as low as 2.5, which is more in line with these
earlier estimates.
is about 5. This value is higher than estimates derived
from DSGE models using Bayesian techniques, as our priors cover a wider range of permissible values than typically used. Still, the 95 percent credible interval for the long-run response of the policy rate to inflation deviations includes values as low as 2.5, which is more in line with these
earlier estimates.
The estimate of the inflation target and technological growth rate are about 2.6 percent and 1.65 percent, respectively, on an annualized basis. The estimate for the inflation target is higher than the Federal Reserve's current target, reflecting that the average inflation rate for our sample
period is close to 2.5 percent. There is substantial persistence in the discount rate shock, as
![]() , and the standard deviation of innovations in technology are about six times larger than innovations in monetary policy.
, and the standard deviation of innovations in technology are about six times larger than innovations in monetary policy.
The last three columns of Table 1 display the estimates for the measurement errors of the three observable variables. The posterior estimate of the standard deviation of the measurement error for the interest rate is low relative to the standard deviation of the measurement error either for output or inflation.
4.2 Time Series Properties of the Model
Figure 1 compares the observed data on output growth, inflation, and the nominal interest rate with the smoothed estimates produced by the model. The figure also shows the 68 percent credible interval around these values.13
As shown in the top-left panel of the figure, the model is able to account for output growth well throughout the sample including the lower-bound period. In particular, the model produces the dramatic contraction in output growth that occurred in early 2009 as well as the subsequent rebound in growth. The model captures most of the low and medium frequency variation in quarterly inflation, displayed in the top-right panel, though some of the high-frequency movements remain unexplained. For the recent recession, the model accounts for a substantial part of the fall and subsequent increase in inflation that occurred during that episode.14
The lower-left panel shows that the smoothed values for the nominal interest rate are close to the observed values and the lower-right panel displays the central bank's notional or desired path for the nominal interest rate, which provides a measure of the severity of the lower-bound constraint on actual monetary policy. From 2009 onwards, the notional interest rate is well below zero, falling to minus 4 percent in the first half of 2009 and remaining well below zero until the end of our sample in 2011:Q4. Thus, our estimate of the notional rate suggests that the lower bound was an important factor contributing to the depth of the last recession. Later, in Section 5, we use the model to quantify the loss in output associated with this constraint.
Table 2 compares a variety of moments produced by the model to their empirical counterparts. The predictions of the model for the unconditional means and standard deviations of output growth and inflation are broadly consistent with the data. The model tends to understate the volatility of the nominal interest rate though the standard deviation of the observed interest rate remains near the upper limit of the model's 95 percent credible interval.15
Table 2 also displays the autocorrelation for each of these three series. Output growth has an autocorrelation of nearly 0.5 over the sample period, which is just a bit above the model's mean estimate. The autocorrelation of the observed nominal interest rate is only slightly higher than in the model, and the model is able to generate enough inflation persistence, even though its Phillips curve does not include lagged inflation term. The model's success on these dimensions largely reflects the inclusion of habit persistence and the lagged interest rate in the policy rule. Notably, the presence of habits implies that the nonlinear Phillips curve depends on not only contemporaneous output but also lagged output, which helps generate persistent movements in inflation.16
The model is reasonably successful in accounting for the cross-correlations of the three variables. As in the data, the model generates positive correlations between the interest rate and inflation and the interest rate and output growth. The average correlation between output growth and inflation is about -0.3 in the model compared with essentially zero in the data. However, the 95 percent credible interval around this correlation is relatively large, encompassing slightly positive correlations.
4.3 The Propagation of Shocks at the Lower Bound
Before examining the shocks that drove the economy to their lower bound in late 2008, it is useful to first examine the effects of the two principal sources of fluctuations in the model: the productivity and discount rate shocks. Because the model is nonlinear, the effects of these shocks depend on the economy's initial conditions, including the initial state for the exogenous shocks. To illustrate how the lower bound affects the propagation of these shocks, we consider two different sets of initial conditions: one in which the economy is far from a binding lower bound and another in which the constraint is binding. Although previous researchers have illustrated the effects of shocks at the lower bound by varying the initial conditions as we do here, they typically make assumptions about the initial state including the magnitudes of the shocks that put the interest rate at the lower bound. Instead, having estimated the model's state including the shocks at each date, we are able to base the initial conditions for our impulse responses on empirically-realistic magnitudes for the shocks.
Figure 2 illustrates how the agents in the model expect the economy to evolve starting from two different initial conditions. In the first, the three lagged endogenous variables (
![]() ,
, ![]() ,
,
![]() ) and the three exogenous shock values (
) and the three exogenous shock values (![]() ,
,
![]() ,
,
![]() ) are set equal to their 2006:Q1 estimated values, which corresponds to an initial state in which output growth, inflation, and the nominal interest rate are relatively
close to their unconditional means. In the simulation of this path, agents are assumed to know the initial state with certainty; subsequently, however, the shocks that hit the economy are uncertain and the figure plots the median path for each variable. For the path associated with the 2006:Q1
initial conditions (the dark solid line), the nominal interest rate is just above four percent and gradually rises up toward the steady state. Inflation at 3.5 percent initially is a bit high but in less than 2 years is close to the 2.5 percent target of the central bank. Output growth is somewhat
higher than trend initially and then declines before returning to its unconditional mean growth rate.
) are set equal to their 2006:Q1 estimated values, which corresponds to an initial state in which output growth, inflation, and the nominal interest rate are relatively
close to their unconditional means. In the simulation of this path, agents are assumed to know the initial state with certainty; subsequently, however, the shocks that hit the economy are uncertain and the figure plots the median path for each variable. For the path associated with the 2006:Q1
initial conditions (the dark solid line), the nominal interest rate is just above four percent and gradually rises up toward the steady state. Inflation at 3.5 percent initially is a bit high but in less than 2 years is close to the 2.5 percent target of the central bank. Output growth is somewhat
higher than trend initially and then declines before returning to its unconditional mean growth rate.
The initial conditions of the economy are quite different in 2009:Q2. The lower right panel shows that the discount rate shock is about 1.5 percentage points below its mean zero level. The nominal interest rate is at the lower bound initially and its median value is expected to remain there for five quarters. Subsequently, the median path of the nominal interest rises but remains relatively low at the end of the simulation. Output growth is negative initially but is expected to rebound and turn positive after a couple of quarters. Inflation is around 1 percent initially and then gradually rises back to target.
A feature of the nonlinear model is that the response of inflation to marginal cost taking as given the expectation of future variables is non-constant; this effect is disregarded using the log-linearized equilibrium conditions. As shown in the bottom right panel of Figure 2, the slope of the Phillips curve is relatively low in 2009:Q1 when output is low as a result of the reduction in the discount rate. Because this shock reduces household demand, firms have less incentive to bear the cost of adjusting prices in the model and hence inflation becomes less responsive to changes in demand.
These different initial conditions can dramatically affect the propagation of the discount rate shock. The top panels of Figure 3 shows the effect of an unexpected increase in the discount rate in period 1 for the two different initial conditions. For each of
variable shown in a panel of the figure, we report the median response relative to the baseline path illustrated in Figure 2 in which there is no unanticipated increase in the discount rate in period 1. For the shocked path, the discount rate is assumed to rise 35
quarterly basis points above baseline in period 1. Agents in the model then expected the shock to gradually revert back to baseline according to its estimated autocorrelation (i.e, the posterior mean of
![]() is 0.88). A positive discount rate shock, irrespective of whether it
occurs in 2006:Q1 or 2009:Q2, stimulates current demand by the private sector at the expense of future spending, and as shown in the figure, this higher demand in turn translates into an increase in output and inflation.
is 0.88). A positive discount rate shock, irrespective of whether it
occurs in 2006:Q1 or 2009:Q2, stimulates current demand by the private sector at the expense of future spending, and as shown in the figure, this higher demand in turn translates into an increase in output and inflation.
If such a shock occurred in 2006:Q1, monetary policy is not constrained by the lower bound and reacts by raising the nominal interest rate more than one-for-one with the increase in inflation. Accordingly, the real interest rate (not shown) also rises, which has the effect of restraining the rise in output and inflation, helping the economy gradually return back to baseline. If such a shock occurred from 2009:Q2 onward, when the nominal interest rate is at the lower bound, the effects of the shock on output and inflation are substantially magnified.17With monetary policy constrained by the lower bound, monetary policy is no longer as effective in offsetting the expansionary effects of the shock, therefore generating a larger increase in inflationary expectations and a lower real interest rate than in the scenario with more favorable initial conditions. Output rises about 1 percent above baseline, and inflation increases 1.3 percentage points, compared to 0.4 percent and 0.4 percentage point above baseline, respectively, in the scenario with more favorable initial conditions.
Although monetary policy is less effective in the scenario with unfavorable initial conditions, the estimated policy rule, by responding to the lagged notional rate, has the attractive property of offsetting the current expansion in demand by promising to raise future interest rates earlier and more than in the baseline. Accordingly, the median path of the nominal interest rate is at the lower bound for five quarters in the unshocked baseline, but only three quarters in the scenario with the increase in the discount rate. Subsequently, the median path of nominal interest rate rises sharply before gradually declining back to baseline.
Figure 3 demonstrates that the lower bound constraint can significantly affect the propagation of the discount rate shock. For the productivity shock, shown in the bottom four panels of Figure 3, this constraint also alters the dynamics of output and inflation, though less dramatically. As shown in the lower-left panel, an unanticipated increase in productivity increases the level of output about 1 percent above the baseline after 12 quarters regardless of the economy's initial conditions. Starting from the initial conditions in 2006:Q1, the increase in productivity initially boosts output 0.3 percent above baseline after which it monotonically rises towards its new higher level. Inflation drops about 30 basis points below baseline on impact and subsequently rises back toward its baseline value (of about 2.5 percent). Even with the favorable initial conditions, the nominal interest rate does not change much relative to baseline, as the drop in inflation and increase in output growth have largely offsetting effects. In particular, the estimated rule calls for only a small interest rate hike to counteract the large and persistent increase in output growth generated by the productivity shock.
With the desired interest rate not changing much when monetary policy is far from the lower bound constraint, imposing this constraint only has modest effects on output and inflation dynamics. When the economy starts from the unfavorable 2009:Q2 initial conditions, there is a larger increase in output and smaller decline in inflation than in the case with more favorable initial conditions. This amplification of the productivity shock on output reflects the gradual nature of the move to a tight monetary policy when the economy initially is at the lower bound.
5 What Accounts for the Great Recession?
The above impulse responses illustrate how the two main shocks in our analysis are propagated both in the region away from and close to or at the lower bound. This section builds on this analysis to examine the role of the estimated shocks in explaining the dynamics of output, inflation, and the nominal interest rate. We are particularly interested in understanding the role of these shocks in accounting for the economic slump associated with the 2007-2009 recession as well as for the interest rate's long spell at the lower bound. Finally, we also use the estimated model to evaluate the contribution of the lower bound constraint to the most recent economic slump.
5.1 The Path of the Estimated Shocks
Figure 5 displays the smoothed estimates of the three shocks in the model: the discount rate, productivity, and the monetary policy shock. The shocks to the discount rate (![]() ) tend to be high at the beginning of the sample, stabilize around their zero mean during most of the nineties--followed by a rise just before 2000 then a sharp fall before gradually reverting toward zero by 2006. As shown in the inner figure of the top panel, the discount rate
shock then experiences a striking decline after 2006, reaching a through around 2008:Q4 before gradually moving back up toward the end of the sample. Still, at the end of the sample, the shock implies that in 2011:Q4 the discount rate is more than 1 quarterly percentage point below its zero
mean.
) tend to be high at the beginning of the sample, stabilize around their zero mean during most of the nineties--followed by a rise just before 2000 then a sharp fall before gradually reverting toward zero by 2006. As shown in the inner figure of the top panel, the discount rate
shock then experiences a striking decline after 2006, reaching a through around 2008:Q4 before gradually moving back up toward the end of the sample. Still, at the end of the sample, the shock implies that in 2011:Q4 the discount rate is more than 1 quarterly percentage point below its zero
mean.
The estimated innovations to productivity (
![]() ) are depicted in the middle panel of Figure 5. Changes in productivity do not display much serial correlation over the sample period; however, the
estimates imply that productivity was relatively low during the beginning of the Great Recession, suggesting that it may have contributed to the large, initial output contraction at the end of 2008. In 2010, productivity recovered from its very low level though remained relatively weak, on average,
through the end of the sample period. 18
) are depicted in the middle panel of Figure 5. Changes in productivity do not display much serial correlation over the sample period; however, the
estimates imply that productivity was relatively low during the beginning of the Great Recession, suggesting that it may have contributed to the large, initial output contraction at the end of 2008. In 2010, productivity recovered from its very low level though remained relatively weak, on average,
through the end of the sample period. 18
The lower panel displays the innovations to the monetary policy rule, which are relatively small in comparison with the other two shocks.19 This result is consistent with the evidence in (Christiano et al., 1999); however, it does not necessarily imply that monetary policy is unimportant, because the systematic part of the rule is a crucial determinant of the model's dynamics. Imposing the interest rate lower bound constraint on economic behavior greatly affects the pattern of policy shocks during the Great Recession. The inside figure in the lower panel shows that when the interest-rate lower bound is imposed, the monetary policy shocks are small and that policy is a bit stimulative at the onset of the recession. By contrast, (Ireland, 2011), who estimates a linearized model that does not impose the lower bound constraint, finds that a sequence of contractionary monetary policy shocks is necessary in order to match the observed interest rate trajectory during the Great Recession. Thus, misspecifying the model by ignoring the lower bound constraint might lead a researcher to the incorrect conclusion that the central bank chose to deviate from the systematic portion of their rule by surprising the public with unusually tight policy.
5.2 Shock Decomposition
Figure 6 shows how much of the model's fit for output growth, inflation, and nominal interest rates is attributable to individual shocks. More specifically, it displays the model's dynamics if only one of the three shocks were present during the Great Recession and compares this simulated path to the smoothed values shown in Figure 1, which were generated using all three shocks.20 The upper-left panel of the figure shows that the large contraction in output growth that occurred at the end of 2008 was attributable to both the fall in productivity and the discount rate, as either of these two shocks alone would have induced the level of output to fall in 2008:Q4. While both of these shocks contributed to slow output growth from 2009 onwards, the model ascribes a relatively larger role to the productivity shocks.
The discount rate shocks, however, appear to be relatively more important in explaining the low inflation in 2009 and 2010. Despite the large decline in demand induced by this shock, the fall in inflation is relatively modest and the economy never experiences deflation. This mild disinflation reflects in part the upward pressure on marginal cost induced by the decline in productivity in late 2008 and 2009. In addition, as shown in Figure 2, the slope of the Phillips curve flattens out, dampening the response of inflation to the large fall in demand induced by the discount rate shock.
The decline in the discount rate is also important in accounting for the economy's spell at the lower bound. By reducing both output growth and inflation, this shock pushes the notional interest rate well below zero, causing the interest rate to hit and then stay at the lower bound throughout the episode.
5.3 The Contribution of the Zero Lower Bound to the Great Recession
How much did the interest-rate lower bound contribute to the economic slump during the Great Recession? To address this question, we use our model to compare its estimated outcomes to the outcomes from a hypothetical scenario in which monetary policy is free to adjust the nominal interest rate in an unconstrained manner. Figure 7 reports the observed data on output, inflation, and the nominal rate, the outcomes for these series from the estimated (constrained) model, and the outcomes implied by a hypothetical scenario in which monetary policy is able to make the policy rate negative.21 If policy could have acted in an unconstrained fashion, the policy rule would have called for a negative nominal interest rate from 2009 to the end of the sample period. In 2009, this hypothetical rate would have been close to -4 percent throughout 2009 and below -1 percent at the end of the sample in 2011:Q4. The 95 percent credible interval around these estimates indicates that there was only a small probability that the hypothetical nominal rate would have turned positive during this period.
If monetary policy could have cut the nominal interest rate this aggressively, it would have helped offset the contractionary effects of the productivity and discount rate shocks and thus output and inflation would not have fallen as dramatically during the recession. The upper-right panel shows that output is more than 1 percent lower, on average, over the 2009-2011 period in the estimated, constrained version of the model relative to the hypothetical scenario.22 Moreover, around 20 percent of the initial fall in output in early 2009 is due to the lower bound constraint. Inflation, displayed in the upper-right panel, is further below the central bank's inflation target throughout the 2009-2011 period and is about 0.5 percentage point lower, on average, over this period in the constrained model relative to the unconstrained model. Accordingly, our estimates suggest that the interest-rate lower bound was a significant constraint on monetary policy that helped exacerbate the recession and inhibit the recovery.
6 Lower Bound Episodes
This section examines the model's estimates of the probability of the interest rate reaching the lower bound and the average duration of a lower bound spell. It is useful first to provide some context from the data. For our sample period from 1983:Q1-2011:Q4, there is one realization of a lower bound episode in which the nominal interest rate is effectively at the lower bound. The episode has lasted for 12 quarters to the end of the sample in 2011:Q4, so that the duration of the episode is right-censored. While these numbers are useful as an ex-post description of this episode, below we provide a more complete characterization by examining the evolution of private sector's expectations of the duration of the lower bound spell. As documented below, measures of private sector expectations of the duration, both at the beginning and middle of the spell, were for spells to last only 3 to 4 quarters.
6.1 The Expected Path of the Nominal Interest Rates
To illustrate this, the top panels of Figure 8 display investor expectations for the path of the federal funds rate using data from Eurodollar quotes and implied three-month forward rate swaps for two different dates.23 The upper left panel shows that at the beginning of the lower bound episode in 2009:Q1, the median forecast (the solid yellow line) by financial market participants was for the federal funds rate to remain below 25 basis points through the third quarter of 2009 before rising gradually to about 2.5 percent in 2012.24 As indicated by the dark and light shaded regions, which represent the 70 and 90 percent confidence intervals respectively, there is considerable uncertainty around these forecasts at longer horizons. Even taking into account this uncertainty, however most financial participants in 2009:Q1 expected the federal funds rate to remain below 25 basis points for only a few quarters.
The upper right panel shows that the distribution for the expected federal funds rate had shifted downward by 2010:Q2. Financial market participants in 2010:Q2 were expecting, on average, that the federal funds would remain below 25 basis points for four quarters, compared with three quarters in 2009:Q1. In addition, the distribution for the expected federal funds rate one to two years in the future is lower in 2010:Q2 than in 2009:Q1.
The bottom panels of Figure 8 display the expected path for the nominal interest rate in 2009:Q1 and 2010:Q2 using 3-month Treasury yield forecasts from the Blue Chip Economic Indicators.25 Private sector forecasts, on average, expected the nominal rate to remain below 25 basis points for about 3 quarters in both 2009:Q1 and 2010:Q2. Moreover, the expected path for the nominal rate rises a bit faster and to a higher level than as implied by financial market data. In 2009:Q1, for example, the nominal rate is expected to reach 4 percent by the end of 2014 compared to 2.5 percent based on the expectations of financial market participants.
Figure 8 also shows the projected paths for the federal funds rate implied by our model. In 2009:Q1, the model predicts a median path in which the nominal interest rate stays at the lower bound for four consecutive quarters. Thereafter, the interest rate is expected to rise gradually, reaching 4 percent at the end of 2014. As shown by the dashed lines, there is substantial uncertainty around the model's projections, both for the duration of the lower bound spell and for the value of the interest rate in early 2015. Similar to both financial market participants and private sector forecasters, the model's median duration is four quarters in 2009:Q1. Although the projected path of interest rates rises faster from 2010 onward than the path implied by financial data, it is remarkably similar to the projected path of private sector forecasters.
The lower right panel shows that in 2010:Q2 the model's path is largely in line with the expected path of Blue-Chip forecasters, whose projections take into account the unconventional policies implemented between 2009:Q1 and 2010:Q2. Although the model's expected duration is only two additional quarters in 2010:Q2 compared with the four-quarter projection of financial market participants, the model's 67 percent confidence bands (the dotted lines) include a duration of 6 quarters. Accordingly, the model captures the downside risk associated with staying at the effective lower bound implicit in financial market quotes.
In summary, the model has reasonable implications for the expected duration and path of the nominal interest rate during the lower bound spell that occurred in our sample. Although the model incorporates a forward guidance channel through the expected path implied by the interest-rate rule, it does not take into consideration the balance-sheet policies undertaken by the Federal Reserve in recent years. Despite this omission, the model still generates an expected interest rate path that is reasonably similar to those of financial market participants and private sector forecasters.
6.2 The Probability of Being at the Lower Bound
The top panel of Figure 9 displays the cumulative distribution function of the probability of being at the zero lower bound implied by the model's estimates. The dark line shows the cumulative distribution function in which the only source of variation in this probability is the uncertainty coming from the posterior estimates of the model's parameters.26 We call this the population estimate of the lower bound probability. As implied by the population histogram, the economy is at the zero lower bound, on average, about 3 percent of the time. However, the estimates of this probability are disperse, ranging from close to 0 to above 5 percent and having a standard deviation of close to 1 percent. The distribution has fat tails and the middle panel zooms in on the right tail. As indicated there, our estimates suggest that 2.5 percent of the posterior draws produce an economy that is at the lower bound 5 percent of the time or longer. In contrast, for our empirical sample, the interest rate has been at the lower bound for 12 of the 116 quarters, about 10 percent of the time.
A possible interpretation of this discrepancy is that the model can not generate a fraction of time spent at the lower bound that matches our sample of data. This interpretation is not appropriate, however. Our model suggests that it is not possible to reliably estimate the probability of being
at the lower bound in a small sample. To illustrate this point, the dashed line in the upper panel shows the cumulative distribution function derived from the model's estimates using samples of length ![]() . In this case, the average probability of being at the lower bound is still 3 percent; however, the sample distribution displays more dispersion, as the right-tail spreads out even more (see the bottom panel of figure 9). Here, 14 percent of our
samples reached the lower bound for at least 8 of 116 quarters. As indicated in the upper panel, almost 50 percent of the samples generated by the model never even hit the interest-rate lower bound. Hence, a situation in which no lower bound episodes are observed in 116 quarters of data is fairly
likely. The interest rate reaches the lower bound for 12 or more quarters in about 5 percent of the samples, and 0.05 percent of the samples reached the lower bound for more than 35 of the 116 quarters.
. In this case, the average probability of being at the lower bound is still 3 percent; however, the sample distribution displays more dispersion, as the right-tail spreads out even more (see the bottom panel of figure 9). Here, 14 percent of our
samples reached the lower bound for at least 8 of 116 quarters. As indicated in the upper panel, almost 50 percent of the samples generated by the model never even hit the interest-rate lower bound. Hence, a situation in which no lower bound episodes are observed in 116 quarters of data is fairly
likely. The interest rate reaches the lower bound for 12 or more quarters in about 5 percent of the samples, and 0.05 percent of the samples reached the lower bound for more than 35 of the 116 quarters.
6.3 The Duration of Lower Bound Spells
The top panel of Figure 10 displays the (population) cumulative distribution function of the duration of a lower-bound spell.27 The average duration for a lower bound spell is just over three quarters and the median is two. The distribution for the duration of a spell is skewed to the right and also has a long right tail (shown in the bottom panel). Spells with durations of eight quarters or longer occur account for about 9 percent of the total number of lower bounds spells and those with durations of twelve quarters or longer account for 2.8 percent of the total. Thus, the current episode, with a duration of at least twelve quarters, occurs relatively infrequently in the model, and from the perspective of households and firms in the model, would be difficult to predict ex ante. This finding is consistent with the evidence obtained from financial markets and private sector forecasts, which for the most part did not foresee such a protracted episode.
Figure 11 shows the dynamic paths of the median responses of the economy's variables in a long duration spell (defined as spells whose duration is twelve quarters or longer) and the median responses of short duration spells (defined as spells whose duration is
less than twelve quarters). For purposes of comparison, the figure also plots the (nonstochastic) steady state growth path for output, the level of the inflation target, and the steady state nominal interest rate. For both types of spells, the economy starts from the 2008:Q4 initial conditions;
these conditions include the smoothed values of the shocks in that quarter (shown as the first quarter in the lower panels of the figure). With the economy starting from the same unfavorable position in which both the productivity and discount rate shocks are very low, the responses of the
variables in the first period in both scenarios are the same. In a short spell, the unfavorable initial positions of the shocks are relatively temporary. The productivity innovation (
![]() ) immediately returns to its mean value of zero after one period while the discount factor shock (
) immediately returns to its mean value of zero after one period while the discount factor shock (![]() ) gradually returns back to its mean zero according to
) gradually returns back to its mean zero according to
![]() , the posterior mean value. With the shocks returning back to baseline, inflation converges back to its steady-state level after ten quarters. In addition, the nominal rate
departs from the lower bound after four quarters and only slowly returns back to its steady state level, reflecting the high degree of inertia in the rule (i.e.,
, the posterior mean value. With the shocks returning back to baseline, inflation converges back to its steady-state level after ten quarters. In addition, the nominal rate
departs from the lower bound after four quarters and only slowly returns back to its steady state level, reflecting the high degree of inertia in the rule (i.e.,
![]() ).
).
In a long spell, the unfavorable circumstances are much more persistent. The discount rate shock stays at a very low level and only gradually begins to return its mean level after 12 quarters. Accordingly, output falls further below trend before beginning to improve. Inflation displays a similar pattern, declining to just below 1 percent after two years and then gradually rising back to the central bank's target. The nominal interest also remains at the lower bound for 14 quarters and remains well below its unshocked level five years after the start of the simulation.
Note that many of the characteristics of the median response of the long duration simulation resemble the empirical lower bound episode we discussed earlier. In this episode, output growth remained persistently weak, and though inflation falls, there is not a prolonged spell of deflation.
6.4 Explaining the Probability and Duration of Lower Bound Spells
The preceding discussion underscores the important role of the demand or discount rate shock in bringing about a lower bound episode. We turn now to the issue of how other structural features of the economy affect the probability of reaching the lower bound and the duration of an episode. Figure 12 shows scatter plots of how key parameters affect the probability and duration of a spell.28 The first row of the panels display the relationship between the persistence of the discount rate shock and three statistics about the lower bound: the probability of the interest rate being at the lower bound, the average duration of a lower bound spell, and duration in the tail of the distribution (defined as the 99.5th percentile). The frequency and duration of spells tend to increase for economies in which discount factor shocks are more persistent. The univariate regression coefficient is positive and statistically significant at the 95 percent confidence level.
Monetary policy rule parameters can also be important determinants of lower bound spells. The second row shows that the greater the inertia in the rule, as measured by the lagged interest rate coefficient (![]() ), the higher the probability of a lower bound spell and the greater the duration of the spell. Although inertia in the rule tends to make a lower bound spell more likely, this does not necessarily imply inertia is an undesirable feature of monetary policy. In fact, placing
a greater weight on the lagged notional rate, the outcomes for inflation and activity in a lower-bound spell results in better economic outcomes than a rule with less inertia.
), the higher the probability of a lower bound spell and the greater the duration of the spell. Although inertia in the rule tends to make a lower bound spell more likely, this does not necessarily imply inertia is an undesirable feature of monetary policy. In fact, placing
a greater weight on the lagged notional rate, the outcomes for inflation and activity in a lower-bound spell results in better economic outcomes than a rule with less inertia.
The average growth rate of productivity, ![]() , is a key determinant of the model's average nominal interest rate and thus the probability and duration of a lower bound episode. The lower
panels of Figure 12 demonstrate that model economies with a lower average growth rate are more susceptible to more and longer lasting lower bound spells.
, is a key determinant of the model's average nominal interest rate and thus the probability and duration of a lower bound episode. The lower
panels of Figure 12 demonstrate that model economies with a lower average growth rate are more susceptible to more and longer lasting lower bound spells.
7 Conclusions
In this paper, we estimated a nonlinear DSGE model in which the interest-rate lower bound is occasionally binding. This allowed us to quantify the size and nature of the disturbances that pushed the U.S. economy to the lower bound in late 2008 as well as conclude that the lower bound was a significant factor in exacerbating the economic slump during that period. We also found that the New Keynesian model is capable of generating long-lasting lower-bound spells that resemble the observed U.S. episode and yields predictions consistent with private sector forecasts regarding the expected duration of the episode.
Researchers interested in examining the effects of alternative policies at the lower bound often need to calibrate their models with reasonable parameters but also reasonably-sized shocks. The exercise conducted here should be especially beneficial to these researchers, because our parameter estimates and even more so our shock estimates can be used to create realistic initial conditions from which to conduct such policy experiments. More broadly, we have demonstrated that it is possible to solve a nonlinear model using projections methods and then estimate the model using Bayesian techniques. This approach is likely to prove fruitful for other applications in which occasionally binding constraints have important economic consequences.
Bibliography
Econometric Reviews 26:113-172.
Journal of Royal Statistical Society Series B 72:269-342.
University of Maryland, manuscript.
University of Pennsylvania, manuscript.
NBER Working Paper 18420.
International Finance Discussion Paper 1009.
Journal of International Money and Finance Forthcoming.
Federal Reserve Bank of Atlanta, WP 2012-5a.
Journal of Political Economy 119:78-121.
In J. Taylor & M. Woodford (eds.), Handbook of Macroeconomics Vol.1, pp. 65–-148. Elsevier.
Journal of Political Economy 113:1-45.
Journal of Economic Dynamics and Control 24:1179-1232.
Journal of Money, Credit and Banking 44:47-82.
Advances in Macroeconomics 4:1187-1187.
Econometric Reviews 31:245-296.
Brookings Papers on Economic Activity 1:139-211.
Journal of European Economic Association Forthcoming.
Federal Reserve Bank of San Francisco, manuscript.
National Bureau of Economic Research Working Paper 18058.
Review of Economic Studies 74:1059-1087.
The Economic Journal 121:351-378.
Journal of Money, Credit, and Banking 43:31-54.
Journal of Finance 62:345-382.
In B. Friedman & M. Woodford (eds.), Handbook of Monetary Economics Vol. 3A, pp. 231–-284. Elsevier.
Review of Economic Dynamics 13:701-714.
New York University, manuscript.
Journal of Political Economy 90:1187-1211.
In T. Cooley (ed.), Frontiers of Business Cycle Research, pp. 294-330. Princeton University Press.
NBER Working Paper 16514.
American Economic Review 97:586-606.
Federal Reserve Board, manuscript.
| parameter | mean | stdev | 0.025 | 0.975 | prior type | prior mean | prior stdev |
| 0.46629 | 0.05990 | 0.35116 | 0.59479 | Beta | 0.50000 | 0.22373 | |
| 94.23848 | 14.95835 | 66.41825 | 124.96302 | Gamma | 85.00000 | 15.00000 | |
|
|
0.79127 | 0.11427 | 0.58608 | 1.03796 | Normal | 0.00000 | 1.00000 |
|
|
0.25475 | 0.04955 | 0.16604 | 0.36333 | Normal | 0.00000 | 1.00000 |
| 0.85622 | 0.03549 | 0.78340 | 0.92342 | Beta | 0.50000 | 0.27929 | |
|
|
0.88018 | 0.01766 | 0.83982 | 0.90892 | Beta | 0.50000 | 0.27929 |
|
|
0.01323 | 0.00175 | 0.01026 | 0.01737 | InvGamma1 | 0.01000 | 0.01000 |
|
|
0.00210 | 0.00024 | 0.00170 | 0.00263 | InvGamma1 | 0.01000 | 0.01000 |
|
|
0.00252 | 0.00031 | 0.00200 | 0.00321 | InvGamma1 | 0.01000 | 0.01000 |
| 1.00413 | 0.00057 | 1.00309 | 1.00532 | Normal | 1.00433 | 0.00100 | |
| 1.00656 | 0.00032 | 1.00594 | 1.00721 | Normal | 1.00607 | 0.00100 | |
|
|
0.00101 | 0.00010 | 0.00084 | 0.00123 | InvGamma1 | 0.00100 | 0.00050 |
|
|
0.00117 | 0.00010 | 0.00099 | 0.00139 | InvGamma1 | 0.00100 | 0.00050 |
|
|
0.00081 | 0.00006 | 0.00071 | 0.00094 | InvGamma1 | 0.00100 | 0.00050 |
| Data | Model | |
|
|
1.72 | 1.63 |
|
|
(0.51, 2.70) | |
|
|
2.72 | 2.71 |
|
|
(2.13, 3.40) | |
| 2.42 | 2.57 | |
| (2.05, 3.07) | ||
| 1.03 | 0.90 | |
| (0.65, 1.22) | ||
| 4.49 | 4.62 | |
| (3.07, 6.17) | ||
| 2.67 | 1.82 | |
| (1.18, 2.60) | ||
|
|
0.47 | 0.46 |
|
|
(0.24, 0.66) | |
|
|
0.57 | 0.70 |
|
|
(0.53, 0.82) | |
|
|
0.98 | 0.89 |
|
|
(0.80, 0.96) | |
|
|
0.03 | -0.30 |
|
|
(-0.61, 0.04) | |
|
|
0.33 | 0.05 |
|
|
(-0.25, 0.35) | |
|
|
0.50 | 0.27 |
|
|
(-0.15, 0.61) |
Figure 1 Data Note: For each draw
|
|
Figure 2 Data Note: The model responses are computed as follows. We use the posterior means of the parameter values, and the mean estimate of the state as initial conditions for each baseline scenario. We then simulate 1,000,000 paths and report the
median value across these paths for each variable in each period.
|
|
Figure 3 Data Note: The figure reports the difference between the median values of a shocked path, which introduces an unexpected increase in the discount rate at date 1 relative to the median values of the (unshocked) baseline path shown in Figure 2. The median responses were constructed by simulating 1,000,000 paths of the economy's variables.
|
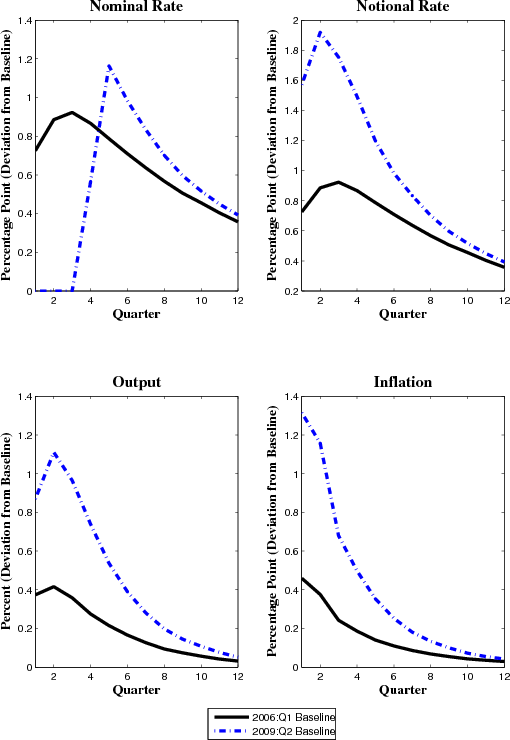
|
Figure 4 Data Note: The figure reports the difference between the median values of a shocked path, which introduces an unexpected increase in the level of productivity at date 1 relative to the median values of the (unshocked) baseline path shown in Figure 2. The median responses were constructed by simulating 1,000,000 paths of the economy's variables.
|
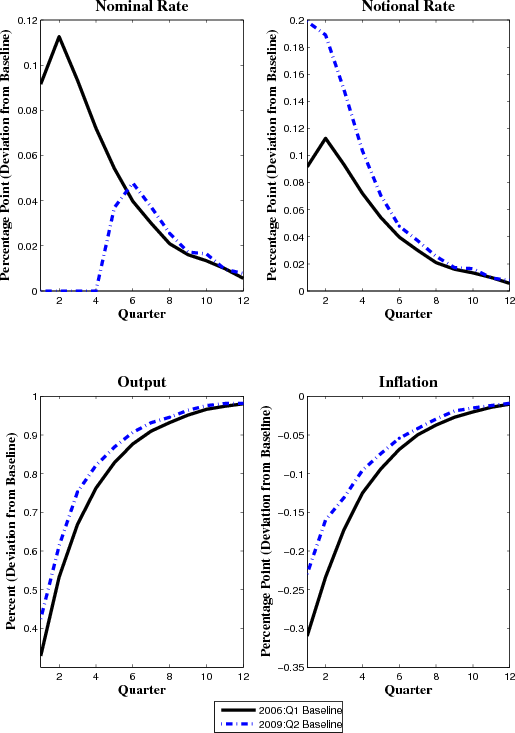
|
Figure 5 Data Note: For each draw
|
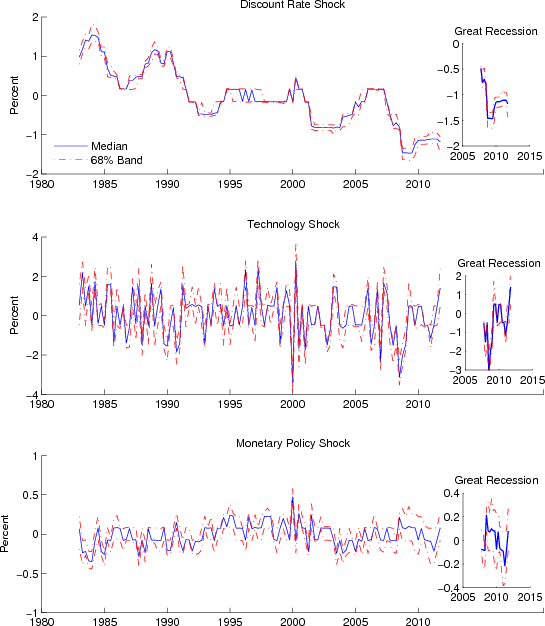
|
Figure 6 Data Note: We compute the counterfactual `Only Beta' as follows. Starting in 2007:Q4, we take the estimated state (shown in Figure 1) as a starting value, and simulate the economy forward feeding in the smoothed
|
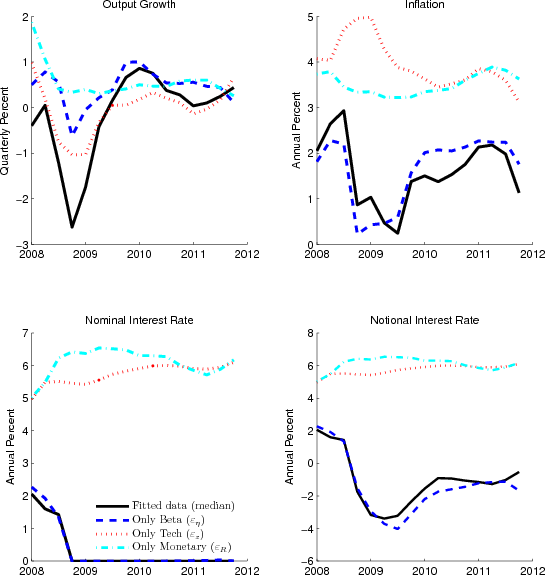
|
Figure 7 Data Note: We take the estimated value of the state (shown in figure 1) as a starting value, and simulate the economy forward feeding in the smoothed
|
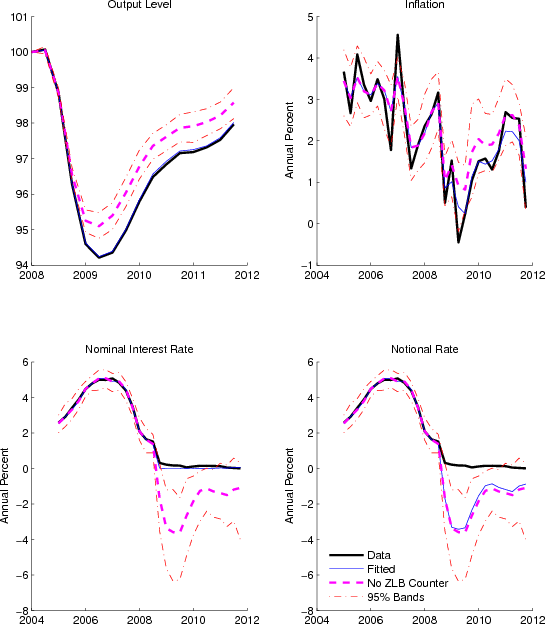
|
Figure 8 Data Note: Eurodollar quotes and implied three-month forward rates from swaps were used to estimate the median financial market federal funds-rate path from one quarter ahead to 40 quarters ahead. The dark and light shading represent the 70 and 90 percent confidence
intervals respectively. Financial market quotes were taken from Mach 18, 2009 and June 16, 2010 to represent pre-FOMC market expectations for 2009:Q1 and 2010:Q2, respectively. The three month Treasury yield expectations are based on the Blue Chip Economic Indicators release from March 10, 2009 and
June 10, 2010. Confidence bounds represent the mean of the 10 highest and lowest observations in the sample of 46 market participants surveyed in the Blue Chip release. The model paths for the nominal interest are computed using the posterior means of the parameter values, and the mean estimate of
the state as initial conditions for 2009:Q1 and 2010:Q2. We then simulate 1,000,000 paths, each of length 24 quarters, and report the median value and 68th percentile in each
quarter.
|
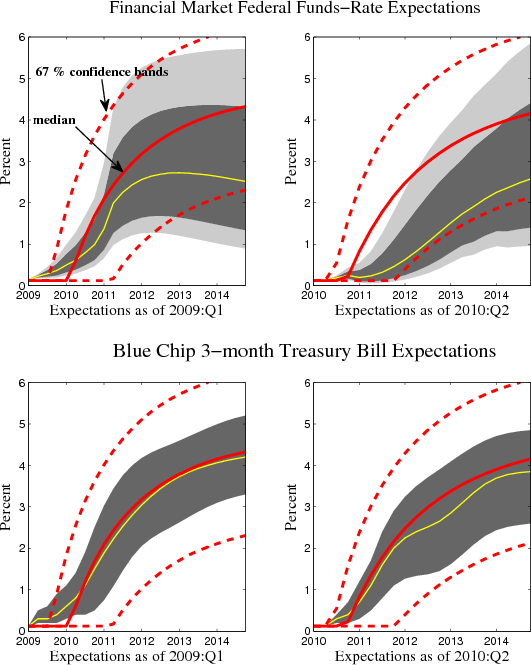
|
Figure 9 Data Note: For each draw
|
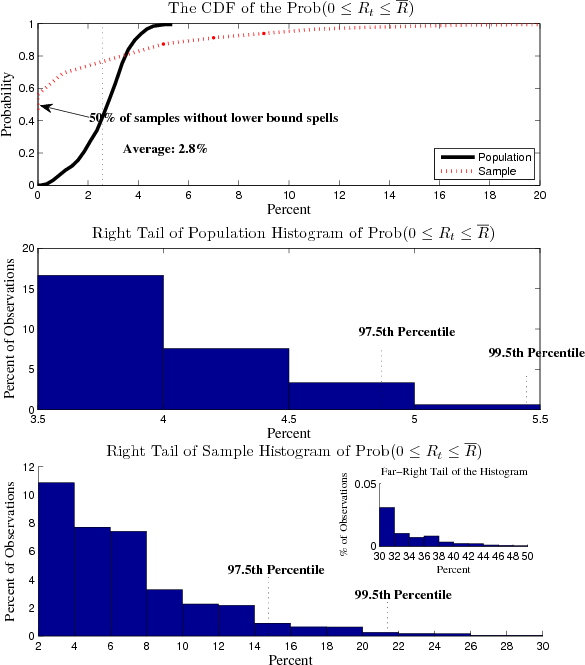
|
Figure 10 Data Note: For each draw
|
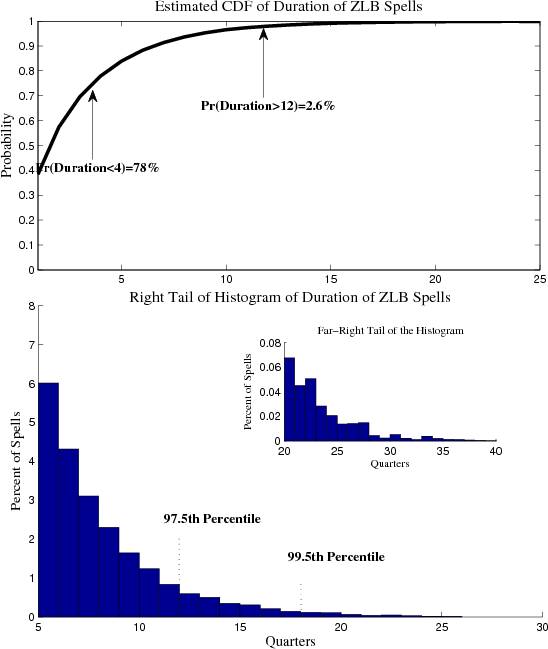
|
Figure 11 Data Note: The model responses are computed as follows. For both long and short duration spells, we use the posterior means of the parameter values, and the mean estimate of the state in 2008:Q4 as initial conditions. We then simulate 1,000,000 paths each with
20 quarterly observations. For each of those paths with these initial conditions, the economy is at the lower bound in period 1. The path for the long duration spells is constructed as the median value of spells which are at the lower bound for 12 consecutive quarters or
longer. The median path for the short duration spell is constructed from the remaining simulated paths.
|
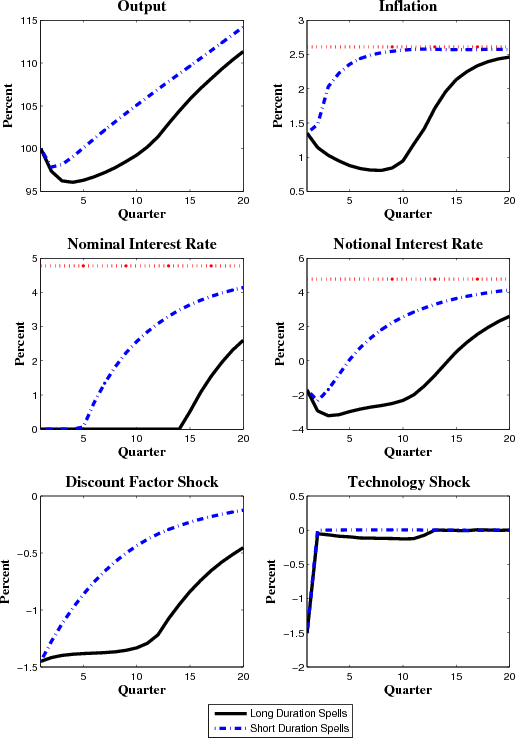
|
Note: For each draw
|
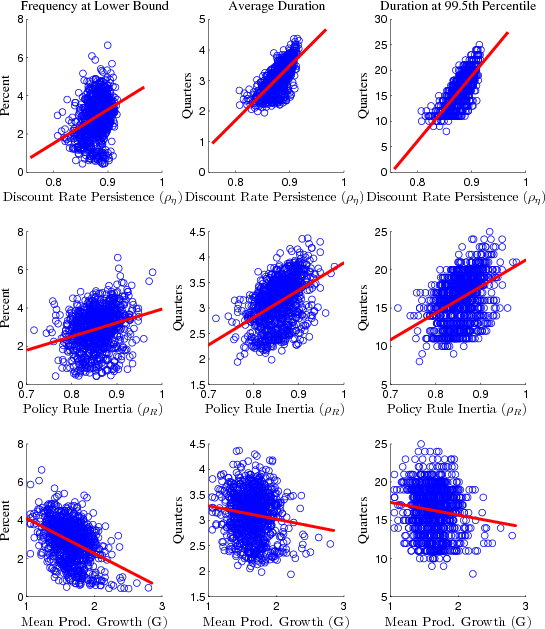
The appendix is divided in two sections. The first one characterizes the model's equilibrium in terms of time-invariant functions and uses that characterization to describe our solution algorithm. It also compares our solution algorithm with an algorithm that involves imposing the lower bound constraint in the context of the linearized equilibrium conditions. The second section discusses the evaluation of the likelihood function using the particle filter and the final section displays the linearized model equations.
A. Characterizing and Solving the Model's Equilibrium
Before discussing our solution method, we discuss the model's equilibrium conditions. To do so, we write the model's decision rules and equilibrium conditions as time-invariant functions. Let
![]() , where
, where
![]() and
and
![]() . Also,
. Also, ![]() and
and
![]() denote the second and third elements of the functions that comprise
denote the second and third elements of the functions that comprise ![]() . It
is also convenient to define the residual functions:
. It
is also convenient to define the residual functions:
| 0 | (A.1) | ||
| 0 | (A.2) |
where
 |
|||
 |
|||
|
|||
 |
The functions,
![\displaystyle W(\mathbb{K}_{-1},\tau)=A(\mathbb{K}_{-1},\tau)h_{y}(\mathbb{K}_{-1},\tau)-\tilde{\gamma} \left[ 1-\frac{\varphi }{2}\left( \frac{\Pi _{-1}}{\bar{\Pi }}-1\right) ^{2}\right] \tilde{Y}_{-1}\exp (-\varepsilon _{Z}),](img226.gif)
For convenience, we have omitted two other important conditions regarding the model's equilibrium. These conditions reflect that we view our economy as the cashless limit of a model in which money enters the utility function. (See (Eggertsson & Woodford, 2003) for the functional form and further discussion of this issue.) These two conditions in the economy with money are a transversality condition involving household's cash holdings and a more fully specified monetary policy which requires the central bank to commit to increases in money growth in proportion to the central bank's inflation target in periods in which the interest rate is at its lower bound. These conditions rule out a second stationary equilibrium that is deflationary, because when monetary policy injects cash in this manner, the model's transversality condition is not satisfied. As the weight on cash balances in a household's utility function converges toward zero in this more fully specified version of the model, the economy's equilibrium conditions converge to the ones shown above.
A.1 An Equivalent Representation of the Model's Equilibrium
We do not approximate
![]() directly. Instead, following the ideas in (Christiano & Fisher, 2000), we approximate functions that are smoother and easier to approximate
while still allowing for a closed-form mapping into
directly. Instead, following the ideas in (Christiano & Fisher, 2000), we approximate functions that are smoother and easier to approximate
while still allowing for a closed-form mapping into
![]() . To do so, we need to use an equivalent representation of the equilibrium conditions and rewrite the residual functions as:
. To do so, we need to use an equivalent representation of the equilibrium conditions and rewrite the residual functions as:
| (A.3) | |||
| (A.4) |
where
 |
|||
 |
and
 |
|||

|
|||
 |
where
![\displaystyle W_{i}(\mathbb{K}_{-1},\tau)=A_{i}(\mathbb{K}_{-1},\tau)h_{y,i}(\mathbb{K}_{-1},\tau)-\gamma \left[ 1-\frac{\varphi }{2}\left( \frac{\Pi_{-1}}{\bar{\Pi}}-1\right) ^{2}\right] \tilde{Y}_{-1}\exp (-\varepsilon _{Z}),](img249.gif)
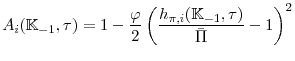 for
for | (A.5) | |||
| (A.6) |
while the notional rate when above the lower bound is given by:
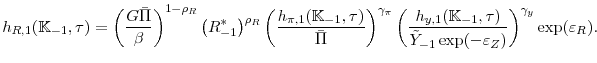
The index ![]() , associates a function with the interest-rate regime in which the notional interest rate,
, associates a function with the interest-rate regime in which the notional interest rate, ![]() , is either above or below the lower bound. Because functions such
, is either above or below the lower bound. Because functions such
![]() depend directly on the indicator function, we expect them to have a kink or non-differentiability. By contrast, the counterpart functions that are indexed by
the the interest-rate regime,
depend directly on the indicator function, we expect them to have a kink or non-differentiability. By contrast, the counterpart functions that are indexed by
the the interest-rate regime, ![]() , do not depend on the current indicator function and thus are more likely to be smooth.
, do not depend on the current indicator function and thus are more likely to be smooth.
The regime-specific functions still depend on a secondary effect that the kink has through its expectation in the next period. This secondary effect occurs through the expectation terms of
![]() and
and ![]() for
for ![]() . For
. For
![]() , for example, the future value of the indicator function enters through
, for example, the future value of the indicator function enters through
![]() or
or
![]() though the indicator function does not affect
though the indicator function does not affect
![]() which is determined from the regime-specific functions. Following the arguments in (Christiano & Fisher, 2000), the secondary effects of the kink on the
regime-specific functions should be small because of the presence of the expectations operator, which involves summing over the future states of
which is determined from the regime-specific functions. Following the arguments in (Christiano & Fisher, 2000), the secondary effects of the kink on the
regime-specific functions should be small because of the presence of the expectations operator, which involves summing over the future states of ![]() . As we increase the number of discrete
exogenous states, the regime-specific functions should become smoother. While our approach of using relatively smooth functions is similar to (Christiano & Fisher, 2000), we do not parameterize the expectations as in (Christiano & Fisher, 2000). The
difference is that in our application there is no closed-form mapping between the two expectations in our residual functions and the model's decision rules. However, we are still able to focus on relatively smooth functions by approximating functions that do not depend on the current indicator of
the interest-rate regime.
. As we increase the number of discrete
exogenous states, the regime-specific functions should become smoother. While our approach of using relatively smooth functions is similar to (Christiano & Fisher, 2000), we do not parameterize the expectations as in (Christiano & Fisher, 2000). The
difference is that in our application there is no closed-form mapping between the two expectations in our residual functions and the model's decision rules. However, we are still able to focus on relatively smooth functions by approximating functions that do not depend on the current indicator of
the interest-rate regime.
A.2 Solution Algorithm
To solve for these decision rules, we first approximate the AR(1) shock processes using discrete Markov chains. For each individual shock process, we follow (Rouwenhorst, 1995) to determine its support and transition matrix. Given this procedure, the vector
![]() and has probability mass function
and has probability mass function
![]() for
for
![]() . In estimating the model, we used 8 discrete values for technology and monetary innovations and 12 discrete values for the discount rate shock so that
. In estimating the model, we used 8 discrete values for technology and monetary innovations and 12 discrete values for the discount rate shock so that
![]() .
.
Using discrete Markov processes for the shocks, we approximate the functions:
where
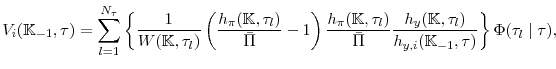
Our strategy involves finding ![]() and
and ![]() such that
such that
for
Before describing how we compute ![]() and
and
![]() , we show there is a closed-form mapping from
, we show there is a closed-form mapping from
![]() and
and
![]() to the decision rules,
to the decision rules,
![]() . We describe this mapping using our approximation of these functions:
. We describe this mapping using our approximation of these functions:
![]() and
and
![]() . These approximated functions then map into
. These approximated functions then map into
![]() , which determine the notional interest rate, inflation, and output.
, which determine the notional interest rate, inflation, and output.
This mapping works as follows. Given the functions
![]() and
and
![]() , we can determine
, we can determine
![]() as the positive root of the following quadratic equation:
as the positive root of the following quadratic equation:

With regime-specific inflation determined in this manner, the approximation for the region-specific decision rules for ![]() are given by:
are given by:
![\displaystyle \widehat{h}_{y,i}(\mathbb{K}_{-1},\tau; a_{i,\tau }, b_{i,\tau } )= \widehat{A}_{i}(\mathbb{K}_{-1},\tau; a_{i,\tau }, b_{i,\tau } )^{-1} \left\{ \widehat{W}_{i}(\mathbb{K}_{-1},\tau; b_{i,\tau } )+\tilde{\gamma } \left[ 1-\frac{\varphi }{2}\left( \frac{\Pi_{-1}}{\bar{\Pi}}-1\right) ^{2}\right] \tilde{Y}_{-1}\exp (-\varepsilon _{Z}) \right\}](img317.gif)
We use an iterative procedure to find ![]() and
and ![]() . Before starting these
iterations, we compute:
. Before starting these
iterations, we compute:
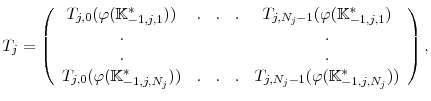
|
for
For the iterations, suppose that an initial vectors of parameters for ![]() and
and ![]() are available. Then using the mapping discussed above, we compute:
are available. Then using the mapping discussed above, we compute:
 |
|||
 |
![\displaystyle \widehat{\mathbb{Z}}_{W,1}(\mathbb{K}_{-1},\tau;a,b)=\log (\frac{% G\eta }{\beta })-\log (\widehat{h}_{R,1}(\mathbb{K}_{-1},\tau)) -\log \left[ \sum_{l=1}^{N_{\tau }}\frac{\exp (-\varepsilon _{Z}^{\prime })}{% \widehat{W}(\widehat{h}_{i}(\mathbb{K}_{-1},\tau),\tau _{l})}\frac{\Phi (\tau _{l}\mid \tau)}{\widehat{h}_{\pi }(\widehat{h}% _{i}(\mathbb{K}_{-1},\tau),\tau _{l})}\right]](img333.gif)
![\displaystyle \widehat{\mathbb{Z}}_{W,2}(\mathbb{K}_{-1},\tau;a,b)=\log (\frac{% G\eta }{\beta \overline{R}})-\log \left[ \sum_{l=1}^{N_{\tau }}\frac{\exp (-\varepsilon _{Z}^{\prime })}{\widehat{W}(\widehat{h}_{i}(\mathbb{K}_{-1}^{\ast },\tau),\tau _{l})}\frac{\Phi (\tau _{l}\mid \tau)}{\widehat{h}_{\pi }(\widehat{h}_{i}(\mathbb{K}_{-1},\tau),\tau _{l})}\right],](img334.gif)
In estimating the model, we set each univariate basis of the Chebychev polynomials to two so that
![]() and
and
![]() each consist of 8 parameters for
each consist of 8 parameters for ![]() . Thus, the the law of motion
for the endogenous state,
. Thus, the the law of motion
for the endogenous state,
![]() is characterized by 32 parameters for a given value of
is characterized by 32 parameters for a given value of ![]() . With
. With
![]() ,
, ![]() and
and ![]() each consist of 12,228 parameters and there are 24,576 total parameters characterizing the policy functions for output, inflation, and the notional interest rate.
each consist of 12,228 parameters and there are 24,576 total parameters characterizing the policy functions for output, inflation, and the notional interest rate.
A.3 Comparing Solution Algorithms
We compare our solution algorithm to the one described in (Erceg & Lindé, 2012) and (Bodenstein et al., 2012). This algorithm involves log-linearizing the equilibrium conditions around the non-stochastic steady state to
obtain:
 |
where the lower case refers to the log of a variable and a hat denotes the deviation of a variable from its value in nonstochastic steady state and

|
|||
 |
The monetary policy rule can be written as:
where
The algorithm for solving this system of equations replaces the equation with the max operator with
![]() , where
, where ![]() can be interpreted as an
anticipated monetary policy shock. The sequence of current and future innovations to
can be interpreted as an
anticipated monetary policy shock. The sequence of current and future innovations to ![]() are chosen so that if the notional rate falls below zero, the nominal interest rate is at the lower
bound; otherwise, the nominal rate must equal the notional rate. With the innovations chosen in this way, the duration that the economy is at the lower bound is endogenous. For estimation purposes, this method is attractive, since it is easy to compute. However, we find that this algorithm can
generate sizeable large differences from our projection method with relatively large Euler errors.
are chosen so that if the notional rate falls below zero, the nominal interest rate is at the lower
bound; otherwise, the nominal rate must equal the notional rate. With the innovations chosen in this way, the duration that the economy is at the lower bound is endogenous. For estimation purposes, this method is attractive, since it is easy to compute. However, we find that this algorithm can
generate sizeable large differences from our projection method with relatively large Euler errors.
To demonstrate this finding, Figure B.1 compares the evolution of the economy from the estimated initial state in 2009:Q2 for the two different solution methods. For the projection method, the responses are identical to those shown in Figure 2. For these initial conditions, the median paths for output growth and inflation using the constrained-linear solution method lie substantially below those given by the projection method. Accordingly, the median path for the desired or notional rate is much lower, falling
below -10 percent at its nadir, so that the duration of the lower bound spell is 14 quarters, compared to 5 quarters using the projection method. Figure B.1 shows the median path of the absolute vale of the Euler errors,
![]() and
and
![]() , that emerge from these two algorithms. The Euler errors at each date of the simulation are orders of magnitude larger for the constrained-linear method,
suggesting that this algorithm is not accurate enough to provide a quantitative assessment of the lower bound constraint in the context of our model.
, that emerge from these two algorithms. The Euler errors at each date of the simulation are orders of magnitude larger for the constrained-linear method,
suggesting that this algorithm is not accurate enough to provide a quantitative assessment of the lower bound constraint in the context of our model.
Figure B.2 compares the two solution algorithms for the 2006:Q1 initial conditions. In this case, the two solution algorithms yield similar results, suggesting that the constrained-linear solution may be appropriate for small shocks. However, for relatively large shocks or deviations from initial conditions, the application of this algorithm in our context becomes questionable.
B. Likelihood Evaluation
After solving for the state transition equation,
we need to map the variables computed in our model to observables. Let
![\displaystyle = \left[\begin{matrix}log(\tilde{Y}_{t}) - log(\tilde{Y}_{t-1}) + log(G) + \varepsilon_{Z,t} + \sigma_{\Delta y_{t}} \nu_{1,t} \\ log(\Pi_{t}) + \sigma_{\pi} \nu_{2,t} \\ log(R_{t}) + \sigma_{r} \nu_{3,t} \\ \end{matrix} \right]](img371.gif) |
(B.1) |
Where
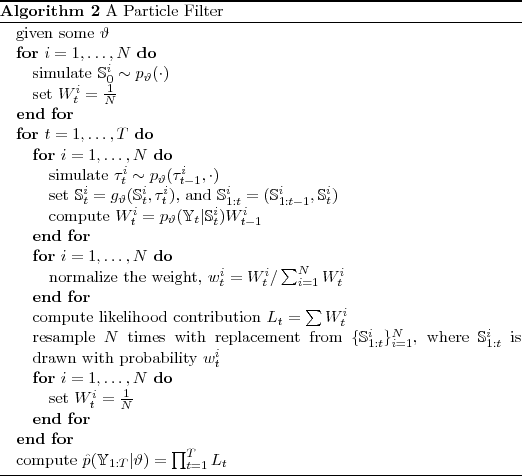
Note that drawing
![]() involves simulating from the ergodic distribution of states, drawing from
involves simulating from the ergodic distribution of states, drawing from
![]() is just simulating from (given our solution algorithm) discretized exogenous variables, and
is just simulating from (given our solution algorithm) discretized exogenous variables, and
![]() is the density of a normal distribution. We use systematic resampling to perform the resampling at each time period.
is the density of a normal distribution. We use systematic resampling to perform the resampling at each time period.
For computational reasons, we only store the most recent vector
![]() in memory. The algorithm was coded in Fortran and parallelized using MPI. After estimating our model using the surrogate algorithm described in the main text, our fitted
values are obtained by re-running the particle filter at selected
in memory. The algorithm was coded in Fortran and parallelized using MPI. After estimating our model using the surrogate algorithm described in the main text, our fitted
values are obtained by re-running the particle filter at selected ![]() and drawing from
and drawing from
![]() , then selecting the appropriate elements of
, then selecting the appropriate elements of
![]() .
.
B.1 Theoretical details of PMMH with Surrogate Transitions
Below we will sketch the proof that our algorithm has
![]() as its invariant distribution. At its heart, it is a Metropolis-Hastings algorithm on an extended space to include the vector of random variables that are
used to evaluate the particle filter and uses as a proposal distribution, the transition kernel of a surrogate Markov chain. The surrogate Markov chain is constructed using the Metropolis-Hastings algorithm targeting the easy-to-compute distribution. More details are contained in (Smith, 2011).
as its invariant distribution. At its heart, it is a Metropolis-Hastings algorithm on an extended space to include the vector of random variables that are
used to evaluate the particle filter and uses as a proposal distribution, the transition kernel of a surrogate Markov chain. The surrogate Markov chain is constructed using the Metropolis-Hastings algorithm targeting the easy-to-compute distribution. More details are contained in (Smith, 2011).
We will use a joint distribution of parameters ![]() and vector of random variables
and vector of random variables ![]() that are used to evaluate the particle filter as a target density of the Metropolis-Hastings algorithm. The approximation of the likelihood evaluated using the particle filter is then
that are used to evaluate the particle filter as a target density of the Metropolis-Hastings algorithm. The approximation of the likelihood evaluated using the particle filter is then
![]() . Accordingly, our target density is
. Accordingly, our target density is
![]() that has
that has
![]() , the posterior distribution of parameters given the data, as its marginal density. Here,
, the posterior distribution of parameters given the data, as its marginal density. Here,
![]() is the density of the vector of random variables
is the density of the vector of random variables ![]() that are
used to evaluate the particle filter given our vector of structural parameters
that are
used to evaluate the particle filter given our vector of structural parameters ![]() .
.
Define the surrogate target density as
![]() , where
, where
![]() is an approximation to the likelihood function (our easy-to-compute surrogate) and
is an approximation to the likelihood function (our easy-to-compute surrogate) and
![]() is surrogate prior density of our parameters
is surrogate prior density of our parameters ![]() , not
necessarily equal to the prior. We will use an approximate likelihood function does not depend on the vector
, not
necessarily equal to the prior. We will use an approximate likelihood function does not depend on the vector ![]() , so that
, so that
![]() .
.
First we will construct a surrogate Markov chain using the Metropolis-Hastings algorithm using a proposal distrubution
![]() and target
and target
![]() . Second, we will use the resulting transition kernel as a proposal distribution in a Metropolis-Hastings algorithm targeting
. Second, we will use the resulting transition kernel as a proposal distribution in a Metropolis-Hastings algorithm targeting
![]() . The proposal density for the surrogate transition step is,
. The proposal density for the surrogate transition step is,
![]() . The acceptance probability of a Markov chain constructed using the Metropolis-Hastings
algorithm using a proposal distrubution
. The acceptance probability of a Markov chain constructed using the Metropolis-Hastings
algorithm using a proposal distrubution
![]() and target
and target
![]() is,
is,
The transition kernel of the surrogate Markov chain constructed using this Metropolis-Hastings update with
![]() as a target density and proposal distribution
as a target density and proposal distribution
![]() will be denoted as
will be denoted as
![]() , that by construction, satisfies detailed balance with
, that by construction, satisfies detailed balance with
![]() . That is,
. That is,
Hence our PMMH with Surrogate Transitions algorithm is a particular implementation of the Metropolis-Hastings algorithm, so that
![]() is its invariant distribution by construction and
is its invariant distribution by construction and
![]() is its marginal density.
is its marginal density.
B.2 Construction of the Surrogate
To compute our surrogate density we linearize the equations (12)-(14) and use a Kalman filter to compute the likelihood function, call it
![]() , along with some surrogate prior over variables in
, along with some surrogate prior over variables in ![]() ,
,
![]() , we construct our surrogate
, we construct our surrogate
![]() , where
, where
![]() is a tuning parameter (the temperature) that controls how much the surrogate model should guide the algorithm. We used
is a tuning parameter (the temperature) that controls how much the surrogate model should guide the algorithm. We used
![]() for our surrogate, with insignificant differences between those estimates and ones produced with
for our surrogate, with insignificant differences between those estimates and ones produced with
![]() and
and
![]() . The surrogate prior was either slightly more diffuse or the same as the prior used in the target density. We also noticed that the measurement errors produced by the
surrogate differed substantially from that of the nonlinear model so that we added some auxiliary measurement error standard deviations
. The surrogate prior was either slightly more diffuse or the same as the prior used in the target density. We also noticed that the measurement errors produced by the
surrogate differed substantially from that of the nonlinear model so that we added some auxiliary measurement error standard deviations
![]() to be used in linear likelihood computation.
to be used in linear likelihood computation.
B.3 The Surrogate Density
In this subsection, we report the results of 500,000 draws from our surrogate target density
![]() using a random walk Metropolis-Hastings algorithm, as well as the results from a density constructed using
using a random walk Metropolis-Hastings algorithm, as well as the results from a density constructed using
![]() (not tempered). For the algorithm described in the main text to produce draws from
the correct distribution, a support condition is needed,
(not tempered). For the algorithm described in the main text to produce draws from
the correct distribution, a support condition is needed,
![]() . Inspecting marginal densities, it appears that the support of the surrogate
density contains that of the target density.29 The posterior density constructed by the linearized model differs from the target in economically meaningful
ways, prices are less sticky, monetary policy reacts much less strongly to inflation, as well as the persistence of the
. Inspecting marginal densities, it appears that the support of the surrogate
density contains that of the target density.29 The posterior density constructed by the linearized model differs from the target in economically meaningful
ways, prices are less sticky, monetary policy reacts much less strongly to inflation, as well as the persistence of the ![]() shock is much higher. Notwithstanding these differences, with an
appropriate amount of tempering, we can exploit this approximation to the nonlinear model's likelihood function to substantially speedup the run-time of our algorithm.
shock is much higher. Notwithstanding these differences, with an
appropriate amount of tempering, we can exploit this approximation to the nonlinear model's likelihood function to substantially speedup the run-time of our algorithm.
|
Note: For each solution method, the responses are computed using the posterior means of the parameter values, and the mean estimate of the state as initial conditions in 2009:Q2. We then simulate 1,000,000 paths and report the median value across these paths for each variable in
each period.
|
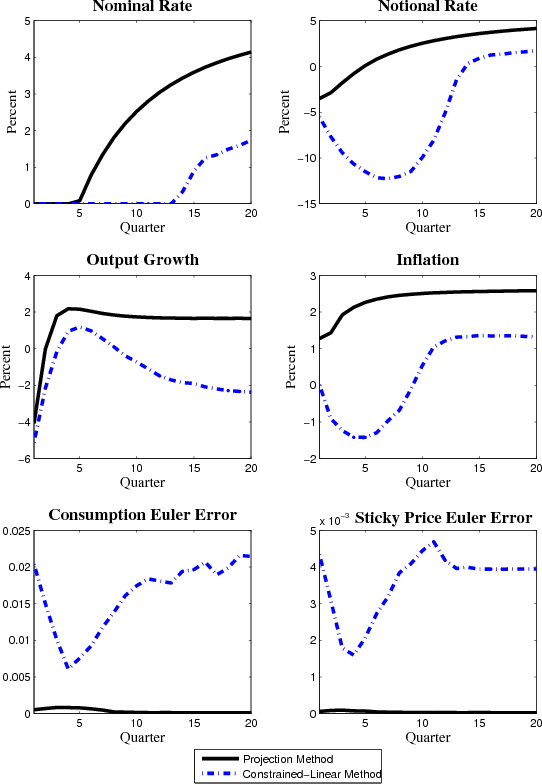
|
Note: For each solution method, the responses are computed using the posterior means of the parameter values, and the mean estimate of the state as initial conditions in 2006:Q1. We then simulate 1,000,000 paths and report the median value across these paths
for each variable in each period.
|
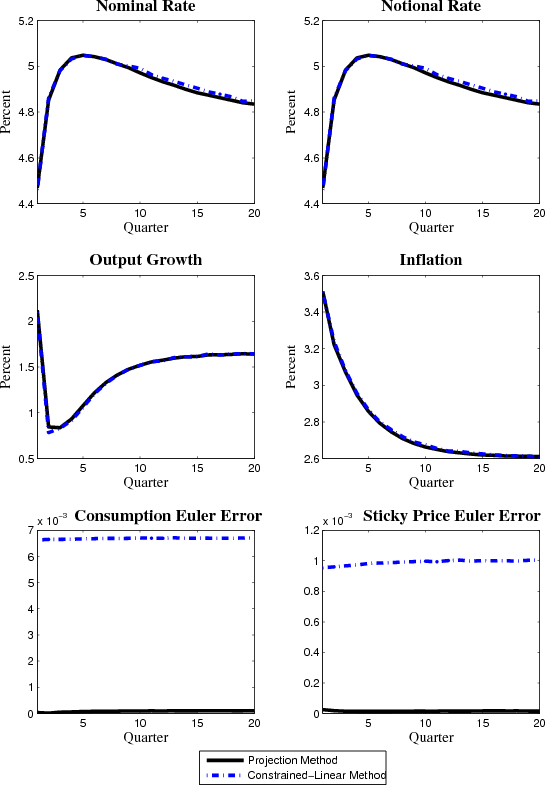
| mean | stdev | 0.025 | 0.975 | |
| 0.9987 | 0.0000 | 0.9987 | 0.9987 | |
| 0.5153 | 0.0699 | 0.3726 | 0.6476 | |
| 82.0791 | 14.3224 | 56.8087 | 112.6644 | |
|
|
6.0000 | 0.0000 | 6.0000 | 6.0000 |
|
|
0.4228 | 0.0532 | 0.3338 | 0.5414 |
|
|
0.1461 | 0.0232 | 0.1039 | 0.1947 |
| 0.8803 | 0.0208 | 0.8380 | 0.9195 | |
|
|
0.9601 | 0.0192 | 0.9187 | 0.9925 |
|
|
0.0159 | 0.0023 | 0.0119 | 0.0209 |
|
|
0.0013 | 0.0001 | 0.0011 | 0.0016 |
|
|
0.0015 | 0.0002 | 0.0012 | 0.0020 |
| 1.0043 | 0.0000 | 1.0043 | 1.0043 | |
| 1.0061 | 0.0000 | 1.0061 | 1.0061 | |
|
|
0.0005 | 0.0001 | 0.0004 | 0.0008 |
|
|
0.0006 | 0.0002 | 0.0004 | 0.0012 |
|
|
0.0004 | 0.0000 | 0.0003 | 0.0005 |
| mean | stdev | 0.025 | 0.975 | |
| 0.9987 | 0.0000 | 0.9987 | 0.9987 | |
| 0.5163 | 0.2214 | 0.0504 | 0.9124 | |
| 101.5661 | 36.3437 | 42.7569 | 183.0391 | |
|
|
6.0000 | 0.0000 | 6.0000 | 6.0000 |
|
|
0.9176 | 0.6692 | 0.3252 | 2.9826 |
|
|
0.2849 | 0.3640 | 0.0289 | 1.6728 |
| 0.8158 | 0.1257 | 0.4668 | 0.9675 | |
|
|
0.9311 | 0.0495 | 0.8119 | 0.9957 |
|
|
0.0165 | 0.0103 | 0.0056 | 0.0444 |
|
|
0.0019 | 0.0020 | 0.0007 | 0.0105 |
|
|
0.0020 | 0.0010 | 0.0010 | 0.0043 |
| 1.0043 | 0.0000 | 1.0043 | 1.0043 | |
| 1.0061 | 0.0000 | 1.0061 | 1.0061 | |
|
|
0.0017 | 0.0019 | 0.0003 | 0.0067 |
|
|
0.0013 | 0.0006 | 0.0004 | 0.0025 |
|
|
0.0004 | 0.0001 | 0.0002 | 0.0007 |