
Stress-Testing U.S. Bank Holding Companies:
A Dynamic Panel Quantile Regression Approach*
JEL CLASSIFICATION: C32, G21
KEYWORDS: macroprudential regulation, stress tests, capital shortfalls, density forecasting, quantile autoregression, fixed effects
1 Introduction
The 2007-09 global financial crisis and its aftermath of stubbornly high unemployment and sluggish growth in the United States and Europe has spurred renewed calls for active macroprudential regulation aimed at preventing the build-up of risks in the financial system, while at the same time reducing the social and economic costs of financial instability. At its core, the macroprudential approach to financial regulation argues for the bridging of the gap between the traditional macroeconomic policies and the conventional microprudential regulation of financial institutions, in order to limit the economic fallout arising from a systemic distress in the financial sector (Bank of England [2009] and Acharya et al. [2009]). As part of that effort, bank stress tests have in recent years become an indispensable part of the toolkit used by central banks and other regulators to conduct macroprudential regulation and supervision (Hirtle et al. [2009]; Hanson et al. [2011]; and Greenlaw et al. [2012]).
When conducting a stress test, regulatory authorities typically employ a two-pronged approach. In the "bottom-up" approach, the models used to estimate losses and revenues employ proprietary granular data on institution-specific portfolios--provided by the banks under the condition of strict confidentiality--which contain detailed information about individual loan characteristics. A complementary approach involves the "top-down" models, which rely on the bank-level income and balance sheet data to generate estimates of the institution-specific and industry-wide losses and revenues. The results of the top-down stress testing models are particularly useful to benchmark the aggregated results from the bottom-up models, as well as to evaluate the banks' proposed capital plans under different macroeconomic scenarios.1
In a top-down stress testing exercise--the primary focus of this paper--the paths of macroeconomic variables corresponding to a particular stress scenario are typically mapped into bank-specific capital outcomes using (log-) linear time-series and/or panel-data econometric models. Although used extensively by regulatory authorities around the world, linear top-down models have some important shortcomings. In particular, an often-mentioned criticism of such models points to their inability to capture the nonlinear behavior of bank losses during periods of financial distress, dynamics that can generate significant capital shortfalls and which are an important feature of the boom-bust nature of credit-driven cyclical fluctuations; see Drehmann et al. [2007] for a thorough discussion.
Our paper aims to improve on this aspect of the top-down stress-testing approach. Specifically, we propose a dynamic panel quantile econometric framework for the major components of net charge-offs and pre-provision net revenue and use it to estimate the density forecasts of banks' regulatory capital ratios under a pre-specified stress scenario. This top-down approach, which is well-suited for capturing the nonlinear aspect of bank losses during cyclical downturns, does indeed generate density forecasts for losses that have relatively heavy right tails in periods of macroeconomic stress, a distinct feature of the data that is impossible to capture with the standard linear regression framework. In particular, we estimate a strong nonlinear effect in losses for several key loan portfolios, as well as in trading income, an especially volatile and cyclically-sensitive component of bank profits.
In our framework, the nonlinear behavior of losses is driven importantly by the dynamics of the loss process because the impact of the lagged response variable in a dynamic quantile model is generally estimated to be increasing in the quantiles of the innovation process. This result implies that an adverse shock to the credit quality of, for example, the residential real estate loan portfolio makes the associated charge-offs more persistent, an effect that significantly increases the thickness of the right tail of the density forecast for such losses. Furthermore, as the out-of-sample forecast horizon expands, this mechanism is amplified because a bank that draws a sequence of such negative shocks would see its losses escalate sharply during a relatively short period of time.
In a dynamic linear model, by contrast, the degree of persistence is invariant to the size of underlying shocks, and the density forecasts generated using linear panel-data models have much thinner tails. In fact, according to our pseudo out-of-sample forecasting exercise, the realized net charge-offs during the 2007-09 financial crisis are inside the multi-step-ahead density forecasts implied by the dynamic quantile model, but they are frequently outside the density forecasts generated using the corresponding linear model, especially for the loan portfolios most affected by the recent crisis. These results provide a compelling argument that focusing on the conditional mean forecast is unlikely to reveal the full extent of expected losses during a period of deteriorating economic conditions and that stress tests should pay careful attention to outcomes at the tails of the distribution.
A key objective of stress tests is to determine whether banks' regulatory capital ratios will remain above a specified minimum threshold over the forecast horizon implied by a severe, but plausible, macroeconomic scenario. An important contribution of our top-down stress testing approach is that we use simulation methods to generate the density forecasts for bank losses and revenues--and the implied density forecast for regulatory capital--objects that provide a complete description of the uncertainty associated with our forecasts. By focusing on the density forecasts--as opposed to the point forecasts as is typically done in practice--we obtain an estimate of the probability distribution of all possible values of the variables of interest, conditional on a given macroeconomic scenario; for example, by estimating the conditional distribution of regulatory capital outcomes, we can calculate the probability that a bank would violate the specified capital threshold at any point during the forecast horizon. We can also calculate the expected capital shortfall, the amount of capital a bank would need to raise, on average, to ensure that it will not violate a regulatory capital requirement under a given macro scenario.
To evaluate the methodology proposed in the paper, we perform a pseudo stress test. Specifically, for a panel of large U.S. bank holding companies (BHCs), we estimate a trajectory of projected capital shortfalls, conditional on the severely adverse macroeconomic scenario specified by the Federal Reserve in the actual stress test, the Comprehensive Capital Analysis and Review (CCAR) conducted in early 2012. Under these conditioning assumptions, our simulations indicate that the quantile autoregressive framework generates considerably higher capital shortfalls than those implied by the corresponding linear specification. In combination with more accurate out-of-sample forecasts, this result suggests that the top-down models based on quantile autoregressions have higher odds of identifying emerging vulnerabilities in the financial system compared with their linear counterparts and thus may prove to be more reliable early-warning systems.
This paper fits into the rapidly growing literature on applied macro stress testing. Comprehensive reviews of the major methodologies used for macro stress testing, some of which are related to the class of models studied in this paper, are provided by Sorge [2004]; Sorge & Virolainen [2006]; and Drehmann [2009]. Cihák [2007] offers an overview of a typical stress testing process for both the top-down and bottom-up approaches, while Foglia [2009] considers institutional aspects by reviewing current stress-testing practices across various jurisdictions. A critique of stress tests is put forward by Alfaro & Drehmann [2009] and Borio et al. [2011], who argue that the current "state-of-the-art" stress-testing methodologies are ill-suited for identifying emerging financial imbalances and vulnerabilities ex ante, that is, during normal economic times.
To address these concerns, Schechtman & Gaglianone [2012] argue that stress-testing exercises should focus on the conditional right-tail of credit losses--as opposed to the conditional mean--estimated using quantile regressions. However, they find that the results based on quantile regressions are very similar to those based on the canonical portfolio credit risk models discussed by Wilson [1997a,b]. Our paper expands their basic idea of combining density forecasts and quantile regressions in several important directions. First, we conduct our analysis using dynamic panel quantile regressions. Second, we use the framework to generate multi-step-ahead density forecasts, as opposed to only one-step-ahead, which are needed to generate significant differences between the density forecasts derived from the quantile model and those constructed using the linear model. By combining these two approaches, we find that the dynamic panel quantile regression model is able to generate much more realistic capital shortfalls in periods of macroeconomic stress.2
The rest of the paper is organized as follows. Section 2 briefly overviews the institutional background surrounding bank stress tests in the United States. Section 3 outlines our econometric framework, namely, the fixed effects dynamic panel quantile regression model. In Section 4, we describe the bank-level data used in the analysis. Section 5 contains the main estimation results and evaluates the out-of-sample forecasting ability of the quantile framework and compares it with that of a benchmark linear model. In Section 6, we assess the practicality of the quantile framework by estimating the projected capital shortfalls at the largest U.S. banks for the period covered by the CCAR 2012. Section 7 concludes.
2 An Overview of U.S. Bank Stress Tests
Within the U.S. macroprudential framework, the main objective of a stress test is to provide regulators and financial markets participants with an accurate assessment of the capital adequacy of the largest U.S. banking holding companies. At the time of writing this paper, the results of the most recent U.S. stress test (CCAR 2012) were released in mid-March of 2012; prior to that, the capital adequacy of the banking system was also formally assessed on two other occasions: CCAR of March 2011 and the Supervisory Capital Assessment Program (SCAP) of May 2009. The organizing design principle of these three stress tests, and those that have followed, was to evaluate formally whether the participating institutions will be able to maintain--over a specified forecast horizon--sufficient capital to support the credit needs of borrowers in the case of a severe deterioration in economic conditions.3
The design and implementation of such a stress test takes course over about four months and requires a considerable amount of resources, both from the regulatory agencies and from the institutions involved in the exercise. Initially, the Federal Reserve formulates a severely adverse macroeconomic and financial market scenario, which is provided to the participating institutions. At the same time, the participating BHCs submit extensive data with information on their loan and securities portfolios to the Federal Reserve. These data are then used as inputs to a variety of top-down and bottom-up statistical models developed by staff at the Federal Reserve to generate projections for losses and net revenues.
While the staff at the Federal Reserve is conducting the analysis, banks submit their capital plans with proposed dividend payouts, share repurchases, and redemption of trust preferred securities. The Federal Reserve then uses its own projections for losses, net revenues, and the banks' own capital plans to construct the path of the expected regulatory capital ratios under the supervisory stress scenario over the subsequent nine quarters. The key requirement for a bank to pass
Notes: The solid line shows the aggregate tier 1 common ratio (T1CR) for the 19 BHCs that participated in the SCAP, CCAR 2011, and CCAR 2012 stress tests; the dotted lines shows the aggregate T1CR of all other U.S. BHCs. T1CR is defined as the ratio of tier 1 common ca pital to total risk-weighted assets. The following 19 BHCs participated in the three stress tests: Ally Financial Inc.; American Express Company; Bank of America Corporation; The Bank of New York Mellon Corporation; BB&T Corporation; Capital One Financial Corporation; Citigroup Inc.; Fifth Third Bancorp; The Goldman Sachs Group, Inc.; JPMorgan Chase & Co.; Keycorp; MetLife, Inc.; Morgan Stanley; The PNC Financial Services Group, Inc.; Regions Financial Corporation; State Street Corporation; SunTrust Banks, Inc.; U.S. Bancorp; and Wells Fargo & Company. The vertical lines labeled SCAP, CCAR 2011, and CCAR 2012 correspond to dates when the results of the stress tests were released to the public; the shaded vertical bar represents the 2007-09 recession as dated by the NBER.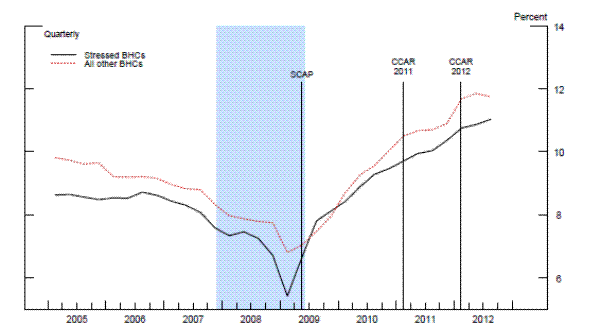
the stress test is that its projected tier 1 common capital ratio (T1CR) under the severely adverse macroeconomic scenario must stay above 5 percent throughout the forecasting horizon.4 However, each institution also has to maintain tier 1 capital and total capital above minimum regulatory capital ratios of 4 and 8 percent, respectively. In addition, for a BHC with a composite supervisory ratio of "1," or one that is subject to the Federal Reserve Board's market risk rule, the minimum tier 1 leverage ratio is 3 percent; otherwise the required minimum leverage ratio is 4 percent.
The three bank stress tests conducted by the Federal Reserve during the sample period under consideration (SCAP, CCAR 2011, and CCAR 2012) have been responsible in large part for the significant improvement in the capital position of the U.S. commercial banking sector since the nadir of the 2007-09 financial crisis. According to the solid line in Figure 1, the aggregate T1CR of the 19 institutions that participated in the three stress tests--which by the end of the first quarter of 2009 fell dangerously close to 5 percent due to massive write-downs of mortgage-related (and other) assets--almost doubled over the subsequent two years. The substantially enhanced resiliency of the banking sector implied by the increase in this key indicator of the loss-absorbing capacity since the end of the recession was mainly driven by the issuance of common equity and increased retained earnings, financial decisions that the "stressed" institutions undertook partly in response to restrictions on dividend payouts and share repurchases imposed by the Federal Reserve, which were based on the outcomes of the stress tests.5
3 Econometric Methodology
This section describes our econometric methodology. We consider two types of top-down macro stress-testing models: (1) the fixed effects quantile autoregression model (FE-QAR); and (2) the canonical fixed effects dynamic linear panel model (FE-OLS), which is used as a benchmark. We use these two models to generate predictions for net charge-offs of loan portfolios and the major components of pre-provision net revenue. These projections are key inputs needed to generate the density forecasts for the tier 1 common regulatory capital ratio, objects that are used to assess the capital adequacy of individual banks under different macroeconomic scenarios.
Let
![]() and
and
![]() index the cross-sectional and time-series dimensions of the panel, respectively, and let
index the cross-sectional and time-series dimensions of the panel, respectively, and let
![]() denote a sequence of standard uniform random variables, assumed to be i.i.d. across
denote a sequence of standard uniform random variables, assumed to be i.i.d. across ![]() and
and ![]() .6 Given the paper's
focus on macro stress tests, we consider the following fixed effects dynamic random coefficients specification:
.6 Given the paper's
focus on macro stress tests, we consider the following fixed effects dynamic random coefficients specification:
In this context,
As shown by Koenker & Xiao [2006], if the right-hand side of equation (1) is monotone increasing in ![]() , the
conditional quantile function of
, the
conditional quantile function of ![]() is given by
is given by

where ![]() denotes a quantile in the interval
denotes a quantile in the interval ![]() . In
equation (2), the coefficients on lags of the response variable, the coefficients of the bank-specific covariates
. In
equation (2), the coefficients on lags of the response variable, the coefficients of the bank-specific covariates
![]() , and the coefficients on the macroeconomic factors
, and the coefficients on the macroeconomic factors
![]() are allowed to vary over the different quantiles of the innovation process. Under homoskedastic errors, the variation in the coefficients on the forcing variables
are allowed to vary over the different quantiles of the innovation process. Under homoskedastic errors, the variation in the coefficients on the forcing variables
![]() and
and
![]() shifts the location of the conditional distribution of
shifts the location of the conditional distribution of ![]() in
response to bank-specific and macroeconomic developments, whereas the variation in the coefficients on the lagged response variable allows for the change in the scale and shape of the distribution over time.8
in
response to bank-specific and macroeconomic developments, whereas the variation in the coefficients on the lagged response variable allows for the change in the scale and shape of the distribution over time.8
We argue that realistic macro stress tests should take into account such distributional shifts of bank losses and/or profits because such effects--which may reflect asymmetric dynamics and local persistency--are especially important during periods of financial distress. In particular, the type
of top-down models studied in this paper can generate unit-root-like tendencies or even temporarily explosive behavior, dynamics that are impossible to capture with the standard linear regression models.9 Suppose, for example, that the variable being stressed is the charge-off rate on residential real estate loan portfolio and for simplicity consider just a first-order quantile autoregression. If the autoregressive coefficient
![]() is an increasing function of the quantiles
is an increasing function of the quantiles
![]() , an adverse shock to charge-offs will increase the persistence of credit losses going forward, a development that will ultimately increase the heaviness of the right tail
of the conditional distribution of charge-offs on such loans. In contrast, an unexpected positive development in credit quality will reduce the persistence of the series, thereby accelerating the reversion of charge-offs to their long-run mean.
, an adverse shock to charge-offs will increase the persistence of credit losses going forward, a development that will ultimately increase the heaviness of the right tail
of the conditional distribution of charge-offs on such loans. In contrast, an unexpected positive development in credit quality will reduce the persistence of the series, thereby accelerating the reversion of charge-offs to their long-run mean.
This feature of the FE-QAR model allows it to capture the type of asymmetry that is a distinctive characteristic of credit losses, which exhibit significant persistence during cyclical downturns but decline fairly quickly as economic conditions improve. Another attractive feature of the FE-QAR
model is that it naturally generates a forecast of the entire distribution of the ![]() , without specifying any assumptions about the parametric form of the conditional distribution of the
response variable (see Gaglianone & Lima [2012] details). As emphasized by Diebold et al. [1998], density forecasts are important because they allow the calculation of value-at-risk and expected shortfalls,
statistics of central importance in risk management and capital planning.10
, without specifying any assumptions about the parametric form of the conditional distribution of the
response variable (see Gaglianone & Lima [2012] details). As emphasized by Diebold et al. [1998], density forecasts are important because they allow the calculation of value-at-risk and expected shortfalls,
statistics of central importance in risk management and capital planning.10
The estimation of the FE-QAR model in equation (2) for quantiles
![]() is complicated by the presence of
is complicated by the presence of
![]() , the vector of "incidence" parameters capturing the unobservable heterogeneity in
, the vector of "incidence" parameters capturing the unobservable heterogeneity in ![]() across banks, which, as in the linear model, cannot be eliminated by transforming all regression variables as deviations from their bank-specific means. To solve this problem, Koenker [2004] introduces a class of penalized estimators--denoted by the vector
across banks, which, as in the linear model, cannot be eliminated by transforming all regression variables as deviations from their bank-specific means. To solve this problem, Koenker [2004] introduces a class of penalized estimators--denoted by the vector
![]() --as the solution to the following minimization problem:
--as the solution to the following minimization problem:
![\displaystyle [\widehat{\boldsymbol{\alpha}}^{\prime}, \widehat{\boldsymbol{\theta}}(\pi_{q})^{\prime}] = \argmin_{\boldsymbol{\alpha}^{\prime},\boldsymbol{\theta}(\pi_{q})^{\prime}} \; \sum_{q=1}^{Q} \sum_{t=1}^{T} \sum_{i=1}^{N} \omega_{q} \rho_{\pi_{q}} \biggl(Y_{it} - \alpha_{i} - \mu(\pi_{q}) - \sum_{s=1}^k \phi_s(\pi_{q}) Y_{i,t-s} - \boldsymbol{\beta}(\pi_{q})^{\prime} \boldsymbol{X}_{i,t-1} - \boldsymbol{\gamma}(\pi_{q})^{\prime} \mathbf{Z}_{t} \biggr) + \lambda \sum_{i=1}^{N} \vert\alpha_{i}\vert,](img29.gif)
|
(3) |
where
 |
is the piecewise linear quantile function of the prediction error
Standard inference in this class of models is complicated due to the presence of the penalty function used to shrink the bank fixed effects. To overcome this issue, we use the stationary bootstrap of Politis & Romano [1994] to construct confidence
intervals for the estimated parameters of the FE-QAR model. Specifically, the bootstrap scheme consists of the following steps. First, we resample from the data matrix blocks of random size of time-series indexes
![]() , where the length of each block has a geometric distribution with a mean of four quarters. This preserves some of the residual serial correlation that is evident in
the original data. Using these blocks, we then construct
, where the length of each block has a geometric distribution with a mean of four quarters. This preserves some of the residual serial correlation that is evident in
the original data. Using these blocks, we then construct ![]() time-series observations, which are used to build the synthetic panel of
time-series observations, which are used to build the synthetic panel of ![]() observations. In the last step, we re-estimate the FE-QAR model using the synthetic panel. This procedure is repeated 5,000 times, and the boundaries of the (approximate) 95-percent confidence intervals of the estimated
coefficients reported below correspond to the 125th lowest and 4,875th highest values of the corresponding model coefficients across the 5,000 replications.
observations. In the last step, we re-estimate the FE-QAR model using the synthetic panel. This procedure is repeated 5,000 times, and the boundaries of the (approximate) 95-percent confidence intervals of the estimated
coefficients reported below correspond to the 125th lowest and 4,875th highest values of the corresponding model coefficients across the 5,000 replications.
As a benchmark for the FE-QAR model, we consider a standard dynamic panel linear regression with bank fixed effects (FE-OLS):
where
3.1 Density Forecasts
To generate the density forecasts for the FE-QAR and FE-OLS models used in our empirical analysis, we employ a resampling scheme, designed to preserve the cross-sectional and time-series dependence across the various types of charge-offs, revenue components, and banks in our sample.
Specifically, let
![]() ,
,
![]() denote the full set of "residuals" from the estimated quantile models, where
denote the full set of "residuals" from the estimated quantile models, where
![]() indexes the FE-QAR models corresponding to the various charge-off rates and revenue components. For the
indexes the FE-QAR models corresponding to the various charge-off rates and revenue components. For the ![]() -th model, these residuals, according to equations (1) and (2), are obtained by solving numerically for
-th model, these residuals, according to equations (1) and (2), are obtained by solving numerically for
![]() the equation
the equation
 |
for
A potential problem with this approach is that the estimated conditional quantile function in equation (2) can, in finite samples, exhibit a "quantile crossing" problem. In other words,
![]() is not monotonically increasing in the quantiles of the innovation process--that is,
is not monotonically increasing in the quantiles of the innovation process--that is,
![]() for some
for some
![]() . To deal with this problem, we follow Chernozhukov et al. [2010] and sort the estimated conditional quantile
function in order to to make it monotone.14 In addition, because the conditional quantile function is estimated on a discrete grid of
. To deal with this problem, we follow Chernozhukov et al. [2010] and sort the estimated conditional quantile
function in order to to make it monotone.14 In addition, because the conditional quantile function is estimated on a discrete grid of ![]() quantiles and the random draws
quantiles and the random draws ![]() s are continuous, we use a piecewise cubic Hermite
polynomial to evaluate the estimated conditional quantiles at the values of
s are continuous, we use a piecewise cubic Hermite
polynomial to evaluate the estimated conditional quantiles at the values of ![]() that lie between the percentiles of the grid.
that lie between the percentiles of the grid.
Using this set of residuals, we construct 25,000 bootstrap samples of new residuals, indexed by ![]() and denoted by
and denoted by
![]() , by resampling blocks of random size of time-series indexes
, by resampling blocks of random size of time-series indexes
![]() from the set of residuals for each of the
from the set of residuals for each of the ![]() models.
Specifically, the first time index
models.
Specifically, the first time index ![]() is chosen randomly from the index set
is chosen randomly from the index set
![]() . To capture some of the residual serial correlation evident in the original data, the
. To capture some of the residual serial correlation evident in the original data, the ![]() time index corresponds to the next observation in the original time-series with probability
time index corresponds to the next observation in the original time-series with probability ![]() , while with probability
, while with probability ![]() , the next observation is chosen randomly. We continue this process until we have
, the next observation is chosen randomly. We continue this process until we have ![]() time-series indexes. For
all simulations reported in the paper, we set
time-series indexes. For
all simulations reported in the paper, we set ![]() , though the results based on
, though the results based on ![]() are very similar.
are very similar.
For the ![]() -th FE-QAR model, the one-step-ahead forecast made at time
-th FE-QAR model, the one-step-ahead forecast made at time ![]() corresponds to a random draw from the conditional quantile function
corresponds to a random draw from the conditional quantile function
![]() , which is calculated as
, which is calculated as
and where
For the two-step-ahead forecast, we iterate equation (5) forward to calculate
where
The bootstrap procedure for the benchmark FE-OLS models follows the same steps but uses the set of OLS residuals
![]() ,
,
![]() , from the corresponding
, from the corresponding
![]() linear models to construct the 25,000 replication samples. Specifically, the one-step-ahead forecast from the FE-OLS model is given by
linear models to construct the 25,000 replication samples. Specifically, the one-step-ahead forecast from the FE-OLS model is given by
where
4 Data
To implement the methodology described above, we use the Consolidated Financial Statements for Bank Holding Companies (the FR Y-9C form) and the Consolidated Reports of Condition and Income (the FFIEC 031/041 form) for commercial banks published by the Federal Reserve to construct a balanced panel for 15 large U.S. BHCs, covering the period from 1997:Q1 to 2011:Q4 (see Table 4 for the list of institutions included in the analysis). To be included in the panel, an institution must have reported total consolidated assets of $50 billion or more at the end of the sample period, a size-cutoff that is consistent with the stress-testing requirements mandated by the 2010 Dodd-Frank financial-overhaul law.
Starting with this initial list, we then eliminated a small number of custodian banks and banks that engage almost exclusively in credit card lending; we also eliminated institutions that have only recently become bank holding companies (Goldman Sachs, Morgan Stanley, and Ally Financial (formerly known as GMAC LLC)). These selection criteria reflect two considerations: First, credit card and custodian banks operate by a very different business model compared with the BHCs included in our sample.15 Second, the relatively limited time span of data available for institutions that registered as bank holding companies in response to the sharp escalation in financial turmoil following the collapse of Lehman Brothers in the early autumn of 2008 would require an instrumental variable estimation approach to obtain consistent estimators for dynamic panel data models considered in this paper (cf. Arellano & Bond [1991] and Galvão Jr. [2011]). Accordingly, we estimate both the FE-OLS and FE-QAR models using a balanced panel of 15 BHCs; it would be, however, relatively straightforward to augment our models to accommodate different types of banks and institutions for which data are available over shorter time periods.16
Table 1: Panel Composition, 1997:Q1-2011:Q4
| Bank Holding Company | Ticker | Assets |
| Bank of America | BAC | 2,136.6 |
| BB&T Corporation | BBT | 174.6 |
| Citigroup Inc. | C | 1,873.9 |
| Citizens Financial | RBS | 129.8 |
| Comerica Inc. | CMA | 61.1 |
| Fifth Third Bancorp | FITB | 117.0 |
| JPMorgan Chase & Co. | JPM | 2,265.8 |
| KeyCorp | KEY | 88.8 |
| M&T Bank Corp. | MTB | 77.9 |
| PNC Financial Services Group | PNC | 271.4 |
| Regions Financial Corporation | RF | 127 |
| SunTrust Banks Inc. | STI | 176.9 |
| U.S. Bancorp | USB | 340.1 |
| Wells Fargo & Company | WFC | 1,313.9 |
| Zions Bancorporation | ZION | 53.2 |
![]() Total consolidated assets ($billions) at the end of 2011:Q4.
Total consolidated assets ($billions) at the end of 2011:Q4.
In terms of target variables for bank losses, we model quarterly net charge-off rates for eight major loan categories. For each category, the net charge-off rate is defined as charge-offs net of recoveries, scaled by average loans during the corresponding quarter. The eight loan categories are
as follows: (1) C&I = commercial & industrial; (2) CLD = construction & land development; (3) MF = multifamily real estate; (4) CRE = (nonfarm) nonresidential commercial real estate; (5) HLC = home equity lines of credit (HELOCs);
(6) RRE = residential real estate, excluding HELOCs; (7) CC = credit card; and (8) CON = consumer, excluding credit card loans.17 On the revenue side, we consider the following six components of pre-provision net revenue (PPNR): (1) NII = net interest income; (2) TI = trading income; (3) ONII = noninterest income, excluding trading income; (4) CE =
compensation expense; (5) FA = fixed assets expense; and (6) ONIE = other noninterest expense. Each quarterly component of PPNR is scaled by the average total assets during the corresponding quarter.18 All told, we are considering 14 different models--in terms of our notation in Section 3, therefore, ![]() .
.
Table 2:Summary Statistics of Selected Bank Characteristics
| Bank Characteristic | Mean | SD | Min | P50 | Max |
| Charge-off rates by type of loan (%): Commercial & industrial (C&I) | 1.08 | 1.37 | -0.33 | 0.67 | 13.0 |
| Charge-off rates by type of loan (%): Construction & land development (CLD) | 1.31 | 2.99 | -3.17 | 0.09 | 33.1 |
| Charge-off rates by type of loan (%): Multifamily real estate (MF) | 0.51 | 1.61 | -1.15 | 0.04 | 26.8 |
| Charge-off rates by type of loan (%): Nonresidential commercial real estate (CRE) | 0.41 | 1.11 | -4.37 | 0.10 | 14.6 |
| Charge-off rates by type of loan (%): Home equity lines of credit (HLC) | 0.64 | 1.01 | -0.29 | 0.19 | 7.00 |
| Charge-off rates by type of loan (%): Residential real estate (RRE) | 0.64 | 0.96 | -0.77 | 0.20 | 9.12 |
| Charge-off rates by type of loan (%): Credit card (CC) | 4.38 | 3.71 | -18.8 | 3.93 | 43.2 |
| Charge-off rates by type of loan (%): Consumer, excl. credit card (CON) | 1.23 | 1.21 | -0.67 | 0.90 | 8.71 |
| Pre-provision net revenue (% of assets): Net interest income (NII) | 3.28 | 0.60 | 1.42 | 3.32 | 4.98 |
| Pre-provision net revenue (% of assets): Trading income (TI) | 0.09 | 0.24 | -2.51 | 0.05 | 0.92 |
| Pre-provision net revenue (% of assets): Noninterest income (ONII) | 2.01 | 0.71 | -0.61 | 1.92 | 5.84 |
| Pre-provision net revenue (% of assets): Compensation expense (CE) | 1.59 | 0.25 | -0.16 | 1.61 | 2.66 |
| Pre-provision net revenue (% of assets): Fixed assets expense (FA) | 0.41 | 0.08 | 0.15 | 0.40 | 0.68 |
| Pre-provision net revenue (% of assets): Other noninterest expense (ONIE) | 1.17 | 0.41 | -0.16 | 1.11 | 3.67 |
| Selected loan shares (% of interest-earning assets): Commercial & industrial | 16.6 | 8.3 | 1.9 | 15.6 | 48.8 |
| Selected loan shares (% of interest-earning assets): Commercial real estate |
17.3 | 10.3 | 0.6 | 15.9 | 49.4 |
| Selected loan shares (% of interest-earning assets): Residential real estate |
21.3 | 7.9 | 4.6 | 21.0 | 49.4 |
| Selected loan shares (% of interest-earning assets): Credit card | 2.4 | 3.2 | 0.0 | 1.0 | 18.9 |
| Selected loan shares (% of interest-earning assets): Consumer, excl. credit card | 8.0 | 3.5 | 0.8 | 8.1 | 18.6 |
NOTE: Sample period: 1997:Q1-2011:Q4
Table 4 contains the selected summary statistics for the bank-specific variables used in the empirical analysis. Although loan write-downs are, on average, noticeably higher for credit card (CC) and construction and land development (CLD) loans, charge-off rates for all major loan categories exhibit significant variability, which mainly reflects the cyclical nature of bank losses. On the profit side of the income statement, more than one-half of revenues are, on average, generated by interest-earning assets (NII), a fact consistent with the composition of our panel, which primarily includes institutions engaged in traditional banking activities. On the cost side, the largest item of pre-provision net revenue is compensation expense, another cyclically-sensitive components of bank profits. Lastly, note that the eight loan categories included in our analysis account, on average, for more than 65 percent of interest-earning assets on banks' books.
The set of macroeconomic and financial variables used in the forecast exercise includes the following eight quarterly series: (1) real gross domestic product (GDP); (2) civilian unemployment rate (UR); (3) the CoreLogic house price index (
![]() ); (4) the National Council of Real Estate Investment Fiduciaries (NCREIF) transactions-based price index for commercial real estate (
); (4) the National Council of Real Estate Investment Fiduciaries (NCREIF) transactions-based price index for commercial real estate (
![]() ); (5) 3-month Treasury yield (
Treas
); (5) 3-month Treasury yield (
Treas![]() ); (6) 10-year Treasury yield (
Treas
); (6) 10-year Treasury yield (
Treas![]() ); (7) 10-year yield on BBB-rated corporate bonds (
BBB
); (7) 10-year yield on BBB-rated corporate bonds (
BBB![]() ); and (8) the Chicago Board Options Exchange (CBOE) implied volatility of the S&P 500 option index (VIX). The set of macroeconomic variables is restricted to include
only variables available in the scenarios provided by the Federal Reserve to the BHCs that participated in the first three comprehensive stress-testing exercises.
); and (8) the Chicago Board Options Exchange (CBOE) implied volatility of the S&P 500 option index (VIX). The set of macroeconomic variables is restricted to include
only variables available in the scenarios provided by the Federal Reserve to the BHCs that participated in the first three comprehensive stress-testing exercises.
5 Results
Before delving into our main results, we present estimates of our benchmark (FE-OLS) model. Following Guerrieri & Welch [2012], the number of lags of the dependent variable in each specification is set equal to four. The remaining bank-specific variables and
the set of macroeconomic factors included in each specification were selected according to the Bayesian information criterion (BIC). To keep specifications relatively parsimonious, the only other bank-specific variables considered (i.e., the vector
![]() ) were the portfolio shares of the major loan categories (see Table 4), which proved to be important determinants for some of the
components of PPNR. In the specification search, we allowed lags of the macroeconomic variables to enter in each model specification, but in the vast majority of cases, the BIC selected only the contemporaneous value of the relevant macroeconomic factors.
) were the portfolio shares of the major loan categories (see Table 4), which proved to be important determinants for some of the
components of PPNR. In the specification search, we allowed lags of the macroeconomic variables to enter in each model specification, but in the vast majority of cases, the BIC selected only the contemporaneous value of the relevant macroeconomic factors.
According to the entries in Table 5, the coefficients on the macroeconomic factors have economically intuitive signs and almost all are statistically significant at conventional levels. The cyclical sensitivity of loan loss rates is evidenced by the fact that most
charge-off rates load negatively on the year-over-year growth in real output
![]() GDP
GDP![]() or positively on the year-over-year change in the unemployment rate
or positively on the year-over-year change in the unemployment rate
![]() UR
UR![]() . In addition, charge-off rates for loan categories involving real
estate--both commercial and residential (CLD, MF, CRE, HLC, and RRE)--exhibit significant sensitivity to movements in the price of the underlying collateral.
. In addition, charge-off rates for loan categories involving real
estate--both commercial and residential (CLD, MF, CRE, HLC, and RRE)--exhibit significant sensitivity to movements in the price of the underlying collateral.
Table 3: Benchmark Model (FE-OLS) Estimates
| Dependent Variables: Net Charge-off Rates and Components of Pre-Provision Net Revenue: C&I | Dependent Variables: Net Charge-off Rates and Components of Pre-Provision Net Revenue:CLD | Dependent Variables: Net Charge-off Rates and Components of Pre-Provision Net Revenue:MF | Dependent Variables: Net Charge-off Rates and Components of Pre-Provision Net Revenue:CRE | Dependent Variables: Net Charge-off Rates and Components of Pre-Provision Net Revenue:HLC | Dependent Variables: Net Charge-off Rates and Components of Pre-Provision Net Revenue:RRE | Dependent Variables: Net Charge-off Rates and Components of Pre-Provision Net Revenue:CC | Dependent Variables: Net Charge-off Rates and Components of Pre-Provision Net Revenue:CON | Dependent Variables: Net Charge-off Rates and Components of Pre-Provision Net Revenue:NII | Dependent Variables: Net Charge-off Rates and Components of Pre-Provision Net Revenue:TI | Dependent Variables: Net Charge-off Rates and Components of Pre-Provision Net Revenue:ONII | Dependent Variables: Net Charge-off Rates and Components of Pre-Provision Net Revenue:CE | Dependent Variables: Net Charge-off Rates and Components of Pre-Provision Net Revenue:FA | Dependent Variables: Net Charge-off Rates and Components of Pre-Provision Net Revenue:ONIE | |
| Explanatory Variable: Dep. variable at |
0.427 | 0.377 | 0.213 | 0.443 | 0.588 | 0.464 | 0.373 | 0.431 | 0.498 | 0.251 | 0.357 | 0.558 | 0.461 | 0.340 |
| Explanatory Variable: Dep. variable at |
[5.2] | [3.5] | [1.4] | [4.1] | [12.0] | [4.0] | [6.7] | [5.4] | [6.5] | [1.7] | [5.4] | [7.8] | [7.7] | [14.9] |
| Explanatory Variable: Dep. variable at |
0.266 | 0.262 | 0.287 | 0.314 | 0.376 | 0.355 | 0.133 | 0.250 | 0.370 | 0.279 | 0.204 | 0.340 | 0.302 | 0.238 |
| Explanatory Variable: Dep. variable at |
[3.6] | [3.6] | [3.8] | [3.2] | [7.0] | [7.9] | [1.9] | [3.7] | [9.4] | [3.2] | [3.3] | [6.0] | [6.4] | [6.5] |
| Explanatory Variable: Dep. variable at |
0.102 | 0.152 | 0.136 | 0.108 | 0.057 | -0.013 | 0.040 | 0.085 | 0.108 | 0.013 | 0.169 | 0.041 | 0.206 | 0.209 |
| Explanatory Variable: Dep. variable at |
[2.7] | [2.5] | [1.8] | [1.3] | [1.0] | [0.2] | [0.9] | [1.6] | [1.3] | [0.3] | [2.6] | [0.9] | [3.8] | [4.8] |
| Explanatory Variable: Dep. variable at |
-0.090 | -0.023 | 0.003 | -0.123 | -0.138 | -0.049 | 0.105 | -0.043 | -0.155 | -0.058 | 0.001 | -0.095 | -0.083 | -0.034 |
| Explanatory Variable: Dep. variable at |
[1.5] | [0.3] | [0.1] | [1.3] | [4.0] | [1.4] | [1.4] | [1.0] | [2.7] | [0.9] | [0.1] | [1.7] | [2.0] | [1.2] |
| Explanatory Variable:
|
- | -0.107 | - | - | - | - | - | -0.103 | -0.024 | 0.015 | - | - | - | 0.018 |
| Explanatory Variable:
|
[1.8] | [5.3] | [3.1] | [2.2] | [2.1] | |||||||||
| Explanatory Variable:
|
0.198 | - | - | - | 0.043 | - | 0.904 | - | - | - | - | - | - | |
| Explanatory Variable:
|
[3.5] | [2.0] | [4.5] | |||||||||||
| Explanatory Variable:
|
- | - | -0.022 | - | -0.011 | -0.014 | - | - | - | - | - | - | - | - |
| Explanatory Variable:
|
[1.8] | [3.6] | [4.3] | |||||||||||
| Explanatory Variable:
|
- | -0.035 | -0.012 | -0.014 | - | -0.008 | - | - | - | - | - | - | - | - |
| Explanatory Variable:
|
[3.2] | [1.8] | [3.9] | [4.0] | ||||||||||
| Explanatory Variable:
Treas |
- | - | - | - | - | - | - | - | - | 0.039 | -0.024 | - | 0.003 | - |
| Explanatory Variable:
Treas |
[2.5] | [2.8] | [2.1] | |||||||||||
| Explanatory Variable:
|
- | - | - | - | - | - | - | - | 0.068 | -0.042 | -0.023 | - | 0.004 | - |
| Explanatory Variable:
|
[2.8] | [2.6] | [1.8] | [2.4] | ||||||||||
| Explanatory Variable:
|
0.101 | - | - | - | - | - | - | - | -0.068 | 0.046 | - | - | - | - |
| Explanatory Variable:
|
[2.5] | [3.5] | [2.4] | |||||||||||
| Explanatory Variable:
|
- | - | - | - | - | - | - | - | 0.034 | -0.098 | -0.127 | -0.038 | - | -0.059 |
| Explanatory Variable:
|
[1.6] | [2.9] | [2.4] | [3.3] | [2.2] | |||||||||
| Explanatory Variable:
VIX |
- | - | - | - | - | - | - | - | - | - | - | - | - | 0.004 |
| Explanatory Variable:
VIX |
[3.3] | |||||||||||||
| Adj. |
0.78 | 0.67 | 0.40 | 0.61 | 0.92 | 0.79 | 0.52 | 0.78 | 0.93 | 0.50 | 0.71 | 0.80 | 0.86 | 0.65 |
| CD-test |
0.00 | 0.00 | 0.00 | 0.00 | 0.00 | 0.00 | 0.00 | 0.00 | 0.00 | 0.00 | 0.00 | 0.00 | 0.46 | 0.00 |
NOTE: Sample period: 1997:Q1-2011:Q4; No. of banks = 15; Obs = 900. Dependent variable is the specified net charge-off rate or a component of pre-provision net revenue (PPNR) in quarter
The revenue-side target variables, by contrast, appear to be much more sensitive to the financial indicators used in stress scenarios. Consistent with the role of banks as maturity transformers, the slope of the yield curve
![]() Treas
Treas![]() Treas
Treas![]() is an important predictor of the banks' net interest income (NII), with the flattening of the yield curve indicating a compression of the corresponding interest margins; see English et al. [2012] for recent
discussion. In general, movements in in corporate bond credit spreads
is an important predictor of the banks' net interest income (NII), with the flattening of the yield curve indicating a compression of the corresponding interest margins; see English et al. [2012] for recent
discussion. In general, movements in in corporate bond credit spreads
![]() BBB
BBB![]() Treas
Treas![]() are also an important driver of banks' profitability, with high spreads signaling lower profitability going forward, primarily through their effect on net interest income and trading income. This finding is consistent with the recent macro-finance literature that has
emphasized the information content of credit spreads, both as timely indicators of current financial distress and indicators of future economic activity.19
are also an important driver of banks' profitability, with high spreads signaling lower profitability going forward, primarily through their effect on net interest income and trading income. This finding is consistent with the recent macro-finance literature that has
emphasized the information content of credit spreads, both as timely indicators of current financial distress and indicators of future economic activity.19
As evidenced by the relatively high ![]() s, all linear specifications fit the data quite well in sample. The high in-sample fit, however, importantly reflects the presence of the lagged
dependent variables, which captures the persistent dynamics of loan losses and most components of PPNR. Another important feature of these results is that according to the Pesaran [2004] CD-test, we reject the null hypothesis that the OLS residuals are independent across
banks in almost all cases. In addition, although each specification includes four lags of the dependent variable among the explanatory variables, standard specification tests (not reported) indicate that presence of serial correlation in residuals of most charge-off rates and components of revenue.
However, it is worth emphasizing that our bootstrap resampling scheme used to construct the density forecasts of variables of interest takes into account the dependence of residuals across time and banks, as well as across the different loan categories and components of revenue within each
bank.
s, all linear specifications fit the data quite well in sample. The high in-sample fit, however, importantly reflects the presence of the lagged
dependent variables, which captures the persistent dynamics of loan losses and most components of PPNR. Another important feature of these results is that according to the Pesaran [2004] CD-test, we reject the null hypothesis that the OLS residuals are independent across
banks in almost all cases. In addition, although each specification includes four lags of the dependent variable among the explanatory variables, standard specification tests (not reported) indicate that presence of serial correlation in residuals of most charge-off rates and components of revenue.
However, it is worth emphasizing that our bootstrap resampling scheme used to construct the density forecasts of variables of interest takes into account the dependence of residuals across time and banks, as well as across the different loan categories and components of revenue within each
bank.
We now turn to the estimation of the corresponding quantile models. For comparison purposes, the FE-QAR models use the exact same covariates as the ones of the FE-OLS specifications listed in Table 5. Figure 2 illustrates the
nonlinear aspect of autoregressive dynamics--as measured by the sum of coefficients on lagged response variable
![]() --for the selected loan loss rates and PPNR components. As shown by the solid line in the top two panels, the sum of the autoregressive coefficients for
charge-off rates on commercial and industrial (C&I) and residential real estate (RRE) loans is estimated to increase significantly across the quantiles of the innovation process. For the latter loan category moreover, the estimated degree of persistence is noticeably higher--compared with the
degree of persistence implied by the FE-OLS model (the dashed line)--across most quantiles, which suggests that a linear framework is likely inadequate to capture fully the persistence of loan losses, especially in periods of macroeconomic stress.
--for the selected loan loss rates and PPNR components. As shown by the solid line in the top two panels, the sum of the autoregressive coefficients for
charge-off rates on commercial and industrial (C&I) and residential real estate (RRE) loans is estimated to increase significantly across the quantiles of the innovation process. For the latter loan category moreover, the estimated degree of persistence is noticeably higher--compared with the
degree of persistence implied by the FE-OLS model (the dashed line)--across most quantiles, which suggests that a linear framework is likely inadequate to capture fully the persistence of loan losses, especially in periods of macroeconomic stress.
Though not shown separately for all loan categories, this form of nonlinear autoregressive dynamics is common to all eight charge-off series considered in the analysis and highlights the attractiveness of our approach: By allowing the degree of persistence to vary across the quantiles of the innovation process, periods of deteriorating credit quality generate loan loss rates that are highly
Note: The solid line in each panel depicts for the various quantil es of the innovation process the estimate of the sum of autoregressive coefficients for the selected net charge-offs and components of PPNR; the shaded bands represent the corresponding 95-percent confidence in tervals based on 5,000 bootstrap replications. The dashed line in each panel shows the estimated sum of autoregr essive coefficients from the corresponding FE- OLS model (see text for details).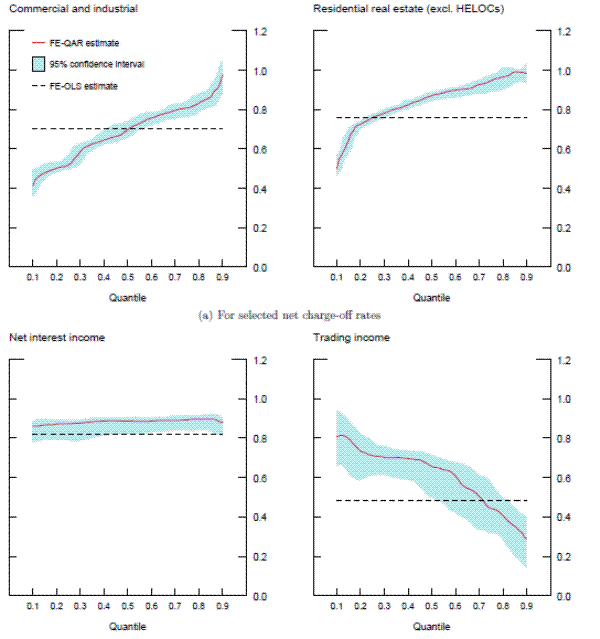
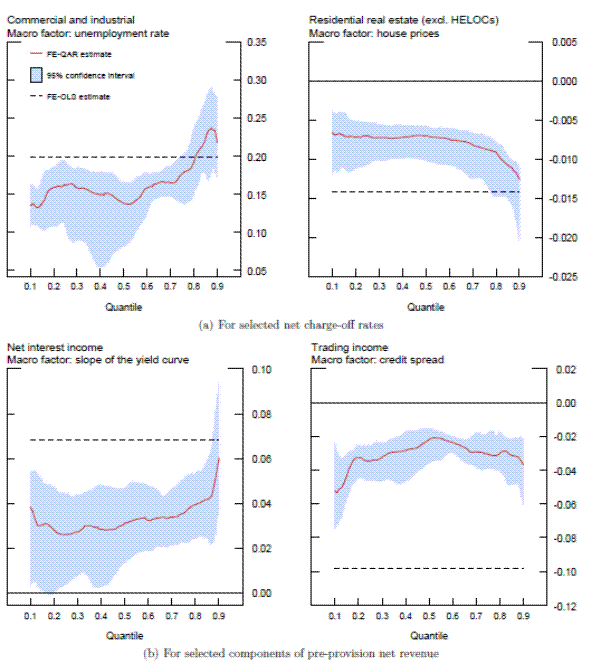
Note: The solid line in each panel depicts for the various quantiles of the innovation process the estimate of the specified macro factor on the selected charge-offs and components of PPNR ; the shaded bands represent the corresponding 95-percent confidence intervals based on 5,000 bootstrap replications. Macro factors: unemployment rate = Δ4URt;house prices=Δ4lnPtHP; slope of the yield curve = [Treast10y-Treast3m]; and credit spread = [BBBt10y]. The dashed line in each panel shows the estimated effect of the same macro factor from the corresponding FE-OLS model (see text for details).
persistent, indeed possibly explosive; at lower quantiles, in contrast, charge-off rates exhibit only a moderate degree of serial dependence, implying a relatively quick reversion to steady state.
According to the bottom two panels, this type of nonlinear behavior appears to be less important for the cyclical dynamics of pre-provision net revenue. The sum of autoregressive coefficients for net interest income (NII)--a component accounting for the largest share of PPNR--is estimated to be essentially constant across the quantiles of the innovation process; in addition, the entire range of point estimates is fairly close to that from the FE-OLS model. In contrast, trading income, a notoriously volatile component of PPNR, does exhibit local persistence effects. The intuition for this result is similar to that discussed above for charge-offs: In periods of big trading losses--that is depressed trading income--the series becomes more persistent, which will increase the heaviness of the left tail of the conditional distribution of trading income.20
Figure 3 focuses on the nonlinear impact of the macro factors. In general, the extent of nonlinearities arising from the macro forcing variables describing the stress scenario is much more limited. For example, as shown in the top left panel, the response of charge-off rates on C&I loans to changes in the unemployment rate is essentially constant across the quantiles of the innovation process. In contrast, the effect of the growth of house prices on losses associated with the residential real estate loan portfolio (top right) does become more negative at higher quantiles of the innovation process, a result that is consistent with the adverse feedback loop between mortgage-related losses and the dynamics of house prices evidenced during the 2007-09 crisis. On balance, however, the estimated sensitivity of charge-off rates on the residential real estate loan portfolio to house prices from the FE-QAR model is significantly smaller (in absolute value) than that implied by the corresponding FE-OLS model (the dashed line), which suggests that the quantile framework may be less sensitive to this type of macroeconomic shock.
A similar picture emerges when we look at the main components of pre-provision net revenue, the bottom two panels. The effect of the slope of the yield curve on net interest income (bottom left) is estimated to be essentially constant across the quantiles of the innovation process, as is the impact of the change in the BBB-Treasury credit spread on trading income. In both cases, the effect of the macro factors implied by the FE-QAR model is more muted than that estimated by the corresponding FE-OLS model. As we show later in the paper, the projections for charge-off rates and components of PPNR will be driven importantly by the degree of persistence of the underlying process. As a result, the decreased sensitivity of target variables to the macro factors implied by the FE-QAR model is more than compensated for by the increase in persistence of the response variable, especially in periods of sustained macroeconomic stress when loss rates are elevated and bank profitability is depressed.
5.1 Out-of-Sample Forecasting Performance
In this section, we examine and compare the out-of-sample forecasting performance of the two econometric frameworks. The design of the pseudo out-of-sample recursive forecasting exercise is as follows. We begin by estimating the FE-QAR and FE-OLS models for each of the eight loss series and six
components of PPNR over the 1997:Q1-2004:Q4 period. We then generate the ![]() -step-ahead density forecasts of each variable at each bank using the bootstrap procedure detailed in
Section 3. In constructing the density forecasts, the values of the forcing variables--that is, the vectors
-step-ahead density forecasts of each variable at each bank using the bootstrap procedure detailed in
Section 3. In constructing the density forecasts, the values of the forcing variables--that is, the vectors
![]() and
and
![]() --are assumed equal to their respective realized values over
--are assumed equal to their respective realized values over ![]() steps of the forecast. We then augment the initial sample period with an additional quarter of data, re-estimate all the models, and generate the new density forecasts
steps of the forecast. We then augment the initial sample period with an additional quarter of data, re-estimate all the models, and generate the new density forecasts ![]() -steps ahead.
This recursive scheme is then repeated through the end of the sample period.
-steps ahead.
This recursive scheme is then repeated through the end of the sample period.
In keeping with the top-down nature of our models, we focus on the aggregate outcomes--that is, our objective is to construct a predictive density for the aggregate net charge-off rate and aggregate pre-provision net revenue. Accordingly, the bank-specific projections are aggregated across all banks in our sample. The aggregation is performed within each draw of the resampling scheme by adding the projected losses and revenues, respectively, across the 15 banks in the sample. When constructing the industry-level losses and revenues, each institution's projected total net charge-off rate and pre-provision net revenue is weighted by the corresponding level of loans and assets, quantities that are assumed to be known at the time the forecast is made.21Figures 4-5 summarize the results of this exercise for aggregate net charge-off rates and aggregate pre-provision net revenue, respectively; the top two panels in each figure show the predictive densities for the one-quarter-ahead forecast horizon, while the bottom panels contain the corresponding densities for the four-quarter-ahead forecast horizon.
Focusing first on loan losses (Figure 4), the key difference that emerges from the two econometric approaches is the fact that the projected densities generated by the FE-QAR model exhibit significantly heavier tails, especially during the 2007-09 financial crisis. For example, the actual aggregate charge-offs for the 15 banks in our sample peaked at a 4.5 percent annual rate in 2010:Q1, a realization corresponding to the 90th percentile of the one-step-ahead density forecasts generated by the FE-QAR model (top left panel). In contrast, the realized charge-off rate is at the extreme right tail (above the 99th percentile) of the predictive density implied by the FE-OLS model (top right panel).
Note : Sample period: 1997:Q1 2011:Q4; No. of banks = 15. The jump-off date for the out-of-sample recursive forecasts is 2005:Q1. The top two panels depict the one-quarte r-ahead density forecasts of the aggregate net charge-off rate for the 15 banks in our sample implied by the FE- QAR and FE-OLS models; the bottom two panels depict the corresponding four-quarter-ahead densit y forecasts. Each density forecasts is represented by the shaded band, which represents the 1st/2.5th/5th/10th/ 25th/50th/75th/90th/95th/97.5th/99th percentiles of the predictive density generated by the FE-QAR and FE-OLS mo dels; the dashed line shows the realized value of the specified series. The shaded vertical bar in each panel represents the 2007-09 NBER-dated recession (see text for details).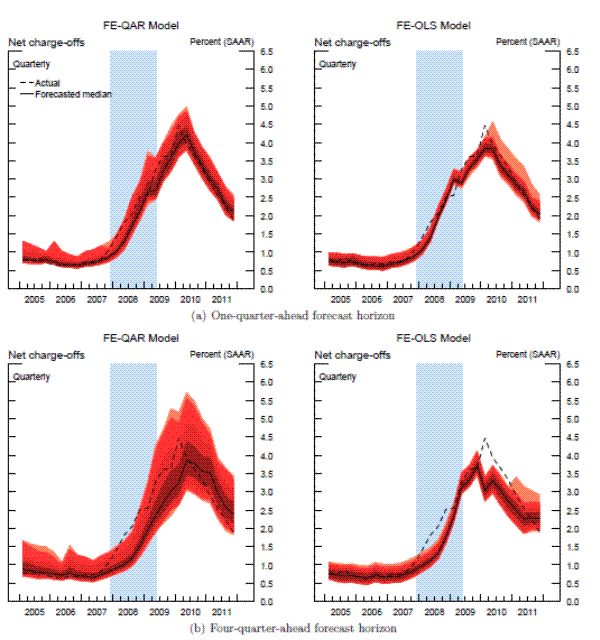
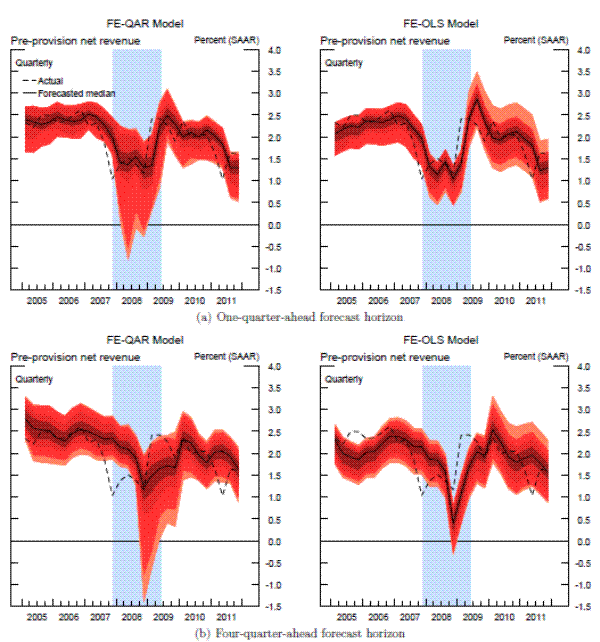
Note: Sample period: 1997:Q1 2011:Q4; No. of banks = 15. The jump-off date for the out-of-sample recursive forecasts is 2005:Q1. The top two panels depict the one-quarte r-ahead density forecasts of the aggregate PPNR for the 15 banks in our sample implied by the FE-QAR and FE-OLS models; the bottom two panels depict the corresponding four-quarter-ahead density forecasts. Each density forecasts is represented by the shaded band, which represents the 1st/2.5th/5th/10th/25th/50th/75th /90th/95th/97.5th/99th percentiles of the predictive density generated by the FE-QAR and FE-OLS models; the dashed l ine shows the realized value of the specified series. The shaded vertical bar in each panel repre sents the 2007-09 NBER-dated recession (see text for details).
A more detailed comparison reveals that the realized loan loss rates lie outside the one-quarter-ahead density forecasts generated by the FE-OLS model in the first and second quarters of 2008 and in the second and third quarters of 2009. The first half of 2008, a period of rapid deterioration in economic and financial conditions, coincides with the sharp acceleration in charge-off rates in response to the cumulative impact of adverse shocks that materialized during that period. And although broad economic and financial conditions have improved notably by 2010, the decline in charge-offs from their cyclical peak is much slower than that predicted by the FE-OLS model, a result consistent with the local persistence effects that characterize the behavior of loan losses and that are captured naturally by the autoregressive dynamics of the quantile models.
In a qualitative sense, a very similar picture emerges when one looks at the four-quarter-ahead forecast horizon, though the predictive ability of both models deteriorates somewhat as the forecast horizon lengthens. Nevertheless, the predictive density generated by the top-down quantile model is significantly wider than that implied by the corresponding linear framework at the four-quarter-ahead forecast horizon. For example, the realized charge-off rate in 2010:Q1--the cyclical peak--is at the 94th percentile of the four-quarter-ahead density forecast generated by the FE-QAR model (bottom left panel). Moreover, none of the realized charge-offs fall outside the density forecasts for the quantile model, though two quarterly observations are at the extreme right tail of the predictive density during the sharp run-up in loan losses that started in early 2008. In contrast, the realized charge-off rates during 2008 and 2010 are well outside the four-quarter-ahead predictive density implied by the FE-OLS model (bottom right panel).
It is important to emphasize that both the quantile and linear models used in this paper have a tendency to underestimate loan losses during the last financial crisis, a result that importantly reflects the unprecedented nature of macroeconomic and financial turmoil that took place during that period. This problem, however, is ameliorated appreciably through the use of the quantile framework because the projected density forecasts implied by the FE-QAR model exhibit significantly heavier tails despite the limited amount of cyclical variation in many of the target variables. A practical lesson that we draw from this exercise is that in a crisis situation, a stress test should focus on outcomes that lie at the tails of the distribution, especially for variables that experienced only limited variation during cyclical downturns included in the sample.
Figure 5 shows the out-of-sample density forecasts for aggregate pre-provision net revenue. As shown by the dashed line, the behavior of the actual aggregate PPNR tended to be quite erratic during the 2007-09 crisis and its aftermath, which makes it considerably more difficult to accurately forecast this series. The sharp swings in PPNR from one quarter to another partly reflect many of the one-off charges that buffeted banks' revenues during that period, factors that in practice are dealt with on the case-by-case basis during a stress-testing exercise.22 Nevertheless, the evidence suggests that despite a relatively high degree of idiosyncratic volatility, the FE-QAR model is able to capture to a greater extent the uncertainty surrounding PPNR projections--certainly better than the linear framework--especially at short forecast horizons.
To assess formally the forecasting performance of each framework, we calculate the realization of the target process with respect to the estimated conditional density function. Specifically, we calculate a sequence of statistics
![]() over the 2005:Q1-2011:Q4 forecast evaluation period, where
over the 2005:Q1-2011:Q4 forecast evaluation period, where ![]() solves the following equation:
solves the following equation:
 |
In the above expression,
Table 4: Specification Tests for the Optimality of Density Forecasts (Aggregate Net Charge-off Rate)
| K-S Test:FE-QAR | K-S Test: FE-OLS | L-B Test:FE-QAR | L-B Test:FE-OLS | ARCH Test: FE-QAR | ARCH Test:FE-OLS | |
| Forecast Horizon: |
0.67 | 0.02 | 0.07 | 0.63 | 0.05 | 0.92 |
| Forecast Horizon: |
0.13 | 0.03 | 0.00 | 0.01 | 0.27 | 0.20 |
| Forecast Horizon: |
0.32 | 0.00 | 0.00 | 0.06 | 0.17 | 0.98 |
| Forecast Horizon: |
0.42 | 0.00 | 0.00 | 0.04 | 0.10 | 0.96 |
Table 4: Specification Tests for the Optimality of Density Forecasts (Aggregate Pre-Provision Net Revenue)
| K-S Test FE-QAR | K-S Test FE-OLS | L-B Test FE-QAR | L-B Test FE-OLS | ARCH Test FE-QAR | ARCH TestFE-OLS | |
| Forecast Horizon: |
0.28 | 0.11 | 0.18 | 0.42 | 0.46 | 0.16 |
| Forecast Horizon: |
0.28 | 0.05 | 0.12 | 0.10 | 0.56 | 0.03 |
| Forecast Horizon: |
0.16 | 0.02 | 0.10 | 0.01 | 0.52 | 0.38 |
| Forecast Horizon: |
0.04 | 0.05 | 0.01 | 0.00 | 0.05 | 0.23 |
NOTE: Sample period: 2005:Q1-2011:Q4 (
We use the following three tests to test for the statistical properties of the density forecasts: (1) the Kolmogorov-Smirnov (K-S) ![]() goodness-of-fit test, which compares the
histogram of
goodness-of-fit test, which compares the
histogram of ![]() with that of the standard uniform distribution; (2) the Ljung-Box (L-B) test of serial correlation in
with that of the standard uniform distribution; (2) the Ljung-Box (L-B) test of serial correlation in
![]() ; and (3) the ARCH test of serial correlation in
; and (3) the ARCH test of serial correlation in
![]() . For the K-S test, the null hypothesis is that
. For the K-S test, the null hypothesis is that ![]() is uniformly distributed, whereas the null hypothesis in the cases of the L-B and ARCH tests is that there is no serial dependence of up to four lags in the first and second moments of
is uniformly distributed, whereas the null hypothesis in the cases of the L-B and ARCH tests is that there is no serial dependence of up to four lags in the first and second moments of ![]() , respectively. Table 5.1 provides the
, respectively. Table 5.1 provides the ![]() -values for all three tests at forecast horizons
-values for all three tests at forecast horizons
![]() .
.
Keeping in mind that the out-of-sample forecast evaluation period is relatively short (we are using only 28 quarters for out-of-sample forecast evaluation), the ![]() -values in
Table 5.1 suggest that the near-term density forecasts of aggregate net charge-offs implied by the FE-QAR model have a number of desirable statistical properties.23 For example, we do not reject the null hypothesis of uniformity in
-values in
Table 5.1 suggest that the near-term density forecasts of aggregate net charge-offs implied by the FE-QAR model have a number of desirable statistical properties.23 For example, we do not reject the null hypothesis of uniformity in ![]() for
for
![]() . In addition, there is little evidence of serial correlation in
. In addition, there is little evidence of serial correlation in
![]() at the near-term forecast horizons and of conditional volatility dynamics at all forecasting horizons. The corresponding density forecasts generated by the FE-OLS
model, by contrast, appear to be less successful according to these metrics, especially at horizons that extend beyond the very near term.
at the near-term forecast horizons and of conditional volatility dynamics at all forecasting horizons. The corresponding density forecasts generated by the FE-OLS
model, by contrast, appear to be less successful according to these metrics, especially at horizons that extend beyond the very near term.
6 Forecasting Capital Shortfalls
In this section, we illustrate the applicability of our top-down stress-testing framework by estimating the capital shortfalls for the 15 BHCs in our sample. Specifically, using the actual supervisory stress scenario provided to banks that participated in CCAR 2012, we use the resulting projections for net charge-offs and pre-provision net revenue to simulate the tier 1 common capital risk-based ratio (T1CR)--the most important metric by which the capital adequacy of stressed banks is assessed--for each institution in the sample and for the corresponding industry aggregate.
6.1 Capital Calculator
We begin by describing how we map the conditional forecasts of net charge-offs and pre-provision net revenue into the T1CR. Because our focus is mainly on the differences between the quantile and linear forecasting frameworks, we consider a relatively simple mapping--the "capital calculator"--between loan losses, net revenues, and the evolution of bank equity. Specifically, we assume that the book value equity evolves according to
![\displaystyle E_{it} = E_{it-1} + (1-\tau) \times \left [\sum_{j=1}^6\widehat{\text{PPNR}}^j_{it} \times \overline{\text{Assets}}_{i} - \sum_{j=1}^8 \widehat{\text{NCO}}^j_{it} \times \overline{\text{Loans}}^j_{i} \right ] - \overline{\text{Equity Payouts}}_{i},](img140.gif) |
where
In the spirit of the U.S. stress tests, we also assume that banks have to maintain their capacity for credit intermediation even under adverse economic conditions. Accordingly, we let assets (
![]() ) and loans balances in each category (
) and loans balances in each category (
![]() ) stay constant throughout the projection period.24Equity payouts (
) stay constant throughout the projection period.24Equity payouts (
![]() ) are equal to dividends paid on common and preferred stock and repurchases of treasury shares. We set equity payout ratios at their pre-crisis (i.e.,
2006) levels. Consistent with a typical stress test scenario, we assume that the degree of distress in financial markets makes it prohibitively costly to issue new equity; for simplicity, we also assume that equity payouts are constant. In a "live" exercise, information on planned dividend
payouts and share repurchases is provided by the participating institutions to the Federal Reserve, and the stress test results are conditional on those plans.
) are equal to dividends paid on common and preferred stock and repurchases of treasury shares. We set equity payout ratios at their pre-crisis (i.e.,
2006) levels. Consistent with a typical stress test scenario, we assume that the degree of distress in financial markets makes it prohibitively costly to issue new equity; for simplicity, we also assume that equity payouts are constant. In a "live" exercise, information on planned dividend
payouts and share repurchases is provided by the participating institutions to the Federal Reserve, and the stress test results are conditional on those plans.
The capital ratio that in an actual stress test receives most attention by both the regulators and financial market participants is the tier 1 common ratio.25 The numerator of this ratio is defined as the regulatory tier 1 capital less non-common equity elements. To map book equity into tier 1 common capital, we subtract the dollar amount of regulatory capital deductions from the total book value of equity and assume that deductions are constant throughout the projection period. Finally, we set other comprehensive income to zero and assume no changes in other adjustments to equity capital over the projection period. Thus, the tier 1 common ratio in our exercise can be calculated as
T1CR |
where
6.2 Predicted Capital Shortfalls in 2013:Q4
Table 5: Predicted Tier 1 Common Regulatory Capital Ratio in 2013:Q4
| 1st Percentile FE-QAR | 1st Percentile FE-OLS | 5th Percentile FE-QAR | 5th Percentile FE-OLS | Average FE-QAR | Average FE-OLS | Average
T1CR |
|
| Ticker: BAC | 1.4 | 1.9 | 2.4 | 2.7 | 4.2 | 4.5 | 8.7 |
| Ticker: BBT | 5.9 | 6.7 | 6.4 | 7.0 | 7.5 | 7.9 | 9.8 |
| Ticker: C | 5.1 | 6.0 | 6.2 | 7.1 | 8.9 | 9.7 | 11.7 |
| Ticker: CMA | 5.2 | 6.2 | 5.6 | 6.4 | 6.6 | 6.9 | 10.6 |
| Ticker: FITB | 1.1 | 2.7 | 2.3 | 3.3 | 4.2 | 4.7 | 9.3 |
| Ticker: JPM | 5.5 | 6.5 | 6.1 | 7.2 | 8.4 | 9.3 | 9.9 |
| Ticker: KEY | 4.9 | 5.7 | 5.5 | 6.2 | 7.4 | 7.7 | 11.3 |
| Ticker: MTB | 3.6 | 3.5 | 3.9 | 3.7 | 4.7 | 4.5 | 6.9 |
| Ticker: PNC | 2.0 | 2.8 | 2.9 | 3.6 | 5.0 | 5.1 | 10.5 |
| Ticker: RBS | 5.4 | 6.2 | 6.0 | 6.7 | 7.2 | 7.5 | 13.3 |
| Ticker: RF | -1.2 | 1.0 | -0.1 | 1.5 | 1.8 | 2.4 | 8.2 |
| Ticker: STI | 3.7 | 4.6 | 4.2 | 5.0 | 5.9 | 5.8 | 9.3 |
| Ticker: USB | 4.4 | 5.3 | 5.1 | 5.7 | 6.4 | 6.6 | 8.5 |
| Ticker: WFC | 4.4 | 5.5 | 5.0 | 5.9 | 6.6 | 7.0 | 9.2 |
| Ticker: ZION | 6.3 | 6.6 | 7.0 | 7.3 | 8.6 | 8.8 | 9.5 |
| Ticker: All | 5.2 | 6.0 | 5.6 | 6.3 | 6.6 | 7.1 | 9.7 |
|---|
NOTE: Estimation period: 1997:Q1-2011:Q3. The jump-off period for the out-of-sample forecasts is 2011:Q4. Entries in the table show the selected moments of the density forecasts for T1CR in 2013:Q4 (the end of the projection period) implied by the FE-QAR and FE-OLS models. The paths of macroeconomic forcing variables over the projection period correspond to the severely adverse macroeconomic scenario used in the CCAR 2012 stress test conducted by the Federal Reserve in mid-March 2012 (see text for details). BAC = Bank of America Corporation; BBT = BB&T Corporation; C = Citigroup, Inc.; CMA = Comerica; FITB = Fifth Third Bancorp; JPM = JPMorgan Chase & Co.; KEY = KeyCorp; MTB = M&T Bank Corp.; PNC = PNC Financial Services Group, Inc.; RBS = Citizens Financial; RF = Regions Financial Corporation; STI = SunTrust Banks, Inc.; USB = U.S. Bancorp; WFC = Wells Fargo & Company; and ZION = Zions Bancorporation.
In implementing our pseudo stress test, we follow the actual timeline of CCAR 2012. First, we estimate the FE-QAR and FE-OLS models using the data for the 15 BHCs--and actual macro factors--over the 1997:Q1-2011:Q3 period. The paths of macro forcing variables over the 2011:Q4-2013:Q4 projection period are assumed to follow the severely adverse macroeconomic scenario specified by the Federal Reserve in CCAR 2012 (see Board of Governors of the Federal Reserve System [2012]). With these inputs, we generate density forecasts for net charge-offs and pre-provision net revenue over the subsequent nine quarters. At each quarter of the projection period, we apply the capital calculator to generate the implied density forecast of T1CR. As in the actual CCAR 2012, our stress test results are based on the distribution of T1CR at the end of 2013.
Table 6.2 contains the selected moments of the predicted distribution of T1CR in 2013:Q4, the end of the stress-test evaluation period. As evidenced by the entries in the table, the quantile framework generates noticeably heavier left tail of the T1CR
distribution relative to the linear model. For example, the first percentile of the T1CR distribution for all banks--the row labeled All--is 5.2 percent under the FE-QAR model compared with 6.0 percent for the FE-OLS model. Note that at the bank level, the
differences in the first and fifth percentiles across the two models are typically wider than those at the industry level, which reflects the fact that the aggregation of T1CR across banks decreases the heaviness of the left tail of the aggregate T1CR distribution because the underlying shocks are
not perfectly correlated across banks--a similar diversification effect is at work in the aggregation of the various portfolios within each bank. Nevertheless, relative to the capital position of the sector at the start of the stress-test evaluation period (see
T1CR![]() ), our quantile top-down stress-testing framework implies a substantial deterioration in the capital adequacy of each individual institution as well
as for the sample as a whole.
), our quantile top-down stress-testing framework implies a substantial deterioration in the capital adequacy of each individual institution as well
as for the sample as a whole.
The top two panels of Figure 6 depict the density forecasts of aggregate net charge-offs generated by the quantile and linear models, while the corresponding projections for the aggregate PPNR are shown in the bottom panels. The relative heaviness of the left tail of the predictive density for T1CR at the end of the evaluation period implied by the FE-QAR model is a result of both a heavier right tail of the distribution of loan losses and a heavier left tail of the distribution for bank revenues. In the case of charge-offs, the differences between the two frameworks arise mainly from the highly nonlinear behavior of the autoregressive dynamics in the FE-QAR model, especially for the residential real estate portfolio (see Figure 2 and Figure A-1 in the Appendix). Because the sum of the autoregressive terms in the FE-QAR model is increasing in the quantiles of the innovation process, an adverse shock to credit quality of banks' loan portfolios boosts charge-offs immediately and at the same time significantly increases the persistence of losses, thereby amplifying the impact of the initial shock. A similar local persistence effect is at work in the case of bank revenues, where the relative heaviness of the left tail of the predictive density generated by the FE-QAR model is driven almost entirely by losses in the trading book, a component of PPNR with highly nonlinear dynamics during periods of acute financial distress (see Figure 2 and Figure A-1 in the Appendix).
An important objective of a stress test is to ascertain the likelihood that a bank will be unable to maintain its capital above the minimum regulatory threshold in an adverse macroeconomic scenario. Equally important is the size of the potential capital shortfall, defined as the average amount
of capital a bank needs in order to avoid breaching the minimum regulatory requirement. We define the capital shortfall as the minimum capital requirement less the projected capital, conditional on the bank falling below the pre-specified threshold. More formally, letting
![]() denote the conditional
denote the conditional
Figure 6: Projections of Net Charge-offs and Pre-Provision Net Revenue (2011:Q4 2013:Q4)
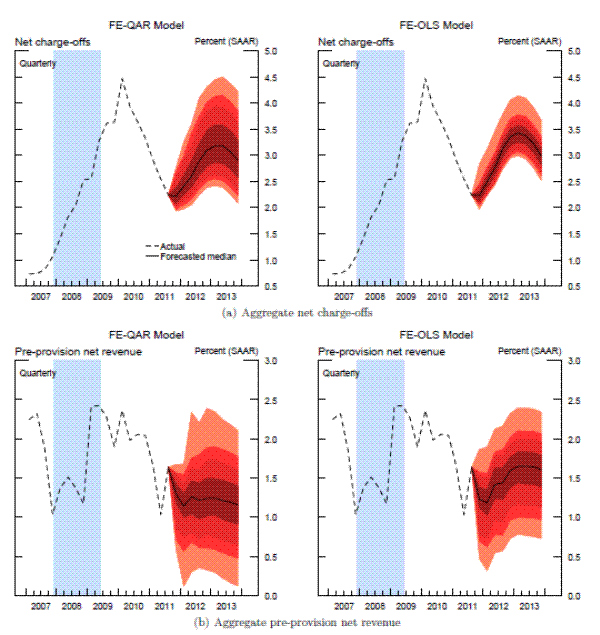 Figure 6 Data
probability density forecast of T1CR at the ![]() -quarter-ahead horizon for bank
-quarter-ahead horizon for bank ![]() in quarter
in quarter ![]() , and similarly, letting
, and similarly, letting
![]() denote the conditional cumulative density forecast, the corresponding expected capital shortfall associated with capital threshold
denote the conditional cumulative density forecast, the corresponding expected capital shortfall associated with capital threshold ![]() can be calculated as
can be calculated as
![\displaystyle C\!S^{h}_{iT}(\kappa) = C(\kappa) - E \big[\widehat{C}_{i,T+h} \, \vert \, \widehat{C}_{i,T+h} \leq C(\kappa) \big] = C(\kappa) \times \left [1 - \frac{1}{\kappa\widehat{F}_{iT}^{h}(\kappa)} \int_{-\infty}^{\kappa} s\,\hat{f}_{iT}^{h}(s) ds \right],](img155.gif)
where
Going into the CCAR 2012, the capital position of the BHCs that participated in the stress tests was at a very high level by recent historical standards (see Figure 1), a result due in large part to the existing restrictions on capital distributions that were imposed on some of the largest BHCs in response to the outcomes of the previous two tests (SCAP and CCAR 2011). To take into account these initial conditions, we consider--in addition to the minimum capital requirement of 5 percent for T1CR (the same as in CCAR 2012)--a minimum T1CR requirement of 8 percent, a threshold that is closer to the upper bound of the capital requirement for the global systemically important banks (G-SIBs).26 For both of these thresholds, we calculate the probability that the banks' T1CR will be below the specified requirement at the end of 2013 and the associated capital shortfall. The results of this exercise are shown in Table 6.2.
Table 6. Predicted Capital Adequacy Measures in 2013:Q4
| 5% T1CR Requirement:
|
5% T1CR Requirement:
|
5% T1CR Requirement: Capital Shortfall: FE-QAR | 5% T1CR Requirement: Capital Shortfall: FE-OLS | 8% T1CR Requirement:
|
8% T1CR Requirement:
|
8% T1CR Requirement: Capital Shortfall: FE-QAR | 8% T1CR Requirement: Capital Shortfall: FE-OLS | |
| Ticker: BAC | 0.78 | 0.66 | 16.2 | 13.0 | 1.00 | 1.00 | 51.6 | 47.4 |
| Ticker:BBT | 0.00 | 0.00 | 0.5 | - | 0.82 | 0.60 | 0.9 | 0.5 |
| Ticker:C | 0.01 | 0.00 | 5.8 | 7.1 | 0.34 | 0.14 | 9.9 | 8.1 |
| Ticker:CMA | 0.00 | 0.00 | 0.1 | - | 1.00 | 1.00 | 0.9 | 0.6 |
| Ticker:FITB | 0.76 | 0.67 | 1.3 | 0.8 | 1.00 | 1.00 | 3.9 | 3.4 |
| Ticker:JPM | 0.00 | 0.00 | 4.0 | - | 0.44 | 0.18 | 11.6 | 7.2 |
| Ticker:KEY | 0.01 | 0.00 | 0.3 | 0.1 | 0.71 | 0.61 | 0.9 | 0.6 |
| Ticker:MTB | 0.74 | 0.87 | 0.4 | 0.4 | 1.00 | 1.00 | 2.3 | 2.5 |
| Ticker:PNC | 0.48 | 0.44 | 2.1 | 1.5 | 1.00 | 1.00 | 6.7 | 6.5 |
| Ticker:RBS | 0.00 | 0.00 | 0.3 | - | 0.84 | 0.84 | 1.0 | 0.6 |
| Ticker:RF | 1.00 | 1.00 | 3.0 | 2.4 | 1.00 | 1.00 | 5.8 | 5.2 |
| Ticker:STI | 0.18 | 0.05 | 0.7 | 0.3 | 0.99 | 1.00 | 2.8 | 2.8 |
| Ticker:USB | 0.04 | 0.00 | 1.2 | 0.7 | 0.99 | 1.00 | 4.2 | 3.6 |
| Ticker:WFC | 0.05 | 0.00 | 3.6 | 2.4 | 0.92 | 0.94 | 15.1 | 10.6 |
| ZION | 0.00 | 0.00 | 0.0 | - | 0.26 | 0.13 | 0.3 | 0.3 |
| Ticker:All | 0.27 | 0.25 | 18.3 | 12.6 | 0.82 | 0.76 | 102.8 | 85.6 |
|---|
NOTE: Estimation period: 1997:Q1-2011:Q3. The jump-off period for out-of-sample forecasts is 2011:Q4. Entries in the table show the selected indicators of capital adequacy, calculated using the density forecasts for T1CR in 2013:Q4 (the end of the projection period) implied by the FE-QAR and FE-OLS models. Capital shortfall is in billions of dollars. The paths of macroeconomic forcing variables over the projection period correspond to the severely adverse macroeconomic scenario used in the CCAR 2012 stress test conducted by the Federal Reserve in mid-March 2012 (see text for details). BAC = Bank of America Corporation; BBT = BB&T Corporation; C = Citigroup, Inc.; CMA = Comerica; FITB = Fifth Third Bancorp; JPM = JPMorgan Chase & Co.; KEY = KeyCorp; MTB = M&T Bank Corp.; PNC = PNC Financial Services Group, Inc.; RBS = Citizens Financial; RF = Regions Financial Corporation; STI = SunTrust Banks, Inc.; USB = U.S. Bancorp; WFC = Wells Fargo & Company; and ZION = Zions Bancorporation.
Under the T1CR requirement of 5 percent, the average probability of a threshold violation is estimated to be 27 percent for the FE-QAR model model, slightly above the 25 percent implied by the FE-OLS model.27 These numbers, however, mask a considerable degree of heterogeneity across banks and models. For example, the estimated probability of violating the 5 percent threshold at the end of 2013 for Fifth Third Bancorp (FITB) is 76 percent, according to the quantile framework, and 67 percent based on the linear model. In contrast, a significant proportion of banks in our sample has no chance of failing the stress test, according to either model.
Consistent with our earlier results, the expected capital shortfalls based on the density forecasts generated by the FE-QAR model tend to be noticeably bigger than those based on the FE-OLS model. Although the probability of violating the 5 percent T1CR requirement is estimated to be close to 25 percent in the aggregate--according to both the FE-QAR and FE-OLS models--the expected capital shortfall predicted by the quantile model is almost 20 billion, significantly more than the 12.6 billion implied by its linear counterpart. This difference reflects the heavier left tail of the predictive density for T1CR, a distinct feature of our quantile framework. Another interesting result is that the aggregate expected capital shortfall predicted by the FE-QAR model is less than the sum of the capital shortfalls across all banks in the sample because the shocks used to generate the density forecasts are not perfectly correlated across banks.
Raising the target T1CR from 5 to 8 percent significantly increases the likelihood of failing the stress test. In the aggregate, the probability of violating this more-stringent requirement jumps to about 82 percent according to the quantile model and 76 percent based on the linear model. Moreover, many institutions that were highly unlikely to violate the 5 percent T1CR threshold are now virtually guaranteed that they will fail the test. Commensurate with the higher failure rate, the expected capital shortfalls increase across all banks. Consistent with the heavier left tail of the predictive density implied by the FE-QAR model, the difference in the expected capital shortfalls across the two models is much more pronounced in the cases where the probability of violating the 8 percent T1CR requirement is not too close to one.
7 Conclusion
In recent years, formal stress tests of the banking system have become an indispensable part of the macroprudential toolkit in most advanced economies. The results of stress tests are intended to inform the regulators and financial market participants whether the banking system has a sufficient loss-absorption capacity to weather a sustained period of severe economic distress, without excessive and coordinated deleveraging that could trigger a crippling "credit crunch."
In this paper, we argued that the top-down models based on dynamic quantile regressions are especially well-suited to capture the nonlinear behavior of bank losses and revenues during periods of sustained macroeconomic stress. Using such a top-down stress-testing framework, we generated density forecasts for bank losses and revenues, which, in conjunction with a simple capital calculator, implied a density forecast for the tier 1 common regulatory capital ratio, the most accurate indicator of the ability of banks to absorb losses. The results show that the density forecasts of tier 1 common capital generated by the dynamic quantile model exhibit significantly heavier left tails, relative to the density forecasts constructed using the canonical top-down linear model. As a result, the top-down models based on quantile regressions are more likely to provide an early warning signal about emerging vulnerabilities in the financial system compared with their linear counterparts.
The density forecasts are also important because they not only provide a complete description of the uncertainty surrounding the projected capital outcomes, but they also allow us to calculate the capital ratios associated with the specific percentiles of the distribution and the corresponding expected capital shortfalls. In turn, these statistics can be used to benchmark the results from the bottom-up models, as well as to gauge--within a coherent framework--the plausibility of the estimates submitted by the banks. In addition, as emphasized by Pritsker [2012], the small number of macro factors used in U.S. stress tests may not be sufficient to capture the full spectrum of risk faced by banks, a point that also argues for paying special attention to the tails of the distribution of capital outcomes.
The density-forecast approach proposed in this paper also reduces the incentive for banks to try to game the system. Under current practices, a bank will, in general, pass the stress test, provided its mean projected tier 1 common ratio is above the minimum requirement--set by the regulator--at the end of the projection period. Faced with this criterion, a bank has an incentive to submit a capital distribution plan that ensures that it will pass the stress test, though not by too-wide of a margin. By using a density forecast to evaluate the banks' proposed capital distribution plans, the regulators would reduce the incentive for the banks to adopt this strategy because a bank that would just pass the stress test in a conditional mean sense may still have a sizable capital shortfall under the density-forecast approach. Lastly, using density forecasts generated by the top-down models can help in the design of stress scenarios because in our framework, it is relatively easy to assess the sensitivity of the size of capital shortfalls to the severity of the underlying economic conditions.
Bibliography
In V. V. Acharya & M. Richardson (eds.), Restoring Financial Stability: How to Repair a Failed System?, pp. 283-304. John Wiley & Sons, Inc., Hoboken, NJ.
BIS Quarterly Review December:29-41.
Review of Economic Studies 58(2):277-297.
Discussion Paper, http://bankofengland.co.uk/publications/Documents/other/financialstability/roleofmacroprudentialpolicy091121.pdf.
http://www.bis.org/publ/bcbs201.pdf.
http://www.federalreserve.gov/newsevents/press/bcreg/bcreg20120313a1.pdf.
Staff Report No. 2013, Federal Reserve Bank of New York.
Working Paper No. 369, Bank for International Settlements.
Journal of Business and Economic Statistics 29(2):238-249.
Econometrica 78(3):1093-1125.
IMF Working Paper No. 07/59.
IMF Working Paper No. 12-58.
International Economic Review 39(4):863-883.
In M. Quagliariello (ed.), Stress-Testing the Banking System, pp. 37-57. Cambridge University Press, Cambridge, UK.
In Proceedings of the Fourth Joint Central Bank Research Conference on Risk Measurement and Systemic Risk, pp. 283-308, Frankfurt, Germany. European Central Bank.
Federal Reserve Bulletin 84(6):391-419.
Finance and Economics Discussion Series Paper No. 2012-26, Federal Reserve Board.
Finance and Economics Discussion Series Paper 2012-77, Federal Reserve Board. Forthcoming, Review of Economics and Statistics.
International Journal of Central Banking 5(3):9-45.
Journal of Money, Credit, and Banking 44(8):1589-1607.
Journal of Econometrics 164(1):142-157.
Journal of Monetary Economics 56(4):471-493.
American Economic Review 102(4):1692-1720.
International Journal of Forecasting 28(2):328-342.
Chicago Booth Paper No. 12-08.
Finance and Economics Discussion Series Paper 2012-49, Federal Reserve Board.
Journal of Economic Perspectives 25(1):3-28.
Staff Report No. 409, Federal Reserve Bank of New York.
Journal of Multivariate Analysis 91(1):74-89.
Econometrica 46(1):33-49.
Econometrica 70(4):1583-1612.
Journal of the American Statistical Association 101(September):980-990.
In F. X. Diebold, N. A. Doherty, & R. J. Herring (eds.), The Known, the Unknown, and the Unknowable in Financial Risk Management: Measurement and Theory Advancing Practice, pp. 103-144. Princeton University Press, Princeton, NJ.
Journal of Econometrics 157(2):396-408.
Working Paper, London School of Economics.
Econometrica 49(6):1417-1426.
Staff Report No. 460, Federal Reserve Bank of New York.
Cambridge Working Papers in Economics No. 0435, University of Cambridge.
Journal of the American Statistical Association 89(428):1303-1313.
Working Paper, Federal Reserve Bank of Boston.
Journal of Financial Stability 8(3):174-192.
Working Paper No. 165, Bank for International Settlements.
Journal of Financial Stability 2(2):113-151.
Working Paper, Dept. of Economics and Business, Universitat Pompeu Fabra.
Journal of Forecasting 19(4):235-254.
Journal of the Royal Statistical Society, Series B 58(1):267-288.
Risk Magazine October:111-117.
Risk Magazine November:56-61.
8 Data Sources and Methods
This appendix contains the details concerning the construction of all the bank-specific variables used in the analysis. It also provides some additional results concerning the relative performance of the FE-QAR and FE-OLS models.
Data sources:
All bank-level data are obtained from the FR-Y9C reports published by the Federal Reserve Board for BHCs and the FFIEC 031/041 reports published by the Federal Deposit Insurance Corporation for commercial banks. Table 8 contains the definitions of the eight categories of net charge-offs, the six components of pre-provision of net revenue, and the indicators of balance-sheet composition. Table 8 lists the mnemonics of all the variables--for both the FR-Y9C and FFIEC 031/041 regulatory schedules--used in the analysis.
Merger adjustment:
To deal with the large number of mergers that occurred during our sample period, bank balance sheet variables were adjusted for mergers. We made two types of merger adjustments to our data series. First, we constructed, for each BHC in our panel, a "virtual bank," a hypothetical institution that aggregates all entities that merged during our sample period; note that we only include entities that report the FR-Y9C and FFIEC 031/041 schedules prior to the merger. Under this assumption we combine, for example, Wells Fargo and Wachovia since the start of the sample period. Essentially, we adjust each BHC for mergers by combining bank balance sheet variables of the surviving entity with the corresponding variables from the acquired entity. In general, the restriction that the two merged entities had to file the FR-Y9C and the FFIEC 031/041 reports prior to the merger is not very restrictive, though a few well-known mergers during the 2007-09 financial crisis were excluded from our merger-adjustment procedure due to the lack of comparable data.28 Second, the income of the acquired entity is not observed in the quarter of the merger. To account for the unreported income of the acquired bank during the days in the quarter of the merger, we adjust income sheet items following the procedure described in English & Nelson [1998]. In particular, this procedure makes a plausible assumption that the acquired bank generated income at the same rate as it did in the quarter prior to the merger.29
Outlier removal procedure:
We removed outliers from the ratio of net interest income to assets because the series had occasional spikes for some banks in our sample. Specifically, if the bank's reported ratio of net interest to average consolidated assets in quarter ![]() was above or below its sample median
was above or below its sample median ![]()
![]() IQR , where IQR denotes the sample inter-quartile range, we replaced the value of the ratio for that quarter with the median value calculated over quarters
IQR , where IQR denotes the sample inter-quartile range, we replaced the value of the ratio for that quarter with the median value calculated over quarters
![]() , a filtering procedure that removed a tiny number of extreme observations associated with merger activity not captured by our merger-adjustment procedure. We did not
filter portfolio charge-off rates nor trading income because the procedure would have resulted in the removal of several observations during the crisis period. However, we set the dollar amount of charge-offs to zero in a few instances, cases where the charge-off rate was extremely elevated and
amount of loans in that category on the bank's balance sheet was immaterial. For the components of pre-provision net revenue there was less evidence of obvious outliers. Finally, the bank-specific charge-off rates and components of pre-provision net revenue were seasonally adjusted using an
additive X11 procedure.
, a filtering procedure that removed a tiny number of extreme observations associated with merger activity not captured by our merger-adjustment procedure. We did not
filter portfolio charge-off rates nor trading income because the procedure would have resulted in the removal of several observations during the crisis period. However, we set the dollar amount of charge-offs to zero in a few instances, cases where the charge-off rate was extremely elevated and
amount of loans in that category on the bank's balance sheet was immaterial. For the components of pre-provision net revenue there was less evidence of obvious outliers. Finally, the bank-specific charge-off rates and components of pre-provision net revenue were seasonally adjusted using an
additive X11 procedure.
Table A-1: Variable Definitions
| Net Charge-off Rates by Type of Loan: Commercial & industrial | =
|
| Net Charge-off Rates by Type of Loan: Construction & land development | =
|
| Net Charge-off Rates by Type of Loan: Multifamily real estate | =
|
| Net Charge-off Rates by Type of Loan: (Nonfarm) nonresidential CRE | =
|
| Net Charge-off Rates by Type of Loan: Home equity lines of credit | =
|
| Net Charge-off Rates by Type of Loan: Residential real estate (excl. HELOCs) | =
|
| Net Charge-off Rates by Type of Loan: Credit cards | =
|
| Net Charge-off Rates by Type of Loan:Consumer (excl. credit card) | =
|
| Components of Pre-Provision Net Revenue: Net interest income | =
|
| Components of Pre-Provision Net Revenue: Net interest income: Trading income | =
|
| Components of Pre-Provision Net Revenue: Net interest income:Noninterest income (excl. trading income) | =
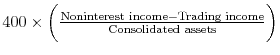 |
| Components of Pre-Provision Net Revenue: Net interest income:Compensation expense | =
|
| Components of Pre-Provision Net Revenue: Net interest income:Fixed assets expense | =
|
| Components of Pre-Provision Net Revenue: Net interest income: Other noninterest expense | =
 |
| Balance-Sheet Composition Indicators: Commercial & industrial loans | =
|
| Balance-Sheet Composition Indicators: Commercial real estate loans | =
 |
| Balance-Sheet Composition Indicators:Residential real estate loans | =
 |
| Balance-Sheet Composition Indicators: Credit card loans | =
|
| Balance-Sheet Composition Indicators: Other consumer loans | =
|
| Balance-Sheet Composition Indicators: Trading assets | =
|
Table A-2: Regulatory Reports Mnemonics
| Report: FR Y-9C | Report: FFIEC 031/041 | |
| Variable: Net charge-offs by type of loan: Commercial & industrial | (BHCK4645+BHCK4646-BHCK4617-BHCK4618) | (RIAD4645-RIAD4617) |
| Variable:Net charge-offs by type of loan: Construction & land development | (BHCKC891+BHCKC893-BHCK892-BHCKC894) | (RIADC891+RIADC893-RIADC892-RIADC894) |
| Variable:Net charge-offs by type of loan: Multifamily real estate | (BHCK3588-BHCK3589) | (RIAD3588-RIAD3589) |
| Variable:Net charge-offs by type of loan: (Nonfarm) nonresidential CRE | (BHCKC895+BHCKC897-BHCKC896-BHCKC898) | (RIADC895+RIADC897-RIADC896-RIADC898) |
| Variable:Net charge-offs by type of loan: Home equity lines of credit | (BHCK5411-BHCK5412) | (RIAD5411-RIAD5412) |
| Variable:Net charge-offs by type of loan: Residential real estate (excl. HELOCs) | (BHCKC234+BHCKC235-BHCKC217-BHCKC218) | (RIADC234+RIADC235-RIADC217-RIADC218) |
| Variable:Net charge-offs by type of loan: Credit card | (BHCKB514-BHCKB515) | (RIADB514-RIADB515) |
| Variable:Net charge-offs by type of loan: Consumer (excl. credit card) | (BHCKK129+BHCKK205-BHCKK133-BHCKK206) | (RIADK129+RIADK205-RIADK133-RIADK206) |
| Variable:Loans categories: Commercial & industrial | BHCK1763 | RCON3387 |
| Variable:Loans categories: Construction & land development | (BHCKF158+BHCKF159) | (RCONF158+RCONF159) |
| Variable:Loans categories: Multifamily real estate | BHDM1460 | RCON1460 |
| Variable:Loans categories: Nonfarm nonresidential CRE | (BHCKF160+BHCKF161) | RCON1480 |
| Variable:Loans categories: Home equity lines of credit | BHDM1797 | RCON1797 |
| Variable:Loans categories: Residential real estate (excl. HELOCs) | (BHDM5367+BHDM5368) | (RCON5367+RCON5368) |
| Variable:Loans categories: Credit card | BHCKB538 | RCONB561 |
| Variable:Loans categories: Consumer (excl. credit card) | (BHCKB539+BHCKK137+BHCKK207) | RCONB562 |
| Variable:Components of pre-provision net revenue: Net interest income | BHCK4074 | RIAD4074 |
| Variable:Components of pre-provision net revenue: Noninterest income | BHCK4079 | RIAD4079 |
| Variable:Components of pre-provision net revenue: Trading income | BHCKA220 | RIADA220 |
| Variable:Components of pre-provision net revenue: Compensation expense | BHCK4135 | RIAD4135 |
| Variable:Components of pre-provision net revenue: Fixed assets expense | BHCK4217 | RIAD4217 |
| Variable:Components of pre-provision net revenue: Noninterest expense | (BHCK4093-BHCKC216-BHCKC232) | (RIAD4093-RIADC216-RIADC232) |
| Variable:Other items: Consolidated assets | BHCK3368 | RCFD3368 |
| Variable:Other items: Interest-earning assets | (BHCKB558+BHCKB559+BHCKB560+ |
(RCFD3381+RCFDB558+RCFDB559+ |
| Variable:Other items: Trading assets | BHCK3545 | (RCFD3545-RCON3543-RCFN3543) |
| Variable:Other items: Book equity | BHCK3210 | RCFD3210 |
| Variable:Other items: Risk-weighted assets | BHCKA223 | RCFDA223 |
| Variable:Other items: Dividends | BHCK4598+BHCK4460 | RIAD4475 |
| Variable:Other items: Stock purchases | BHCK4783 | -RIADB510 |
| Variable: Other items: Tier 1 common equity | ||
| BHCK8274 | RCFD8274 | |
| - Perpetual preferred stock | BHCK3283 | RCFD3838 |
| BHCKB588 | RCFDB588 | |
| - Qual. class A minority interests | BHCKG214 | RCFDB589 |
| - Qual. restricted core capital | BHCKG215 | - |
| - Qual. mandatory convert. pref. sec. | BHCKG216 | - |
Projections of selected components of net charge-offs and revenues:
The top two panels of Figure A-1 depict the distribution of cumulative loan losses--over the 2011:Q4-2013:Q4 forecast horizon assumed by CCAR 2012--for the residential real estate (excluding HELOCs) and nonresidential commercial real estate loan portfolios (see Section 6 for details). The top left panel shows that the right tail of the density forecast of cumulative losses on residential real estate loans implied by the FE-QAR model is considerably heavier than that implied by the corresponding FE-OLS model; a similar result holds for cumulative losses on the nonresidential commercial real estate loan portfolio. The bottom two panels of Figure A-1 show the distribution of cumulative revenues for net interest income and trading income. In particular, the bottom right panel shows that the density forecast generated using the FE-QAR model generates an appreciably heavier left tail for trading income compared with its linear counterpart.
Note: Estimation period: 1997:Q1 2011:Q3; No. of banks = 15. The jum p-off date for the out-of-sample forecasts is 2011:Q4. The paths of macroeconomic forcing var iables over the projection period correspond to the scenario used in the CCAR 2012 stress test conducted by the Federal Reserve in early 2012. The top two panels depict the density forecasts implied by the F E-QAR and FE-OLS models of cumulative aggregate net charge-offs for residential real estate and no nresidential commercial real estate portfolios over the 2011:Q4 2013:Q4 forecast horizon; the bottom two panels d epict the corresponding density forecasts for cumulative aggregate net interest income and trading income![Figure A-1: Projections of Selected Net Charge-offs and Pre-Provision Net Revenue Components. The figure has four panels, each showing two lines. A blue line indicates ''FE-QAR'', whereas a dashed red line represents FE-OLS. The top left panel is labeled, ''Residential real estate (excl. HELOCs).'' The x-axis is labeled, ''Projected losses (annualized %)'' and ranges from 1 to 7.The y-axis is labeled, ''Density'' and ranges from 0 to 120. In the top left panel, the dashed red line begins at [3,0] and jumps up to 110 and then falls back to 0. The blue line starts at 0 and then steadily rises to cross the dashed red line at [3.5,40] and declines to 0 by the end of the graph (crosses the dashed red line at [5,20]. The top right panel is labeled, ''Nonresidential commercial real estate.'' The y-axis is labeled, ''Density'' and ranges from 0 to 120. The x-axis is labeled ''projected losses (annualized %)'' and ranges from 1 to 4. The dashed red line and blue line cross each other twice [1.5, 80] and [2.7, 40]. The bottom left panel is labeled, ''Net interest income'' The y-axis is labeled, ''Density'' and ranges from 0 to 200. The x-axis is labeled, ''Projected income (annualized %)'' and ranges from 3 to 6. The dashed red line starts at [4,0] and rises to reach its peak at [4.7, 160], before falling steeply to zero. The blue line starts at [0,0] and increases steadily to reach its peak at [4.7, 90] and then falls sharply to zero. The bottom right panel is labeled, ''Trading income.'' The y-axis is labeled, ''Density'' and ranges from 0 to 250. The x-axis is labeled, ''Projected income (annualized %)'' and ranges from -1.5 to 1.5.'' In the bottom right panel, both lines follow a similar movement. They initially jump up to reach their peaks between 0.6 and 0.9 on the x-axis and then decline rapidly to zero.](figurea1.gif)