
Board of Governors of the Federal Reserve System
International Finance Discussion Papers
Number 803, April 2004--Screen Reader Version*
Benefits and Spillovers of Greater Competition in Europe: A Macroeconomic Assessment1
International Finance Discussion Papers numbers 797-807 were presented on November 14-15, 2003 at the second conference sponsored by the International Research Forum on Monetary Policy sponsored by the European Central Bank, the Federal Reserve Board, the Center for German and European Studies at Georgetown University, and the Center for Financial Studies at the Goethe University in Frankfurt.
NOTE: International Finance Discussion Papers are preliminary materials circulated to stimulate discussion and critical comment. The views in this paper are solely the responsibility of the author and should not be interpreted as reflecting the views of the Board of Governors of the Federal Reserve System or any other person associated with the Federal Reserve System. References in publications to International Finance Discussion Papers (other than an acknowledgment that the writer has had access to unpublished material) should be cleared with the author or authors. Recent IFDPs are available on the Web at http://www.federalreserve.gov/pubs/ifdp/. This paper can be downloaded without charge from the Social Science Research Network electronic library at http://www.ssrn.com/.
Abstract:
Using a general-equilibrium simulation model featuring nominal rigidities and monopolistic competition in product and labor markets, this paper estimates the macroeconomic benefits and international spillovers of an increase in competition. After calibrating the model to the euro area vs. the rest of the industrial world, the paper draws three conclusions. First, greater competition produces large effects on macroeconomic performance, as measured by standard indicators. In particular, we show that differences in competition can account for over half of the current gap in GDP per capita between the euro area and the US. Second, it may improve macroeconomic management by increasing the responsiveness of wages and prices to market conditions. Third, greater competition can generate positive spillovers to the rest of the world through its impact on the terms of trade.
Keywords: Competition; Markups; Monetary Policy; Taylor Rule.
JEL Classification: C51, E31, E52
Non-technical summary
Over-regulation in Europe�s product and labor markets is currently a leading explanation for the euro area�s lower income per capita relative to the United States, and the reduction of such impediments has become a major policy topic in Europe. This paper employs a version of the Global Economy Model (GEM) of the International Monetary Fund to examine the potential benefits from such deregulation. The model provides for imperfect competition through markups in prices and wages above marginal costs and marginal output; the markups decrease as the substitutability of goods and inputs (that is, competition) increases. In a two-bloc version of GEM, one bloc is calibrated with euroarea data, and the other, which represents the rest of the industrialized world, is calibrated with U.S. data.
The paper simulates greater competition in the euro area by lowering euro-area markups in the model to the level of those in United States. With greater competition, businesses and workers in the euro area are less able to restrict their respective supplies. Accordingly, output and consumption increases strongly in the euro area; in the rest of the industrialized world, output increases somewhat, and consumption increases more than output because of an improvement in the terms of trade. Moreover, because greater competition improves the flexibility of wages and prices in the euro area, the central bank there faces an improved trade-off between inflation and the output gap.
The markups employed in the model are based on empirically estimated data from both the United States and Europe. The quantitative results, which represent only an initial estimate subject to further refinements, show euro-area output per capita rising over the period about 12-1/2 percent above baseline (the level of output per capita if markups are not changed); U.S.-calibrated output rises about 1 percent above baseline over the period. The combined result closes about half the per capita output gap between the two blocs. Euro-area consumption per capita rises about 8 percent above baseline. Accounting for the disutility of the rise in labor effort, welfare increases by some 2� percent. Higher demand for foreign goods and the depreciation of the real value of the euro lead to positive spillovers to the rest of the world: consumption and welfare in the other bloc rise about 1-1/4 percent. Finally, the trade-off facing the euro-area monetary authority also improves because of a one-third reduction, relative to baseline, in the sacrifice ratio�the amount of output lost by lowering inflation 1 percentage point.
Finally, the paper investigates the robustness of these estimates by looking at the result for alternative values of key model parameters. The results indicate that the impact on the euro area economy is relatively invariant to alternative assumptions about key parameters, with the important exception of the sensitivity of hours worked to changes in the real wage. However, the spillovers on the rest of the world are sensitive to a range of deep parameters and hence the estimated effects are much less certain.
1 Introduction
Why are there such large differences in income per capita across countries, both within the industrial core and between this core and the rest of the world? For much of the postwar period, the standard answer to this question focused on the process of technological catch-up. More recently, however, it is becoming increasingly clear that structural differences across countries play a key role, both directly and by providing impediments to the successful implementation of macroeconomic policies.2 This switch in emphasis is particularly evident in continental Europe, where the leading explanation of the continuing divergence in material wealth from that of the United States is that labor and product markets are more hampered by regulations than their U.S. counterparts.3 Indeed, the action plans endorsed in a series of recent summits of European leaders suggests that increasing competition in Europe through deregulation has become a major policy priority.4 Despite the importance of this topic, however, estimates of the benefits from greater competition are limited.5
This paper uses a general equilibrium model to estimate the effects of changing competition on performance within a country and spillovers to the rest of the world. Specifically, the model posits imperfect competition in product and labor markets which drives a wedge between the true marginal cost/product and actual prices/wages. These markups are inversely related to the degree of substitutability across goods/inputs, and hence the underlying level of competition.6 A two-country setup involving the euro area and the rest of the world -- where the calibration of the latter is based on the United States -- is used to explore how altering domestic competition in labor and product markets affects performance at home and abroad across a wide range of elasticities/markups and other key parameters in the model. Empirical estimates of euro area and U.S. markups are then used to estimate the impact of increasing competition in the euro area to levels prevailing in the United States.
Anticipating our conclusions, we find that increasing competition leads to sizable increases in domestic output and consumption, as well as easing the task of the monetary authorities by reducing the distortions associated with wage-price rigidities. These benefits also provide positive spillovers to the rest of the world, mainly through a favorable terms of trade effect which boosts consumption abroad by more than output.
Indeed, our estimates of the potential long-term gains from greater competition in the euro area are substantial, and would greatly diminish the difference in material well-being between the euro area and the United States. Our simulations indicate that increasing competition in the euro area to U.S. levels could boost output by 12.4 percent in the euro area as both investment and hours worked rise markedly, and by 0.8 percent in the rest of the world. The consumption benefits are more evenly spread, with euro area consumption rising 8.3 percent versus 1.3 percent elsewhere. In addition, monetary policy becomes more effective in the euro area, as the sacrifice ratio (i.e. the cost in foregone output required to reduce inflation by 1 percent) declines significantly. These benefits come about because greater competition reduces the monopolistic power of producers and workers, and hence the degree to which they restrict their respective supplies to raise prices and wages, thereby increasing the responsiveness of prices and wages to market conditions.
The next section presents the theoretical background to the model. Section 3 discusses the calibration and properties of the model. Section 4 assesses how changes in price and wage markups impact the world economy, and reports a simulation in which euro area markups fall to U.S. levels. Section 5 concludes.
2 The Model
2.1 Consumption and investment goods
The world economy consists of two countries, Home (the euro area) and Foreign (the rest of the industrial world). Foreign variables are indexed with a star. The structure of the model is illustrated in Figure 1.7
In each country there is a continuum of symmetric firms
producing nontradable consumption (![]() ) and investment (
) and investment (![]() ) goods under perfect competition. Home firms
producing the consumption good are indexed by
) goods under perfect competition. Home firms
producing the consumption good are indexed by
![]() and
Foreign firms are indexed by
and
Foreign firms are indexed by
![]() , where
, where
![]() is a measure
of country size and world size is normalized to 1.
is a measure
of country size and world size is normalized to 1.
Home firm ![]() 's output at
time (quarter)
's output at
time (quarter) ![]() is
denoted
is
denoted ![]() .8 The
consumption good is produced with the following CES technology:
.8 The
consumption good is produced with the following CES technology:
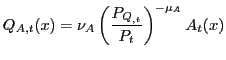
![$\displaystyle A_{t}(x)=\left( \nu_{A}^{\frac{1}{\mu_{A}}}Q_{A,t}(x)^{1-\frac{1}... ...}(x)\right) \right] ^{1-\frac{1}{\mu_{A}}}\right) ^{\frac {\mu_{A}}{\mu_{A}-1}}$](img10.gif)
|
(1) |
Two intermediate inputs are used in the production of the consumption good
To model sluggish adjustment of imports volumes to changes in
demand, we assume that imports as a share of total production are
subject to external adjustment costs
![]() :9
:9
|
(2) |
As is the case for adjustment costs on investment dynamics, these adjustment costs temporarily shrink the production possibilities frontier of the economy.
The baskets ![]() and
and ![]() are CES indexes
of differentiated intermediate tradables, respectively produced in
the Home country and imported from the Foreign country. Each
intermediate good is produced by a single firm under conditions of
monopolistic competition. Home firms in the tradables sector are
indexed by
are CES indexes
of differentiated intermediate tradables, respectively produced in
the Home country and imported from the Foreign country. Each
intermediate good is produced by a single firm under conditions of
monopolistic competition. Home firms in the tradables sector are
indexed by
![]() ,
Foreign firms in the tradables sector are indexed by
,
Foreign firms in the tradables sector are indexed by ![]() . Defining as
. Defining as
![]() and
and
![]() the use by
firm
the use by
firm ![]() of the intermediate
goods produced by firms
of the intermediate
goods produced by firms ![]() and
and ![]() respectively, we
have:
respectively, we
have:
|
(3) | |
|
(4) |
where
In the Home country, the prices of the intermediate goods are
denoted ![]() and
and
![]() . Each Home firm
. Each Home firm
![]() takes these prices as
given and minimizes its costs. Home firm
takes these prices as
given and minimizes its costs. Home firm ![]() 's demand for input
's demand for input ![]() is then obtained as:
is then obtained as:
|
(5) |
where
![$\displaystyle P_{Q,t}=\left[ \left( \frac{1}{s}\right) \int_{0}^{s}p_{t}\left( h\right) ^{1-\theta}dh\right] ^{\frac{1}{1-\theta}}$](img34.gif)
|
(6) |
Similarly we can derive
Next, each Home firm ![]() takes the prices of the intermediate baskets
takes the prices of the intermediate baskets ![]() and
and ![]() as given and minimizes
as given and minimizes
![]() subject to (1).
Cost minimization in Home consumption good production yields:
subject to (1).
Cost minimization in Home consumption good production yields:
 ,
, 
|
(7) |
where
Mutatis mutandis, the investment
industry ![]() is similar to
the consumption sector described above. Symmetric Home firms
producing the investment good under perfect competition are indexed
by
is similar to
the consumption sector described above. Symmetric Home firms
producing the investment good under perfect competition are indexed
by
![]() , and
Foreign firms by
, and
Foreign firms by
![]() . Home
firm
. Home
firm ![]() 's output is denoted
's output is denoted
![]() . Using
self-explanatory notation, output is given by:
. Using
self-explanatory notation, output is given by:
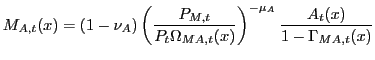
![$\displaystyle E_{t}(y)=\left( \nu_{E}^{\frac{1}{\mu_{E}}}Q_{E,t}(y)^{1-\frac{1}... ...}(y)\right) \right] ^{1-\frac{1}{\mu_{E}}}\right) ^{\frac {\mu_{E}}{\mu_{E}-1}}$](img46.gif)
|
(8) |
and the other variables related to
Aggregating across ![]() -
and
-
and ![]() -type firms we obtain
the following Home demand for intermediate domestic good
-type firms we obtain
the following Home demand for intermediate domestic good
![]() :
:
|
(9) |
Similar considerations apply to Home demand for intermediate imported good
|
(10) |
Foreign variables are similarly characterized.
2.2 Intermediate goods
The supply of each Home intermediate good ![]() is denoted by
is denoted by ![]() :
:
|
(11) |
Firm
Each firm ![]() uses a CES
combination of differentiated labor inputs. Labor inputs are
immobile geographically. In each country, they are defined over a
continuum of mass equal to the country size: Home labor inputs are
indexed by
uses a CES
combination of differentiated labor inputs. Labor inputs are
immobile geographically. In each country, they are defined over a
continuum of mass equal to the country size: Home labor inputs are
indexed by
![]() ,
Foreign labor inputs by
,
Foreign labor inputs by
![]() . We
can then write:
. We
can then write:
![$\displaystyle \ell_{t}(h)=\left[ \left( \frac{1}{s}\right) ^{\frac{1}{\psi}}\int_{0} ^{s}\ell(h,j)^{1-\frac{1}{\psi}}dj\right] ^{\frac{\psi}{\psi-1}}$](img60.gif)
|
(12) |
where
Firms producing intermediate goods take the prices of labor
inputs and capital as given. Cost minimization in the intermediate
sector implies that the demand for labor input ![]() by firm
by firm ![]() is a function of the relative
wage:
is a function of the relative
wage:
|
(13) |
where
![$\displaystyle W_{t}=\left[ \left( \frac{1}{s}\right) \int_{0}^{s}W_{t}(j)^{1-\psi }dj\right] ^{\frac{1}{1-\psi}}$](img67.gif)
|
(14) |
Denoting by ![]() the
Home nominal rental price of capital, cost minimization yields:
the
Home nominal rental price of capital, cost minimization yields:
 ,
, 
|
(15) |
where the marginal cost
|
(16) |
Similar considerations hold for the production of Foreign intermediates.
2.3 Price setting in the intermediate sector
Consider now profit maximization in the Home country's
intermediate sector. In both markets there is sluggish price
adjustment due to resource costs measured in terms of total
profits.12 The
adjustment cost are denoted
![]() and
and
![]() :
:
 ,
, 
|
(17) |
where
Formally, denoting the nominal exchange rate as
![]() (defined as
Home currency per unit of Foreign currency), firm
(defined as
Home currency per unit of Foreign currency), firm ![]() sets its prices by maximizing its
profits:
sets its prices by maximizing its
profits:
|
||
![$\displaystyle \left. +\left( \mathcal{E}_{\tau}p_{\tau}^{\ast}(h)-MC_{\tau}(h)\... ... \left( \frac{1-s}{s}\right) \left( 1-\Gamma_{PM,\tau}^{\ast}(h)\right) \right]$](img81.gif)
|
(18) |
where
Denoting
![]() and
and
![]() , the first-order condition
with respect to
, the first-order condition
with respect to ![]() can be written as:
can be written as:

Equation (19) is key to our results. First, note that when
prices are fully flexible (
![]() ), the
optimization problem collapses to the standard markup rule:
), the
optimization problem collapses to the standard markup rule:
 |
(20) |
where the fixed gross markup
More crucially, (19) clarifies the link between imperfect
competition and nominal rigidities. When ![]() is very large, (19) is solved
by
is very large, (19) is solved
by
![]() regardless of how sizable
regardless of how sizable
![]() is. This
implies that in a competitive economy (large
is. This
implies that in a competitive economy (large ![]() ) prices must move in tandem
with the shocks affecting marginal costs, even though such
flexibility entails large adjustment costs. Instead, if price
setters have strong monopoly power (
) prices must move in tandem
with the shocks affecting marginal costs, even though such
flexibility entails large adjustment costs. Instead, if price
setters have strong monopoly power (![]() is close to one, its minimum value), they can
charge a high average markup over marginal costs. In this case,
when marginal costs increase due to cyclical conditions, firms find
it optimal to maintain relatively stable prices and absorb the
change in production costs through a markup squeeze. In other
words, when
is close to one, its minimum value), they can
charge a high average markup over marginal costs. In this case,
when marginal costs increase due to cyclical conditions, firms find
it optimal to maintain relatively stable prices and absorb the
change in production costs through a markup squeeze. In other
words, when ![]() is
small, firms are able to keep their prices well above marginal
costs and accommodate changes in demand through supply adjustments,
without corresponding changes in prices. Other things being equal,
an increase in
is
small, firms are able to keep their prices well above marginal
costs and accommodate changes in demand through supply adjustments,
without corresponding changes in prices. Other things being equal,
an increase in ![]() reduces the firms' ability to use markup fluctuations as a shock
absorber.
reduces the firms' ability to use markup fluctuations as a shock
absorber.
Similar considerations hold for the price of good ![]() abroad,
abroad,
![]() . If nominal
rigidities in the export market are highly relevant (that is, if
. If nominal
rigidities in the export market are highly relevant (that is, if
![]() is
relatively large), the prices of Home goods in the Foreign market
will be characterized by significant inertia.13 In the absence of price stickiness,
instead, optimal price setting is consistent with the cross-border
law of one price:
is
relatively large), the prices of Home goods in the Foreign market
will be characterized by significant inertia.13 In the absence of price stickiness,
instead, optimal price setting is consistent with the cross-border
law of one price:
|
(21) |
Foreign variables are similarly characterized.
2.4 Consumer optimization
In each country there is a continuum of symmetric households.
Home households are indexed by
![]() and
Foreign households by
and
Foreign households by
![]() , the
same indexes of labor inputs. Households' preferences are
additively separable in consumption and labor effort. Denoting with
, the
same indexes of labor inputs. Households' preferences are
additively separable in consumption and labor effort. Denoting with
![]() the
lifetime expected utility of Home agent
the
lifetime expected utility of Home agent ![]() , we have:
, we have:
![$\displaystyle \mathcal{W}_{t}(j)\equiv\mathsf{E}_{t}\sum_{\tau=t}^{\infty}\beta... ..._{\tau}\left( j\right) \right) -V_{\tau}\left( \ell_{\tau}(j)\right) \right] \;$](img100.gif)
|
(22) |
where
There is habit persistence in consumption according to the specification:
|
(23) |
where
|
(24) |
where
The individual flow budget constraint for agent ![]() in the Home country is:
in the Home country is:
Home agents hold domestic money
Home agents accumulate Home physical capital which they rent to
Home firms at the nominal rate ![]() . The law of motion of capital is:
. The law of motion of capital is:
| (26) |
where
|
(27) |
where
Each household is the monopolistic supplier of a labor input
![]() . Each household sets
the nominal wage for type
. Each household sets
the nominal wage for type ![]() -labor input facing a downward-sloping demand,
obtained by aggregating (13) across
-labor input facing a downward-sloping demand,
obtained by aggregating (13) across ![]() -firms. As in Kim (2000), there is sluggish wage
adjustment due to resource costs that are measured in terms of the
total wage bill. The adjustment cost is denoted
-firms. As in Kim (2000), there is sluggish wage
adjustment due to resource costs that are measured in terms of the
total wage bill. The adjustment cost is denoted
![]() ,
with:
,
with:
|
(28) |
where
Consumption spending is subject to a proportional transaction
cost
![]() that
depends on the household's money velocity
that
depends on the household's money velocity
![]() .
Agents optimally choose their stock of real money holdings
.
Agents optimally choose their stock of real money holdings
![]() so that
at the margin shopping costs measured in terms of foregone
consumption are equal to the benefits from investing in
yield-bearing assets.18
so that
at the margin shopping costs measured in terms of foregone
consumption are equal to the benefits from investing in
yield-bearing assets.18
Home agents own all Home firms and there is no international
trade in claims on firms' profits. The variable ![]() includes all profits accruing to
Home households, plus all Home-currency revenue from nominal
adjustment rebated in a lump-sum way to all Home households, plus
revenue from financial intermediation which is assumed to be
provided by Home firms exclusively. Finally, Home agents pay
lump-sum (non-distortionary) net taxes
includes all profits accruing to
Home households, plus all Home-currency revenue from nominal
adjustment rebated in a lump-sum way to all Home households, plus
revenue from financial intermediation which is assumed to be
provided by Home firms exclusively. Finally, Home agents pay
lump-sum (non-distortionary) net taxes ![]() denominated in Home
currency. Similar relations hold in the Foreign country, with the
exception of the intermediation frictions in the financial
market.
denominated in Home
currency. Similar relations hold in the Foreign country, with the
exception of the intermediation frictions in the financial
market.
The representative Home household chooses bond and money
holdings, capital and consumption paths, and sets wages to maximize
its expected lifetime utility (22) subject to (25) and (26).
Defining the variable
![]() as:
as:
![$\displaystyle D_{t,\tau}\equiv\beta\frac{P_{t}U^{\prime}(C_{\tau})\left[ 1+\Gam... ...prime}(C_{t})\left[ 1+\Gamma_{S,\tau}+\Gamma_{S,\tau}^{\prime}v_{\tau}\right] }$](img144.gif)
|
(29) |
which is Home agents' stochastic discount rate and the Home pricing kernel, the first-order conditions with respect to
| (30) |
The above expression is the risk-adjusted uncovered-interest-parity relationship, recalling that the return on lending to Foreign is reduced (and the cost of borrowing from Foreign is increased) by the costs of intermediation
More relevant for our purposes is the first order condition with
respect to ![]() ,
whose dynamics is the analog of the price equation (19) above. In
the absence of wage rigidities (
,
whose dynamics is the analog of the price equation (19) above. In
the absence of wage rigidities (
![]() ) the real
wage
) the real
wage
![]() is
equal to the marginal rate of substitution between consumption and
leisure,
is
equal to the marginal rate of substitution between consumption and
leisure,
![]() , augmented by the markup
, augmented by the markup
![]() which reflects monopoly
power in the labor market.
which reflects monopoly
power in the labor market.
Optimization implies that households exhaust their intertemporal budget constraint: the flow budget constraint (25) holds as equality and the transversality condition is satisfied:
| (31) |
Similar results characterize the optimization problem of Foreign agent
2.5 Government
Public spending falls both on consumption and investment goods.
In the model ![]() is
per-capita public purchases of the Home consumption goods and
is
per-capita public purchases of the Home consumption goods and
![]() is public
investment, financed through net lump-sum taxes and seigniorage
revenue. The budget constraint of the Home government is:
is public
investment, financed through net lump-sum taxes and seigniorage
revenue. The budget constraint of the Home government is:
![$\displaystyle sP_{t}G_{C,t}+sP_{E,t}G_{I,t}\leq\int_{0}^{s}TT_{t}(j)dj+\int_{0}^{s}\left[ \mathcal{M}_{t}(j)-\mathcal{M}_{t-1}(j)\right] dj$](img161.gif)
|
(32) |
The government controls the short-term rate ![]() . Monetary policy is specified
in terms of an annualized Taylor rule19of the form:
. Monetary policy is specified
in terms of an annualized Taylor rule19of the form:
![$\displaystyle +\left( 1-\omega_{i}\right) \left[ \left( 1+\overline{i_{t}}\righ... ...ght] +\omega_{1}\left[ \frac{P_{t}}{P_{t-4}}-\Pi_{t}\right] +\omega_{2}YGAP_{t}$](img164.gif)
where the left hand side is the annualized interest rate,
|
(34) |
In the expression above
Foreign variables are similarly characterized. Any steady-state
discrepancy between ![]() and
and
![]() (thus,
between
(thus,
between ![]() and
and
![]() ) determines
the steady-state rate of exchange rate depreciation (for
) determines
the steady-state rate of exchange rate depreciation (for
![]()
![]() ) or
appreciation (for
) or
appreciation (for ![]()
![]() ).
).
2.6 Market clearing
The model is closed by imposing the following resource
constraints and market clearing conditions. The Home tradable
![]() can be used by Home
firms or imported by Foreign firms, so that:
can be used by Home
firms or imported by Foreign firms, so that:

|
(35) |
The Home good
 |
![$\displaystyle \geq\int_{0}^{s}C_{t}(j)[1+\Gamma_{S,t} (j)]dj+sG_{C,t}$](img181.gif)
|
(36) |
 |
 |
(37) |
The resource constraints for labor and capital are:
|
(38) |
Similar expressions hold abroad.21
Finally, market clearing in the asset market requires:
 , , 
|
(39) |
Aggregating the budget constraints across private and public agents we derive the macroeconomic variables used in the simulation exercises. In particular, the output gap that enters the policy rule (33) is defined as the deviation of real (constant-price) national income from baseline:
where variables without time index denote steady-state levels.22
3 Calibration and model properties
In our simulations the Home country (euro area) is assumed to
make up 35 percent of the industrial world, and the Foreign country
is the rest of the industrial world with ![]() .23Table 1 provides a summary of the main
parameter values as well as steady-state levels in the baseline
solution of the model. In addition, Table 4 reports the
elasticities of substitution among labor inputs (
.23Table 1 provides a summary of the main
parameter values as well as steady-state levels in the baseline
solution of the model. In addition, Table 4 reports the
elasticities of substitution among labor inputs (![]() ) and among differentiated goods
(
) and among differentiated goods
(![]() ), as well as the
underlying steady-state wage and price markups,
), as well as the
underlying steady-state wage and price markups,
![]() and
and
![]() . In what follows we
discuss our assumptions.
. In what follows we
discuss our assumptions.
3.1 Assumptions about elasticities
The inverse of the parameter![]() represents the Frisch elasticity of labor
supply, which in the baseline calibration of the model has been set
to 1/3 (
represents the Frisch elasticity of labor
supply, which in the baseline calibration of the model has been set
to 1/3 (![]() ).
This estimate is at the high end of the range of estimates from
micro studies, which vary from about .05 to .35, but is
significantly lower than what is typically used in the real
business cycle literature (see e.g. Cooley and Prescott (1995)).
Because the results are sensitive to the assumption about this
parameter value, an alternative estimate that is closer to the mean
estimates from micro studies (0.15 or
).
This estimate is at the high end of the range of estimates from
micro studies, which vary from about .05 to .35, but is
significantly lower than what is typically used in the real
business cycle literature (see e.g. Cooley and Prescott (1995)).
Because the results are sensitive to the assumption about this
parameter value, an alternative estimate that is closer to the mean
estimates from micro studies (0.15 or ![]()
![]() ) is also considered.24
) is also considered.24
In the baseline calibration of the model we set the elasticity
of substitution between domestic and imported inputs in the
production of consumption and investment goods (![]() and
and ![]() ) equal to 2.5. These
elasticities are critical determinants of the long-run spillover
effects of changes in the degree of competition in one country on
other countries, because they affect the behavior of net exports
and the real exchange rate. An estimate of 2.5 is lower than the
estimate employed by Erceg, Guerrieri and Gust (2003) in a model of
the US economy,25 but it
is significantly higher than what has been used in several previous
macro simulation models (e.g., see Laxton and others (1998), Chari,
Kehoe and McGrattan (2002), Smets and Wouters (2002a), and Gali and
Monacelli (2002)). The section on sensitivity analysis shows the
implications of reducing
) equal to 2.5. These
elasticities are critical determinants of the long-run spillover
effects of changes in the degree of competition in one country on
other countries, because they affect the behavior of net exports
and the real exchange rate. An estimate of 2.5 is lower than the
estimate employed by Erceg, Guerrieri and Gust (2003) in a model of
the US economy,25 but it
is significantly higher than what has been used in several previous
macro simulation models (e.g., see Laxton and others (1998), Chari,
Kehoe and McGrattan (2002), Smets and Wouters (2002a), and Gali and
Monacelli (2002)). The section on sensitivity analysis shows the
implications of reducing ![]() and
and ![]() to 1.5.
to 1.5.
3.2 Assumptions about steady-state ratios
The following steady-state ratios are calibrated to be
consistent with national accounts data. The steady-state
investment-to-GDP ratio is 22 percent in both countries, with 19
percent representing private sector investment and 3 percent
investment by the government. Based on a quarterly depreciation
rate of 2.5 percent and identical total factor productivity in the
two countries (
![]() ), this
implies a steady-state capital-to-GDP ratio of around 2.2. The
values for
), this
implies a steady-state capital-to-GDP ratio of around 2.2. The
values for ![]() and
and
![]() , the
weight of capital in the production of tradables, imply a smaller
labor income share in the Home country (47 percent) than in the
Foreign country (58 percent), consistent with OECD data.
, the
weight of capital in the production of tradables, imply a smaller
labor income share in the Home country (47 percent) than in the
Foreign country (58 percent), consistent with OECD data.
The import-to-GDP ratio is set at 18 percent for the euro area
and 13 percent for the rest of the world (which is approximately
the openness of the U.S. economy). Approximately two thirds of
imported goods in the euro area are investment goods, while for the
United States this figure is only slightly greater than one half.
Consistently, the steady-state level of imports of investment goods
relative to GDP is 13 percent in the euro area and 7 percent in the
rest of the industrial world, allocating the remainder to imports
of consumption goods. These ratios were calibrated by setting the
appropriate values for the scale parameters (![]() and
and ![]() ) in the import demand
functions for both the Home and Foreign economies.
) in the import demand
functions for both the Home and Foreign economies.
3.3 Assumptions about dynamics
As regards the short-term dynamic properties of the model, the appropriate parameters have been calibrated to approximately replicate the monetary transmission mechanisms embedded in policy simulation models developed at the European Central Bank (ECB) and the Federal Reserve Board of Governors (FRB).26 The empirical apparatus of these models does not build upon a choice-theoretic structure, but rather reflects the results of vector autoregression (VAR) analysis as well as information specific to the two institutions. In particular, our calibration mimics the dynamic responses to a 1-year interest rate hike in the ECB's Area-Wide Model (AWM) and the Board of Governor's FRB-US model, followed by reversal to the baseline Taylor rule (33).27
Table 2 reports the responses of key macro-variables to a 1-year hike in the policy rate in the Home country of our model, and compares these responses with results from the same experiment using the ECB's AWM.28 Table 3 repeats the same experiment for the Foreign economy, and the results are compared with those of the FRB-US model.29 To make the results more easily comparable we have included a summary column in Table 2 and 3 that reports the sum of the responses over the first two years of the simulation horizon.
In both the AWM and FRB-US model, the maximum effect on
consumption occurs after about 3-4 quarters and the peak is about 3
to 4 times larger than the impact effect in the first quarter. To
obtain a similar hump-shaped response of consumption in our
simulations we combine a fairly high value for the consumption
habit persistence parameter (
![]() in both
countries) with relatively high values for the intertemporal
elasticity of substitution (
in both
countries) with relatively high values for the intertemporal
elasticity of substitution (![]() ). In fact, in the simulations reported in
Tables 2 and 3 we set
). In fact, in the simulations reported in
Tables 2 and 3 we set ![]() equal to 5.0 in both countries. While the
values of these elasticities are above the point estimates
typically adopted in structural models that ignore or downplay
habit persistence, in the context of our model they generate a
realistically gradual build-up of the effects of interest rate
hikes over time, even in the absence of artificial assumptions such
as predetermined consumption expenditures and decision lags. An
alternative parameterization based on a more conventional
logarithmic utility is discussed below.30
equal to 5.0 in both countries. While the
values of these elasticities are above the point estimates
typically adopted in structural models that ignore or downplay
habit persistence, in the context of our model they generate a
realistically gradual build-up of the effects of interest rate
hikes over time, even in the absence of artificial assumptions such
as predetermined consumption expenditures and decision lags. An
alternative parameterization based on a more conventional
logarithmic utility is discussed below.30
To better assess the interaction of habit persistence and
intertemporal substitution in generating delayed consumption
responses, Figure 2 reports some sensitivity analysis for exactly
the same experiments conducted in Table 2 and 3. The top panel
reports consumption responses for the Home country without habit
persistence in consumption (![]() ) for three values of the intertemporal
elasticity of substitution that range between 1/3 and 3.0, with an
intermediate case of 0.99 that approximates the assumption of
logarithmic utility. The top panel shows that without habit
persistence, consumption behaves as a pure jump variable in
response to interest rate hikes, and indeed in all three cases
consumption peaks (unrealistically) in the very first period when
the shock is assumed to take place. The two middle panels report
results when the habit persistence parameter as been set at 0.6 and
0.8 respectively, well within the consensus range of estimates for
) for three values of the intertemporal
elasticity of substitution that range between 1/3 and 3.0, with an
intermediate case of 0.99 that approximates the assumption of
logarithmic utility. The top panel shows that without habit
persistence, consumption behaves as a pure jump variable in
response to interest rate hikes, and indeed in all three cases
consumption peaks (unrealistically) in the very first period when
the shock is assumed to take place. The two middle panels report
results when the habit persistence parameter as been set at 0.6 and
0.8 respectively, well within the consensus range of estimates for
![]() . Consumption in
these simulations falls significantly in the period when the shock
occurs, and its magnitude grows only slightly over the next two
quarters before quickly reverting to baseline. Realistic dynamics
is obtained only with a combination of high habit persistence and
low values of
. Consumption in
these simulations falls significantly in the period when the shock
occurs, and its magnitude grows only slightly over the next two
quarters before quickly reverting to baseline. Realistic dynamics
is obtained only with a combination of high habit persistence and
low values of ![]() , as
assumed in our calibration.31
Despite the close similarity of the dynamic paths, however, it is
worth noticing that in both the AWM and FRB-US model consumption
reverts to baseline more slowly than in the simulated responses of
our model.
, as
assumed in our calibration.31
Despite the close similarity of the dynamic paths, however, it is
worth noticing that in both the AWM and FRB-US model consumption
reverts to baseline more slowly than in the simulated responses of
our model.
To illustrate the implications of habit persistence in labor
effort, Figure 3 shows the responses of some key macrovariables to
a permanent decline in the inflation target of the Home country
under different assumptions on the value of ![]() . As can be seen in the
Figure, high values of this parameter induce high persistence in
the economy, as it can take well over a decade for the economy to
return to equilibrium following a disinflationary episode. Based on
our preliminary econometric analysis of U.S. data, we set
. As can be seen in the
Figure, high values of this parameter induce high persistence in
the economy, as it can take well over a decade for the economy to
return to equilibrium following a disinflationary episode. Based on
our preliminary econometric analysis of U.S. data, we set
![]() equal to 0.5
in both countries.32
equal to 0.5
in both countries.32
A number of parameters have been calibrated to generate
investment responses as consistent as possible with the central
bank models mentioned above. The elasticity of substitution between
capital and labor in the production function (![]() ) is set at 0.80 in the Home
country and 0.70 in the Foreign country.33 Our model calibration assigns
significant adjustment costs to changes in investment (
) is set at 0.80 in the Home
country and 0.70 in the Foreign country.33 Our model calibration assigns
significant adjustment costs to changes in investment (
![]() for the
Home country and 80 for the Foreign country) and very small
adjustment costs to capital accumulation (
for the
Home country and 80 for the Foreign country) and very small
adjustment costs to capital accumulation (
![]() for both
countries).34 While
these assumptions help to attenuate the volatility of investment in
our simulations, we note however that the estimated short-run
responses may still be too sensitive to interest rate shocks.
for both
countries).34 While
these assumptions help to attenuate the volatility of investment in
our simulations, we note however that the estimated short-run
responses may still be too sensitive to interest rate shocks.
Likewise, import adjustment costs have been calibrated to slow down the responsiveness of the import shares to changes in relative prices. In our simulations it takes several quarters before the import share adjusts to a permanent real depreciation. Over a time horizon of about two years, the effective elasticity of the import share with respect to the real exchange rate is around 1.5.
The remaining dynamic coefficients to be calibrated are the
adjustment cost parameters on wages, prices and import prices.
Given the empirical paucity of reliable estimates, it was decided
to allow for a baseline calibration based on full pass-through onto
import prices (
![]() ) and
identical adjustment costs on wages and domestic prices.35 A value of 2800 for
) and
identical adjustment costs on wages and domestic prices.35 A value of 2800 for ![]() and
and ![]() is capable of approximately
replicating the slow response of the price level in the ECB's model
of the euro area and a value of 1400 is capable of replicating the
significantly faster response of the price level in the FRB-US
model. Based on these parameters, the sacrifice ratios are equal to
2.9 in the Home country and 1.3 in the Foreign country.
is capable of approximately
replicating the slow response of the price level in the ECB's model
of the euro area and a value of 1400 is capable of replicating the
significantly faster response of the price level in the FRB-US
model. Based on these parameters, the sacrifice ratios are equal to
2.9 in the Home country and 1.3 in the Foreign country.
There is however an important caveat. Models of the monetary
transmission mechanism that attempt to reproduce the properties of
historical time series may significantly overstate the degree of
structural inflation persistence. This is because the inflationary
inertias observed in the data may partially result from a slow
learning process during the transition from high to low inflation
regimes.36 In light
of these considerations, estimates of ![]() and
and ![]() based on historical episodes
of disinflation should be expected to be biased upwards. Short of
strong empirical evidence about the magnitude of this bias, we have
reduced these parameters in half to establish a benchmark
calibration of the model (see Table 1). Based on such
parameterization of nominal rigidities, the sacrifice ratio is 2.0
in the Home country and 0.9 in the Foreign country (Table 4).
based on historical episodes
of disinflation should be expected to be biased upwards. Short of
strong empirical evidence about the magnitude of this bias, we have
reduced these parameters in half to establish a benchmark
calibration of the model (see Table 1). Based on such
parameterization of nominal rigidities, the sacrifice ratio is 2.0
in the Home country and 0.9 in the Foreign country (Table 4).
As a final check on the calibration of the system, we compared the impulse response functions of the model with the VAR estimates by Altig and others (2003) for the U.S. economy. The dashed lines in Figure 4 report the impulse responses (and confidence bands) for the VAR while the solid line reports the responses in our model when the same interest rate path is imposed on the Foreign economy for the first 8 quarters of the simulation horizon. As can be seen in the Figure, with the exception of the impact responses, our results generally fit within the confidence bands for output, consumption, investment and the price level. It is noteworthy that our price level declines monotonically over time but the VAR's price level increases somewhat over the first year of the shock. This may reflect the fact that different prices indices are reported from the VAR (the GDP deflator) and for our model (the consumption deflator), as a result of which the VAR may have less feedback from the real exchange rate.37
4 Simulation results
This section focuses on how differing levels of competition affect macroeconomic performance. Increases in competition feed into output and demand as they reduce the ability of workers and firms to exploit market power by restricting the supply of goods and labor. As a result, a greater level of competition implies a higher level of real output, investment, and consumption. The rest of the world also benefits, as greater output in the Home country leads to an increase in the supply of exports to the Foreign country, and the induced depreciation in the Home terms of trade boosts real incomes and consumption abroad. In addition, as explained in the discussion of equation (19) above, greater competition makes it easier for the monetary authorities to stabilize domestic output and inflation, leading to less structural inflation persistence.
4.1 Effects of higher markups on economic activity
The impact of changing markups on the long-run levels of
economic activity are shown in Figure 5. Starting from a situation
in which both labor and product markets are essentially in
competitive equilibrium, with a markup of 1/2 percent (implying
underlying elasticities of substitution ![]() and
and ![]() equal to 200), competition in
the product and labor markets is reduced by increasing the relevant
markup in increments of 5 percentage points to a final value of
around 55 percent (implying underlying elasticities of around 3,
almost a hundred-fold lower than the initial values). In all of
these simulations, the other markups at home and abroad are held at
their baseline values reported in Table 4.38
equal to 200), competition in
the product and labor markets is reduced by increasing the relevant
markup in increments of 5 percentage points to a final value of
around 55 percent (implying underlying elasticities of around 3,
almost a hundred-fold lower than the initial values). In all of
these simulations, the other markups at home and abroad are held at
their baseline values reported in Table 4.38
In analyzing these simulations, it is worth recalling the
thought experiments being performed. Lower competition across firms
(lower ![]() ) raises
the price markup as these firm reduce output to exploit their less
elastic demand curves. The contraction in output affects capital
more than labor effort (hereafter assumed to be equivalent to hours
worked) as in the long run labor is the less elastic resource. By
contrast, lower competition in labor markets (lower
) raises
the price markup as these firm reduce output to exploit their less
elastic demand curves. The contraction in output affects capital
more than labor effort (hereafter assumed to be equivalent to hours
worked) as in the long run labor is the less elastic resource. By
contrast, lower competition in labor markets (lower ![]() ) allows workers to exploit their
greater market power by reducing hours worked, as a result of which
firms adjust their capital stock to remain efficient. In addition,
the change in consumption is closely allied to the change in labor
effort as, in steady state, the disutility of work has to be
equated with the benefits of consumption (adjusted by the
appropriate relative prices).
) allows workers to exploit their
greater market power by reducing hours worked, as a result of which
firms adjust their capital stock to remain efficient. In addition,
the change in consumption is closely allied to the change in labor
effort as, in steady state, the disutility of work has to be
equated with the benefits of consumption (adjusted by the
appropriate relative prices).
International spillovers depend crucially on the appreciation in the exchange rate as competition falls. This appreciation reflects the reduction in availability of Home goods as opposed to Foreign goods and the impact on the overall propensity to import stemming from shifts in spending (investment has a higher foreign component than consumption). For both reasons, spillovers are larger for product market reforms. This favorable terms of trade effect cushions the impact on consumption at home and exacerbates it abroad.
These considerations shed light on the simulations reported in Figure 5. The first feature to note is that higher markups in either market (and hence lower levels of competition) lead to mildly concave reductions in output and consumption at home and abroad. In the case of product markets, for example, an increase in the price markup from half a percent to five-and-a-half percent reduces output by 3.5 percent, while a similar increase from 50 to 55 percent reduces output by 1.9 percent.39 The costs associated with similar changes in wage markups are around half of these values. Given that wages comprise around two-thirds of costs, this implies that an increase in goods prices coming from greater competition across firms is somewhat more detrimental to output than an equivalent increase in costs coming from labor markets. An increase in the price markup has a particularly deleterious effect on the capital stock, which falls by 50 percent as the markup rises from zero to one-half, about double the reduction in output. Hours worked also decline, but by about two-thirds of the fall in output. Consumption is reduced by a similar amount as lower domestic output and the fall in investment leads to a favorable terms of trade effect, with the exchange rate appreciating by some 15 percent.
Turning to the Foreign country, when the Home price markup rises from zero to one-half output falls by around 2 percent (less than one-tenth of the reduction in the Home country) as the demand for exports falls and the terms of trade become more unfavorable. As a result of the latter effect, the fall in foreign consumption is larger than in output, and indeed the ratio of the decline in Foreign to Home consumption is around one-fifth, double the one-tenth figure for output. In short, a lack of product market competition has significant consumption spillovers to the rest of the world.
The effects of an increase in the wage markup of a similar magnitude produces a significantly different response in domestic inputs, consumption, and spillovers to the rest of the world. For an equivalent rise in the markup, output falls by under half as much. Labor effort, investment, and consumption all fall by similar amounts to output. The impact on consumption partly reflects the more limited real exchange rate appreciation, as the response of output, investment, and goods prices is more muted than when price markups increase by the same amount. The more limited exchange rate appreciation also constrains spillovers to the rest of the world, with Foreign consumption falling by only about one-tenth of its domestic equivalent.
4.2 Effects of higher markups on sacrifice ratios
Changes in product and labor market competition also have a significant impact on the flexibility of monetary policy. A useful metric is provided by the sacrifice ratio, i.e. the cumulative annual output gap that is required to permanently reduce the inflation rate by one percentage point. Intuitively, monetary policy is easier to operate if the output losses associated with changing inflation are small.
Increases in the wage markup have a greater impact on the sacrifice ratio than equivalent changes in product markets. Figure 5 graphs the relationship between markups in goods and labor markets and the sacrifice ratio. The differences in impact of the two markups are substantial for low levels of the markup but erode as the markups increase, moving to near equality at markups of around 50 percent. This reflects the fact that the relationship is convex for price markups and concave for wage markups.
The greater sensitivity of wage-price flexibility to labor market competition comes from the fact that labor is the less elastic resource, and hence its price responds more in the presence of market power. The bottom line of this analysis is labor market inefficiencies have a smaller impact on long-term output than equivalent product market inefficiencies but, for reasonable parameters, the opposite is true for monetary policy flexibility. These differences largely reflect the fact that firms face direct competition from abroad while labor does not. Both effects create negative spillovers to the rest of the world, either through lower demand and a less favorable terms of trade (in the case of output) or a lower ability to stabilize domestic output (in the case of monetary policy).40
4.3 Sensitivity analysis
We now examine the sensitivity of these results to changes in key parameters. Figure 6 reports the results from reducing the Frisch elasticity of labor supply from 0.33 to 0.15, closer to the mean of microeconomic estimates but further away from the values generally used in real business cycle models, as discussed above. Compared to the baseline case, the more limited labor supply response approximately halves the impact of changes in the wage markup on both domestic and foreign variables. For the price markup, the equivalent declines are one-quarter to one-third, reflecting the greater importance of reductions in investment in this case. The impact on the sacrifice ratio also decreases, particularly as regards the wage markup, as lower flexibility in labor supply translates into more accommodation through wages.
The equivalent deep parameter for firms is the elasticity of substitution between labor and capital. Figure 7 shows the results from shifting this parameter down by 0.1 in both countries.41 This change has little impact on the simulations, particularly those examining shifts in the wage markup. In the simulations of alternative price markups, it leads to a mildly larger fall in hours worked and smaller reduction in investment than in the base case, resulting in a slightly larger reduction in domestic consumption and smaller consumption spillovers to the rest of the world. Changes in this elasticity also have only marginal effects on the sacrifice ratio compared to the base case. The intuition for these small effects is that capital is a reproducible factor of production while labor supply is much more constrained, so that changes in the level of substitutability between capital and labor do not impact capital inputs significantly.
Next, changes in the degree of substitutability between domestic and foreign goods were examined. Figure 8 reports the results when this elasticity is lowered from the baseline value of 2.5 to 1.5, moving it toward the values found in macroeconomic studies and away from those typical in microeconomic work. As might be expected, the main impact of decreased substitutability between domestic goods and imports is to increase the exchange rate response to changes in markups. This, in turn, increases spillovers to the rest of the world through its impact on purchasing power at home and abroad. Indeed, both the appreciation of the real exchange rate and the impact on foreign consumption doubles compared to that in the baseline, while the ratio of the change in Foreign to Home consumption rises by even more, as the appreciation cushions some of the impact on Home consumers.
Finally, the intertemporal elasticity of substitution on consumption was reduced in both countries to unity (0.99 to be exact), corresponding to the log-utility value used in many other papers. As discussed earlier, this switch has significant implications for the short-term consumptions dynamics of the model. It turns out, however, that this change has a relatively limited impact on how shifts in markups affect long-term activity, with domestic consumption losses from higher markups being reduced by 15-20 percent and their foreign counterparts by more like 30 percent (Figure 9).
To summarize, with the important exception of the Frisch elasticity, changing key parameters in the rest of the model generally has only negligible effects on the impact of changes in competition on the domestic economy, but alter the international spillovers significantly. The intuition is that in the Home economy changes in markups have a first-order effect which tends to dominate, but the spillovers to the Foreign country come through indirect channels which are much more sensitive to the specification of the rest of the model. The Frisch elasticity is an exception as it directly affects the degree to which workers need to constrain their labor input to achieve a desired rise in markups, and hence has a first-order effect in the simulations.
4.4 How much is a lack of competition costing the euro area?
The analysis above can be applied to gauge the detrimental effects of low levels of competition in the euro area on the euro area itself and the rest of the world. The first stage in this process is to calculate reasonable estimates of price and wage markups from existing empirical work. A number of authors have looked at price markups by sector following the initial work on U.S. manufacturing by Hall (1988). But data for U.S. manufacturing may be atypical for at least two reasons. The United States has a lower regulatory burden than other countries, implying more competitive markets and lower markups, and manufacturing is probably more competitive than other sectors of the economy because of the high level of penetration by foreign producers. To get a broader view of markups, we use results from Martins, Scarpetta, and Pilat (1996) who estimate price markups across a wide range of countries and sectors using the methodology of Roeger (1995). Weighting reported markups by value added across sectors produces an estimated average markup of 23 percent in the United States and 35 percent in the euro area. These are considerably higher than the estimates for manufacturing of 15 and 19 percent, respectively.42
Earlier calibrations of wage markups have tended to look at evidence on elasticities of demand in the United States (see e.g. Smets and Wouters, 2002b). We take a different approach to estimating these wage markups, based on observed wage differentials across industries in different countries after controlling for other factors such as skill levels of the work force and age of workers, as reported in Jean and Nicoletti (2002). The wage markup is estimated by comparing wages in sectors in which labor is likely to have relatively little bargaining power to the average wage across the economy as a whole. The three sectors in which labor was assumed to have little bargaining power were textiles, worn apparel, and leather, all fragmented industries facing stiff competition from abroad. The results imply a wage markup of around 16 percent for the United States and around 24 percent for the euro area (based on GDP-weighted data for France, Italy, Austria, Belgium, Greece, and Ireland).43
Jean and Nicoletti (2002) also find that regulation in product markets is linked to higher wage markups, implying that labor is able to capture some of the rents accruing from lower competition due to regulation. This suggests that the markups on wages and prices are linked to some extent, although the wage premium can also depend upon numerous other factors, including whether the industry is in the private or public sector. In fact, regulation drives up relative wages in the private sector, but drives down relative wages when the industry is publicly owned. The later effect is large -- for a given level of regulation the coefficient changes from 0.2 to minus 0.35 -- possibly reflecting underlying inefficiencies associated with public ownership of commercial industries. This implies that the wage premiums due to high levels of regulation and hence low levels of competition may be larger than these numbers suggest for the euro area (the numbers for the United States are essentially unaffected, given the low level of public ownership). Calculating the bias requires assumptions about the degree of regulatory impediments in the euro area and level of public ownership. Back of the envelope calculations suggest, however, that it is probably of the order of 0.06, a number we adopt.44
Based on these results, the wage markup was set at 16 percent for the United States and 30 percent for the euro area, and the price markup at 23 percent for the United States and 35 percent for the euro area (see Table 4). As a further check, we also looked at the estimates of overall differentials for a large number of disaggregated manufactured goods across countries reported in Bradford and Lawrence (2003). Their empirical results yielded an estimate of the overall gap between marginal costs and prices of 15-20 percent in the United States and 50 percent or so in the euro area. These numbers are broadly consistent with our assumed values of wage and price mark-ups. Other parameters are set at their baseline levels.
The long-term effects, summarized in Table 5, are that if the
euro area increased competitiveness in both labor and product
markets to U.S. levels real output would rise by 12
![]() percent,
with the capital stock increasing by over double that of hours
worked (over 20 percent compared to 10 percent). The output and
labor input spillovers to the rest of the world are relatively
muted (under 1 percent), so that the rise in relative output
represents over half of the gap in per capita GDP and labor
utilization between the two regions (see OECD (2003), Figure 1.1).
The effects on consumption are more evenly spread, with an increase
in consumption of over 8 percent in the euro area and 1
percent,
with the capital stock increasing by over double that of hours
worked (over 20 percent compared to 10 percent). The output and
labor input spillovers to the rest of the world are relatively
muted (under 1 percent), so that the rise in relative output
represents over half of the gap in per capita GDP and labor
utilization between the two regions (see OECD (2003), Figure 1.1).
The effects on consumption are more evenly spread, with an increase
in consumption of over 8 percent in the euro area and 1
![]() percent in
the United States, reflecting the real depreciation of the euro of
some 5 percent. There is also a fall of about one-third in the
sacrifice ratio, from 2 to 1.4 (see Table 6).45 In short, an analysis of these
conventional macroeconomic indicators would suggest that greater
competition in the euro area will be felt in both the euro area and
the rest of the world.
percent in
the United States, reflecting the real depreciation of the euro of
some 5 percent. There is also a fall of about one-third in the
sacrifice ratio, from 2 to 1.4 (see Table 6).45 In short, an analysis of these
conventional macroeconomic indicators would suggest that greater
competition in the euro area will be felt in both the euro area and
the rest of the world.
Tables 5 and 6 also report results when the product and wage markups are changed separately. Greater product market competition has larger effects on activity than reducing labor market rigidities, with these differences being much starker for investment, output, and international spillovers than for consumption or labor effort. In the case of the sacrifice ratio, the impact of product and labor market reforms are the same, reflecting the relatively large effect on domestic nominal rigidities discussed above.
An important advantage of a choice-theoretic model with explicit microfoundations is that the costs and benefits of a change in competition can be evaluated directly by computing the change in consumer welfare, measured in consumption equivalents.46 More competition-friendly policies have two effects on welfare: a positive one stemming from higher consumption, and an offsetting reduction attributable to higher levels of labor effort. This is obviously important in the simulation above, as both consumption and labor effort in the euro area rise by the same amount (8.3 percent). However, as shown in Table 5 the net effect on welfare is positive (2.4 percent in terms of consumption equivalents) because the rise in utility associated with additional consumption is higher than the disutility from additional labor effort. From this welfare perspective, it can be seen that spillover benefits of reforms are about one half of the magnitude in the rest of the world (1.2 percent increase in welfare), as the effect of the increase in consumption is not significantly offset by the much smaller increase in hours worked (0.2). It can also be seen in the Table that about 3/4 of these increases in welfare are attributable to product market reforms, and the remainder to more competitive labor markets.
5 Conclusion
This paper has examined the benefits from greater competition in product and labor markets using a choice-theoretic, general-equilibrium model of the global economy. Lower levels of competition are associated with significantly reduced output and consumption at home and abroad, with the spillovers in consumption being larger than those in output due to an appreciation in the domestic real exchange rate. In addition, lower levels of competition affect macroeconomic policies by increasing nominal inertia in the model. This reduces the flexibility of domestic monetary policy, making it more difficult for the central bank to stabilize the economy in the face of disturbances.
Our simulations produce plausible empirical estimates of the effects of structural polices to improve competition. Changes in goods and wage markups have significantly different effects on the economy. Greater competition across firms leads to a more marked rise in the capital stock and output, and larger benefits to the rest of the world. Indeed, in our base case parameterization, the rise in foreign consumption is some 20 percent of that at home. Greater competition in labor markets results in a more marked increase in hours worked, nominal flexibility, and somewhat smaller international spillovers. Experiments varying the value of key elasticities indicate that the impact on the home country are relatively robust, while the size of the international spillovers is more sensitive to the parameterization of the rest of the model.
Applying the model to the euro area, structural polices that
increase competition toward U.S. levels (based on empirically
estimated markups in both regions) are found to increase output in
the euro area by some 12
![]() percent,
and that in the United States by 1 percent. The implied change in
relative output represents around half of the current difference in
per capita GDP. The gains in consumption are more evenly spread,
with euro area consumption rising by 8 percent and U.S. consumption
up 1
percent,
and that in the United States by 1 percent. The implied change in
relative output represents around half of the current difference in
per capita GDP. The gains in consumption are more evenly spread,
with euro area consumption rising by 8 percent and U.S. consumption
up 1
![]() percent,
in part because the euro depreciates against the dollar by some 5
percent. In both countries the net effect on welfare is positive,
as gains from higher consumption more than offset losses from
higher labor effort. Equally importantly, these policies also
benefits European policymakers by reducing the distortions
associated with nominal rigidities, thereby making monetary
policies more effective. Indeed, the sacrifice ratio (defined here
as the cumulative output cost of reducing inflation by one
percentage point) falls by a third.
percent,
in part because the euro depreciates against the dollar by some 5
percent. In both countries the net effect on welfare is positive,
as gains from higher consumption more than offset losses from
higher labor effort. Equally importantly, these policies also
benefits European policymakers by reducing the distortions
associated with nominal rigidities, thereby making monetary
policies more effective. Indeed, the sacrifice ratio (defined here
as the cumulative output cost of reducing inflation by one
percentage point) falls by a third.
While structural policies are being viewed increasingly as a source of differences across countries, empirical estimates of their macroeconomic effects have to date been extremely limited. This paper represents a preliminary attempt to bridge the gap, by providing an explicit theoretical and empirical methodology to calculate the impact of more competition-friendly reforms. At the same time, it should be emphasized that our exercise represents but an initial experiment. More work will have to be done to examine how robust our results are to varying structures and assumptions. For instance, the role of tax asymmetries could be analyzed in light of the results by Prescott (2003). In addition, one can think of many more structural policies whose effects could be examined along similar lines, for example trade liberalization. An ambitious and exciting agenda lies ahead.
References
[1] Acemoglu, D., S. Johnson, and J. Robinson (2002). `` Reversal of Fortunes: Geography and Institutions in the Making of the Modern World Income Distribution.'' Quarterly Journal of Economics, Vol. 117, November, pp. 1231-94.
[2] Altig, D., L. Christiano, M. Eichenbaum and J. Linde (2003). `` Technology Shocks and Aggregate Fluctuations,'' Working Paper, Northwestern University.
[3] Andrés, J., E. Ortega and J. Vallés (2003). `` Competition and Inflation Differentials in EMU,'' Working Paper, Bank of Spain, September.
[4] Baily, M. (2003). `` A Radical Transformation of the European Economy,'' Working Paper, Washington, Institute for International Economics.
[5] Blanchard, O. (2004). `` The Economic Future of Europe.'' Journal of Economic Perspectives, forthcoming.
[6] Bradford, S. and R. Lawrence (2003). `` Paying the Price: The Cost of Fragmentation in International Markets,'' Working Paper, Harvard University.
[7] Chari, V.V., P. J. Kehoe, and E.R. McGrattan (2002). `` Can Sticky Price Models Generate Volatile and Persistent Real Exchange Rates?'' Review of Economic Studies 69, pp. 533-63.
[8] Cooley, T. and E. Prescott (1995). `` Economic Growth and Business Cycles,'' in T. Cooley (ed.), Frontiers of Business Cycle Research, Princeton NJ: Princeton University Press.
[9] Corsetti, G., and P. Pesenti (2001). `` International Dimensions of Optimal Monetary Policy,'' National Bureau of Economic Research Working Paper No.8230, April.
[10] Devereux, M., and C. Engel (2003). `` Monetary Policy in the Open Economy Revisited: Exchange Rate Flexibility and Price Setting Behavior.'' Review of Economic Studies 70, pp. 765-783.
[11] Erceg, C., L. Guerrieri and C. Gust (2003). `` SIGMA: A New Open Economy Model for Policy Analysis,'' Draft Paper prepared for the Annual Central Bank Modelers' Workshop, Amsterdam.
[12] Erceg, C. and A. Levin (2001). `` Imperfect Credibility and Inflation Persistence,'' Working Paper, Board of Governors of the Federal Reserve System.
[13] European Commission (2002). `` Better Functioning Labor and Product Markets," in European Economy No. 6/2000, Chapter 3, Brussels: European Commission.
[14] Fagan, G., J. Henry and R. Mestre (2001). `` An Area-Wide Model (AWM) for the euro area,'' Working Paper No. 42, European Central Bank.
[15] Galí, J., M. Gertler, and J. D. López-Salido (2002). `` Markups, Gaps, and the Welfare Costs of Business Fluctuations,'' National Bureau of Economic Research Working Paper No. 8850, March.
[16] Galí, J., and T. Monacelli (2002). `` Monetary Policy and Exchange Rate Volatility in a Small Open Economy,'' National Bureau of Economic Research Working Paper No. 8905, April.
[17] Hall, R. (1988). `` The Relation Between Price and Marginal Cost in U.S. Industry.'' Journal of Political Economy, Vol. 96, pp. 921-947.
[18] Hall, R., and C. Jones (1999). `` Why do Some Countries Produce So Much More Output per Worker than Others?" Quarterly Journal of Economics, Vol. 114 (February), pp. 83-116.
[19] Ireland, P. (2001). `` Sticky-Price Models of the Business Cycle: Specification and Stability.'' Journal of Monetary Economics 47, February, pp.3-18.
[20] Jean, S. and G. Nicoletti (2002). `` Product market Regulation and Wage Premia in Europe and North America,'' OECD Economics Department Working Paper ECO/WKP(2002)4.
[21] Kim, J. (2000). `` Constructing and Estimating a Realistic Optimizing Model of Monetary Policy.'' Journal of Monetary Economics 45, April, pp. 329-359.
[22] Laxton, D., P. Isard, H. Faruqee, E. Prasad, and B. Turtleboom (1998). `` MULTIMOD Mark III: The Core Dynamic and Steady-State Models,'' IMF Occasional Paper 164, Washington, DC: International Monetary Fund.
[23] Laxton, D., and P. N'Diaye (2002). `` Monetary Policy Credibility and the Unemployment-Inflation Trade-off: Some Evidence from 17 Industrial Countries,'' Working Paper WP/02/220, International Monetary Fund.
[24] Laxton, D., and P. Pesenti (2003). `` Monetary Policy Rules for Small, Open, Emerging Economies.'' Journal of Monetary Economics 50, July, pp. 1109-1146.
[25] MacFarlan, M., H. Edison, and N. Spatafora (2003). `` Growth and Institutions,'' in World Economic Outlook, April, Chapter 3, Washington, DC: International Monetary Fund.
[26] Martins, J.O., S. Scarpetta, and D. Pilat (1996). `` Mark-up Pricing, Market Structure and the Business Cycle.'' OECD Economic Studies 27 (II), pp.71-106.
[27] OECD (1997). OECD Report on Regulatory Reform. Paris: OECD.
[28] OECD (2003). The Sources of Economic Growth in OECD Countries. Paris: OECD.
[29] Pesenti, P. (2004). `` The IMF Global Economy Model (GEM): Theoretical Framework'', Working Paper, International Monetary Fund, forthcoming.
[30] Prescott, E.C. (2003). `` Why Do Americans Work So Much More Than Europeans?,'' Federal Reserve Bank of Minneapolis, Research Department Staff Report 231, November.
[31] Roeger, W. (1995). `` Can Imperfect Competition Explain the Difference Between Primal and Dual Productivity Measures? Estimates for U.S. Manufacturing.'' Journal of Political Economy 103, April, pp.316-330.
[32] Rotemberg, Julio J. (1982). `` Sticky Prices in the United States.'' Journal of Political Economy 90, December, pp.1187-1211.
[33] Schmitt-Grohe, S., and M. Uribe (2004). `` Optimal Fiscal and Monetary Policy under Sticky Prices.'' Journal of Economic Theory, Vol. 114, February, pp.198-230.
[34] Sims, C. (2002). `` The Role of Models and Probabilities in the Monetary Policy Process.'' Brookings Papers on Economic Activity, 2.
[35] Smets, F., and R. Wouters (2002a). `` Openness, Imperfect Exchange Rate Pass-Through and Monetary Policy.'' Journal of Monetary Economics, Vol. 49, pp. 947-81.
[36] Smets, F., and Wouters (2002b). `` An estimated stochastic dynamic general equilibrium model of the euro area,'' ECB Working Paper No. 171, August.
[37] Taylor, J. (1993). `` Discretion Versus Policy Rules in Practice.'' Carnegie-Rochester Conference Series on Public Policy, Vol. 39, pp. 195-214.
[38] Woodford M. (2003). Interest and Prices. Foundations of a Theory of Monetary Policy. Princeton, NJ: Princeton University Press.
Table 1: Assumptions About Parameters and Steady-State Ratios
| Parameters: | Euro Area (H) | Rest Ind. World (F) |
|---|---|---|
| Discount Rate |
|
|
| Depreciation Rate on
Capital |
0.025 | 0.025 |
| Habit Persistence
Parameters
|
0.97 (0.50) | 0.97 (0.50) |
| Intertemporal Elasticity of
Substitution |
5.00 | 5.00 |
| Elasticity of Input
Substitution for Intermediate Goods |
0.80 | 0.70 |
| Elasticity of Input
Substitution for Consumption |
2.50 | 2.50 |
| Elasticity of Input
Substitution for Investment Goods |
2.50 | 2.50 |
| Inverse of Frisch Elasticity
of Labor Supply |
3.00 | 3.00 |
| Adjustment Cost Parameter for
Imports of Consumption Goods
|
10.00 | 10.00 |
| Adjustment Cost Parameter for
Imports of Investment Goods
|
10.00 | 10.00 |
| Adjustment Cost Parameter for
Capital Accumulation |
1.00 | 1.00 |
| Adjustment Cost Parameter for
Investment Changes |
70.00 | 80.00 |
| Adjustment Cost Parameter for
Structural Wage Persistence |
1400 | 700 |
| Adjustment Cost Parameter for
Import Price Persistence |
0.00 | 0.00 |
| Adjustment Cost Parameter for
Domestic Prices Persistence |
1400 | 700 |
| Steady-State Ratios: | Euro Area (H) | Rest Ind. World (F) |
| Labor's Share | 0.47 | 0.58 |
| Consumption Goods-to-GDP Ratio | 0.78 | 0.78 |
| Private Consumption | 0.58 | 0.62 |
| Government Consumption | 0.20 | 0.16 |
| Investment Goods-to-GDP Ratio | 0.22 | 0.22 |
| Private Investment | 0.19 | 0.19 |
| Government Investment | 0.03 | 0.03 |
| Imports-to-GDP Ratio | 0.18 | 0.13 |
| Consumption Goods | 0.05 | 0.06 |
| Investment Goods | 0.13 | 0.07 |
Table 2: A Comparison of the Simulated Monetary Transmission Mechanism with the ECB's Area-Wide Model (Responses to a 100 Basis Point Interest Rate Hike)
| Variable: | Model: | Sum | Quarter 1 | Quarter 2 | Quarter 3 | Quarter 4 | Quarter 5 | Quarter 6 | Quarter 7 | Quarter 8 |
|---|---|---|---|---|---|---|---|---|---|---|
| Real GDP: | Home | -2.3 | -0.2 | -0.3 | -0.3 | -0.4 | -0.4 | -0.3 | -0.3 | -0.2 |
| Real GDP: | AWM | -2.0 | -0.1 | -0.2 | -0.2 | -0.3 | -0.3 | -0.3 | -0.3 | -0.3 |
| Consumption: | Home | -2.0 | -0.1 | -0.2 | -0.3 | -0.3 | -0.3 | -0.3 | -0.2 | -0.2 |
| Consumption: | AWM | -1.9 | -0.0 | -0.2 | -0.2 | -0.3 | -0.4 | -0.3 | -0.3 | -0.3 |
| Investment: | Home | -7.5 | -0.5 | -0.9 | -1.1 | -1.2 | -1.2 | -1.0 | -0.9 | -0.7 |
| Investment: | AWM | -7.8 | -0.1 | -0.5 | -0.8 | -1.2 | -1.5 | -1.4 | -1.3 | -1.2 |
| Exports: | Home | -1.3 | -0.1 | -0.2 | -0.2 | -0.2 | -0.2 | -0.2 | -0.1 | -0.1 |
| Exports: | AWM | -1.6 | -0.1 | -0.2 | -0.3 | -0.4 | -0.3 | -0.2 | -0.2 | -0.1 |
| Imports: | Home | -3.3 | -0.2 | -0.4 | -0.5 | -0.6 | -0.5 | -0.4 | -0.3 | -0.3 |
| Imports: | AWM | -4.9 | -0.2 | -0.5 | -0.7 | -0.9 | -0.9 | -0.7 | -0.6 | -0.6 |
| Real Exchange Rate: | Home | 3.5 | 1.2 | 1.0 | 0.7 | 0.4 | 0.2 | 0.0 | -0.0 | -0.0 |
| Real Exchange Rate: | AWM | -1.0 | 0.5 | 0.3 | 0.0 | -0.2 | -0.5 | -0.4 | -0.4 | -0.3 |
| CPI | Home | -0.5 | -0.0 | -0.0 | -0.0 | -0.1 | -0.1 | -0.1 | -0.1 | -0.1 |
| CPI | AWM | -0.4 | -0.0 | -0.0 | -0.0 | -0.0 | -0.1 | -0.1 | -0.1 | -0.1 |
Table 3: A Comparison of the Simulated Monetary Transmission Mechanism with Federal Reserve Board's FB-US Model (Responses to a 100 Basis Point Interest Rate Hike)
| Variable: | Model: | Sum | Quarter 1 | Quarter 2 | Quarter 3 | Quarter 4 | Quarter 5 | Quarter 6 | Quarter 7 | Quarter 8 |
|---|---|---|---|---|---|---|---|---|---|---|
| Real GDP: | Foreign | -2.3 | -0.2 | -0.3 | -0.4 | -0.4 | -0.4 | -0.3 | -0.2 | -0.2 |
| Real GDP: | FRB-US | -2.7 | -0.1 | -0.2 | -0.3 | -0.4 | -0.4 | -0.5 | -0.4 | -0.4 |
| Consumption: | Foreign | -1.9 | -0.1 | -0.2 | -0.3 | -0.3 | -0.3 | -0.2 | -0.2 | -0.1 |
| Consumption: | FRB-US | -2.6 | -0.1 | -0.2 | -0.3 | -0.4 | -0.4 | -0.4 | -0.4 | -0.4 |
| Investment: | Foreign | -6.3 | -0.5 | -0.8 | -1.0 | -1.1 | -1.0 | -0.8 | -0.6 | -0.4 |
| Investment: | FRB-US | -5.6 | -0.1 | -0.5 | -0.8 | -0.9 | -1.0 | -0.9 | -0.8 | -0.6 |
| Exports: | Foreign | -0.8 | -0.1 | -0.1 | -0.2 | -0.2 | -0.1 | -0.1 | -0.0 | 0.0 |
| Exports: | FRB-US | -1.8 | -0.0 | -0.1 | -0.1 | -0.2 | -0.3 | -0.3 | -0.4 | -0.4 |
| Imports: | Foreign | -2.0 | -0.2 | -0.3 | -0.4 | -0.4 | -0.3 | -0.3 | -0.2 | -0.1 |
| Imports: | FRB-US | -2.9 | -0.1 | -0.2 | -0.4 | -0.5 | -0.5 | -0.5 | -0.4 | -0.3 |
| Real Exchange Rate: | Foreign | 2.2 | 1.1 | 0.9 | 0.6 | 0.3 | -0.0 | -0.2 | -0.2 | -0.2 |
| Real Exchange Rate: | FRB-US | 4.3 | 1.0 | 0.9 | 0.7 | 0.6 | 0.4 | 0.3 | 0.2 | 0.2 |
| CPI | Foreign | -1.5 | -0.0 | -0.1 | -0.1 | -0.2 | -0.2 | -0.3 | -0.3 | -0.4 |
| CPI | FRB-US | -1.7 | -0.0 | -0.1 | -0.1 | -0.2 | -0.2 | -0.3 | -0.4 | -0.4 |
Table 4: Baseline Estimates of Markups and Sacrifice Ratios for the Euro Area and the United States
Markups and Elasticities of Substitution Price Markup
|
Markups and Elasticities of Substitution Wage Markup
|
Markups and Elasticities of Substitution
|
Markups and Elasticities of Substitution
|
Sacrifice Ratio | |
|---|---|---|---|---|---|
| euro area | 1.35 | 1.30 | 3.9 | 4.3 | 2.0 |
| United States | 1.23 | 1.16 | 5.4 | 7.3 | 0.9 |
Table 5: Model Estimates of the Long-Run Effects of More Competition-Friendly Policies in the Euro Area (Percent Deviations from Baseline)
| Product Market Reforms | Labor Market Reforms | Both Reforms | |
|---|---|---|---|
| Euro area: GDP | 8.6 | 3.5 | 12.4 |
| Euro area: Welfare (Consumption Equivalent) | 1.9 | 0.9 | 2.4 |
| Euro area: Consumption | 4.9 | 3.3 | 8.3 |
| Euro area: Investment | 17.0 | 3.5 | 21.2 |
| Euro area: Labor Effort | 4.5 | 3.6 | 8.3 |
| Euro area: Real Exchange Rate | 4.2 | 1.1 | 5.3 |
| Rest of world: GDP | 0.7 | 0.2 | 0.8 |
| Rest of world: Welfare (Consumption Equivalent) | 0.9 | 0.3 | 1.2 |
| Rest of world: Consumption | 1.0 | 0.3 | 1.3 |
| Rest of world: Investment | 0.5 | 0.1 | 0.7 |
| Rest of world: Labor Effort | 0.1 | 0.0 | 0.2 |
Table 6: Model Estimtaes of the Sacrifice Ratio under More Competition-Friendly Policies in the Euro Area (Percent Deviations from Baseline)
| Labor Market Reforms | Product Market Reforms | Both Reforms | |
|---|---|---|---|
| Sacrifice Ratio | 2.0
|
2.0
|
2.0
|
Figure 1: The Structure of the Model
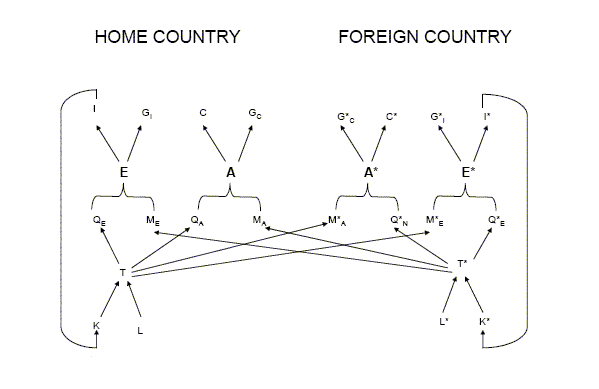
Figure 2: Consumption Responses to a 4-Quarter 100 Basis Point Hike in Interest Rates Under Alternative Assumptions for Habit Persistence and Intertemporal Substitution
![Figure 2 is a column panel of four graphs of impulse responses. The x-axis range is [1,8] for all graphs. The y-axis ranges are [2,-4], [1,-2], [0,-1.5], and [0,-0.3] respectively. Figure 2 reports some sensitivity analysis for exactly the same experiments conducted in Table 2 and 3. The top panel reports consumption responses for the Home country without habit persistence in consumption ($b_C=0$) for three values of the intertemporal elasticity of substitution that range between 1/3 and 3.0, with an intermediate case of 0.99 that approximates the assumption of logarithmic utility. The top panel shows that without habit persistence, consumption behaves as a pure jump variable in response to interest rate hikes, and indeed in all three cases consumption peaks (unrealistically) in the very first period when the shock is assumed to take place. The two middle panels report results when the habit persistence parameter as been set at 0.6 and 0.8 respectively, well within the consensus range of estimates for $b$. Consumption in these simulations falls significantly in the period when the shock occurs, and its magnitude grows only slightly over the next two quarters before quickly reverting to baseline. Realistic dynamics is obtained only with a combination of high habit persistence and low values of $\sigma$, as assumed in our calibration.](Figure2.gif)
Figure 3: Output, Consumption and Labor Effort Responses to a Disinflation Shock Under Alternative Assumptions About Habit Persistence in Labor Effort
![Figure 3 is a column panel of four graphs of impulse responses, each with four different assumptions for $b_L$: 0, 0.5, 0.9, and 0.95. The x-axis range is [1,50] for all graphs. The y-axis ranges are [0,-1.5] for CPI inflation, [0,-0.5] for GDP, [0,-0.4] for consumption, and [0.5,-1.0] for labor effort respectively. The impulse response (IR) for CPI inflation starts at zero and falls to about -1 at 12 quarters out, remaining at about that value, regardless of $b_L$. The IR for GDP drops from about -0.15 to -0.5 at 7 periods, then rising gradually back towards zero, with IRs of larger values of $b_L$ taking longer to tend back to zero. The IR for consumption drops from about -0.1 to -0.4 at 6 periods, then rising to between 0 and -0.2, depending upon $b_L$. The IR for labor effort drops from about -0.2 to -0.7 at 6 periods, then rising gradually back towards zero, with IRs of larger values of $b_L$ taking longer to tend back to zero.](Figure3.gif)
Figure 4: A Comparison of an Interest Rate Shock in the Model with VAR Estimates by Altig and others (2003)
![Figure 4 is a column panel of five graphs of impulse responses, comparing the model's IRs with those from Altig and others (2003).. The x-axis range is [1,20] for all graphs. The y-axis ranges are [1,-0.5] for the interest rate, [0.4,-0.4] for output, [0.4,-0.4] for consumption, [1,-2] for investment, and [0.5,-1.0] for the price level respectively. The dashed lines in Figure 4 report the impulse responses (and confidence bands) for the VAR while the solid line reports the responses in our model when the same interest rate path is imposed on the Foreign economy for the first 8 quarters of the simulation horizon. As can be seen in the Figure, with the exception of the impact responses, our results generally fit within the confidence bands for output, consumption, investment and the price level. It is noteworthy that our price level declines monotonically over time but the VAR's price level increases somewhat over the first year of the shock. This may reflect the fact that different prices indices are reported from the VAR (the GDP deflator) and for our model (the consumption deflator), as a result of which the VAR may have less feedback from the real exchange rate.](Figure4.gif)
Figure 5: Effects of Different Price and Wage Markups on Sacrifice Ratios and Long-Run Economic Activity (BASE-CASE PARAMETERS)
Long-Run Effects of Different Price Markups and Wage Markups
| 1.055 | 1.105 | 1.155 | 1.205 | 1.255 | 1.305 | 1.355 | 1.405 | 1.455 | 1.505 | 1.555 |
Home Country Long-run Effects of Higher Price Markups (In percent)
| GDP | -3.5 | -6.8 | -9.9 | -12.7 | -15.3 | -17.8 | -20.1 | -22.3 | -24.4 | -26.3 | -28.2 |
| Consumption | -2.0 | -3.9 | -5.9 | -7.7 | -9.6 | -11.4 | -13.1 | -14.8 | -16.5 | -18.1 | -19.6 |
| Investment | -7.2 | -13.7 | -19.4 | -24.6 | -29.2 | -33.4 | -37.2 | -40.7 | -43.9 | -46.8 | -49.5 |
| Labor Effort | -2.1 | -4.0 | -5.9 | -7.6 | -9.2 | -10.8 | -12.2 | -13.6 | -14.9 | -16.2 | -17.4 |
Real Exchange Rate (-appreciation) |
-1.8 | -3.6 | -5.1 | -6.6 | -8.0 | -9.3 | -10.5 | -11.6 | -12.7 | -13.8 | -14.7 |
Spillover Effects on Foreign Country of Higher Price Markups in Home Country (In percent)
| GDP | -0.3 | -0.5 | -0.8 | -1.0 | -1.2 | -1.3 | -1.5 | -1.7 | -1.8 | -2.0 | -2.1 |
| Consumption | -0.4 | -0.9 | -1.2 | -1.6 | -1.9 | -2.2 | -2.5 | -2.8 | -3.0 | -3.2 | -3.5 |
| Investment | -0.2 | -0.4 | -0.6 | -0.8 | -0.9 | -1.1 | -1.2 | -1.4 | -1.5 | -1.6 | -1.7 |
| Labor Effort | -0.1 | -0.1 | -0.1 | -0.2 | -0.2 | -0.3 | -0.3 | -0.3 | -0.3 | -0.4 | -0.4 |
Home Country Long-run Effects of Higher Wage Markups (In percent)
| GDP | -1.5 | -2.8 | -4.1 | -5.3 | -6.5 | -7.6 | -8.6 | -9.6 | -10.5 | -11.4 | -12.3 |
| Consumption | -1.4 | -2.6 | -3.8 | -5.0 | -6.0 | -7.1 | -8.0 | -9.0 | -9.9 | -10.7 | -11.5 |
| Investment | -1.5 | -2.8 | -4.1 | -5.3 | -6.5 | -7.6 | -8.6 | -9.6 | -10.6 | -11.5 | -12.4 |
| Labor Effort | -1.5 | -2.9 | -4.2 | -5.5 | -6.7 | -7.8 | -8.9 | -9.9 | -10.9 | -11.8 | -12.7 |
Real Exchange Rate (- appreciation) |
-0.5 | -0.9 | -1.4 | -1.8 | -2.2 | -2.5 | -2.9 | -3.2 | -3.6 | -3.9 | -4.2 |
Spillover Effects on Foreign Country of Higher Wage Markups in Home Country (In percent)
| GDP | -0.1 | -0.1 | -0.2 | -0.3 | -0.3 | -0.4 | -0.4 | -0.5 | -0.5 | -0.6 | -0.6 |
| Consumption | -0.1 | -0.2 | -0.3 | -0.4 | -0.5 | -0.6 | -0.7 | -0.8 | -0.9 | -0.9 | -1.0 |
| Investment | -0.1 | -0.1 | -0.2 | -0.2 | -0.3 | -0.3 | -0.3 | -0.4 | -0.4 | -0.5 | -0.5 |
| Labor Effort | -0.0 | -0.0 | -0.0 | -0.0 | -0.1 | -0.1 | -0.1 | -0.1 | -0.1 | -0.1 | -0.1 |
![Figure 5 plots the long-run effects on GDP of different price markups and wage markups, using base-case parameters. The GDP effect is in %, on the y-axis, with a range of [0,-30]. The price markups and wage markups are on the x-axis, with a range of [1.055,1.555]. The relationship between each markup and GDP is negative and nearly linear. For increasing price markups, the GDP effect shifts from about -4% to -28%; for increasing wage markups, from about -2% to -12%.](Figure5s.gif)
Sacrifice Ratios for Home Country Under Different Markups
| 1.005 | 1.055 | 1.105 | 1.155 | 1.205 | 1.255 | 1.305 | 1.355 | 1.405 | 1.455 | 1.505 | 1.555 | |
Sacrifice Ratio (Varying Price Markup) |
0.2 | 0.3 | 0.4 | 0.6 | 0.8 | 0.9 | 1.1 | 1.3 | 1.4 | 1.6 | 1.7 | 1.9 |
Sacrifice Ratio (Varying Wage Markup) |
0.2 | 0.5 | 0.8 | 0.9 | 1.1 | 1.2 | 1.3 | 1.4 | 1.5 | 1.6 | 1.7 | 1.8 |
Figure 6: Effects of Different Price and Wage Markups on
Sacrifice Ratios and Long-Run Economic Activity (BASE-CASE PARAMETERS WITH REDUCED FRISCH
ELASTICITY = 1/.15 = 6.7)
Long-Run Effects of Different Price Markups and Wage Markups
| 1.055 | 1.105 | 1.155 | 1.205 | 1.255 | 1.305 | 1.355 | 1.405 | 1.455 | 1.505 | 1.555 |
Home Country Long-run Effects of Higher Price Markups (In percent)
| GDP | -2.5 | -4.8 | -7.0 | -9.1 | -11 | -12.9 | -14.6 | -16.3 | -17.9 | -19.4 | -20.9 |
| Consumption | -1.0 | -2.0 | -3.0 | -4.1 | -5.2 | -6.3 | -7.4 | -8.5 | -9.6 | -10.7 | -11.7 |
| Investment | -6.2 | -11.8 | -16.8 | -21.4 | -25.6 | -29.4 | -32.9 | -36.1 | -39 | -41.8 | -44.3 |
| Labor Effort | -1.0 | -1.9 | -2.8 | -3.6 | -4.4 | -5.2 | -5.9 | -6.6 | -7.3 | -7.9 | -8.5 |
Real Exchange Rate (- appreciation) |
-1.5 | -2.9 | -4.2 | -5.4 | -6.6 | -7.6 | -8.6 | -9.6 | -10.5 | -11.3 | -12.1 |
Spillover Effects on Foreign Country of Higher Price Markups in Home Country (In percent)
| GDP | -0.2 | -0.4 | -0.6 | -0.7 | -0.9 | -1.0 | -1.1 | -1.3 | -1.4 | -1.5 | -1.6 |
| Consumption | -0.3 | -0.7 | -1.0 | -1.2 | -1.5 | -1.7 | -1.9 | -2.1 | -2.3 | -2.5 | -2.7 |
| Investment | -0.2 | -0.3 | -0.4 | -0.6 | -0.7 | -0.8 | -0.9 | -1.0 | -1.1 | -1.2 | -1.2 |
| Labor Effort | -0.0 | -0.0 | -0.1 | -0.1 | -0.1 | -0.1 | -0.1 | -0.1 | -0.1 | -0.1 | -0.2 |
Home Country Long-run Effects of Higher Wage Markups (In percent)
| GDP | -0.7 | -1.3 | -1.9 | -2.5 | -3.1 | -3.6 | -4.1 | -4.6 | -5.0 | -5.5 | -5.9 |
| Consumption | -0.6 | -1.2 | -1.8 | -2.3 | -2.9 | -3.4 | -3.8 | -4.3 | -4.7 | -5.1 | -5.5 |
| Investment | -0.7 | -1.3 | -1.9 | -2.5 | -3.1 | -3.6 | -4.1 | -4.6 | -5.1 | -5.5 | -6.0 |
| Labor Effort | -0.7 | -1.4 | -2.0 | -2.6 | -3.2 | -3.7 | -4.2 | -4.7 | -5.2 | -5.7 | -6.1 |
Real Exchange Rate (- appreciation) |
-0.2 | -0.4 | -0.6 | -0.8 | -1.0 | -1.2 | -1.4 | -1.5 | -1.7 | -1.8 | -2.0 |
Spillover Effects on Foreign Country of Higher Wage Markups in Home Country (In percent)
| GDP | -0.0 | -0.1 | -0.1 | -0.1 | -0.1 | -0.2 | -0.2 | -0.2 | -0.2 | -0.2 | -0.3 |
| Consumption | -0.1 | -0.1 | -0.1 | -0.2 | -0.2 | -0.3 | -0.3 | -0.3 | -0.4 | -0.4 | -0.5 |
| Investment | -0.0 | -0.0 | -0.1 | -0.1 | -0.1 | -0.1 | -0.1 | -0.2 | -0.2 | -0.2 | -0.2 |
| Labor Effort | -0.0 | -0.0 | -0.0 | -0.0 | -0.0 | -0.0 | -0.0 | -0.0 | -0.0 | -0.0 | -0.0 |
![Figure 6 plots the long-run effects on GDP of different price markups and wage markups, using base-case parameters with a reduced Frisch elasticity. The GDP effect is in %, on the y-axis, with a range of [0,-25]. The price markups and wage markups are on the x-axis, with a range of [1.055,1.555]. The relationship between each markup and GDP is negative and nearly linear. For increasing price markups, the GDP effect shifts from about -3% to -21%; for increasing wage markups, from about -1% to -6%.](Figure6s.gif)
Sacrifice Ratios for Home Country Under Different Markups
| 1.005 | 1.055 | 1.105 | 1.155 | 1.205 | 1.255 | 1.305 | 1.355 | 1.405 | 1.455 | 1.505 | 1.555 | |
Sacrifice Ratio (Varying Price Markup) |
0.1 | 0.2 | 0.3 | 0.5 | 0.6 | 0.8 | 0.9 | 1.0 | 1.2 | 1.3 | 1.5 | 1.6 |
Sacrifice Ratio (Varying Wage Markup) |
0.1 | 0.3 | 0.5 | 0.6 | 0.7 | 0.8 | 0.8 | 0.9 | 1.0 | 1.0 | 1.1 | 1.2 |
Figure 7: Effects of Different Price and Wage Markups on Sacrifice Ratios and Long-Run Economic Activity (BASE-CASE PARAMETERS WITH ELASTICITY OF SUBSTITUTION BETWEEN CAPITAL AND LABOR REDUCED BY 0.10)
Long-Run Effects of Different Price Markups and Wage Markups
| 1.055 | 1.105 | 1.155 | 1.205 | 1.255 | 1.305 | 1.355 | 1.405 | 1.455 | 1.505 | 1.555 |
Home Country Long-run Effects of Higher Price Markups (In percent)
| GDP | -3.5 | -6.7 | -9.7 | -12.5 | -15.1 | -17.6 | -19.9 | -22.1 | -24.2 | -26.2 | -28.1 |
| Consumption | -2.1 | -4.1 | -6.1 | -8.0 | -9.9 | -11.7 | -13.5 | -15.3 | -16.9 | -18.6 | -20.2 |
| Investment | -6.7 | -12.7 | -18.1 | -23.0 | -27.5 | -31.5 | -35.2 | -38.6 | -41.7 | -44.6 | -47.2 |
| Labor Effort | -2.1 | -4.1 | -6.0 | -7.8 | -9.4 | -11.0 | -12.5 | -13.9 | -15.3 | -16.6 | -17.8 |
Real Exchange Rate (- appreciation) |
-1.7 | -3.4 | -4.9 | -6.3 | -7.6 | -8.9 | -10.1 | -11.2 | -12.3 | -13.3 | -14.2 |
Spillover Effects on Foreign Country of Higher Price Markups in Home Country (In percent)
| GDP | -0.3 | -0.5 | -0.7 | -0.9 | -1.1 | -1.3 | -1.4 | -1.6 | -1.7 | -1.8 | -2.0 |
| Consumption | -0.4 | -0.8 | -1.2 | -1.5 | -1.8 | -2.1 | -2.4 | -2.6 | -2.9 | -3.1 | -3.3 |
| Investment | -0.2 | -0.4 | -0.5 | -0.7 | -0.8 | -0.9 | -1.0 | -1.1 | -1.3 | -1.3 | -1.4 |
| Labor Effort | 0.0 | -0.1 | -0.1 | -0.2 | -0.2 | -0.2 | -0.3 | -0.3 | -0.3 | -0.3 | -0.4 |
Home Country Long-run Effects of Higher Wage Markups (In percent)
| GDP | -1.5 | -2.8 | -4.1 | -5.3 | -6.5 | -7.6 | -8.6 | -9.6 | -10.5 | -11.4 | -12.3 |
| Consumption | -1.4 | -2.6 | -3.8 | -5.0 | -6.0 | -7.1 | -8.0 | -9.0 | -9.9 | -10.7 | -11.5 |
| Investment | -1.5 | -2.8 | -4.1 | -5.4 | -6.5 | -7.6 | -8.7 | -9.7 | -10.6 | -11.5 | -12.4 |
| Labor Effort | -1.5 | -2.9 | -4.2 | -5.5 | -6.7 | -7.8 | -8.9 | -9.9 | -10.9 | -11.8 | -12.7 |
Real Exchange Rate (- appreciation) |
-0.5 | -0.9 | -1.4 | -1.8 | -2.2 | -2.5 | -2.9 | -3.2 | -3.6 | -3.9 | -4.2 |
Spillover Effects on Foreign Country of Higher Wage Markups in Home Country (In percent)
| GDP | -0.1 | -0.1 | -0.2 | -0.3 | -0.3 | -0.4 | -0.4 | -0.5 | -0.5 | -0.6 | -0.6 |
| Consumption | -0.1 | -0.2 | -0.3 | -0.4 | -0.5 | -0.6 | -0.7 | -0.8 | -0.9 | -0.9 | -1.0 |
| Investment | -0.1 | -0.1 | -0.1 | -0.2 | -0.2 | -0.3 | -0.3 | -0.3 | -0.4 | -0.4 | -0.4 |
| Labor Effort | -0.0 | -0.0 | -0.0 | -0.0 | -0.1 | -0.1 | -0.1 | -0.1 | -0.1 | -0.1 | -0.1 |
![Figure 7 plots the long-run effects on GDP of different price markups and wage markups, using base-case parameters with the elasticity of substitution between capital and labor reduced by 0.10. The GDP effect is in %, on the y-axis, with a range of [0,-30]. The price markups and wage markups are on the x-axis, with a range of [1.055,1.555]. The relationship between each markup and GDP is negative and nearly linear. For increasing price markups, the GDP effect shifts from about -4% to -28%; for increasing wage markups, from about -2% to -12%.](Figure7s.gif)
Sacrifice Ratios for Home Country Under Different Markups
| 1.005 | 1.055 | 1.105 | 1.155 | 1.205 | 1.255 | 1.305 | 1.355 | 1.405 | 1.455 | 1.505 | 1.555 | |
Sacrifice Ratio (Varying Price Markup) |
0.2 | 0.3 | 0.5 | 0.6 | 0.8 | 1.0 | 1.2 | 1.4 | 1.6 | 1.7 | 1.9 | 2.1 |
Sacrifice Ratio (Varying Wage Markup) |
0.2 | 0.6 | 0.8 | 1.0 | 1.2 | 1.3 | 1.4 | 1.6 | 1.7 | 1.8 | 1.9 | 2.0 |
Figure 8: Effects of Different Price and Wage Markups on Sacrifice Ratios and Long-Run
Economic Activity (BASE-CASE PARAMETERS WITH REDUCED IMPORT
DEMAND ELASTICITIES  =
=
 = 1.5)
Long-Run Effects of Different Price Markups and Wage Markups
| 1.055 | 1.105 | 1.155 | 1.205 | 1.255 | 1.305 | 1.355 | 1.405 | 1.455 | 1.505 | 1.555 |
Home Country Long-run Effects of Higher Price Markups (In percent)
| GDP | -3.4 | -6.5 | -9.4 | -12.1 | -14.7 | -17.1 | -19.3 | -21.4 | -23.4 | -25.3 | -27.1 |
| Consumption | -1.5 | -3.0 | -4.6 | -6.2 | -7.8 | -9.4 | -10.9 | -12.5 | -14.0 | -15.5 | -16.9 |
| Investment | -7.1 | -13.4 | -19.1 | -24.2 | -28.8 | -32.9 | -36.7 | -40.1 | -43.3 | -46.2 | -48.9 |
| Labor Effort | -2.1 | -4.0 | -5.8 | -7.5 | -9.1 | -10.7 | -12.1 | -13.5 | -14.8 | -16.0 | -17.2 |
Real Exchange Rate (- appreciation) |
-3.7 | -7.0 | -10.0 | -12.7 | -15.2 | -17.6 | -19.7 | -21.7 | -23.6 | -25.3 | -26.9 |
Spillover Effects on Foreign Country of Higher Price Markups in Home Country (In percent)
| GDP | -0.6 | -1.1 | -1.5 | -2.0 | -2.4 | -2.7 | -3.1 | -3.4 | -3.7 | -4.0 | -4.3 |
| Consumption | -0.9 | -1.7 | -2.5 | -3.2 | -3.9 | -4.5 | -5.1 | -5.6 | -6.1 | -6.6 | -7.0 |
| Investment | -0.4 | -0.9 | -1.2 | -1.6 | -1.9 | -2.2 | -2.5 | -2.8 | -3.0 | -3.2 | -3.5 |
| Labor Effort | -0.1 | -0.2 | -0.3 | -0.4 | -0.4 | -0.5 | -0.6 | -0.6 | -0.7 | -0.7 | -0.8 |
Home Country Long-run Effects of Higher Wage Markups (In percent)
| GDP | -1.4 | -2.7 | -4.0 | -5.1 | -6.2 | -7.3 | -8.3 | -9.2 | -10.2 | -11.0 | -11.9 |
| Consumption | -1.2 | -2.3 | -3.4 | -4.4 | -5.4 | -6.3 | -7.2 | -8.0 | -8.8 | -9.6 | -10.3 |
| Investment | -1.4 | -2.7 | -4.0 | -5.2 | -6.3 | -7.4 | -8.4 | -9.3 | -10.3 | -11.1 | -12.0 |
| Labor Effort | -1.5 | -2.9 | -4.2 | -5.5 | -6.6 | -7.8 | -8.8 | -9.9 | -10.8 | -11.7 | -12.6 |
Real Exchange Rate (- appreciation) |
-0.9 | -1.8 | -2.7 | -3.5 | -4.2 | -5.0 | -5.6 | -6.3 | -6.9 | -7.5 | -8.1 |
Spillover Effects on Foreign Country of Higher Wage Markups in Home Country (In percent)
| GDP | -0.1 | -0.3 | -0.4 | -0.5 | -0.6 | -0.8 | -0.9 | -1.0 | -1.1 | -1.2 | -1.2 |
| Consumption | -0.2 | -0.5 | -0.7 | -0.9 | -1.0 | -1.2 | -1.4 | -1.6 | -1.7 | -1.9 | -2.0 |
| Investment | -0.1 | -0.2 | -0.3 | -0.4 | -0.5 | -0.6 | -0.7 | -0.8 | -0.9 | -0.9 | -1.0 |
| Labor Effort | -0.0 | -0.1 | -0.1 | -0.1 | -0.1 | -0.1 | -0.2 | -0.2 | -0.2 | -0.2 | -0.2 |
![Figure 8 plots the long-run effects on GDP of different price markups and wage markups, using base-case parameters with reduced import demand elasticities. The GDP effect is in %, on the y-axis, with a range of [0,-30]. The price markups and wage markups are on the x-axis, with a range of [1.055,1.555]. The relationship between each markup and GDP is negative and nearly linear. For increasing price markups, the GDP effect shifts from about -4% to -28%; for increasing wage markups, from about -2% to -12%.](Figure8s.gif)
Sacrifice Ratios for Home Country Under Different Markups
| 1.005 | 1.055 | 1.105 | 1.155 | 1.205 | 1.255 | 1.305 | 1.355 | 1.405 | 1.455 | 1.505 | 1.555 | |
Sacrifice Ratio (Varying Price Markup) |
0.1 | 0.3 | 0.4 | 0.6 | 0.7 | 0.9 | 1.1 | 1.2 | 1.4 | 1.5 | 1.7 | 1.8 |
Sacrifice Ratio (Varying Wage Markup) |
0.1 | 0.5 | 0.7 | 0.9 | 1.0 | 1.1 | 1.2 | 1.3 | 1.4 | 1.5 | 1.6 | 1.7 |
Figure 9: Effects of Different Price and Wage Markups on Sacrifice Ratios and Long-Run
Economic Activity (BASE-CASE PARAMETERS WITH REDUCED
INTERTEMPORAL ELASTICITY OF SUBSTITUTION 1/ = 1/0.99 )
Long-Run Effects of Different Price Markups and Wage Markups
| 1.055 | 1.105 | 1.155 | 1.205 | 1.255 | 1.305 | 1.355 | 1.405 | 1.455 | 1.505 | 1.555 |
Home Country Long-run Effects of Higher Price Markups (In percent)
| GDP | -3.2 | -6.1 | -8.8 | -11.3 | -13.6 | -15.8 | -17.9 | -19.9 | -21.7 | -23.4 | -25.1 |
| Consumption | -1.6 | -3.2 | -4.8 | -6.3 | -7.9 | -9.4 | -10.8 | -12.2 | -13.6 | -14.9 | -16.3 |
| Investment | -6.9 | -13.0 | -18.4 | -23.4 | -27.8 | -31.8 | -35.5 | -38.8 | -41.9 | -44.7 | -47.3 |
| Labor Effort | -1.7 | -3.3 | -4.7 | -6.1 | -7.4 | -8.6 | -9.7 | -10.8 | -11.8 | -12.8 | -13.7 |
Real Exchange Rate (- appreciation) |
-1.7 | -3.4 | -4.8 | -6.2 | -7.5 | -8.7 | -9.9 | -10.9 | -11.9 | -12.9 | -13.8 |
Spillover Effects on Foreign Country of Higher Price Markups in Home Country (In percent)
| GDP | -0.2 | -0.3 | -0.5 | -0.6 | -0.7 | -0.9 | -1.0 | -1.1 | -1.2 | -1.2 | -1.3 |
| Consumption | -0.3 | -0.7 | -0.9 | -1.2 | -1.4 | -1.7 | -1.9 | -2.1 | -2.3 | -2.4 | -2.6 |
| Investment | -0.1 | -0.2 | -0.3 | -0.4 | -0.5 | -0.6 | -0.7 | -0.8 | -0.8 | -0.9 | -0.9 |
| Labor Effort | 0.0 | 0.1 | 0.1 | 0.1 | 0.2 | 0.2 | 0.2 | 0.2 | 0.2 | 0.3 | 0.3 |
Home Country Long-run Effects of Higher Wage Markups (In percent)
| GDP | -1.2 | -2.3 | -3.4 | -4.4 | -5.3 | -6.2 | -7.1 | -7.9 | -8.7 | -9.5 | -10.2 |
| Consumption | -1.1 | -2.2 | -3.1 | -4.1 | -5.0 | -5.8 | -6.6 | -7.4 | -8.1 | -8.8 | -9.5 |
| Investment | -1.2 | -2.3 | -3.4 | -4.4 | -5.4 | -6.3 | -7.1 | -8.0 | -8.8 | -9.5 | -10.5 |
| Labor Effort | -1.2 | -2.4 | -3.5 | -4.5 | -5.5 | -6.4 | -7.3 | -8.2 | -9.0 | -9.8 | -10.5 |
Real Exchange Rate (- appreciation) |
-0.4 | -0.8 | -1.1 | -1.5 | -1.8 | -2.1 | -2.4 | -2.7 | -3.0 | -3.2 | -3.5 |
Spillover Effects on Foreign Country of Higher Wage Markups in Home Country (In percent)
| GDP | -0.0 | -0.1 | -0.1 | -0.1 | -0.2 | -0.2 | -0.2 | -0.3 | -0.3 | -0.3 | -0.4 |
| Consumption | -0.1 | -0.2 | -0.2 | -0.3 | -0.4 | -0.4 | -0.5 | -0.5 | -0.6 | -0.6 | -0.7 |
| Investment | -0.0 | -0.1 | -0.1 | -0.1 | -0.1 | -0.2 | -0.2 | -0.2 | -0.2 | -0.2 | -0.3 |
| Labor Effort | 0.0 | 0.0 | 0.0 | 0.0 | 0.0 | 0.0 | 0.0 | 0.1 | 0.1 | 0.1 | 0.1 |
![Figure 9 plots the long-run effects on GDP of different price markups and wage markups, using base-case parameters with a reduced intertemporal elasticity of substitution. The GDP effect is in %, on the y-axis, with a range of [0,-30]. The price markups and wage markups are on the x-axis, with a range of [1.055,1.555]. The relationship between each markup and GDP is negative and nearly linear. For increasing price markups, the GDP effect shifts from about -4% to -25%; for increasing wage markups, from about -1% to -10%.](Figure9s.gif)
Sacrifice Ratios for Home Country Under Different Markups
| 1.005 | 1.055 | 1.105 | 1.155 | 1.205 | 1.255 | 1.305 | 1.355 | 1.405 | 1.455 | 1.505 | 1.555 | |
Sacrifice Ratio (Varying Price Markup) |
0.2 | 0.3 | 0.5 | 0.6 | 0.8 | 1.0 | 1.2 | 1.4 | 1.6 | 1.8 | 2.0 | 2.2 |
Sacrifice Ratio (Varying Wage Markup) |
0.2 | 0.6 | 0.8 | 1.0 | 1.2 | 1.3 | 1.4 | 1.5 | 1.6 | 1.7 | 1.8 | 1.9 |
Footnotes
1. We are indebted to Lawrence Christiano, Jerome Henry, and David Reifschneider for sharing data and simulation results. We thank Ignazio Angeloni, Günter Coenen, Dale Henderson, Patrick Minford, Assaf Razin, Ken Rogoff, Stefano Scarpetta, Mike Woodford and seminar participants at the II International Research Forum on Monetary Policy at the Federal Reserve Board of Governors, the Bank of Finland, the Bank of Canada, the Nederlandsche Bank, Cornell University and the University of Houston for comments and suggestions. The views expressed here are those of the authors, and do not necessarily reflect the position of the International Monetary Fund, the Federal Reserve Bank of New York, the Federal Reserve System, or any other institution with which the authors are affiliated. Correspondence: [email protected]; [email protected];[email protected]. Return to text
2. See MacFarlan, Edison, and Spatafora (2003) for a survey. Key references include Hall and Jones (1999) and Acemoglu, Johnson, and Robinson (2002). Prescott (2003) stresses the role of tax asymmetries in accounting for differences in labor supply across time and across countries. Return to text
3. For a recent assessment of the extent of regulation in Europe, as well as the reform process in labor and product markets, see Blanchard (2004). Return to text
4. Such summits have been held in Luxembourg, Cologne, Cardiff, Lisbon (twice), and Barcelona. See Baily (2003) for a detailed analysis. Return to text
5. Earlier work includes OECD (1997) and European Commission (2002). Return to text
6. See Woodford (2003), Part I, and its references for an introduction to the literature. Return to text
7. The model introduced in this section is a variant of the International Monetary Fund's Global Economy Model (GEM). For a detailed presentation of GEM see Laxton and Pesenti (2003) and Pesenti (2004). Return to text
8. The convention throughout the
model is that variables which are not explicitly indexed (to firms
or households) are expressed in per-capita (average) terms. For
instance,
![]() .
Return to text
.
Return to text
9. According to our specification,
it is costly for the firm to adjust its current imports/output
ratio
![]() relative to the past aggregate
(sectoral) imports/output ratio
relative to the past aggregate
(sectoral) imports/output ratio
![]() . Return to
text
. Return to
text
10. To wit,
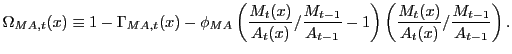 Return to text
11. For instance, Home firm
![]() 's demand for the
basket of local intermediates is:
's demand for the
basket of local intermediates is:
12. See among others Rotemberg (1982) and Ireland (2001). Return to text
13. Substantially, this is the `local currency pricing' scenario with low exchange rate pass-through analyzed by Devereux and Engel (2003), Corsetti and Pesenti (2001) and others. Return to text
14. This specification allows for habit persistence in labor effort and is not standard in the literature. It allows for the possibility that there can be additional costs to large business cycles if they result in excessive variability in labor effort. Return to text
15. Our timing convention has
![]() and
and
![]() as
agent
as
agent ![]() 's nominal bonds
accumulated during period
's nominal bonds
accumulated during period ![]() and carried over into period
and carried over into period ![]() . Return to
text
. Return to
text
16. International arbitrage makes the second bond redundant for consumption-smoothing purposes. Return to text
17. Home agents face a transaction
cost
![]() when they
take a position in the Foreign bond market. This cost depends on
the average net asset position of the whole economy, that is
when they
take a position in the Foreign bond market. This cost depends on
the average net asset position of the whole economy, that is
![]() ,
and is zero only when Home agents do not hold any Foreign-currency
assets (
,
and is zero only when Home agents do not hold any Foreign-currency
assets (
![]() ). This
implies that in a non-stochastic steady state Home agents have no
incentive to hold Foreign bonds and net asset positions are zero
worldwide. Return to text
). This
implies that in a non-stochastic steady state Home agents have no
incentive to hold Foreign bonds and net asset positions are zero
worldwide. Return to text
18. Following Schmitt-Grohe and
Uribe (2004), the particular functional form for the transaction
cost is
![]() Return to text
Return to text
19. See Taylor (1993). Return to text
20. In a steady state with constant
inflation target ![]() it
is:
it
is:
![]() , and when all targets are reached it must be the case that:
, and when all targets are reached it must be the case that:
![]() Return to text
Return to text
21. It is worth noticing that in
equilibrium
![]() ,
,
![]() ,
,
![]() ,
,
![]() ,
,
![]() ,
,
![]() ,
, ![]() ,
,
![]() . Return to text
. Return to text
22. In the model, real income and other macro variables are measured in terms of consumption baskets, and thereby affected by current changes in relative prices. In the simulation exercises where we compare our results to other models, which are based on data from national accounts, our measure of real (constant-dollar) GDP is obtained by evaluating expenditures using fixed (steady-state) relative prices. Return to text
23. To calibrate the dynamics of the Foreign country we rely heavily upon model results for the U.S. economy. Return to text
24. See the discussion in Galí, Gertler, and López-Salido (2002). Return to text
25. The authors argue that, in models with significant adjustment costs on imports, a large long-run import price elasticity is not inconsistent with smaller estimates of short-run and medium-term elasticities as derived from aggregate trade equations. Return to text
26. Our calibration gives rise to a plausible, empirically-based, representation of macroeconomic dynamics. At a minimum, it establishes a sensible set of initial priors based on central bank modelers' views about the monetary transmission mechanism, setting the stage for the introduction of Bayesian estimation methods as considered in Sims (2002). Return to text
27. The rule in the simulations
places equal weights of 0.5 on the output gap (
![]() ), the
inflation gap (
), the
inflation gap (
![]() ), and the
interest rate smoothing term (
), and the
interest rate smoothing term (
![]() ). The money
demand parameters
). The money
demand parameters ![]() and
and ![]() are set at 0.011 and 0.075 respectively as
in Laxton and Pesenti (2003). Return to
text
are set at 0.011 and 0.075 respectively as
in Laxton and Pesenti (2003). Return to
text
28. These responses are reported in Fagan, Henry and Mestre (2001). Return to text
29. The FRB-US results were kindly provided by David Reifschneider. Return to text
30. When preferences are additive over consumption and leisure, the main virtue of logarithmic utility is that it gives rise to a balanced growth path. Return to text
31. To understand how combinations
of ![]() and
and ![]() generate different dynamic
responses it may be useful to consider the linearized version of
the Euler equation (30) ignoring transaction costs
generate different dynamic
responses it may be useful to consider the linearized version of
the Euler equation (30) ignoring transaction costs
![]() in eq.
(29):
in eq.
(29):
![]() . As can be seen from this equation a habit persistence
parameter that approaches 1 induces a first-order lag that
approaches 1/2 and, for a given
. As can be seen from this equation a habit persistence
parameter that approaches 1 induces a first-order lag that
approaches 1/2 and, for a given ![]() , reduces the sensitivity of consumption to
changes in the real interest rate. Return to text
, reduces the sensitivity of consumption to
changes in the real interest rate. Return to text
32. A caveat is worth mentioning.
Our initial empirical work was based on pre-filtering the data
prior to estimation. We expect that estimates of parameters such as
![]() , which
fundamentally influence the speed of adjustment of the model, might
well contain significant pre-filter bias. Return to text
, which
fundamentally influence the speed of adjustment of the model, might
well contain significant pre-filter bias. Return to text
33. The parameters are different as the sensitivity of investment to interest rates appears to vary between the euro area and the United States. Return to text
34. This calibration of the adjustment costs for investment dynamics is very similar to Altig and others (2003) who assume zero adjustment costs on capital formation but significant adjustment costs on the change in investment. Return to text
35. Sensitivity analysis shows that our results do not change significantly when we relax these assumptions. Return to text
36. See Erceg and Levin (2001) and Laxton and N'Diaye (2002). Return to text
37. Altig and others (2003) emphasize that the initial effect of a rise in interest rates may be to raise marginal costs, thus explaining why the price level needs to rise temporarily before declining. Return to text
38. This ceteris paribus approach downplays the fact that lack of competition in product markets tends to lead to higher wage markups, implying that the two markups are generally not independent of each other: see Jean and Nicoletti (2002) and the discussion in Section 4.4. Return to text
39. This concavity stems largely from the fact that a percentage point increase in the markup has a smaller percentage increase on overall prices or wages as the markup itself increases. Return to text
40. Andrés, Ortega and Vallés (2003) emphasize that the relative degree of market competition across countries is a crucial factor governing price responses to shocks. Small deviations in the degree of competition may be responsible for temporary inflation differentials of up to 28 basis points when the economies are subject to a common monetary policy shock. Return to text
41. This is a more limited shift in value compared to the base case than for the other parameters, as larger changes in this coefficient require a recalibration of other parts of the model. Return to text
42. In addition, Martins, Scarpetta and Pilat (1996) note that manufacturing markups are often lower in homogeneous industries, characterized by low R&D spending, than differentiated industries where such spending is higher, and this difference may reflect the return to innovation. Simple calculations suggest that the markup for homogeneous manufacturing industries is about 11 percent in the United States compared with 19 percent in the euro area, with little impact on the economy-wide markups quoted above. Return to text
43. Germany is not included in the study. Spain is also excluded, as mentioned in the text, as the high use of part-time workers reduces the reliability of the results. Return to text
44. Assume that the average regulatory burden in the public sector in the euro area is larger than the economy as a whole by around 1 1/2 (see Figure 1 in Jean and Nicoletti (2002)) and that such activity makes up 5-10 percent of the euro area economy. The bias is equal to (1 1/2 (additional regulatory burden) times (0.2+0.35) (bias in the coefficient on regulation) times 0.05 or 0.1 (proportion of activity in public sector) divided by 0.95 or 0.9 (proportion of activity not in public sector), which given a range of 0.04-0.09. Return to text
45. This remains above the 0.9 estimate for the United States, as the euro area has higher costs of adjustment. Return to text
46. Denoting ![]() and
and ![]() as the baseline levels for consumption and labor
effort, and
as the baseline levels for consumption and labor
effort, and ![]() and
and
![]() as the new
steady-state levels after the markup change, the consumption
equivalent
as the new
steady-state levels after the markup change, the consumption
equivalent ![]() is
defined implicitly by
is
defined implicitly by
![]() , that is a measure of the permanent change in consumption
required to achieve the new level of utility holding labor effort
constant at its original (baseline) steady-state value. Note that
our model specification implies that the marginal utility
(disutility) of consumption (labor effort) is independent of habit
persistence parameters
, that is a measure of the permanent change in consumption
required to achieve the new level of utility holding labor effort
constant at its original (baseline) steady-state value. Note that
our model specification implies that the marginal utility
(disutility) of consumption (labor effort) is independent of habit
persistence parameters ![]() and
and ![]() . When we compute the long-term effects of a
change in markups on consumer welfare, the utility metrics also
abstracts from habit persistence in either consumption or labor
effort. Return to text
. When we compute the long-term effects of a
change in markups on consumer welfare, the utility metrics also
abstracts from habit persistence in either consumption or labor
effort. Return to text
This version is optimized for use by screen readers. A printable pdf version is available.