
Board of Governors of the Federal Reserve System
International Finance Discussion Papers
Number 845, November 2005 --- Screen Reader
Version*
DSGE Models of High Exchange-Rate Volatility and Low Pass-Through*
NOTE: International Finance Discussion Papers are preliminary materials circulated to stimulate discussion and critical comment. References in publications to International Finance Discussion Papers (other than an acknowledgment that the writer has had access to unpublished material) should be cleared with the author or authors. Recent IFDPs are available on the Web at http://www.federalreserve.gov/pubs/ifdp/. This paper can be downloaded without charge from the Social Science Research Network electronic library at http://www.ssrn.com/.
Abstract:
This paper develops a quantitative, dynamic, open-economy model which endogenously generates high exchange rate volatility, whereas a low degree of exchange rate pass-through (ERPT) stems from both nominal rigidities (in the form of local currency pricing) and price discrimination. We model real exchange rate volatility in response to real shocks by reconsidering and extending two approaches suggested by the quantitative literature (one by Backus Kehoe and Kydland [1995], the other by Chari, Kehoe and McGrattan [2003]), within a common framework with incomplete markets and segmented domestic economies. We show that, in our framework, both approaches are successful in generating volatility without suffering from shortcomings such as a fall in import volatility, or the need for nominal shocks. Our model accounts for a variable degree of ERPT over different horizons. In the short run, we find that a very small amount of nominal rigidities -- consistent with the evidence in Bils and Klenow [2004] -- lowers the elasticity of import prices at border and consumer level to 27% and 13%, respectively. Still, exchange rate depreciation worsens the terms of trade - in accord with the evidence stressed by Obstfeld and Rogoff [2000]. In the long run, ERPT coefficients are also below one, as a result of price discrimination. We run a set of regressions adopted by the empirical literature on ERPT, typically plagued by omitted variable bias and measurement errors, on the time series generated by our model. The ERPT estimates are biased, but in most cases not off the mark; most regressions can detect differences between short-run and long-run ERPT. We show that the quality of empirical proxies for marginal costs and demand typically vary depending on the shocks (real vs. nominal) hitting the economy.
Keywords: International business cycle, exchange rate volatility, pass-through, international transmission, DSGE models
JEL classification: F33, F41
1 Introduction
An important issue in the open macro literature is how to reconcile high exchange-rate volatility with the stability of prices in local currency. One view stresses nominal rigidities: if import prices are sticky in the currency of the importer - the argument goes - large movements in nominal exchange rates will not fully pass through to prices, and exchange-rate movements must be more pronounced to bring about the required equilibrium adjustment in relative prices in response to shocks to fundamentals. The view that incomplete pass-through is essentially linked to nominal rigidities, however, has been challenged on empirical and theoretical grounds. A large body of both micro and macro literature has argued that, independently of nominal frictions, incomplete exchange rate pass-through can result from price discrimination, i.e. optimal destination-specific markup adjustment by firms, as well as from a large component of non-tradable services and goods in the price of final goods. In the open macro literature, Obstfeld and Rogoff [2000] have argued that models attributing local currency price stability exclusively to nominal rigidities cannot fit the positive correlation between exchange rates and the terms of trade (depreciation worsens the terms of trade) found in the data. Most crucially, recent studies estimating general equilibrium quantitative models adopting the above approach, find that the degree of stickiness is unrealistically larger for the price of imports, than for the price of domestically produced tradables -- a result suggesting misspecification (e.g. see Lubik and Schorfheide [2005]). Note that, taken at face value, such result would exacerbate the counterfactual implications for the behavior of the terms of trade pointed out by Obstfeld and Rogoff.
In this paper, we address the general equilibrium link between exchange-rate volatility and stability of goods prices in a quantitative framework which encompasses both price discrimination and nominal rigidities, and endogenously generates large swings of the exchange rate in response to shocks to fundamentals. The literature suggests at least two approaches to modelling endogenous exchange-rate volatility in a rational expectations framework: the first is pursued by Backus, Kehoe, and Kydland [1995] -- which we label the elasticity approach -- the other by Chari, Kehoe and McGrattan [2003] -- which we label the risk-aversion approach. We reconsider these approaches in a standard international business cycle framework with traded and nontraded goods (e.g. Stockman and Tesar [1995]), assuming incomplete asset markets and a realistic degree of market segmentation. We show that the main properties of the two approaches nicely generalize to our environment, addressing some important issues raised by previous literature.
More precisely, when pursuing the elasticity approach, we run a set of experiments where the impact of productivity shocks on international prices is magnified by a relatively low price elasticity of imports, choosing parameter values on the low end of the range commonly adopted by the literature. In Corsetti, Dedola and Leduc [2004] we have already shown that, under this approach, international prices are as volatile as in the data. In this paper we extend this result to a model with price rigidities. Most important, while in the BKK framework the response of import quantities to shocks tends to fall with their price elasticity, we show that in our model with incomplete asset markets the import volatility is not lower than in comparable international DSGE models (though somewhat low relative to the data).
When pursuing the approach by Chari, Kehoe and McGrattan [2003] (henceforth CKM), we exploit the positive and strict link between the ratio of marginal utilities of consumption and the real exchange rate that characterizes economies with complete markets. With power utility, if relative risk aversion is sufficiently high, the variability of the ratio of Home to Foreign consumption observed in the data can correspond to large equilibrium movements in the real exchange rate. CKM emphasize nominal rigidities -- in their model, as import prices are sticky in local currency, monetary shocks do not spill over to foreign consumption -- and show that a similar mechanism works in a large class of models with incomplete markets. A notable result of this paper is to show that the CKM mechanism also works quite well in the absence of nominal rigidities, provided that the national economies are sufficiently insulated from one another by the presence of nontraded goods. In other words, in our model the CKM approach generates exchange rate volatility in response to real shocks both in a flex-price and a sticky price environment.
In either set of experiments, our model allows for markets segmentation and deviations from the law of one price. Following Burstein, Neves and Rebelo [2001] and Corsetti and Dedola [2005], market segmentation in the tradable sector of our economies is an implication of the presence of distribution sector intensive in local inputs. There are at least two advantages in adopting this specification. First, due to distribution, large exchange-rate swings do not translate into large CPI movements even when all prices are fully flexible: retail prices of imported goods reflect only a small proportion of movements in import prices at the border. Second, distribution services induce differences in demand elasticity across countries. Thus, with monopolistic producers the law of one price does not hold in general: in a flexible price equilibrium, firms would optimally charge different wholesale prices in the domestic and foreign markets, and would not move prices one-to-one with exchange rate movements. Hence, when we allow for nominal frictions -- assuming that foreign exporters face costs in adjusting prices in local currencies -- the stability of import prices in local currency does not depend exclusively on price rigidities.
Our quantitative framework yields the following results. First, in all our experiments, our economies generate highly volatile international prices and can account for persistent and highly correlated movements in real and nominal exchange rates, even for a relatively low degree of nominal rigidity or under flexible prices. What is remarkable about this result is that, contrary to the presumption underlying the vast literature on the PPP puzzle emphasizing nominal shocks, international price volatility and persistence are generated by real shocks.
Second, for a degree of price stickiness consistent with the evidence in Bils and Klenow [2004], i.e. assuming that prices are kept unchanged on average for 4.3 months, the real exchange rate is positively correlated with the terms of trade and the price of imports, while it is only very weakly so with the consumer price level. We stress that this result is consistent with the evidence emphasized by Obstfeld and Rogoff [2000]. These authors strongly argue against the hypothesis of `local currency pricing' (henceforth LCP) on the ground that models assuming it predict a counterfactual negative correlation between exchange rates and terms of trade. Our quantitative analysis shows that some versions of LCP may actually match the empirical evidence, provided that the degree of nominal rigidities is not very high. Indeed, when we increase the average degree of price stickiness from 4.3 months to 3 quarters, the correlation between exchange rates and terms of trade switches sign, and becomes negative.
Third, we find that a reasonably small degree of price stickiness generates a very low degree of exchange rate pass-through in the short run. Using our model we derive an exact (linearized) equation for import prices in the exchange rate, marginal costs in local currency, distribution costs and leads and lags in import prices driven by optimal forward-looking price-setting. This equation isolates nominal and real determinants of pass-through in the short and the long run. In a structural sense, assuming that prices are kept unchanged on average for 4.3 months (once again, in line with the evidence in Bils and Klenow [2004]), the short-run pass-through coefficient in our model is as low as 0.27. This coefficient falls to 0.04 when our measure of price stickiness is set equal to 3 quarters. Because of distribution, the exchange-rate pass-though coefficients for imported goods at the consumer-price level are half as large as those for import prices at the borders. The predicted elasticity of the overall CPI with respect to exchange rate movements is even lower.
These results suggest that, while nominal rigidities may play an important role in determining a low degree of exchange-rate pass-through into consumer and producer prices in the short run, models that disregard nontradability, distribution, and price discrimination may severely distort the importance of nominal frictions.1 In our specification, the magnitude of nominal frictions to generate realistic degree of pass-through need not be very high, and in any case realistically smaller than in these models. Moreover, consistent with the evidence in Giovannini [1988], Marston [1990], and Campa and Goldberg [2002], our model predicts that imperfect exchange-rate pass-through lasts longer than the period in which prices are sticky on average, generating long-run deviations from the law of one price. Clearly, these deviations cannot be explained by models assuming that incomplete pass-through is due exclusively to nominal rigidities.
We conclude our analysis by reconsidering the empirical literature in light of our theoretical and quantitative results. As is well known, estimates of pass-through coefficients are core inputs in the inflation projections that are used in monetary policy decision making. But data availability constrains the specification of regression models, which are therefore plagued by measurement errors and omitted variable bias. Using our quantitative model, we can analyze the implications of these deficiencies for the performance of regression models, controlling for the economic structure and shocks generating incomplete pass-through and exchange rate movements.
We specify two regression models typically adopted in the literature -- that we dub Pricing to Market (PTM) and Exchange Rate Pass-through (ERPT). Both regression specifications rely on proxies of the true marginal costs and ignore distribution costs -- evidence on the importance of the latter among the determinants of local currency price stability for imports is provided by Goldberg and Verboven [2001]. Based on our theoretical specification, we first express the estimation bias in pass-through regressions as a function of (a) the volatility of the exchange rate and (b) the covariance between the exchange rate and the determinants of import prices: a high volatility of the exchange rate tends to reduce the bias;2 however, since the exchange rate is endogenous, the effects of high volatility on the regression bias can be offset by the covariance terms. Second, we run both the PTM and the ERPT regressions on the time series simulated using our model. Remarkably, in our quantitative exercises the two regression models perform well in two dimensions. First, in most cases they detect differences in the short- and long-run pass-through coefficients when they are structurally different, while setting the two equal to each other when they are the same. Second, they provide point estimates that, although biased, are not necessarily off the mark.3 The performance of these regression models clearly depend on how well the regressors proxy for marginal costs and demand conditions. We illustrate this point by showing that conditioning on a different set of shocks (real versus nominal) can change the quality of the variables typically included in empirical analyses as proxies for marginal costs and demand, causing a reversal in the ranking of alternative regression models.
The paper is structured as follows. Section 2 will describe the model and the calibration will be discussed in Section 3. We discuss the predictions of our model regarding the degree of exchange-rate pass-through in Section 4. We discuss empirical models of pass-through. The last section concludes.
2 The model
The world economy consists of two countries of equal size,
![]() and
and ![]() . Each country
specializes in one type of tradable good, produced in a number of
varieties or brandsdefined over a continuum of unit mass. Brands of
tradable goods are indexed by
. Each country
specializes in one type of tradable good, produced in a number of
varieties or brandsdefined over a continuum of unit mass. Brands of
tradable goods are indexed by
![]() in the Home country and
in the Home country and
![]() in the Foreign country. In
addition, each country produces an array of differentiated
nontradables, indexed by
in the Foreign country. In
addition, each country produces an array of differentiated
nontradables, indexed by
![]() . Nontraded goods are either
consumed or used to make intermediate tradable goods
. Nontraded goods are either
consumed or used to make intermediate tradable goods![]() and
and![]() available to domestic consumers.
available to domestic consumers.
Firms producing tradable and nontraded goods are monopolistic
suppliers of one brand of goods only. These firms combine capital
with differentiated domestic labor inputs in a continuum of unit
mass. Each worker occupies a point in this continuum, and acts as a
monopolistic supplier of a differentiated type of labor input to
all firms in the domestic economy. Households/workers are indexed
by
![]() in the Home country and
in the Home country and
![]() in the Foreign
country. Firms operating in the distribution sector, by contrast,
are assumed to operate under perfect competition.4 They buy
tradable goods and distribute them to consumers using nontraded
goods as the only input in production.
in the Foreign
country. Firms operating in the distribution sector, by contrast,
are assumed to operate under perfect competition.4 They buy
tradable goods and distribute them to consumers using nontraded
goods as the only input in production.
In our baseline model, prices will be assumed to be perfectly flexible. In alternative specifications, we will introduce nominal price rigidities by assuming that firms face a quadratic cost of adjusting goods' prices. In what follows, we describe our set up focusing on the Home country, with the understanding that similar expressions also characterize the Foreign economy -- whereas variables referred to Foreign firms and households are marked with an asterisk.
2.1 The Household's Problem
2.1.1 Preferences
The representative Home agent in the model maximizes the expected value of her lifetime utility, given by:
![$\displaystyle E\left\{ \sum_{t=0}^{\infty}U\left[ C_{t},\frac{M_{t+1}}{P_{t}} ,L_{t}\right] \exp\left[ \sum_{\tau=0}^{t-1}-\nu\left( U\left[ C_{t} ,\frac{M_{t+1}}{P_{t}},L_{t}\right] \right) \right] \right\} ,$](img13.gif)
|
(1) |
where instantaneous utility ![]() is a function of a
consumption index,
is a function of a
consumption index, ![]() leisure,
leisure,
![]() and real money balances
and real money balances
![]() . This recursive
specification of preferences, according to which the discount
factor is a function of past utility levels, guarantees the
existence of a unique invariant distribution of wealth, independent
of initial conditions.5 c(
. This recursive
specification of preferences, according to which the discount
factor is a function of past utility levels, guarantees the
existence of a unique invariant distribution of wealth, independent
of initial conditions.5 c(
Households consume all types of (domestically-produced)
nontraded goods, and both types of traded goods. So
![]() is consumption of brand
is consumption of brand
![]() of Home nontraded good by agent
of Home nontraded good by agent ![]() at time
at time ![]() ;
;
![]() and
and
![]() are the same agent's consumption
of Home brand
are the same agent's consumption
of Home brand ![]() and Foreign brand
and Foreign brand ![]() .
For each type of good, we assume that one brand is an imperfect
substitute for all other brands, with constant elasticity of
substitution
.
For each type of good, we assume that one brand is an imperfect
substitute for all other brands, with constant elasticity of
substitution
![]() and
and
![]() . Consumption
of Home and Foreign goods by Home agent
. Consumption
of Home and Foreign goods by Home agent ![]() is defined
as:
is defined
as:
![$\displaystyle \equiv\left[ \int_{0}^{1}C_{t}(h,j)^{\frac {\theta_{\text{\textsc{H}}}-1}{\theta_{\text{\textsc{H}}}}}dh\right] ^{\frac{\theta_{\text{\textsc{H}}}}{\theta_{\text{\textsc{H}}}-1}}\text{, \ \ \ \ \ \ \ }C_{\text{\textsc{F}},t}(j)\equiv\left[ \int_{0}^{1} C_{t}(f,j)^{\frac{\theta_{\text{\textsc{H}}}-1}{\theta_{\text{\textsc{H}}}} }df\right] ^{\frac{\theta_{\text{\textsc{H}}}}{\theta_{\text{\textsc{H}}}-1} },$](img30.gif)
|
|
![$\displaystyle \equiv\left[ \int_{0}^{1}C_{t}(n,j)^{\frac {\theta_{\text{\textsc{N}}}-1}{\theta_{\text{\textsc{N}}}}}dn\right] ^{\frac{\theta_{\text{\textsc{N}}}}{\theta_{\text{\textsc{N}}}-1}}.$](img32.gif)
|
The full consumption basket, ![]() , in each
country is defined by the following CES aggregator
, in each
country is defined by the following CES aggregator
![$\displaystyle C_{t}\equiv\left[ a_{\text{\textsc{T}}}^{1-\phi}C_{\text{\textsc{T}},t} {}^{\phi}+a_{\text{\textsc{N}}}^{1-\phi}C_{\text{\textsc{N}},t}{}^{\phi }\right] ^{\frac{1}{\phi}},\qquad\phi<1\text{,}$](img34.gif)
|
(2) |
where
![]() and
and
![]() are the weights on the
consumption of traded and nontraded goods, respectively and
are the weights on the
consumption of traded and nontraded goods, respectively and
 is the constant elasticity
of substitution between
is the constant elasticity
of substitution between
![]() and
and
![]() . The consumption
index of traded goods
. The consumption
index of traded goods
![]() is given by the
following CES aggregator
is given by the
following CES aggregator
![$\displaystyle C=C_{\text{\textsc{T}}}=\left[ a_{\text{\textsc{H}}}^{1-\rho} C_{\text{\textsc{H}}}^{\rho}+a_{\text{\textsc{F}}}^{1-\rho}C_{\text{\textsc{F} }}^{\rho}\right] ^{\frac{1}{\rho}},\qquad\rho<1.$](img41.gif)
|
(3) |
2.1.2 Budget constraints and asset markets
Home and Foreign agents hold an international bond,
![]() , which pays in units of
Home currency and is zero in net supply. Only domestic residents
hold the Home currency,
, which pays in units of
Home currency and is zero in net supply. Only domestic residents
hold the Home currency,![]() . Households derive
income from working,
. Households derive
income from working,
![]() from renting capital to firms,
from renting capital to firms,
![]() , from previously accumulated units
of currency, and from the proceeds from holding the international
bond,
, from previously accumulated units
of currency, and from the proceeds from holding the international
bond,
![]() where
where
![]() is the nominal bond's yield, paid at
the beginning of period
is the nominal bond's yield, paid at
the beginning of period ![]() in domestic currency but
known at time
in domestic currency but
known at time ![]() . Households pay non-distortionary
(lump-sum) net taxes
. Households pay non-distortionary
(lump-sum) net taxes ![]() , denominated in Home
currency and use their disposable income to consume and invest. The
individual flow budget constraint for the representative agent
, denominated in Home
currency and use their disposable income to consume and invest. The
individual flow budget constraint for the representative agent
![]() in the Home country is therefore:6
in the Home country is therefore:6
| (4) | |
 |
|
where
![]() is the nominal exchange rate,
expressed as Home currency per unit of Foreign currency and
is the nominal exchange rate,
expressed as Home currency per unit of Foreign currency and
![]() is the agent's
share of profits from all firms
is the agent's
share of profits from all firms ![]() and
and ![]() in the economy. The price indexes as as follows:
in the economy. The price indexes as as follows:
![]() and
and
![]() denote the price of
the Home traded good at the producer and consumer
level, respectively,
denote the price of
the Home traded good at the producer and consumer
level, respectively,
![]() is the consumer
price of Home imports;
is the consumer
price of Home imports;
![]() is the price of
nontraded goods;
is the price of
nontraded goods; ![]() is the consumer price index.
is the consumer price index.
We assume that investment is a Cobb-Douglas composite of
tradable and nontradable goods, in line with the evidence in Besma
[2005], and that the capital stock, ![]() , can be
freely reallocated between the traded (
, can be
freely reallocated between the traded (
![]() ) and nontraded (
) and nontraded (
![]() ) sectors:
) sectors:
Different from the consumption of tradables, we assume that investment is not subject to distribution services, though the tradable component of it is obtained through the same CES aggregator as that of consumption. This way we introduce in the model the notion of intermediate imported inputs that contribute to the formation of capital in the economy. The law of motion for the aggregate capital stock is given by:
|
(5) |
where ![]() is an adjustment cost parameter, as in CKM.
is an adjustment cost parameter, as in CKM.
The household's problem then consists of maximizing lifetime utility, defined by (1), subject to the constraints (4) and (5).
2.2 Firms' optimization and optimal price discrimination
International price discrimination is a key feature of the international economy captured by our model. In what follows we show that, even if Home and Foreign consumers have identical constant-elasticity preferences for consumption, the need for distribution services intensive in local nontraded goods implies that the elasticity of demand for the h (f) brand at wholesale level be not generally the same across markets. Firms will thus want to charge different prices at Home and in the Foreign country. We will focus our analysis on Home firms -- optimal pricing by Foreign firms can be easily derived from it.
Firms producing Home tradables (H) and Home nontradables (N) are monopolist in their variety of good; they employ a technology that combines domestic labor and capital inputs, according to the following Cobb-Douglas functions:
where ![]() and
and ![]() are sectoral
random disturbance following a statistical process to be determined
below. We assume that capital and labor are freely mobile across
sectors.
are sectoral
random disturbance following a statistical process to be determined
below. We assume that capital and labor are freely mobile across
sectors.
Our specification of the distribution sector is in the spirit of
the factual remark by Tirole ([1995], page 175) that "production
and retailing are complements, and consumers often consume them in
fixed proportions". As in Erceg and Levin [1995] and Burstein,
Neves and Rebelo [2001], we thus assume that bringing one unit of
traded goods to consumers requires ![]() units of a
basket of differentiated nontraded goods
units of a
basket of differentiated nontraded goods
![$\displaystyle \eta=\left[ \int_{0}^{1}\eta(n)^{\frac{\theta_{\text{\textsc{N}}}-1} {\theta_{\text{\textsc{N}}}}}dn\right] ^{\frac{\theta_{\text{\textsc{N}}} }{\theta_{\text{\textsc{N}}}-1}}.$](img82.gif)
|
(6) |
We note here that the Dixit-Stiglitz index above also applies to the consumption of differentiated nontraded goods, specified in the next subsection. In equilibrium, then, the basket of nontraded goods required to distribute tradable goods to consumers will have the same composition as the basket of nontradable goods consumed by the representative domestic household.7
With flexible prices, the problem of these firms is standard: they hire labor and capital from households to maximize their profits:
where
![]() is the
wholesale price of the Home traded good and
is the
wholesale price of the Home traded good and
![]() is the price of the
nontraded good.
is the price of the
nontraded good. ![]() denote the aggregate wage rate,
while
denote the aggregate wage rate,
while ![]() represents the capital rental rate.
represents the capital rental rate.
Consider first the optimal pricing problem faced by firms producing nontradables for the Home market. The demand for their product is
![$\displaystyle D(n)+\eta\left( n\right) =\left[ p_{t}(n)\right] ^{-\theta _{\text{\textsc{N}}}}P_{\text{\textsc{N}},t}^{\theta_{\text{\textsc{N}}} }\left[ D_{\text{\textsc{N}},t}+\eta\left( \int_{0}^{1}D_{t}(h)dh+\int _{0}^{1}D_{t}(f)df\right) \right] ,$](img91.gif)
|
(7) |
where
![]() is the (consumption
and investment) aggregate demand for non-traded goods. It is easy
to see that their optimal price will result from charging a
constant markup over marginal costs:
is the (consumption
and investment) aggregate demand for non-traded goods. It is easy
to see that their optimal price will result from charging a
constant markup over marginal costs:
|
||
|
(8) |
Now, let
![]() denote the price of brand
h expressed in the Home currency, at
producer level. With a competitive distribution sector, the
consumer price of good h is simply
denote the price of brand
h expressed in the Home currency, at
producer level. With a competitive distribution sector, the
consumer price of good h is simply
| (9) |
In the case of firms producing tradables, "pricing to market" derives endogenously from the solution to the problem of the Home representative firm in the sector:
![$\displaystyle Max_{\bar{p}(h),\bar{p}^{\ast}(h)}\;\;\;\;\left[ \bar{p}_{t}(h)D_{t} (h)+\mathcal{E}_{t}\bar{p}_{t}^{\ast}(h)D_{t}^{\ast}(h)\right] -\frac {W_{t}^{\xi}R_{t}^{1-\xi}}{Z_{\text{\textsc{H}},t}}\left[ D_{t} (h)+D_{t}^{\ast}(h)\right]$](img100.gif)
|
(10) |
where
|
(11) |
Making use of (8), the
optimal wholesale prices for the consumption good
![]() and
and
![]() are:
are:
|
(12) |
|
(13) |
where
![]() is the nominal exchange
rate, expressed in units of home currency units, and
is the nominal exchange
rate, expressed in units of home currency units, and
![]() and
and
![]() denote the
markups. Unlike the case of nontraded goods (8), in this case
the markups charged by the Home firms include a state-contingent
component -- in brackets in the above expression -- that varies as
a function of productivity shocks, monetary innovations (affecting
the exchange rate) and relative wages. Since in general
denote the
markups. Unlike the case of nontraded goods (8), in this case
the markups charged by the Home firms include a state-contingent
component -- in brackets in the above expression -- that varies as
a function of productivity shocks, monetary innovations (affecting
the exchange rate) and relative wages. Since in general
![]() will not equal
will not equal
![]() , even when
, even when
![]() ,
the optimal wholesale price of tradable goods will not obey the law
of one price (
,
the optimal wholesale price of tradable goods will not obey the law
of one price (
![]() ).
This result reflects the difference in the elasticity of demand
faced by the upstream monopolist at Home and abroad brought about
by any asymmetry in relative productivity and/or factor prices.
).
This result reflects the difference in the elasticity of demand
faced by the upstream monopolist at Home and abroad brought about
by any asymmetry in relative productivity and/or factor prices.
Finally, notice that since there are no distribution costs in investment, the flexible price of the investment goods will be equal to the standard expression without state contingent component of markups.
Sticky Prices
To study the impact of local currency pricing on the degree of exchange-rate pass-through, in alternative specifications of our benchmark model we allow for the possibility that goods prices are sticky. Following Rotemberg [1982] and Dedola and Leduc [2001], firms in the traded and non-traded goods sectors are assumed to face a quadratic cost when adjusting their prices (costs which are set equal to zero in steady state). Firms do not face price-adjustment costs in steady state. Firms pay this adjustment cost by purchasing a CES aggregated basket of all the goods in their sector of the economy. The price-adjustment costs faced by firms in the traded and non-traded goods sector are respectively:
and
Since firms producing traded goods can price differently according
to the destination market, they incur a cost when they change
prices in either the Home or the Foreign market. Note that, rather
innocuously, we assume that both
![]() and
and
![]() are
denominated in units of domestic traded goods.
are
denominated in units of domestic traded goods.
2.2.1 Price indexes
A notable feature of our specification is that, because of
distribution costs, there is a wedge between the producer price and
the consumer price of each good. With competitive firms in the
distribution sector, the consumer price of the Home traded good
![]() is simply the sum of
the price of Home traded goods at producer level
is simply the sum of
the price of Home traded goods at producer level
![]() and the
value of the nontraded goods that are necessary to distribute it to
consumers
and the
value of the nontraded goods that are necessary to distribute it to
consumers
| (14) |
We hereafter write the price index of tradables and the utility-based CPIs:
![$\displaystyle =\left[ a_{\text{\textsc{H}}}P_{\text{\textsc{H} },t}{}^{\frac{\rho}{\rho-1}}+a_{\text{\textsc{F}}}P_{\text{\textsc{F}},t} {}^{\frac{\rho}{\rho-1}}\right] ^{\frac{\rho-1}{\rho}}$](img121.gif)
|
|
![$\displaystyle =\left[ a_{\text{\textsc{T}}}P_{\text{\textsc{T}},t}{}^{\frac{\phi }{\phi-1}}+a_{\text{\textsc{N}}}P_{\text{\textsc{N}},t}{}^{\frac{\phi}{\phi -1}}\right] ^{\frac{\phi-1}{\phi}}.$](img123.gif)
|
Foreign prices, denoted with an asterisk and expressed in the same
currency as Home prices, are similarly defined. Observe that the
law of one price holds at the wholesale level but not at the
consumer level, so that
![]() but
but
![]() .
.
3 Calibration
Table 1 reports our benchmark calibration, which we assume symmetric across countries. Several parameter values are standard in the international business cycle literature, e.g. similar to those adopted by Stockman and Tesar [1995], who calibrate their models to a set of OECD countries, and CKM. Throughout the exercise, we will carry out some sensitivity analysis and assess the robustness of our results under the benchmark calibration.
Productivity shocks
Let the vector
![]() represent sector j's technology shocks in the domestic and
foreign economies. We assume that sectoral disturbances to
technology follow a trend-stationary AR(1) process
represent sector j's technology shocks in the domestic and
foreign economies. We assume that sectoral disturbances to
technology follow a trend-stationary AR(1) process
| (15) |
whereas
![]() has
variance-covariance matrix
has
variance-covariance matrix
![]() and
and
![]() is a
is a ![]() matrix of coefficients describing the autocorrelation
properties of the shocks, that are the same for both sectoral
shocks. Since we assume a symmetric economic structure across
countries, we also impose symmetry on the autocorrelation and
variance-covariance matrices of the above process. Because of lack
of sectoral data on productivity, we posit that sectoral shocks
follow a simple and rather conventional process.8 First, in line with
most of the international business cycle literature -- e.g., BKK --
we assume that these shocks are very persistent, and set their
autocorrelation to 0.95. Second, the standard deviation of the
innovations is set to 0.007 and their correlation across countries
to 0.25, while the correlation across sectors is set to zero (see
bottom panel of Table 1). Finally, we assume that there are no
spillovers across countries and sectors. As a consequence of this
choice, it can be anticipated that the model will have a hard time
in replicating the pattern of international comovements, for which
sizable shock correlations are required. Thus, in judging this
aspect of the model we will focus on one meaningful statistic, the
difference between the cross-correlations of output and
consumption, which, as argued by BKK, is a good indicator of the
ability of a model to generate a transmission mechanism that can
escape the "quantity puzzle."
matrix of coefficients describing the autocorrelation
properties of the shocks, that are the same for both sectoral
shocks. Since we assume a symmetric economic structure across
countries, we also impose symmetry on the autocorrelation and
variance-covariance matrices of the above process. Because of lack
of sectoral data on productivity, we posit that sectoral shocks
follow a simple and rather conventional process.8 First, in line with
most of the international business cycle literature -- e.g., BKK --
we assume that these shocks are very persistent, and set their
autocorrelation to 0.95. Second, the standard deviation of the
innovations is set to 0.007 and their correlation across countries
to 0.25, while the correlation across sectors is set to zero (see
bottom panel of Table 1). Finally, we assume that there are no
spillovers across countries and sectors. As a consequence of this
choice, it can be anticipated that the model will have a hard time
in replicating the pattern of international comovements, for which
sizable shock correlations are required. Thus, in judging this
aspect of the model we will focus on one meaningful statistic, the
difference between the cross-correlations of output and
consumption, which, as argued by BKK, is a good indicator of the
ability of a model to generate a transmission mechanism that can
escape the "quantity puzzle."
Monetary policy
In characterizing monetary policy, we assume that in the benchmark systematic policy follows a Taylor-type rule setting the short-term nominal interest rate as a function of the deviations of expected inflation and GDP from steady state values:
| (16) |
We parameterize the policy rule using the estimates in Lubik and
Schorfheide [2004]:
![]()
![]()
![]() To emphasize that our results do
no depend on monetary shocks, in the exercises reported below we
assume that there is no stochastic component to monetary policy. We
observe here that our results are unchanged when we add plausible
monetary shocks. Likewise, we document that our results remain
largely unchanged when we assume that systematic monetary policy is
such that money growth remains constant at the steady state level
(k-rule), or current inflation is perfectly stabilized
(inflation-targeting rule).
To emphasize that our results do
no depend on monetary shocks, in the exercises reported below we
assume that there is no stochastic component to monetary policy. We
observe here that our results are unchanged when we add plausible
monetary shocks. Likewise, we document that our results remain
largely unchanged when we assume that systematic monetary policy is
such that money growth remains constant at the steady state level
(k-rule), or current inflation is perfectly stabilized
(inflation-targeting rule).
Preferences and production
We posit that the period-by-period utility function has the following form:
![$\displaystyle U\left[ C_{t},\frac{M_{t+1}}{P_{t}},\ell_{t}\right] =\frac{C_{t}^{1-\sigma} }{1-\sigma}+\chi\frac{\left( \frac{M_{t+1}}{P_{t}}\right) ^{1-\sigma} }{1-\sigma}+\alpha\frac{(1-\ell_{t})^{1-\upsilon}}{1-\upsilon},\qquad\sigma>0,$](img136.gif)
|
(17) |
we set ![]() so that in steady state, one third of
the time endowment is spent working. In our benchmark calibration,
we set
so that in steady state, one third of
the time endowment is spent working. In our benchmark calibration,
we set ![]() equal to
equal to ![]() (risk aversion). Since the utility function is
separable in consumption and real money balances, money demand is
determined residually and does not play any role in our results. We
therefore set
(risk aversion). Since the utility function is
separable in consumption and real money balances, money demand is
determined residually and does not play any role in our results. We
therefore set ![]() arbitrarily to 0.1. Following
Schmitt-Grohe and Uribe [2001], we assume that the endogenous
discount factor depends on the average per capita level of
consumption,
arbitrarily to 0.1. Following
Schmitt-Grohe and Uribe [2001], we assume that the endogenous
discount factor depends on the average per capita level of
consumption, ![]() , real money balances,
, real money balances,
![]() , and hours worked,
, and hours worked,
![]() , and has the following form:
, and has the following form:
![\begin{displaymath} \nu\left( U\left[ C_{t},\frac{M_{t+1}}{P_{t}},\ell_{t}\right] \right) =\left\{ \begin{array}[c]{c} \ln\left( 1+\psi\left[ C_{t}+\chi\frac{M_{t+1}}{P_{t}}+\alpha(1-\ell _{t})\right] \right) \qquad\qquad\qquad\qquad\sigma\neq1\ \ln\left( 1+\psi\left[ \ln C_{t}+\chi\ln\frac{M_{t+1}}{P_{t}}+\alpha \ln(1-\ell_{t})\right] \right) \qquad\qquad\sigma=1 \end{array}\right. , \end{displaymath}](img145.gif)
whereas ![]() is chosen such that the steady-state
real interest rate is 1 percent per quarter, i.e. equal to 0.006.
This parameter also pins down the (very low) speed of convergence
to the nonstochastic steady state.
is chosen such that the steady-state
real interest rate is 1 percent per quarter, i.e. equal to 0.006.
This parameter also pins down the (very low) speed of convergence
to the nonstochastic steady state.
The value of ![]() is selected based on the
available estimates for the elasticity of substitution between
traded and nontraded goods. We use the estimate by Mendoza [1991]
referred to a sample of industrialized countries and set that
elasticity equal to 0.74, a value on the higher side of those
estimated.
is selected based on the
available estimates for the elasticity of substitution between
traded and nontraded goods. We use the estimate by Mendoza [1991]
referred to a sample of industrialized countries and set that
elasticity equal to 0.74, a value on the higher side of those
estimated.
According to the evidence for the U.S. economy in Burstein, Neves and Rebelo [2003], the share of the retail price of traded goods accounted for by local distribution services ranges between 40 percent and 50 percent, depending on the industrial sector. We follow their calibration and set it equal to 50 percent.
As regards the weights of domestic and foreign tradables in the
tradables consumption basket (![]() ,
,
![]() and
and
![]() (normalized
(normalized
![]() ) are chosen
such that imports are 10 percent of aggregate output in steady
state, roughly in line with the average ratio for the U.S. in the
last 30 years. The weights of traded and nontraded goods,
) are chosen
such that imports are 10 percent of aggregate output in steady
state, roughly in line with the average ratio for the U.S. in the
last 30 years. The weights of traded and nontraded goods,
![]() and
and
![]() , are chosen as to
match the share of nontradables (i.e. services) in the U.S.
consumption basket, which is around 50 percent when energy goods
are excluded. The weights of tradables and nontradables inputs in
capital formation are set to 0.4 and 0.6, respectively, in line
with the evidence in Besma [2005].
, are chosen as to
match the share of nontradables (i.e. services) in the U.S.
consumption basket, which is around 50 percent when energy goods
are excluded. The weights of tradables and nontradables inputs in
capital formation are set to 0.4 and 0.6, respectively, in line
with the evidence in Besma [2005].
Due to lack of better evidence, we calibrate ![]() and
and ![]() the labor shares in the
production of tradables and nontradables, based on the work of
Stockman and Tesar [1995]. They calculate these shares to be equal
to 61 percent and 56 percent, respectively. Finally, we set the
depreciation rate of capital equal to 10 percent annually.
the labor shares in the
production of tradables and nontradables, based on the work of
Stockman and Tesar [1995]. They calculate these shares to be equal
to 61 percent and 56 percent, respectively. Finally, we set the
depreciation rate of capital equal to 10 percent annually.
A key role in our model is played by the markup in the tradable
sector. Note, however, that in the presence of distribution costs,
the sectoral markups will not be equal in steady state across
sectors for symmetric values of
![]() and
and
![]() . In the
nontraded-goods sector, the markup is the standard
. In the
nontraded-goods sector, the markup is the standard
![]() . In the traded-good sector, the markup is:
. In the traded-good sector, the markup is:
where
![]() and
and
![]() are the marginal
costs in the non-traded and traded-goods sector, respectively. We
set the gross steady-state markup for domestic goods to 1.15. This
implies that
are the marginal
costs in the non-traded and traded-goods sector, respectively. We
set the gross steady-state markup for domestic goods to 1.15. This
implies that
![]() (and
(and
![]() ) is equal
to 7.7. We then parametrize the elasticity of substitution of
traded goods varieties,
) is equal
to 7.7. We then parametrize the elasticity of substitution of
traded goods varieties,
![]() and
and
![]() , so that the
steady-state markup is identical across sectors, for the given
calibrated value of the distribution margin.
, so that the
steady-state markup is identical across sectors, for the given
calibrated value of the distribution margin.
In our specification with nominal price rigidity, we calibrate
the price-adjustment cost parameters,
![]() and
and
![]() , by noting that a
typical Calvo price-setting model implies a (log-linearized)
stochastic difference equation for inflation of the form
, by noting that a
typical Calvo price-setting model implies a (log-linearized)
stochastic difference equation for inflation of the form
![]() where
where
![]() is the firm's real marginal cost of
production, and
is the firm's real marginal cost of
production, and
![]() with
with
![]() being the constant probability that a firm
must keep its price unchanged in any given period and
being the constant probability that a firm
must keep its price unchanged in any given period and ![]() the discount factor (see Galí and Gertler
[1999]). The quadratic adjustment-cost model gives a similar
(log-linearized) difference equation for inflation, but with
the discount factor (see Galí and Gertler
[1999]). The quadratic adjustment-cost model gives a similar
(log-linearized) difference equation for inflation, but with
 J=H,N. In line with the evidence reported by Bils and Klenow
[2004] for the U.S., showing that the average duration between
price changes is 4.3 months, we set the values of
J=H,N. In line with the evidence reported by Bils and Klenow
[2004] for the U.S., showing that the average duration between
price changes is 4.3 months, we set the values of
![]()
![]() and
and
![]() equal to 8.6,
3.7, and 4.0, respectively. These values imply that the reduced
form coefficient multiplying real marginal costs
equal to 8.6,
3.7, and 4.0, respectively. These values imply that the reduced
form coefficient multiplying real marginal costs ![]() is the same across all goods. Moreover, we also
simulate our model assuming that prices are set for three quarters,
since this is a value commonly used in the sticky-price literature.
Note also that in the experiments below, we have abstracted from
wage stickiness, although it may be an important determinant of the
response (or lack thereof) of consumer prices to exchange
rates.
is the same across all goods. Moreover, we also
simulate our model assuming that prices are set for three quarters,
since this is a value commonly used in the sticky-price literature.
Note also that in the experiments below, we have abstracted from
wage stickiness, although it may be an important determinant of the
response (or lack thereof) of consumer prices to exchange
rates.
Setting the elasticity of substitution between Home and Foreign tradables and risk aversion
Above, we have discussed the set of parameters whose calibration will remain identical across our experiments, or vary only for robustness checks. We now discuss parameters which play a crucial role in differentiating between the two approaches to modeling real exchange rate volatility suggested by the DSGE literature, that we follow in our quantitative exercises.
The focus of the `risk-aversion approach,' pursued by CKM, is on
the strict positive link between relative consumption and the real
exchange rate in complete market economies, as well as in a large
class of economies with incomplete markets. With power utility, if
relative risk aversion is sufficiently high, the variability of the
ratio of Home to Foreign consumption observed in the data can
correspond to large equilibrium movements in the real exchange
rate. We reconsider the CKM modeling strategy in a different
framework, including nontradables and distribution costs which
create markets segmentation and deviation from the law of one
price, even in the absence of nominal rigidities. In our set of
experiments, following CKM, we will study an economy in which
![]() , setting the investment adjustment
cost,
, setting the investment adjustment
cost, ![]() , to match the standard deviation of
consumption relative to that of output in the United States. The
elasticity of substitution between imported and domestic tradables
in both consumption and the intermediate input to investment,
, to match the standard deviation of
consumption relative to that of output in the United States. The
elasticity of substitution between imported and domestic tradables
in both consumption and the intermediate input to investment,
![]() , is set to 1.5.
, is set to 1.5.
The 'elasticity approach' has been discussed early on by BKK in the framework of a complete market model, and recently reconsidered in a model with incomplete markets in previous work of ours (Corsetti, Dedola and Leduc [2004]).9 The idea is that the impact of shocks on international prices is magnified by a relatively low price elasticity of imports - within the range of values adopted by the literature. Following this approach, we also study an economy in which we set σ = 2 and ω = 0.5.10 Under the elasticity approach, we calibrate the investment adjustment cost, b, to match the standard deviation of U.S. investment relative to that of U.S. output.
4 Business cycle properties of exchange rates and prices
We report the H-P-filtered statistics for the data and for our economies with flexible prices and different degrees of nominal rigidities in Tables 2A-2B. Tables 3A and 3B, instead, report results for the case of a low degree of price stickiness with different monetary rules: Taylor, money growth and inflation targeting. Tables 2A and 3A refer to the specification with a relatively low elasticity, while Tables 2B and 3B refer to the parametrization with a high risk aversion. The empirical statistics are all computed with the United States as the home country and the rest of the world as the foreign country.11 Standard deviations are normalized by the standard deviation of U.S. output. Throughout our exercises, we take a first-order Taylor series expansion around the deterministic steady state and solve our model economy using the DYNARE algorithm. We compute the model's statistics by logging and filtering the model's artificial time series using the Hodrick and Prescott filter and averaging moments of a long time-series simulation of 5500 periods, of which we discard the first 500 observations.
Consider first Table 2. Each panel (A and B) of the table reports the results from three versions of the model: a flexible-price economy, and two economies with low and high degree of local currency price stickiness (LCP), equal to 1.43 and 3 quarters, respectively. Overall, we find that the economies displayed in Tables 2A and 2B display a striking ability to account broadly for the main features of exchange rates and international prices in the data: international price movements are volatile, persistent, and highly correlated -- a good qualitative match of the data. Moreover, the correlation of the nominal exchange rate with consumer prices is generally low. The two economies in Table 2A and 2B, however, differ in one important respect, i.e. their ability to match the correlation between international prices and quantities. The economy with a low elasticity in Table 2A can account for the negative correlation between relative consumption and the real exchange rate observed in the data, addressing the so-called Backus-Smith anomaly.12 The mechanism underlying this result is that, when the price-elasticity of imports is sufficiently low, equilibrium international relative prices movements add to consumption risk. In particular, following a positive technology shock in Home tradables, the terms of trade (and the real exchange rate) appreciate, reducing relative wealth and consumption abroad.13 Conversely, models of exchange rate volatility relying on the mechanism highlighted by CKM predict a virtually perfect correlation between relative consumption and the real exchange rate, a feature that is at odds with the data. This is true in our experiments as well, as reported in Table 2B. Nonetheless, we stress that the mechanism proposed by CKM to generate volatility works quite well in our framework, irrespective of nominal rigidities , in response to real shocks .
The following results emerge. First, the volatility of the nominal exchange rate and international prices is as high or even higher than in the data for both parameterizations. Observe that the addition of price stickiness indeed tends to amplify the volatility of exchange rates. But while raising the degree of nominal rigidities makes international prices more volatile under the elasticity approach, the relationship between price stickiness and volatility is non linear under the risk aversion approach.
Second, for a degree of nominal rigidity consistent with the evidence in Bils and Klenow [2004], we find that the real exchange rate is positively correlated with both the nominal exchange rate and the terms of trade (a weaker currency is associated with a worsening of the terms of trade). Positive comovements between the exchange rate and the terms of trade are stressed by Obstfeld and Rogoff [2000] as evidence against the idea that import prices in local currency do not react to exchange rates, because of nominal rigidities. In light of the debate following Obstfeld and Rogoff [2000], we provide an important qualification to their argument . In a model where firms face costs of adjusting prices in local currency, the correlation between the terms of trade and the exchange rate depends on the degree of nominal rigidities. In our setup, prices can change in the period in which firms are hit by a shock, provided they find it convenient to bear the adjustment costs. Hence, in contrast to the environment adopted by Obstfeld and Rogoff [2000], in which prices are preset for one period, our model does not predict that a depreciation will automatically improve the terms of trade, unless the adjustment cost is relatively high. Indeed, as shown in both Tables 2A and 2B, the correlation between these two variables switches from positive to negative when we raise the degree of nominal rigidities (see the last two columns in the tables).
Third, traditional models with price rigidities and high pass-through predict that the correlation between the exchange rate and the import price index is almost perfect: a depreciation of the currency translates into "imported inflation" for the domestic economy approximately one-to-one. In our simulations, instead, the above correlation is positive but much below one, as in the data: in Table 2A the highest correlation is 0.91 (for the flexible price economy), the lowest correlation is 0.69 (for the economy with 3-quarter price rigidities), against 0.45 in the data (excluding oil imports). Along this dimension, the specification of Table 2B is closer to the data -- especially for the low LCP case.
Fourth, a low (endogenous) import price elasticity and distributive trade imply that consumer prices are only tenuously correlated with the nominal exchange rate across all specifications -- broadly in accord to the evidence. In particular, the correlation with the CPI (excluding energy) across all specifications with nominal rigidities is low but generally positive in levels, against -0.17 in the data.
Fifth, while in both panels of Table 2 the relative volatility
of imports is quite high (a result especially remarkable for the
parameterization with a low ![]() ), it falls
short of that in the data for all specifications.
), it falls
short of that in the data for all specifications.
Finally, we observe that the economies in Table 2A are consistent with the fact that net exports are countercyclical (a featured of the data emphasized in the international business cycle literature) and that the cross-country correlation of output is larger than that of consumption (i.e. they address the so-called 'quantity puzzle'). Under the elasticity approach, net exports are countercyclical because positive productivity shocks in the Home tradable sector raises their international price (i.e. the terms of trade appreciates), lowering net exports. In contrast, under the risk-aversion approach, productivity improvements in the Home tradables cause their international price to fall, raising net exports. When we assume a low trade elasticity, consumption risk sharing is low, consistent with a negative Backus-Smith correlation. Likewise, under the elasticity approach the model is not subject to the quantity puzzle, as the cross-country correlation of output is higher than that of consumption.
In Tables 3A and 3B, we turn to experiments testing the sensitivity of our results to different monetary policy rules. Overall, these tables show that the results discussed above are broadly independent of the particular monetary policy reaction function assumed in our exercises. The qualitative features of our model being substantially unaffected, different policy reaction functions mainly impinge on the quantitative properties of nominal variables. Namely, in our quantitative results, the CPI becomes progressively smoother when we move from the k-percent rule to our benchmark specification of monetary policy rules (Taylor), and from this to inflation targeting. With a smoother path for the consumer price, the nominal exchange rate tends to become more similar to the real exchange rate. Under inflation targeting (last column in each panel of Table 3), the volatility of the two variables is the same, and their correlation is perfect.
In Table 3B (the economy with high risk aversion), we can detect a second implication of varying monetary rules. In this economy, making monetary policy more responsive to fluctuations in inflation raises the correlation between the CPI and the nominal exchange rate. With inflation targeting, such correlation is as high as 0.68, against 0.15 in the benchmark. In this dimension, the low-elasticity economy of Table 3A does better: when monetary authorities pursue inflation targeting, the predicted correlation is -0.25, against -0.17 in the data.
5 Structural and empirical pass-through equations
Exchange rate pass-through (henceforth ERPT) is defined as the percentage change in import prices denominated in local currency resulting from a one percent change in the bilateral exchange rate between the exporting and the importing country, other things equal.14 In this section, we derive structural expressions for pass-through coefficients in the short- and the long-run. These expressions can be used in specifying empirical regression models which are consistent with alternative theoretical views of pass-through. Moreover, we will use our quantitative model to study the performance of alternative regression models typically adopted in empirical studies -- which, because of data availability, cannot conform to our structural equations. We will therefore be able to run examples providing a quantitative assessment of the bias.
It is worth stressing that the problems of omitted variables and measurement errors are likely to plague virtually all applied papers trying to estimate structural ERPT. The accuracy of pass-through estimates is therefore a crucial issue for the empirical literature, but has also an important policy dimension. These estimates are core inputs into the projections of exchange rate changes onto prices and output which underlie monetary policy decision making.
5.1 Inspecting the mechanism(s): structural ERPT equations
5.1.1 ERPT and price discrimination
Let us consider first our specifications with flexible prices. The log-linear expression for the price of imports is:
|
(18) |
where
![]() is the steady state
markup and
is the steady state
markup and ![]() is the distribution margin in the
home import sector. As long as
is the distribution margin in the
home import sector. As long as ![]() is strictly
above zero, the coefficient on the exchange rate will be less than
one, and so will be ERPT.
is strictly
above zero, the coefficient on the exchange rate will be less than
one, and so will be ERPT.
In our benchmark calibration, plausible markups and structural parameter values imply that the ERPT coefficient is equal to 0.93. Because of the presence of distribution services, the impact of changes in the nominal exchange rate on the prices that consumers pay for import will be lower:
With a distribution margin as high as 50 percent, pass-through to consumer prices (of imports) falls to 46 percent. As noted by the literature, the implications of distributive trade for local currency price stability is quite remarkable even in models with flexible prices and wages.
5.1.2 ERPT and local currency price stickiness
In our model, we have assumed a quadratic price-adjustment cost
for Foreign export prices in Home currency, in the form
 . Solving for optimal pricing, imposing symmetry and
log-linearizing around a steady state , we obtain:
. Solving for optimal pricing, imposing symmetry and
log-linearizing around a steady state , we obtain:
|
|
|
|
|
whereas the nominal marginal cost
 , and as before
![]() denotes the total
markup (including both distribution and standard markup) in the
imported Home tradable sector.
denotes the total
markup (including both distribution and standard markup) in the
imported Home tradable sector.
The above equation highlights the two mechanisms of imperfect
pass-through embedded in our analysis. In the short run, even if
prices are fully flexible - corresponding to
![]() - the
pass-through coefficient is less than 1 per effect of distributive
trade, corresponding to
- the
pass-through coefficient is less than 1 per effect of distributive
trade, corresponding to ![]() . When there are no
distribution costs (
. When there are no
distribution costs (![]() ), the short-run
pass-through coefficient is less than 1 only when there are nominal
rigidities.
), the short-run
pass-through coefficient is less than 1 only when there are nominal
rigidities.
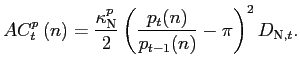
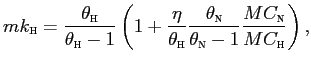
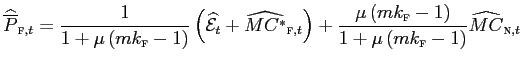
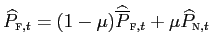
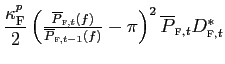
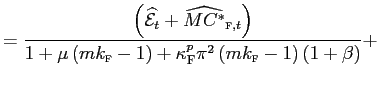
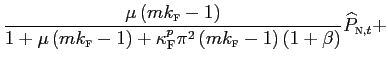
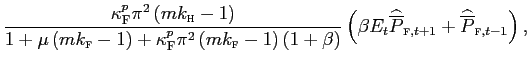
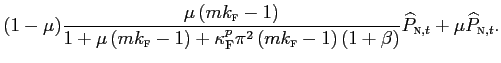
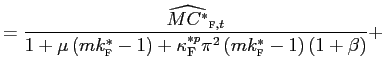
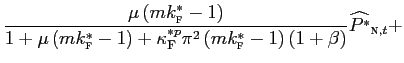
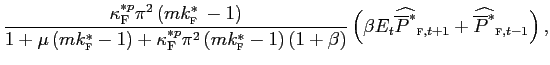
The low pass-through coefficient in the short run mostly reflects nominal price rigidities. Calibrating the model according to the evidence in Bils and Klenow [2004], for an average nominal price rigidities of 4.3 months, the short run coefficient turns out to be 0.27. In turn, assuming that prices are, on average, fixed for three quarters lowers this value to 4 percent. In the long run, nominal rigidities are obviously irrelevant, and imperfect pass-through can only be attributed to the implications of distribution for the price elasticity of imports. Depending on the degree of monopolistic distortions, in our model the long-run EPRT is 93 percent. Recall that with a distribution margin of 50 percent, pass-through onto consumer prices will be half the degree of pass-through onto prices at the dock, namely:
|
|
|
|
|
|
|
Observe that the log linear equation for the domestic prices abroad is:
|
|
|
|
|
Combining equations (assuming symmetry) we obtain a structural equation of the determinant of deviations from the law of one price at wholesale (border) level:
|
|
|
|
|
|
![$\displaystyle \left[ \left( \beta E_{t}\widehat{\overline{P}^{\ast}}_{\text{\textsc{f} },t+1}+\widehat{\overline{P}^{\ast}}_{\text{\textsc{f}},t-1}\right) -\left( \beta E_{t}\widehat{\overline{P}}_{\text{\textsc{f}},t+1}+\widehat {\overline{P}}_{\text{\textsc{f}},t-1}\right) \right]$](img214.gif)
|
As pointed out by Corsetti and Dedola [2005], these deviations are
a function of the degree of monopolistic distortions (markup), as
well as the price of nontraded goods and services employed in
distribution (for ![]() ). Our dynamic
analysis also point out a role for inflation and price adjustment
costs.
). Our dynamic
analysis also point out a role for inflation and price adjustment
costs.
5.1.3 Regression bias and endogenous exchange rate volatility
When bringing the model to the data, our analysis makes it clear
that an empirically consistent specification of the regression
model would call for the inclusion not only of marginal costs in
the tradable sector, but also of marginal costs or prices in the
distribution sector (which in our analysis are the same as
nontradable goods) -- to account for the effect of distributive
trade on the price elasticity and markup --, as well as for the
expected value of
 -- to
account for the dynamic dimension of optimal pricing with
forward-looking price setters. We should stress here that the
omission of the latter variable is bound to result into
omitted-variable bias.
-- to
account for the dynamic dimension of optimal pricing with
forward-looking price setters. We should stress here that the
omission of the latter variable is bound to result into
omitted-variable bias.
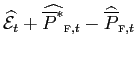
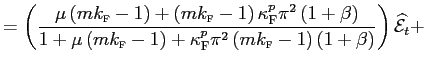
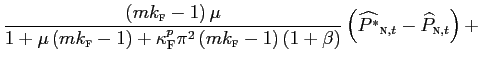
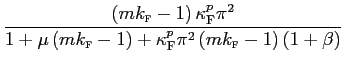
The log-linearized expressions derived above is already useful to shed light into the consequences of using incomplete data sets, or variables measured with large error. For simplicity, assume that the correct model is the one without nominal rigidities and consider a regression model in the form
whereas to save on notation we ignore the fact that all variables
should be measured in logs. Here ![]() refers to a
set of control variables (e.g. domestic GDP) which are imperfect
proxies of the relevant variables listed above. Clearly, using our
expressions, we can write the error as:
refers to a
set of control variables (e.g. domestic GDP) which are imperfect
proxies of the relevant variables listed above. Clearly, using our
expressions, we can write the error as:
where ![]() is any uncorrelated random component
(e.g., measurement error). We obtain the following asymptotic
estimate of
is any uncorrelated random component
(e.g., measurement error). We obtain the following asymptotic
estimate of ![]() :
:
|
|
|
|
|
|
|
The bias can have either sign. To see this most clearly, consider
that, in general, the available control ![]() will be
a very poor instrument for the omitted variable
will be
a very poor instrument for the omitted variable
![]() . Focus on the
extreme case in which
. Focus on the
extreme case in which ![]() is missing altogether
from the regression model. Omitting
is missing altogether
from the regression model. Omitting ![]() the
above bias simplifies to:
the
above bias simplifies to:
The regression bias clearly depends on the covariance between
![]() and the productivity shocks
and the productivity shocks
![]() and
and
![]() affecting marginal
costs in the two economies. When marginal costs are basically
uncorrelated across border (the case of country-idiosyncratic
shocks), the sign of the bias will depend on the 'international
transmission' of productivity shocks. If (depending on parameters'
value) a positive Home shock appreciates the Home nominal exchange
rate, the regression bias will be positive: pass-through
estimates will be higher than the true coefficient
affecting marginal
costs in the two economies. When marginal costs are basically
uncorrelated across border (the case of country-idiosyncratic
shocks), the sign of the bias will depend on the 'international
transmission' of productivity shocks. If (depending on parameters'
value) a positive Home shock appreciates the Home nominal exchange
rate, the regression bias will be positive: pass-through
estimates will be higher than the true coefficient
![]() . If
instead a positive Home productivity shock brings about a nominal
depreciation, the opposite will occur. In theory, both effects can
occur (see Corsetti, Dedola and Leduc [2004]).
. If
instead a positive Home productivity shock brings about a nominal
depreciation, the opposite will occur. In theory, both effects can
occur (see Corsetti, Dedola and Leduc [2004]).
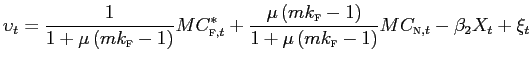
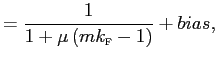
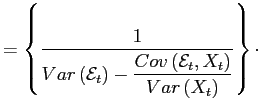
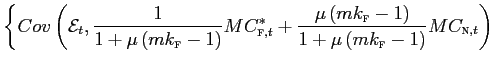
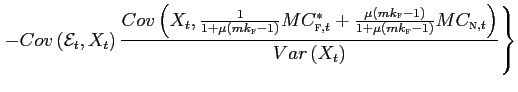
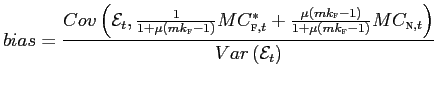
But while the sign of the bias depends on the pattern of covariances, the size of the bias will be crucially affected by the volatility of the exchange rate (relative to the covariance of the exchange rate with the control). This suggests that, ceteris paribus, an economy with a highly volatile exchange rate would provide a relatively better environment for empirical analysis.
5.2 Regression bias in empirical models of ERPT: an assessment using simulated time series
Empirical research on ERPT focuses on the adjustment of prices to an exchange rate change for transactions between an exporting and importing country. According to the taxonomy in Goldberg and Knetter (1997), the typical ERPT regression can be written as
| (19) |
where all variables are in logs:
![]() is the import price
denominated in local currency,
is the import price
denominated in local currency,
![]() is a measure of exporter's
marginal costs,
is a measure of exporter's
marginal costs, ![]() may include controls for
shifts in import demand (like prices of competing goods or income
in the importing country), as well as lagged values of the
dependent variable to capture dynamics, and
may include controls for
shifts in import demand (like prices of competing goods or income
in the importing country), as well as lagged values of the
dependent variable to capture dynamics, and
![]() is the nominal exchange rate
(importer's currency per unit of exporter's currency). The
coefficient
is the nominal exchange rate
(importer's currency per unit of exporter's currency). The
coefficient ![]() is referred to as the
pass-through coefficient. ERPT -- conditional on controls
is referred to as the
pass-through coefficient. ERPT -- conditional on controls
![]() and
and
![]() -- is full or complete if
-- is full or complete if
![]() and is incomplete if
and is incomplete if ![]() Provided one can find an accurate measure of
marginal cost
Provided one can find an accurate measure of
marginal cost
![]() the coefficient
the coefficient ![]() measures the variable markup component of the textbook
definition of pass-through.
measures the variable markup component of the textbook
definition of pass-through.
The typical pass-through regression treats marginal costs as directly observable, but includes cost indices. These indices may be reasonable measures of average costs incurred domestically, but are unlikely to be good measures of marginal costs, which is the relevant concept in specifying optimal pricing by profit-maximizing firms. Furthermore, measurement errors in cost indices may be correlated with exchange rates in ways that bias the coefficients toward finding incomplete pass-through and excess markup adjustment.
The research on pricing-to-market (henceforth PTM) has addressed
this issue including prices in both the origin and the destination
markets, as well as costs, in the empirical regressions. In terms
of (19),
![]() is the export price,
is the export price,
![]() is the domestic price of the
same good, while
is the domestic price of the
same good, while ![]() includes other cost factors
and demand shifters in both markets. Costs, and thus errors in
costs, influence the export price relative to the domestic price
only when there is a difference in the convexity of demand in the
two markets (e.g., see Marston [1990]).15
includes other cost factors
and demand shifters in both markets. Costs, and thus errors in
costs, influence the export price relative to the domestic price
only when there is a difference in the convexity of demand in the
two markets (e.g., see Marston [1990]).15
To shed light on the quantitative importance of different potential sources of biases in the empirical studies of pass-through, we run two types of regressions on the artificial data simulated using our theoretical economies. We dub the first one 'ERPT regression':
| (20) |
In terms of (19), the ERPT
regression includes Foreign nominal wages,
![]() to control for marginal costs
in the exporting country, and Home real GDP,
to control for marginal costs
in the exporting country, and Home real GDP, ![]() to control for demand conditions in the importing
country. We also include one lag of the dependent variable to
capture differences between short run and long run pass-through
that are relevant in the economies with nominal rigidities. Thus,
the exchange-rate coefficient
to control for demand conditions in the importing
country. We also include one lag of the dependent variable to
capture differences between short run and long run pass-through
that are relevant in the economies with nominal rigidities. Thus,
the exchange-rate coefficient ![]() represents
the estimate of the short-run ERPT coefficient, while
represents
the estimate of the short-run ERPT coefficient, while
 will be the
estimate of the long-run ERPT coefficient.
will be the
estimate of the long-run ERPT coefficient.
The second regression, which we dub the 'PTM regression', has the following specification:
| (21) |
In line with the insights from the PTM literature, this regression
includes the domestic price of Foreign exports,
![]() to control for marginal cost in the exporting country, and the Home
PPI of tradables,
to control for marginal cost in the exporting country, and the Home
PPI of tradables,
![]() to
control for demand conditions in the importing country. As above,
we also include the lagged dependent variable, so that
to
control for demand conditions in the importing country. As above,
we also include the lagged dependent variable, so that ![]() represents the short-run ERPT coefficient, while
represents the short-run ERPT coefficient, while
 will be our
estimate of the long-run ERPT coefficient. Moreover, in line with
the PTM literature we impose the constraints:
will be our
estimate of the long-run ERPT coefficient. Moreover, in line with
the PTM literature we impose the constraints:
![]() (e.g., see Anderton
[2003])
(e.g., see Anderton
[2003])![]()
Both regressions are clearly misspecified in the context of our theoretical models, as they do not control for the effect of the cost of distribution on demand elasticities, and suffer from measurement error problems, as they rely on proxies of the generally unobservable marginal costs. Precisely, (20) only includes nominal wages, but omit the price of capital and measures of technology shocks. By the same token, the inclusion of the Foreign price of Home imports among the regressors in (21) is a potential source of bias, as this price includes a Foreign market time-varying markup.16
Tables 4A through 5B present the results of the PTM regression
and the ERPT regression run on our simulated time series. The
estimated coefficients in these tables are computed using the same
5000 observation used to calculate the business-cycle statistics.
For each theoretical economy, the table shows the true value of the
short run and long run coefficients ![]() and
and
 in the two rows
under the heading Structural. As shown above, these
coefficients reflect the value of the structural parameters in the
log-linearized first order conditions of the monopolistic Foreign
exporter. Thus, the short-run and long-run coefficients coincide in
the benchmark model with flexible prices, and their level, equal to
0.93, is fully determined by the steady state level of the markup
in the import sector,
in the two rows
under the heading Structural. As shown above, these
coefficients reflect the value of the structural parameters in the
log-linearized first order conditions of the monopolistic Foreign
exporter. Thus, the short-run and long-run coefficients coincide in
the benchmark model with flexible prices, and their level, equal to
0.93, is fully determined by the steady state level of the markup
in the import sector,
![]() and the distribution
margin,
and the distribution
margin, ![]() Conversely, the short-run and long-run
coefficients differ in the sticky price model. Because of the
destination-specific price adjustment cost, the short run
coefficient is equal to either 0.27 or 0.04 depending on the degree
of price stickiness, while the long run coefficient is 0.93, as in
the benchmark. Notably, the values for the short-run coefficients
are well in the range of the estimates for the U.S. and in general
the industrialized countries (e.g., see Anderton [2003] for the
euro area and Campa and Goldberg [2002] for a large set of OECD
countries, respectively).
Conversely, the short-run and long-run
coefficients differ in the sticky price model. Because of the
destination-specific price adjustment cost, the short run
coefficient is equal to either 0.27 or 0.04 depending on the degree
of price stickiness, while the long run coefficient is 0.93, as in
the benchmark. Notably, the values for the short-run coefficients
are well in the range of the estimates for the U.S. and in general
the industrialized countries (e.g., see Anderton [2003] for the
euro area and Campa and Goldberg [2002] for a large set of OECD
countries, respectively).
The tables also report a control regression in which the import price is regressed only on the exchange rate and its lag -- we dub this specification "naive". This specification clearly shows that the problem of omitted variables can potentially be very serious in our setup with an endogenously volatile exchange rate. Indeed, the estimated short run ERPT is always less than 1 percent across all specifications, even with flexible prices, while the long run estimates are reasonably close to the structural coefficient only in the case of high price stickiness. This result confirms that these economies can be thought of as an interesting "worst case" scenario for assessing the performance of some popular regression models in the empirical literature on pass-through.
In light of the above results, does the inclusion of controls, albeit imperfect, improve the performance of the regression models? Interestingly, we find that in general it does so. Focus at first on Tables 4A and 4B. In these tables, a notable difference across the two specifications (the PTM and ERPT (1)) emerges only in the case of flexible prices. The PTM regression does particularly well at distinguishing between short- and long-run coefficients when they are truly different, and correctly equates their estimates when they are the same (in the case of the economy with flexible prices). In contrast, the ERPT specification incorrectly estimates a different value of the short- and long-run coefficients when prices are flexible. With sticky prices, the PTM regression in Table 4A basically recovers the correct value of the long-run structural coefficient, but displays an upward bias in the estimates of the short run coefficient. In contrast, the estimated long-run coefficient from the ERPT regression show a small upward bias, while the short-run coefficient is closer to the structural one than in the case of the PTM regression. Similar results emerge from table 4B, although the size of the bias here is larger.
What can account for the differential performance of the two
regressions? In order to answer this question we also report
results for an hybrid specification (ERPT (2)), equal to the ERPT
specification, except that we replace the domestic GDP with
![]() in Table
4A and wages with
in Table
4A and wages with
![]() in
Table 4B. In our experiments, the hybrid specification ERPT (2)
does better than the ERPT specification, suggesting that the
overall superior performance of the PTM regression can be traced to
the use of better proxies for marginal costs and demand conditions.
We note that, given that the general environment of our model
includes price discrimination, the proxies adopted in ERPT (2) have
a good theoretical foundations. It is somehow reassuring that their
use improves the performance of our regressions.
in
Table 4B. In our experiments, the hybrid specification ERPT (2)
does better than the ERPT specification, suggesting that the
overall superior performance of the PTM regression can be traced to
the use of better proxies for marginal costs and demand conditions.
We note that, given that the general environment of our model
includes price discrimination, the proxies adopted in ERPT (2) have
a good theoretical foundations. It is somehow reassuring that their
use improves the performance of our regressions.
Tables 5A and 5B report results for the model with sticky prices conditional on monetary shocks only. The shocks are appended to the interest-rate rules and are assumed to have a standard deviation equal to 0.2 percent and to be uncorrelated across countries. The motivation for this exercise is to assess the sensitivity of our results to different shocks. Relative to table 4, the performance of the PTM regression model deteriorates markedly. In particular, with monetary shock only, the relative quality of the regression performance is reversed.
One possible reason for the reverse ranking in the performance of the PTM and ERPT regressions is that, with monetary shocks only, the nominal wage (which is flexible in our model) is a better proxy for marginal costs than product prices, whose adjustments are constrained by nominal rigidities. In the absence of frictions in the labor market, equilibrium nominal wages follows closely the monetary stance in the economy. However, in the case of low price rigidity, one would expect prices to reflect marginal costs and wages quite a bit. Indeed, the table shows that a hybrid PTM regression model (dubbed PTM (2), including the level of domestic output in the place of domestic prices), tends to perform quite well. This result suggests that the difference in the performance of the PTM and the ERPT model in Table 5 is due to the proxy for the level of domestic demand.
Overall, our experiments in Table 5 indicate that the quality of available empirical proxies for marginal costs and demand (determining the performance of different empirical models) will typically depend on the type of disturbances affecting the economy. Thus, assessing the sensitivity of pass-through estimates to the inclusion of alternative proxies for marginal costs and import demand is crucial for the reliability of these estimates.17
6 Concluding remarks
Understanding the relative importance of different factors causing high exchange rate volatility, on the one hand, and low pass-through and local currency price stability, on the other, is crucial for both model building and policy analysis. As is well known, a core implication of low pass-through is that high exchange-rate volatility will systematically drive apart cross-borders prices of otherwise identical goods -- i.e. there will be deviations from the law of one price. In the absence of nominal rigidities, such deviations correspond to optimal pricing strategies by firms with monopoly power. In the presence of nominal rigidities, instead, they correspond to suboptimal fluctuations of firms' profits, with potentially important consequences for the design of stabilization policy rules. Moreover, in an economy with large swings in the exchange rate, lack of risk sharing opportunities imply large fluctuations of relative wealth and consumption. These considerations raise the question of whether exchange-rate movements play the stabilizing role attributed to them by the received wisdom, either as a substitute for relative price adjustment or as mechanism reducing the consumption risk of productivity and nominal shocks.
This paper develops a quantitative, dynamic, open-economy framework which generates high exchange rate volatility, and analyzes the role of nominal rigidities (in the form of local currency pricing) in determining a low degree of ERPT. Because of the presence of distribution services, the elasticity of demand is market specific, which leads firms to price-discriminate across countries. In our model, the combination of price discrimination and local currency pricing with nominal rigidity can account for the variable degree of ERPT over different horizons. As a result of price discrimination, our model predicts exchange-rate pass-through coefficients that are different than one in the long run. In the short run, we find that a very small amount of nominal rigidities can lower the elasticity of import prices at border and consumer level to 27% and 13%, respectively.
We stress that in our benchmark economy a limited degree of LCP makes the short-run exchange rate pass-through coefficients quite close to those found in the empirical literature; for instance Campa and Goldberg [2002] find that on average across OECD countries, exchange rate pass-through into import prices is 46% in the short run and even lower for the US. Relative to these empirical results, our results suggest that an amount of nominal rigidities consistent with the evidence in Bils and Klenow [2004]) will be enough to make our theoretical economies consistent with this dimension of the data.
Remarkably, in our model, despite the low level of pass-through, exchange rate depreciation still worsens the terms of trade - in accord to the evidence. Moreover, a high degrees of nominal rigidities are not necessary to generate volatile exchange rates.
Regression models commonly used in the empirical literature on exchange rate pass-through are likely to be plagued by measurement errors and omitted variable bias. We run two typical regression models on time series generated by our model, and compare their performance with the structural features of the model. In most cases, the regressions yielded point estimates that were biased, but still reasonable. Our results show that, in general, a high exchange rate volatility will not be sufficient to alleviate the bias -- due to endogeneity of such volatility. The performance of the regression models clearly depends on how well the regressors proxy for marginal costs and demand conditions. We illustrated this point by showing that conditioning on a different set of shocks (real versus nominal) could change the quality of these proxies, causing a reversal in the ranking of alternative regression models. Thus, assessing the sensitivity of pass-through estimates to the inclusion of alternative proxies for marginal costs and import demand is crucial for the reliability of these estimates.
References
Anderton, Robert [2003]. "Extra-Euro Area Manufacturing Import Prices and Exchange Rate Pass-Through," European Central Bank Working Paper No. 219.
Anderton, Robert, Filippo Di Mauro, and Fabio Moneta [2003]. "Understanding the Impact of the External Dimension on the Euro Area: Trade, Capital Flows and Other Macroeconomic Linkages," European Central Bank Occasional Paper No. .
Backus, David K., Patrick J. Kehoe, and Finn E. Kydland [1992]. "International Real Business Cycles," Journal of Political Economy 100, 745-75.
Backus, David K., Patrick J. Kehoe, and Finn E. Kydland [1995]. "International Business Cycles: Theory and Evidence," in Thomas F. Cooley (ed.) Frontiers of Business Cycle Research, Princeton University Press, Princeton, 331-56.
Bayoumi, Tamim, Douglas Laxton, and Paolo Pesenti [2003]. "When Leaner Isn't Meaner: Measuring Benefits and Spillover of Greater Competition in Europe," manuscript.
Besma, Rudolfs [2005], "Aggregate investment expenditures on traded and nontraded goods," mimeo, Stockholm School of Economics.
Bils, Mark and Peter J. Klenow [2002]. "Some Evidence on the Importance of Sticky Prices," manuscript
Burstein, Ariel T., João Neves, and Sergio Rebelo [2001]. "Distribution Costs and Real Exchange Rate Dynamics During Exchange-Rate-Based Stabilizations," Journal of Monetary Economics, forthcoming.
Burstein, Ariel T., Martin Eichenbaum, and Sergio Rebelo [2005]. "Large Devaluations and the Real Exchange Rate," Journal of Political Economy, forthcoming.
Campa, Jose, and Linda Goldberg [2002]. "Exchange Rate Pass Through Into Import Prices," National Bureau of Economic Research Working Paper 8934.
Chari, V.V., Patrick J. Kehoe, and Ellen McGrattan [2002]. "Can Sticky Prices Generate Volatile and Persistent Real Exchange Rates?," Review of Economic Studies 69, 633-63.
Christiano, Lawrence J., Martin Eichenbaum, and Charles L. Evans [2003]. "Nominal Rigidities and the Dynamic Effects of a Shock to Monetary Policy," Journal of Political Economy, forthcoming.
Corsetti, Giancarlo and Luca Dedola [2005], "Macroeconomics of International Price Discrimination," Journal of International Economics, forthcoming.
Corsetti, Giancarlo, Luca Dedola, and Sylvain Leduc [2004], "International Risk Sharing and the Transmission of Productivity Shocks," European Central Bank Working Paper No. 308.
Dedola, Luca and Sylvain Leduc [2001]. "Why Is the Business-Cycle Behaviour of Fundamentals Alike across Exchange-Rate Regimes?," International Journal of Finance and Economics 6, 401-19.
Engel, Charles [2005], "Equivalence Results for Optimal Pass-Through, Optimal Indexing to Exchange Rates, and Optimal Choice of Currency for Export pricing," mimeo, University of Wisconsin.
Erceg, Chris, and Andrew Levin [1996]. "Structures and the Dynamic Behavior of the Real Exchange Rate," mimeo, Board of Governors of the Federal Reserve System.
Frankel, Jeffrey, David Parsley, and Shang-Jin Wei [2004]. "Slow Pass-through Around the World: A New Import for Developing Countries?" mimeo, Harvard University.
Gagnon, Joseph E., and Jane Ihrig [2004]. "Monetary Policy and Exchange Rate Pass-Through," manuscript.
Galí Jordi and Mark Gertler [1999]. "Inflation Dynamics: A Structural Econometric Analysis," Journal of Monetary Economics 44, 195-222.
Giovannini, Alberto [1988]. "Exchange Rates and Traded Goods Prices," Journal of International Economics 24, 45-68.
Goldberg, Pinelopi K., and Michael M. Knetter. [1997]. "Goods Prices and Exchange Rates: What Have We Learned?" Journal of Economic Literature 35, 1243-72.
Kim, Jinill [2000]. "Constructing and Estimating a Realistic Optimizing Model of Monetary Policy," Journal of Monetary Economics 45, 329-59.
King, Robert G. and Mark W. Watson [1998]. "The Solution of Singular Linear Difference Systems Under Rational Expectations," International Economic Review 39, 1015-26.
MacDonald, Ronald and Luca Ricci [2001]. "PPP and the Balassa Samuelson Effect: The Role of the Distribution Sector," International Monetary Fund Working Paper 01/38.
Marston, Richard C. [1990]. "Pricing to Market in Japanese Manufacturing," Journal of International Economics 29, 217-36.
Mendoza, Enrique [1991]. "Real Business Cycles in a Small Open Economy," American Economic Review 81(4), 797-818.
Obstfeld, Maurice [1990]. "Intertemporal Dependence, Impatience, and Dynamics," Journal of Monetary Economics 26, 45-75.
Obstfeld, Maurice, and Kenneth Rogoff [2000]. "New Directions for Stochastic Open Economy Models" in Journal of International Economics, 50, 117-154.
Obstfeld, Maurice, and Kenneth Rogoff [2001]. "The Six Major Puzzles in International Macroeconomics: Is There a Common Cause?" in Ben Bernanke and Kenneth Rogoff (eds.), NBER Macroeconomics Annual 2000, Cambridge, MA: MIT Press.
Rotemberg, Julio J. [1982]. "Monopolistic Price Adjustment and Aggregate Output," Review of Economic Studies 49, 517-31.
Schmitt-Grohé, Stephanie and Martín Uribe [2001]. "Closing Small Open Economy Models," forthcoming in the Journal of International Economics.
Smets, Frank, and Raf Wouters [2002]. "Openness, Imperfect Exchange Rate Pass-Through and Monetary Policy," Journal of Monetary Economics 49, 947-81.
Smets, Frank, and Raf Wouters [2003]. "An Estimated Stochastic Dynamic General Equilibrium Model of the Euro Area," Journal of the European Economic Association 1, 1123.75.
Stockman, Alan C., and Linda Tesar [1995]. "Tastes and Technology in a Two-Country Model of the Business Cycle: Explaining International Comovements," American Economic Review 83, 473-86.
Taylor, John [1993]. Macroeconomic Policy in a World Economy: From Economic Design to Practical Operation, New York, NY: Norton.
Taylor, John [2000]. "Low Inflation, Pass-Through, and the Pricing Power of Firms," European Economic Review 39, 195-214.
Tirole, Jean [1995]. The Theory of Industrial Organization. Cambridge, MA: MIT Press.
Whalley, John [1985]. Trade Liberalization Among Major World Trading Areas, Cambridge, MA: MIT Press.
Table 1: Parameter values: Benchmark Models
| Preferences and Technology: Risk aversion |
|
| Preferences and Technology: Disutility of labor |
|
| Preferences and Technology: Velocity parameter | |
| Preferences and Technology: Elasticity of substitution between: Home and Foreign traded goods |
|
| Preferences and Technology: Elasticity of substitution between: traded and non-traded goods |
|
| Preferences and Technology: Elasticity of substitution between: Home non-traded goods |
|
| Preferences and Technology: Elasticity of substitution between: Home traded goods |
|
| Preferences and Technology: Elasticity of the discount factor with respect to C and L |
|
| Preferences and Technology: Distribution margin | |
| Preferences and Technology: Labor share in tradables | |
| Preferences and Technology: Labor share in nontradables |
|
| Preferences and Technology: Depreciation rate |
|
| Monetary Policy: Lagged interest-rate coefficient | |
| Monetary Policy: Weight on inflation | |
| Monetary Policy: Weight on output gap |
|
| Sectoral p roductivity shocks: Sectoral autocorrelation matrix |
![\begin{displaymath}\lambda=\left[ \begin{array}[c]{cc} 0.95 & 0.0\ 0.0 & 0.95 \end{array}\right] \end{displaymath}](img290.gif) |
| Sectoral productivity shocks: Sectoral variance-covariance matrix (in percent) |
![\begin{displaymath}\Omega=\left[ \begin{array}[c]{cc} 0.7 & 0.00123\ 0.00123 & 0.7 \end{array}\right] \end{displaymath}](img291.gif) |
Table 2A: Exchange rates and prices in the theoretical economiesa
| Statistics | U.S. Data | Economy with σ=2, ω=0.5 Flexible prices | Economy with σ=2, ω=0.5 Sticky prices low LCP | Economy with σ=2, ω=0.5 Sticky prices high LCP |
|---|---|---|---|---|
| Standard deviation (relative to GDP): Real exchange rate (CPI based) | 3.04 | 3.36 | 4.12 | 7.87 |
| Standard deviation (relative to GDP): Nominal exchange rate | 3.26 | 4.40 | 5.17 | 8.68 |
| Standard deviation (relative to GDP): Terms of trade | 1.71 | 2.93 | 3.29 | 6.89 |
| Standard deviation (relative to GDP): Imports | 3.28 | 2.38 | 2.29 | 2.41 |
| Auto-correlation: Real exchange rate | 0.81 | 0.72 | 0.79 | 0.87 |
| Auto-correlation: GDP | 0.87 | 0.73 | 0.74 | 0.72 |
| Correlation with real exchange rate: Nominal exchange rate | 0.96 | 0.92 | 0.95 | 0.98 |
| Correlation with real exchange rate: Terms of trade | 0.35 | 0.82 | 0.39 | -0.43 |
| Correlation with real exchange rate: Cross-country consumption ratio | -0.45 | -0.66 | -0.77 | -0.88 |
| Correlation with nominal exchange rate: Import prices | 0.45 | 0.91 | 0.88 | 0.69 |
| Correlation with nominal exchange rate: CPI level | -0.17 | 0.42 | 0.40 | 0.30 |
| Difference between cross-correlation of: GDP and consumption | 0.22 | 0.33 | 0.40 | 0.56 |
| Correlation with GDP: Net exports | -0.51 | -0.43 | -0.36 | -0.27 |
a See main text for a description of the different model economies.
Table 2B Exchange rates and prices in the theoretical economiesa
| Statistics | U.S. Data | Economy with σ=5, ω=1.5 Flexible prices | Economy with σ=5, ω=1.5 Sticky prices low LCP | Economy with σ=5, ω=1.5 Sticky prices high LCP |
|---|---|---|---|---|
| Standard deviation (relative to GDP): Real exchange rate (CPI based) | 3.04 | 3.40 | 3.53 | 3.72 |
| Standard deviation (relative to GDP): Nominal exchange rate | 3.26 | 3.09 | 2.81 | 3.22 |
| Standard deviation (relative to GDP): Terms of trade | 1.71 | 2.68 | 2.34 | 2.29 |
| Standard deviation (relative to GDP): Imports | 3.28 | 2.35 | 1.92 | 1.41 |
| Auto-correlation: Real exchange rate | 0.81 | 0.71 | 0.76 | 0.82 |
| Auto-correlation: GDP | 0.87 | 0.71 | 0.72 | 0.81 |
| Correlation with real exchange rate: Nominal exchange rate | 0.96 | 0.62 | 0.63 | 0.65 |
| Correlation with real exchange rate: Terms of trade | 0.35 | 0.54 | 0.33 | -0.19 |
| Correlation with real exchange rate: Cross-country consumption ratio | -0.45 | 1.00 | 1.00 | 1.00 |
| Correlation with nominal exchange rate: Import prices | 0.45 | 0.58 | 0.53 | 0.45 |
| Correlation with nominal exchange rate: CPI level | -0.17 | 0.15 | 0.15 | 0.19 |
| Difference between cross-correlation of: GDP and consumption | 0.22 | -0.35 | -0.26 | -0.18 |
| Correlation with GDP: Net exports | -0.51 | 0.66 | 0.63 | 0.57 |
Table 3A: Exchange rates and prices in the theoretical economies, under alternative monetary policiesa
| Statistics | U.S. Data | Economy with σ=2, ω=0.5, low LCP Benchmark | Economy with σ=2, ω=0.5, low LCP k-percent rule | Economy with σ=2, ω=0.5, low LCP Inflation-targeting |
|---|---|---|---|---|
| Standard deviation (relative to GDP): Real exchange rate (CPI based) | 3.04 | 4.12 | 4.00 | 3.72 |
| Standard deviation (relative to GDP): Nominal exchange rate | 3.26 | 5.17 | 4.51 | 3.72 |
| Standard deviation (relative to GDP): Terms of trade | 1.71 | 3.29 | 3.19 | 2.88 |
| Standard deviation (relative to GDP): Imports | 3.28 | 2.29 | 2.26 | 2.20 |
| Auto-correlation: Real exchange rate | 0.81 | 0.79 | 0.74 | 0.71 |
| Auto-correlation: GDP | 0.87 | 0.74 | 0.77 | 0.74 |
| Correlation with real exchange rate: Nominal exchange rate | 0.96 | 0.95 | 0.99 | 1.00 |
| Correlation with real exchange rate: Terms of trade | 0.35 | 0.39 | 0.44 | 0.46 |
| Correlation with real exchange rate: Cross-country consumption ratio | -0.45 | -0.77 | -0.76 | -0.76 |
| Correlation with nominal exchange rate: Import prices | 0.45 | 0.88 | 0.88 | 0.86 |
| Correlation with nominal exchange rate: CPI level | -0.17 | 0.40 | 0.48 | -0.25 |
| Difference between cross-correlation of: GDP and consumption | 0.22 | 0.40 | 0.41 | 0.40 |
| Correlation with GDP: Net exports | -0.51 | -0.36 | -0.35 | -0.39 |
a See main text for a description of the different model economies.
Table 3B: Exchange rates and prices in the theoretical economiesa
| Statistics | U.S. Data | Economy with σ=5, ω=1.5, low LCP Benchmark | Economy with σ=5, ω=1.5, low LCP k-percent rule | Economy with σ=5, ω=1.5, low LCP Inflation-targeting |
|---|---|---|---|---|
| Standard deviation (relative to GDP): Real exchange rate (CPI based) | 3.04 | 3.53 | 3.54 | 3.66 |
| Standard deviation (relative to GDP): Nominal exchange rate | 3.26 | 2.81 | 1.80 | 3.66 |
| Standard deviation (relative to GDP): Terms of trade | 1.71 | 2.34 | 2.26 | 2.46 |
| Standard deviation (relative to GDP): Imports | 3.28 | 1.92 | 1.91 | 1.82 |
| Auto-correlation: Real exchange rate | 0.81 | 0.76 | 0.76 | 0.72 |
| Auto-correlation: GDP | 0.87 | 0.72 | 0.73 | 0.66 |
| Correlation with real exchange rate: Nominal exchange rate | 0.96 | 0.63 | 0.99 | 1.00 |
| Correlation with real exchange rate: Terms of trade | 0.35 | 0.33 | 0.29 | -0.03 |
| Correlation with real exchange rate: Cross-country consumption ratio | -0.45 | 1.00 | 1.00 | 1.00 |
| Correlation with nominal exchange rate: Import prices | 0.45 | 0.53 | 0.58 | 0.71 |
| Correlation with nominal exchange rate: CPI level | -0.17 | 0.15 | -0.54 | 0.68 |
| Difference between cross-correlation of: GDP and consumption | 0.22 | -0.26 | -0.26 | -0.20 |
| Correlation with GDP: Net exports | -0.51 | 0.63 | 0.63 | 0.60 |
Table 4A: Estimates of ERPT coefficients for Import Prices in artificial dataa
| Specifications | Economy with σ=2, ω=0.5, Flexible prices | Economy with σ=2, ω=0.5, Sticky prices, low LCP | Economy with σ=2, ω=0.5, Sticky prices, high LCP |
|---|---|---|---|
| Structural: Short run | 0.93 | 0.27 | 0.04 |
| Structural: Long run | 0.93 | 0.93 | 0.93 |
| Naive: | |||
| Naive: | 1.59 | 1.46 | 1.11 |
| PTM: | 0.92 | 0.50 | 0.20 |
| PTM: | 0.93 | 0.94 | 0.96 |
| ERPT (1): | 0.17 | 0.13 | 0.10 |
| ERPT (1): | 1.00 | 1.00 | 1.00 |
| ERPT (2): | 0.39 | 0.27 | 0.17 |
| ERPT (2): | 0.88 | 0.90 | 0.92 |
a See main text for a description of the different model economies and the specification of the regression models.
Table 4B: Estimates of ERPT coefficients for Import Prices in artificial dataa
| Specifications | Economy with σ=5, ω=1.5, Flexible prices | Economy with σ=5, ω=1.5, Sticky prices, low LCP | Economy with σ=5, ω=1.5, Sticky prices, high LCP |
|---|---|---|---|
| Structural: Short run | 0.93 | 0.27 | 0.04 |
| Structural: Long run | 0.93 | 0.93 | 0.93 |
| Naive: | |||
| Naive: | 0.26 | 0.36 | 1.15 |
| PTM: | 0.92 | 0.60 | 0.24 |
| PTM: | 0.93 | 0.88 | 0.74 |
| ERPT (1): | 0.08 | 0.06 | 0.06 |
| ERPT (1): | 1.00 | 1.00 | 1.00 |
| ERPT (2): | 0.90 | 0.51 | 0.18 |
| ERPT (2): | 0.99 | 1.00 | 1.00 |
a See main text for a description of the different model economies and the specification of the regression models.
Table 5A: Estimates of ERPT coefficients for Import Prices in artificial data (Monetary shocks only)a
| Specifications | Economy with σ=2, ω=0.5, Sticky prices, low LCP | Economy with σ=2, ω=0.5, Sticky prices, high LCP |
|---|---|---|
| Structural: Short run | 0.27 | 0.04 |
| Structural: Long run | 0.93 | 0.93 |
| Naive: | ||
| Naive: | 90.3 | 1407 |
| PTM (1): | 0.08 | 0.01 |
| PTM (1): | 0.11 | 0.02 |
| PTM (2): | 0.09 | 0.01 |
| PTM (2): | 1.01 | 0.93 |
| ERPT: | 0.47 | 0.10 |
| ERPT: | 1.00 | 1.01 |
a See main text for a description of the different model economies and the specification of the regression models.
Table 5B: Estimates of ERPT coefficients for Import Prices in artificial data (Monetary shocks only)a
| Specifications | Economy with σ=5, ω=1.5, Sticky prices, low LCP | Economy with σ=52, ω=1.5, Sticky prices, high LCP |
|---|---|---|
| Structural: Short run | 0.27 | 0.04 |
| Structural: Long run | 0.93 | 0.93 |
| Naive: | ||
| Naive: | 97.7 | 93.2 |
| PTM (1): | -0.11 | 0.02 |
| PTM (1): | -0.11 | 0.05 |
| PTM (2): | 0.14 | 0.02 |
| PTM (2): | 1.01 | 1.08 |
| ERPT: | 0.48 | 0.12 |
| ERPT: | 1.00 | 1.00 |
a See main text for a description of the different model economies and the specification of the regression models.
Footnotes
* We thank Jon Faust, Linda Goldberg, Patrick Kehoe, Hélène Rey and seminar participants at the Bank of Portugal, Dallas Fed, Ente Einaudi, European Central Bank, European Economic Association, Federal Reserve Board, Federal Reserve Bank of New York, London School of Economics, Magyar Nemzeti Bank, Universities of Rome and Torino, the Society for Economic Dynamics meetings, the Carnegie-Mellon and Vanderbilt university workshop "Microeconomic Sources of Real Exchange Rate Behavior," and the European University Institute - Northwestern University conference on "Inflation, Interest Rates and Relative Prices". Giancarlo Corsetti's work on this paper is part of the Pierre Werner Chair in Monetary Union at the EUI. The views expressed here are those of the authors and do not necessarily reflect the positions of the ECB, the Board of Governors of the Federal Reserve System, or any other institutions with which the authors are affiliated. Return to text
a Address: Via dei Roccettini 9, San Domenico di Fiesole 50016, Italy; email: [email protected]. Return to text
b Address: Postfach 16 013 19, D-60066 Frankfurt am Main, Germany; email: [email protected]. Return to text
c Address: 20th and C Streets, N.W., Stop 43, Washington, DC 20551, USA; email: [email protected]. Return to text
1. We should also observe that such models typically ignore the different exchange rate elasticity of import prices at the border and at the consumer level, downplaying the empirical evidence on the former. Return to text
2. A corollary of our analysis is that models attributing exchange rate volatility to exogenous noise would simply downplay the importance of regression bias altogether. Return to text
3. These results should be appreciated in light of the fact that in our model exchange-rate movements only responds to shocks to demand and marginal costs, so that the covariance between these and the exchange rate is in general different from zero. In other words, we are building an exercise that is not favorable to regression specifications with omitted variable bias. Moreover, we do more than studying alternative theoretical channels through which exchange rates, marginal costs and revenues may respond to the same set of shocks -- we also provide a quantitative assessment of them. Return to text
4. Due to this assumption, we note from the start that the equilibrium allocation studied below would be identical in a vertically integrated economy, where exporters with monopoly power own local retailers. Return to text
5. A unique invariant distribution of wealth under these preferences will allow us to use standard numerical techniques to solve the model around a stable nonstochastic steady state when only a non-contingent bond is traded internationally (see Obstfeld [1990], Mendoza [1991], and Schmitt-Grohe and Uribe [2001]). Return to text
6. BH,t denotes the Home agent's bonds accumulated during period t - 1 and carried over into period t. Return to text
7. For simplicity, we do not distinguish between nontradable consumption goods, which directly enter the agents' utility, and nontraded distribution services, which are jointly consumed with traded goods. This distinction may however be important in more empirically oriented studies (e.g., see MacDonald and Ricci [2001]). By the same token, we ignore distribution costs incurred in the non-traded good market, as these can be accounted for by varying the level of productivity in the nontradable sector. Return to text
8. In Corsetti, Dedola and Leduc [2004] we estimated this vector process with annual data, the only frequency for which sectoral productivity is available for several OECD countries. If we use a quarterly version of that process we get broadly similar results to those reported here. Return to text
9. In (Corsetti, Dedola and Leduc [2004]), we show that the volatility of international prices is hump-shaped in ω, and thoroughly discussed the mechanism underlying this pattern. Return to text
10. There is considerable uncertainty regarding the true value of trade elasticities, directly related to this parameter. For instance, Taylor [1993] estimates the value for the U.S. to be 0.39, while Whalley [1985], in the study used by Backus et al. [1995], reports a value of 1.5. For European countries most empirical studies suggest a value below 1. For instance, Anderton et al. (2004) report values between 0.5 and 0.81 for the Euro area. In ongoing work, we have found that introducing preferences and technology in which the short-run and long-run elasticity of substitution across tradables differ, with the former being lower than the latter, as in Cooley and Quadrini [2003], may allow us to obtain very similar results to those reported thereafter, while keeping the long run elasticity equal to the traditional value of 1.5. Return to text
11. Thus, import and export prices, the CPI and so on are from U.S. data, while the real exchange rate, for example, refers to the trade-weighted exchange rate for the United States (deflated with CPIs) relative to its trading partners, based on data reported by the OECD and the IMF. Return to text
12. The analysis of a similar economy with flexible prices is fully developed in Corsetti Dedola and Leduc [2004]. Relative to the flexible prices benchmark, in this paper we highlight that this important feature of our model also characterizes specifications with nominal price rigidities. Return to text
13. Because of home bias in consumption, domestic tradables are mainly demanded by domestic households. With a low price elasticity, a terms-of-trade depreciation that reduces domestic wealth relative to the rest of the world would actually result in a drop of the world demand for domestic goods -- the negative wealth effect in the home country would more than offset any global positive substitution and wealth effect. Therefore, for the world markets to clear, a larger supply of domestic tradables must be matched by an increase in their relative price, that is, an appreciation of the terms of trade -- driving up domestic wealth and demand (see Corsetti, Dedola, and Leduc [2004] for details). Return to text
14. Textbook models of the balance of payments, as well as a host of papers in the New open-economy macroeconomics literature, assume a one-for-one response of import prices to exchange rates, namely full or complete ERPT. Notably, complete ERPT obtains if markups over costs are constant. Under complete ERPT, the elasticity of demand for imports is a crucial determinant of the response of the trade balance to movements in the exchange rate. A classical question is whether depreciation of a nation's currency improve its trade balance -- a question that is of particular interest in a world with incomplete financial markets and lies at the core of the external adjustment and the cross-border transmission of inflation. Return to text
15. Most studies of PTM use international price data which do not reveal the invoice currency. For instance, since he compared Japanese export and domestic prices, Marston (1990) had to allow for possible effects of foreign currency invoicing, distinguishing between short run and long run PTM. Although sticky prices in the foreign currency contribute to PTM in the short run, for Japanese exports Marston (1990) finds that substantial PTM persists beyond the period in which prices are sticky. Return to text
16. Interestingly, however, the restrictions on coefficients embedded in this specification are true in our model of price discrimination driven by distribution costs, provided one includes the true structural variables Xt and Zt in the regression, that is, the Foreign marginal cost in the tradable sector and the price of distribution in the Home country. Return to text
17. What conclusions can be drawn from estimating ERPT coefficients? Even if econometricians were able to recover precise estimates of structural pass-through coefficients, there will still be a question about their use in policy-oriented exercises addressing the impact of specific shocks on import prices or, more in general, on the CPI. The main issue is that, in general, structural pass-through coefficients are not a complete description of the actual properties of the model as regards the link between import prices and exchange rates. In each particular period, this link will be determined conditional on the specific shocks causing exchange rate fluctuations. To clarify this point: in all our specifications import prices responds one-to-one to monetary shocks in the long run (in the benchmark economy where prices are flexible this is so also in the short run). Hence, conditional on monetary disturbances, long-run ERPT is perfect. Even if the long-run exchange rate coefficient in the pass-through equation is lower than one, perfect pass-through from monetary shocks will eventually results because such disturbances will bring about related movements in the other endogenous variables entering the structural equation that determines the price of imports -- hence running against the 'ceteris paribus' assumption implicit in interpreting the ERPT coefficient in the structural regressions. Specifically, a monetary easing in the Home country that depreciates the Home currency will eventually cause a proportional increase in the nominal price of distribution services. Putting all these elements together, it is easy to verify that import prices will eventually rise one-to-one with the exchange rate. The lesson is that using structural equations to forecast the impact of exchange rate movements on prices can be severely misleading if one fails to control for the general equilibrium effects of the shocks hitting the economy. Return to text
This version is optimized for use by screen readers. Descriptions for all mathematical expressions are provided in LaTex format. A printable pdf version is available. Return to text