NOTE: International Finance Discussion Papers are
preliminary materials circulated to stimulate discussion and
critical comment. References in publications to International Finance Discussion
Papers (other than an acknowledgment that the writer has had access
to unpublished material) should be cleared with the author or
authors. Recent IFDPs are available on the Web at http://www.federalreserve.gov/pubs/ifdp/. This
paper can be downloaded without charge from the Social Science
Research Network electronic library at http://www.ssrn.com/.
Abstract:
We study the role played by private and
public information in the process of price formation in the U.S.
Treasury bond market. To guide our analysis, we develop a
parsimonious model of speculative trading in the presence of two
realistic market frictions -- information heterogeneity and
imperfect competition among informed traders -- and a public
signal. We test its equilibrium implications by analyzing the
response of two-year, five-year, and ten-year U.S. bond yields to
order flow and real-time U.S. macroeconomic news. We find strong
evidence of informational effects in the U.S. Treasury bond market:
unanticipated order flow has a significant and permanent impact on
daily bond yield changes during both announcement and
non-announcement days. Our analysis further shows that, consistent
with our stylized model, the contemporaneous correlation between
order flow and yield changes is higher when the dispersion of
beliefs among market participants is high and public announcements
are noisy.
Keywords: Treasury Bond Markets; Macroeconomic News Announcements; Strategic Trading; Market Microstructure; Order Flow; Real-Time Data; Expectations; Dispersion of Beliefs
JEL Classification: E44, G14
*Pasquariello is affiliated with the department of Finance at the Ross School of Business at University of Michigan and Vega is affiliated with the Board of Governors of the Federal Reserve System and the University of Rochester Simon School of Business. Please address comments to the authors via email at [email protected] and [email protected]. We benefitted from the comments of Sreedhar Bharath, Michael Brandt, Michael Fleming, Clifton Green, Nejat Seyhun, Guojun Wu, Kathy Yuan, and other participants in seminars at the 2005 European Finance Association meetings in Moscow, the 2006 Bank of Canada Fixed Income Markets conference in Ottawa, Federal Reserve Board of Governors, George Washington University, the University of Maryland, the University of Michigan, the University of Rochester, and the University of Utah. The views in this paper are solely the responsibility of the authors and should not be interpreted as reflecting the views of the Board of Governors of the Federal Reserve System or of any other person associated with the Federal Reserve System.� Return to text
Identifying the causes of daily asset price movements remains a
puzzling issue in finance. In a frictionless market, asset prices
should immediately adjust to public news surprises. Hence, we
should observe price jumps only during announcement times. However,
asset prices fluctuate significantly during non-announcement days
as well. This fact has motivated the introduction of various market
frictions to better explain the behavior of asset prices. One
possible friction is asymmetric information.1 When sophisticated agents trade, their
private information is (partially) revealed to the market, via
order flow, causing revisions in asset prices even in the absence
of public announcements.
The goal of this paper is to theoretically identify and
empirically measure the effect of these two complementary
mechanisms responsible for daily price changes: aggregation of
public news and aggregation of order flow. In particular, we assess
the relevance of each mechanism conditional on the dispersion of
beliefs among traders and the public signals' noise.
To guide our analysis, we develop a parsimonious model of
speculative trading in the spirit of Kyle (1985). The model builds
upon two realistic market frictions: information heterogeneity and
imperfect competition among informed traders (henceforth,
speculators). In this setting, more diverse information among
speculators leads to lower equilibrium market liquidity, since
their trading activity is more cautious than if they were
homogeneously informed, thus making the market-makers more
vulnerable to adverse selection. We then introduce a public signal
and derive equilibrium prices and trading strategies on
announcement and non-announcement days. The contribution of the
model is twofold. To our knowledge, it provides a novel theoretical
analysis of the relationship between the trading activity of
heterogeneously informed, imperfectly competitive speculators, the
availability and quality of public information, and market
liquidity. Furthermore, its analytically tractable closed-form
solution, in terms of elementary functions, generates several
explicit and empirically testable implications on the nature of
that relationship.2In
particular, we show that the availability of a public signal
improves market liquidity (the more so the lower that signal's
volatility) since its presence reduces the adverse selection risk
for the market-makers and mitigates the quasi-monopolistic behavior
of the speculators.
This model is not asset-specific, i.e., it applies to stock,
bond, and foreign exchange markets. In this study, we test its
implications for the U.S. government bond market for three reasons.
First, Treasury market data contains signed trades; thus, we do not
need to rely on algorithms (e.g., Lee and Ready, 1991) that add
measurement error to our estimates of order flow. Second,
government bond markets represent the simplest trading environment
to analyze price changes while avoiding omitted variable biases.
For example, most theories predict an unambiguous link between
macroeconomic fundamentals and bond yield changes, with unexpected
increases in real activity and inflation raising bond yields (e.g.,
Fleming and Remolona, 1997; Balduzzi, Elton, and Green, 2001, among
others). In contrast, the link between macroeconomic fundamentals
and the stock market is less clear (e.g., Andersen, Bollerslev,
Diebold, and Vega, 2004; Boyd, Hu, and Jagannathan, 2005). Third,
the market for Treasury securities is interesting in itself since
it is among the largest, most liquid U.S. financial markets.
Our empirical results strongly support the main implications of
our model. During non-announcement days, adverse selection costs of
unanticipated order flow are higher when the dispersion of beliefs
-- measured by the standard deviation of professional forecasts of
macroeconomic news releases -- is high. For instance, we estimate
that a one standard deviation shock to abnormal order flow
decreases two-year, five-year, and ten-year bond yields by
, , and basis points, respectively, on
high dispersion days compared to , , and
basis points on low
dispersion days. These differences are economically and
statistically significant. Consistently, these higher adverse
selection costs translate into higher contemporaneous correlation
between order flow changes and bond yield changes. For example, the
adjusted of
regressing daily five-year Treasury bond yield changes on
unanticipated order flow is on high dispersion days compared to
on low dispersion
days. Intuitively, when information heterogeneity is high, the
speculators' quasi-monopolistic trading behavior leads to a ``
cautious'' equilibrium where changes in unanticipated order flow
have a greater impact on bond yields.
The release of a public signal, a trade-free source of
information about fundamentals, induces the speculators to trade
more aggressively on their private information. Accordingly, we
find that the correlation between unanticipated order flow and
day-to-day bond yield changes is lower during announcement days.
For example, comparing non-announcement days with Nonfarm Payroll
Employment release dates, the explanatory power of order flow
decreases from
to , to , and to for the two-year, five-year,
and ten-year bonds, respectively. Yet, when both the dispersion of
beliefs and the noise of the public signal -- measured as the
absolute difference between the actual announcement and its last
revision -- are high, the importance of order flow in setting bond
prices increases. All of the above results are robust to
alternative measures of the dispersion of beliefs among market
participants, as well as to different regression specifications and
the inclusion of different control variables. Lastly, our evidence
cannot be attributed to transient inventory or portfolio
rebalancing considerations, since the unanticipated government bond
order flow has a permanent impact on yield changes during both
announcement and non-announcement days in the sample.
Our paper is most closely related to two recent studies of order
flow in the U.S. Treasury market. Brandt and Kavajecz (2004) find
that order flow accounts for up to of the variation in yields on days without major
macroeconomic announcements. Green (2004) examines the effect of
order flow on intraday bond price changes surrounding U.S.
macroeconomic news announcements. We extend both studies by
identifying a theoretical and empirical link between the price
discovery role of order flow and the degree of information
heterogeneity among investors and the quality of macroeconomic data
releases. In particular, we document important effects of both
dispersion of beliefs and public signal noise on the correlation
between daily bond yield changes and order flow during announcement
and non-announcement days. This evidence complements the weak
effects reported by Green (2004) over thirty-minute intervals
around news releases. Since the econometrician does not observe the
precise arrival time of private information signals, narrowing the
estimation window may lead to underestimating the effect of
dispersion of beliefs on market liquidity.3
Our work also belongs to the literature bridging the gap between
asset pricing and market microstructure. Evans and Lyons (2003)
find that signed order flow is a good predictor of subsequent
exchange rate movements; Brandt and Kavajecz (2004) show that this
is true for bond market movements; Easley, Hvidkjaer, and O'Hara
(2002) argue that the probability of informed trading (PIN), a
function of order flow, is a priced firm characteristic in stock
returns. These studies enhance our understanding of the
determinants of asset price movements, but do not provide any
evidence on the determinants of order flow. Evans and Lyons (2004)
address this issue by showing that foreign exchange order flow
predicts future macroeconomic surprises, i.e., it conveys
information about fundamentals. We go a step further in linking the
impact of order flow on bond prices to macroeconomic uncertainty
(public signal noise) and the heterogeneity of beliefs about real
shocks.
We proceed as follows. In Section 2, we construct a stylized
model of trading to guide our empirical analysis. In Section 3, we
describe the data. In Section 4, we present the empirical results.
We conclude in Section 5.
In this section we motivate our investigation of the impact of
the dispersion of beliefs among sophisticated market participants
and the release of macroeconomic news on the informational role of
trading. We first describe a one-shot version of the multi-period
model of trading of Foster and Viswanathan (1996) and derive
closed-form solutions for the equilibrium market depth and trading
volume. Then, we enrich the model by introducing a public signal
and consider its implications for the equilibrium price and trading
strategies. All proofs are in the Appendix unless otherwise
noted.
The basic model is a two-date, one-period economy in which a
single risky asset is exchanged. Trading occurs only at the end of
the period (), after
which the asset payoff, a normally distributed random variable
with mean zero and
variance
, is
realized. The economy is populated by three types of risk-neutral
traders: a discrete number () of informed traders (that we label speculators),
liquidity traders, and perfectly competitive market-makers (MMs).
All traders know the structure of the economy and the decision
process leading to order flow and prices.
At time there is
neither information asymmetry about nor trading. Sometime between and , each speculator receives a private and noisy signal of , . We assume that the resulting signal vector
is drawn from a
multivariate normal distribution (MND) with mean zero and
covariance matrix
such that
and
. We also
impose that the speculators together know the liquidation value of
the risky asset:
; therefore,
.
This specification makes the total amount of information available
to the speculators independent from the correlation of their
private signals, albeit still implying the most general information
structure up to rescaling by a constant (see Foster and
Viswanathan, 1996).
These assumptions imply that
and
,
where
is the
correlation between any two private information endowments
and
. As in
Foster and Viswanathan (1996), we parametrize the degree of
diversity among speculators' signals by requiring that
. This restriction
ensures that
is positive
definite. If , then
speculators' private information is homogeneous: All speculators receive the same
signal
such
that
and . If
, then speculators'
information is heterogeneous:
,
, and
. Otherwise,
speculators' signals are only partially correlated: Indeed,
if
and
if
.4
At time , both
speculators and liquidity traders submit their orders to the MMs,
before the equilibrium price has been set. We define the market order of the
speculator to be .
Thus, her profit is given by
.
Liquidity traders generate a random, normally distributed demand
, with mean zero and
variance
. For
simplicity, we assume that is independent from all other random variables. MMs
do not receive any information, but observe the aggregate order
flow
from all market
participants and set the market-clearing price
.
Consistently with Kyle (1985), we define a Bayesian Nash
equilibrium as a set of
functions
,
and
such that the following two
conditions hold:
Profit maximization:
;
Semi-strong market efficiency:
.
We restrict our attention to linear equilibria. We first
conjecture general linear functions for the pricing rule and
speculators' demands. We then solve for their parameters satisfying
conditions 1 and 2. Finally, we show that these parameters and
those functions represent a rational expectations equilibrium. The
following proposition accomplishes this task.
Proposition 1There exists a unique linear equilibrium given by the
price function
(1)
and by the
speculator's demand strategy
,
(2)
where
.
The optimal trading strategy of each speculator depends on the
information she receives about the asset payoff () and on the depth of the market (
). If
, Eqs. (1) and (2) reduce to the well-known
equilibrium of Kyle (1985). The speculators, albeit risk-neutral,
exploit their private information cautiously (
), to avoid
dissipating their informational advantage with their trades. Thus,
the equilibrium market liquidity in reflects MMs' attempt to be compensated for the
losses they anticipate from trading with speculators, as it affects
their profits from liquidity trading.
The intuition behind the parsimonious equilibrium of Eqs.
(1) and (2) is similar to
that in the multi-period models of Foster and Viswanathan (1996)
and Back et al. (2000). Yet, its closed-form solution (in
Proposition 1) translates that intuition into unambiguous
predictions on the impact of information heterogeneity on market
depth.5 The
optimal market orders depend on the number of speculators
() and the correlation
among their information endowments (). The intensity of competition among
speculators affects their ability to maintain the informativeness
of the order flow as low as possible. A greater number of
speculators trade more aggressively -- i.e., their aggregate amount
of trading is higher -- since (imperfect) competition among them
precludes any collusive trading strategy. For instance, when
speculators are
homogeneously informed (), then
, which
implies that the finite difference
. This behavior reduces the adverse selection problem for
the MMs, thus leading to greater market liquidity (lower
).
The heterogeneity of speculators' signals attenuates their
trading aggressiveness. When information is less correlated
( closer to zero),
each speculator has some monopoly power on her signal, because at
least part of it is known exclusively to her. Hence, as a group,
they trade more cautiously -- i.e., their aggregate amount of
trading is lower -- to reveal less of their own information
endowments
. For
example, when
speculators are heterogeneously informed (), then
, which
implies that
, i.e., lower than the aggregate amount of trading by
homogeneously
informed speculators () but identical to the trade of a monopolistic
speculator (). This
``quasi-monopolistic'' behavior makes the MMs more vulnerable to
adverse selection, thus the market less liquid (higher ). The following corollary
summarizes the first set of empirical implications of our
model.
Corollary 1Equilibrium market liquidity is increasing in the number
of speculators and decreasing in the heterogeneity of their
information endowments.
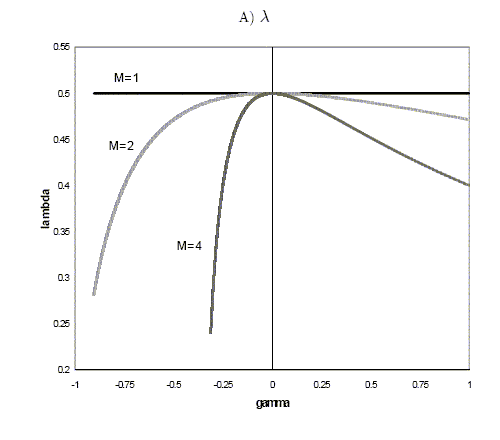
To gain further insight on this result, we construct a simple
numerical example by setting
. We then vary the parameter
to study the
liquidity of this market with respect to a broad range of signal
correlations (from
very highly negative to very highly positive) when , , and . By
construction, both the private signals' variance (
) and
covariance (
) change
with and , yet the total amount of information
available to the speculators is unchanged. We plot the resulting
in Figure 1A.
Multiple, perfectly heterogeneously informed speculators
() collectively
trade as cautiously as a monopolist speculator. Under these
circumstances, adverse selection is at its highest, and market
liquidity at its lowest (
). A greater
number of competing speculators improves market depth, but
significantly so only if accompanied by more correlated private
signals. However, ceteris paribus, the improvement in market
liquidity is more pronounced (and informed trading less cautious)
when speculators' private signals are negatively correlated. When
, each
speculator expects her competitors' trades to be negatively
correlated to her own (pushing against her signal), hence trading on it to be
more profitable.
We now extend the basic model of Section 2.1 by providing each
player with an additional, common source of information about the
risky asset before trading takes place. According to Kim and
Verrecchia (1994, p. 43), ``public disclosure has received little
explicit attention in theoretical models whose major focus is
understanding market liquidity.''6 More specifically, we assume that,
sometime between and
, both the
speculators and the MMs also observe a public and noisy signal
of the asset
payoff . This signal
is normally distributed with mean zero and variance
. We can think of
as any surprise
public announcement (e.g., macroeconomic news) released
simultaneously to all market participants. We further impose that
, so that the
parameter
controls
for the quality of the public signal and
.
The private information endowment of each speculator is then given
by
, where
and
. Thus,
, where
.
Again we search for linear equilibria. The following proposition
summarizes our results.
Proposition 2There exists a unique linear equilibrium given by the
price function
(3)
and by the
speculator's demand strategy
,
(4)
where
and
.
The optimal trading strategy of each speculator in Eq. (4) mirrors that of Proposition 1 (Eq. (2)), yet it now depends only on
, the
truly private -- hence less correlated (
)
-- component of speculator 's original private signal () in the presence of a public
signal of . Hence, the
MMs' belief update about
stemming from makes
speculators' private information less valuable. The resulting
equilibrium price in
Eq. (3) can be rewritten as
.
(5)
According to Eq. (5), the public signal impacts
through two
channels that (in the spirit of Evans and Lyons, 2003) we call
direct , related to MMs' belief
updating process (
), and
indirect, via the speculators' trading
activity ().
Since
, the former always dominates the latter. Therefore, public
news always enter the equilibrium price with the ``right'' sign.
Foster and Viswanathan (1993) generalize the trading model of
Kyle (1985) to distributions of the elliptically contoured class
(ECC) and show that, in the presence of a discrete number of
identically informed traders, the unexpected realization of a
public signal has no impact on market liquidity regardless of the
ECC used. This is the case for the equilibrium of Proposition 2 as
well.7Nonetheless, Proposition 2 allows us to
study the impact of the availability of noisy public information on
equilibrium market depth in the presence of imperfectly competitive
and heterogeneously informed speculators. To our knowledge, this
analysis is novel to the financial literature. We start with the
following result.
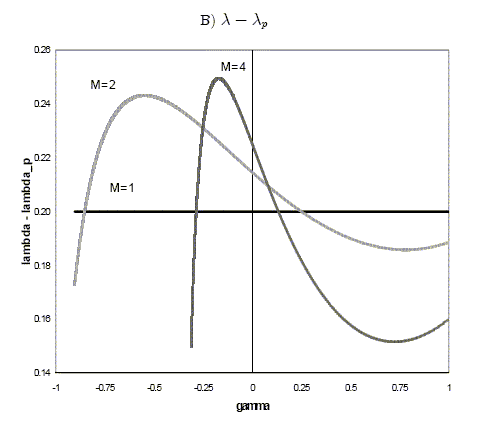
Corollary 2The availability of a public signal of increases equilibrium market
liquidity.
The availability of the public signal reduces the adverse selection
risk for the MMs, thus increasing the depth of this stylized
market, for two reasons. First, the public signal represents an
additional, trade-free source of information about . Second, speculators have to trade
more aggressively to extract rents from their private information.
In Figure 1B we plot the ensuing gain in liquidity,
,
as a function of private signal correlations when the public signal's noise
,
i.e., by varying and
(so
and
as well,
but not the total amount of information available to the
speculators) as in Figure 1A. The increase in market depth is
greater when is
negative and the number of speculators () is high. In those circumstances,
the availability of a public signal reinforces speculators'
existing incentives to place market orders on their private signals
more
aggressively. However, greater
, ceteris
paribus, increases
, since the
poorer quality of
(lower information-to-noise ratio
) induces the MMs
to rely more heavily on
to set
market-clearing prices, hence the speculators to trade less
aggressively.
Remark 1(The
increase in) market liquidity is decreasing in the
volatility of the public signal.
In the presence of a public signal, information heterogeneity
among speculators plays a more ambiguous role on market liquidity.
If the volatility of the public signal is low, heterogeneously
informed (thus more cautious) speculators put less weight on their
private signals
(lower in
) and
more weight on the public signal (higher in
)
when updating their beliefs than homogeneously informed (thus more
aggressive) speculators. Hence, the ensuing trading behavior leads
to less adverse selection risk for the
MMs (lower
). Vice
versa, when
is high,
speculators rely more heavily on their private signals, but more
cautiously so if gamma is low, leading to lower equilibrium market
depth (higher
), as in
Corollary 1.
Remark 2Information heterogeneity decreases market liquidity only when
the volatility of the public signal is ``high.''
The volatility of the public signal also affects its direct impact (
) on the
equilibrium price of Eq. (3). Everything else
equal, the poorer is the quality of the public signal (higher
), the more
the speculators rely on their private signals (see Remark 1) and the MMs rely
on the aggregate order flow
to infer
the asset payoff .
Consequently, the MMs put less weight on and more weight on
in setting
the market-clearing price , toward the benchmark of Eq. (1):
and
.
Corollary 3The sensitivity of the equilibrium price to the public
signal is decreasing in that signal's volatility.
We test the implications of the model presented in the previous
section using U.S. Treasury bond market data and U.S. macroeconomic
announcements. As mentioned in Section 1, this choice is motivated
not only by the quality and availability of data on U.S. government
bond transactions, but also by the clear theoretical link between
macroeconomic fundamentals and bond yield changes.
We use intraday U.S. Treasury bond yields, quotes, transactions,
and signed trades for the most recently issued, ``on-the-run,''
two-year, five-year, and ten-year Treasury notes. We use these
``on-the-run'' notes because, according to Fleming (1997), Brandt
and Kavajecz (2004), and Goldreich, Hanke, and Nath (2005), those
are the securities with the greatest liquidity and where the
majority of informed trading takes place. We are interested in
studying the informational role of bond trading related to
macroeconomic fundamentals. Therefore, we focus on the intermediate
to long maturities, since these are the most responsive to
macroeconomic aggregates (e.g., Balduzzi et al., 2001).
Consistently, when we perform the analysis that follows on the
remaining ``on-the-run'' and ``off-the-run'' Treasury securities in
our database, we find that (i) the resulting inference for the
former is weaker than the one described in the paper, and (ii)
order flow has no impact on yield changes for the latter. These
results are available upon request from the authors.
We obtain the data from GovPX, a firm that collects quote and
trade information from six of the seven main interdealer brokers
(with the notable exception of Cantor Fitzgerald).8 Fleming (1997) argues that these six
brokers account for approximately two-thirds of the
interdealer-broker market, which in turn translates into
approximately of the
trading volume in the secondary market for Treasury securities. Our
sample includes every transaction taking place during ``regular
trading hours,'' from 7:30 a.m. to 5:00 p.m. Eastern Standard Time
(EST), between January 2, 1992 and December 29, 2000. GovPX stopped
recording intraday volume afterward. Strictly speaking, the U.S.
Treasury market is open
hours a day; yet, of
the trading volume occurs during those hours. Thus, to remove
fluctuations in bond yields due to illiquidity, we ignore trades
outside that narrower interval. Finally, the data contains some
interdealer brokers' posting errors not previously filtered out by
GovPX. We eliminate these errors following the procedure described
in Fleming's (2003) appendix.
We report summary statistics for the daily raw yield and
transaction data in Table 1. Bond yields are in percentage, i.e.,
were multiplied by ;
bond yield changes are in basis points, i.e., were multiplied by
. Not
surprisingly, mean Treasury bond yields are increasing with
maturity and display large positive first-order autocorrelation (
). Mean daily yield changes
are small or zero; yet, their sample variability suggests that
economically important fluctuations of the yield curve took place
over the sample period. Five-year Treasury notes are characterized
by the largest mean daily number of transactions (roughly
), hence by the
highest liquidity, consistent with the findings of Fleming (2003),
among others.
We also compare (but do not report here for economy of space)
daily bond yield changes during days when one of the most closely
observed U.S. macroeconomic announcement, the Nonfarm Payroll
Employment report, is released to daily bond yield changes during
non-announcement days.9 Bond
yield changes are clearly more volatile on days when the Payroll
numbers are announced, but yield changes during non-announcement
days are economically significant as well. These dynamics, together
with the poor performance of public macroeconomic surprises in
explaining fluctuations in bond yields on non-announcement days,
further motivate our study of the price discovery role of order
flow when no public news arrive to the bond market.
We use the International Money Market Services (MMS) Inc.
real-time data on the expectations and realizations of of the most relevant U.S.
macroeconomic fundamentals to estimate announcement surprises.
Table 2 provides a brief description of the most salient
characteristics of U.S. economic news announcements in our sample:
the total number of observations, the agency reporting each
announcement, the time of the announcement release, and whether the
standard deviation across professional forecasts is available.
Fleming and Remolona (1997) and Andersen, Bollerslev, Diebold, and
Vega (2003) discuss the main properties of MMS forecasts; Balduzzi
et al. (2001) show that these forecasts are not stale and
unbiased.
We define announcement surprises as the difference between
announcement realizations and their corresponding expectations.
More specifically, since units of measurement vary across
macroeconomic variables, we standardize the resulting surprises by
dividing each of them by their sample standard deviation. The
standardized news associated with the macroeconomic indicator
at time is therefore computed as
,
(6)
where is the
announced value of indicator ,
is its MMS median forecast, as a proxy for its market expected
value, and
is the sample standard deviation of
. Eq.
(6) facilitates meaningful comparisons of
responses of different bond yield changes to different pieces of
news. Operationally, we estimate those responses by regressing bond
yield changes on news. However, since
is constant for any indicator , the standardization affects neither the statistical
significance of response estimates nor the fit of the regressions.
We use the MMS standard deviation across professional forecasts
as a measure of dispersion of beliefs across sophisticated
investors. This measure of information heterogeneity is widely
adopted in the literature on investors' reaction to information
releases in the stock market (e.g., Diether, Malloy, and Scherbina,
2002; Kallberg and Pasquariello, 2004); Green (2004) recently uses
it in a bond market context. As indicated in Table 2, this variable
is only available for
of the
macroeconomic news in our sample.
Overall, the dispersion of beliefs is large (e.g., roughly
on average of the
mean absolute monthly Nonfarm Payroll report), time-varying, and
positively correlated across macroeconomic announcements. To
conserve space, we do not show the correlation matrix of all the
announcements, but only report (in Table 2) the pairwise
correlation between each announcement and arguably the most
important of them, the Nonfarm Payroll report (e.g., Andersen and
Bollerslev, 1998; Andersen et al., 2004; Brenner et al., 2005).
This correlation is positive, albeit not statistically significant
for most of the announcements. Thus, dispersion of beliefs in
Nonfarm Payroll forecasts is not necessarily a good measure of
information heterogeneity about the state of the economy, which is
ultimately what we are interested in. This motivates us to
construct three alternative measures of dispersion of beliefs
during announcement and non-announcement days: one based
exclusively on the Payroll announcement, another based on
``influential''
announcements (defined below), and the last one based on the
announcements for
which the standard deviation of professional forecasts is available
(i.e., those italicized in Table 2).
The use of the MMS database to calculate monthly measures of
dispersion of beliefs raises two issues: (i) the announcements in
Table 2 are released at different frequencies and (ii) the standard
deviation of professional forecasts only measures heterogenous
beliefs at the time of the announcement. We address these issues by
assuming that the dispersion of beliefs remains constant between
announcements. This assumption is empirically justified since the
first order autocorrelation in the standard deviation of
professional forecasts (
in Table 2) is positive and mostly statistically significant.
Hence, if the dispersion of beliefs across investors is high in one
month (week or quarter), it is likely to remain high in the next
month (week or quarter).
To convert weekly and quarterly dispersions to a monthly
frequency we use the following procedure. For the single weekly
announcement in the sample, Initial Unemployment Claims, we average
the dispersion of beliefs across four weeks. For the three
quarterly announcements in the sample, GDP Advance, Preliminary,
and Final, we assume that the dispersion of beliefs in the first
month of the quarter is constant throughout the quarter. The
dispersion of beliefs of monthly announcements is instead left
unchanged and assumed to be constant between announcements.
We then define our monthly proxy for the aggregate degree of
information heterogeneity about macroeconomic fundamentals as a
weighted sum of monthly dispersions across announcements,
,
(7)
where is the
standard deviation of announcement across professional forecasts and
and
are its sample mean and
standard deviation, respectively. is equal to when we only use the Nonfarm Payroll Employment to
compute our measure of dispersion of beliefs. is equal to when we use the following
``influential'' macroeconomic announcements: Nonfarm Payroll
Employment, Retail Sales, New Home Sales, Consumer Confidence
Index, NAPM Index, Index of Leading Indicators, and Initial
Unemployment Claims.10 Lastly,
is equal to
when we use all the
announcements for which the measure is available in our sample (i.e., those
italicized in Table 2). The standardization in Eq. (7) is necessary because, as we mentioned earlier, units
of measurement differ across economic variables.
We use the monthly dispersion estimates from these three
methodologies to classify days in which the corresponding monthly
variable is
above (below) the top (bottom)
(
)
percentile of its empirical distribution as days with high (low)
information heterogeneity. The resulting time series of high
() and low
() dispersion days
are positively correlated: Their correlations (not reported here)
range from (between
the Payroll-based series, , and the series constructed with the influential
announcements, ) to
(between the
series using all announcements, , and the one based only on the influential news
releases, ).
Finally, we report in Table 3 the differences in the mean daily
number of transactions () in the two, five, and ten-year Treasury bond
markets across days with high () and low () dispersion of beliefs measured with the three
alternative methods described above. The corresponding statistics are computed using
Newey-West standard errors, because Table 1 shows that the number
of daily transactions is positively autocorrelated. Consistent with
Griffith, Smith, Turnbull, and White (2000) and Ranaldo (2004),
among others (but also with the spirit of the model of Section 2),
we interpret a big (small) number of daily transactions as a proxy
for a high (low) degree of trading aggressiveness. The ensuing
differences are economically and statistically significant: fewer
transactions take place in high dispersion days than in low
dispersion days (i.e.,
).
Consistently, Spearman correlations between and either , , or (not reported here) are
always negative for all maturities and mostly statistically
significant. This evidence provides support for the basic intuition
of our model and gives us further confidence in the heterogeneity
proxies of Eq. (7), since it suggests that, in
the government bond market, periods of greater dispersion of
beliefs among market participants are accompanied by more cautious
speculative trading activity, as argued in Section 2.1.1.
The U.S. government often revises previously released
macroeconomic information. Aruoba (2004) identifies these data
revisions as either ``informative,'' i.e., due to newly available
information, or ``uninformative,'' i.e., due to definitional
changes (such as changes in the base-year or changes in seasonal
weights). In this paper, we use the former revisions to measure
public signal noise. Specifically, we use the Federal Reserve Bank
of Philadelphia ``Real Time Data Set'' (RTDS), which records not
only real-time macroeconomic announcements but also their
subsequent revisions.11 Of the
announcements in
Table 2 for which MMS forecasts are available, the RDTS contains
monthly data on Capacity Utilization, Industrial Production, and
Nonfarm Payroll Employment report. The only variable undergoing
``uninformative'' changes over the sample period is Industrial
Production, whose base-year was revised in February 1998. According
to extant literature (e.g., Mork, 1987; Faust, Rogers, and Wright,
2003; Aruoba, 2004), (i) the final published revision of each
actual announcement represents the most accurate measure for the
corresponding macroeconomic variable, and (ii) those revisions
should be interpreted as noise, for they are predictable (based on
past information).12 Hence,
we measure public news noise as the difference between each initial
announcement and its last revision. Since what matters in our model
is the magnitude of the noise (
of
Section 2.2), not its direction, we use the absolute value of this
difference in our empirical analysis.
Consistent with Aruoba (2004), the resulting time series of
simple and absolute macroeconomic data revisions -- i.e., the
simple and absolute differences between the real-time announcement
and the final revision for Capacity Utilization, Industrial
Production, and Nonfarm Payroll Employment -- display a few spikes
and are often negative, revealing a tendency for the government to
be overly conservative in its initial announcements. Interestingly,
the absolute value of the measurement error tends to be positively
correlated with the volatility of the underlying announcement, with
correlations (not reported here) varying between a low of
(Industrial
Production) and a high of (Nonfarm Payroll). This suggests that the
measurement error is related to macroeconomic uncertainty. In our
theoretical model,
arises
from either uncertainty about the macroeconomy or the quality of
the public signal. In the ensuing empirical analysis, we consider
both possibilities.
The model of Section 2 generates several implications that we
now test in this section. In the database described in Section 3,
we are able to directly observe price changes,
, as a
proxy for , public
news surprises ,
as a proxy for ,
and aggregate order flow
, as a proxy
for
. Yet, in
our setting, it is only the unexpected portion of aggregate order
flow that affects the equilibrium prices of Eqs. (1) and (3).13 Furthermore,
is assumed
to depend only on informed and liquidity trading. Yet, in reality,
many additional microstructure imperfections can cause lagged
effects in the observed order flow (see Hasbrouck, 2004).
Therefore, to implement our model, we estimate
, the
unanticipated portion of aggregate order flow.
For that purpose, we use the linear autoregressive model of
Hasbrouck (1991),
,
(8)
where
is the
half-hour net order flow in the market (purchases take a
and sales take a
) for interval
,
is the
half-hour quote revision, and and are polynomials in the lag operator. We estimate
Eq. (8) separately for two-year, five-year, and
ten-year Treasury notes using lags (one day) because they are sufficient to
eliminate all the serial correlation in the data. The results that
follow are robust to different lag-length polynomials.14 As previously mentioned, we focus on
daily horizons, for narrower intervals (e.g., as in Green, 2004)
may lead to underestimate the impact of information heterogeneity
on investors' trading activity. Therefore, we compute aggregate
unanticipated (or `` abnormal'') net order flow over each day
by simply summing
the 19 residuals of Eq. (8) within each day,
, as a proxy for
. As shown
in Table 1, this procedure successfully eliminates the first-order
autocorrelation in the aggregate raw order flow series
.
GovPX calculates bond yields using transaction prices, so there
is a mechanical inverse relation between the two quantities. To be
consistent with the term-structure literature, we estimate the
impact of unanticipated order flow and public information arrivals
on daily yield changes (
) rather
than on price changes. Nonetheless, our results are robust to
either specification. We translate the equilibrium prices of
Propositions 1 and 2 into the following estimable equations:
when a public signal
becomes available to all market participants on day (Eq. (3)).
According to our model, we expect and
to be
negative, while, according to the Lucas (1982) model, we expect
to be
positive for positive real activity and inflationary shocks.
Even in the absence of the information effects of our model,
inventory considerations (first formalized by Garman, 1976) may
explain, either in full or in part, any significant correlation
between price changes and order flow. Yield changes may in fact
react to net order flow imbalances, to compensate market
participants for providing liquidity, even when the order flow has
no information content. To assess the relevance of this alternative
hypothesis, we follow Hasbrouck (1991) and include lagged values of
unanticipated order flow and yield changes in both Eqs. (9) and (10). As in Hasbrouck
(1991), we assume the permanent impact of trades is due to
information shocks and the transitory impact is due to
noninformation (e.g., liquidity) shocks. Hence, negative and
significant estimates for and
are driven
by transitory inventory control effects when accompanied by a
positive and significant impact of lagged unanticipated net order
flow on yield changes. In other words, significant contemporaneous
order flow effects are transient if
they are later reversed. On the other hand, negative and
significant estimates for and
are driven
by permanent information effects (consistent with our model) when
accompanied by negative and significant, or statistically
insignificant, impact of lagged unanticipated net order flow on
yield changes.
We start by estimating Eq. (9) across
non-announcement days and then testing the main implication of
Proposition 1, namely that market liquidity (
) is
decreasing in the heterogeneity of speculators' information
endowments. First, we define non-announcement days consistently
with our procedures to measure such heterogeneity (in Section
3.2.2). When , we
define non-announcement days as all trading Fridays in the sample
in which no Nonfarm Payroll Employment report is released, to
control for potential day-of-the-week effects. When or , we define non-announcement days as all trading
days when none of the corresponding announcements (either the
influential ones or those italicized in Table 2) take place. We
then test Corollary 1 by amending Eq. (9) as
follows:
(11)
,
where () is a dummy variable equal to
one on non-announcement days with high (low) heterogeneity of
beliefs, as defined in Section 3.2.2, and equal to zero otherwise.
Motivated by the discussion above, we estimate both the
contemporaneous and lagged effects of unanticipated order flow on
yield changes. Specifically, we define the impact of order flow on
yield changes as permanent (i.e., driven by information effects)
when lasting for at least five trading days. Hence, we set
in Eq. (11 ).15 We
report the resulting estimates in Table 4 using the three proxies
for information heterogeneity, , ,
and . Since higher
dispersion days are also associated with more volatile bond yields,
the standard errors are adjusted for heteroskedasticity. We also
correct for serial correlation, given the mild, though
statistically significant, first-order autocorrelation in daily
bond yield changes.
The results in Table 4 provide strong evidence for information
effects of order flow on bond yield changes and no evidence for
inventory control effects. For all maturities and nearly all
measures of dispersion of beliefs, the estimated contemporaneous
correlation between unanticipated order flow and yield changes (
) is
negative and significant. The coefficients for one-period lagged
unanticipated order flow (
), not
reported here, are instead often negative, always statistically
insignificant at the
level, and about ten times smaller in magnitude than the
contemporaneous coefficients
. Lastly,
the resulting cumulated impact of unanticipated order flow on yield
changes (
in Table 4) is
mostly statistically significant, albeit more weakly so on
non-announcement days with low heterogeneity of beliefs. In other
words, we find no evidence that the impact of unanticipated U.S.
Treasury bond order flow on yield changes is reversed in the next
five trading days, except in correspondence with low dispersion of
beliefs about Nonfarm Payroll announcements ().
The results in Table 4 also provide strong evidence in favor of
Corollary 1, especially for the five-year bond, the most liquid
U.S. Treasury note. Regardless of whether we use only the Nonfarm
Payroll announcement to measure dispersion of beliefs or whether we
aggregate dispersion of beliefs across macroeconomic announcements,
we cannot reject the null hypothesis that
. This evidence is
consistent with the basic intuition of the benchmark model of
Section 2.1: In the absence of a public signal, greater information
heterogeneity among investors translates into greater adverse
selection risk for the market-makers, hence into lower market
liquidity (
).
The increase in adverse selection costs in correspondence with
high dispersion of beliefs among market participants is not only
statistically but also economically significant. For example, when
classifying trading days according to (i.e., only with respect to
the volatility of Nonfarm Payroll forecasts), we find that a one
standard deviation shock to unanticipated order flow in five-year
bonds decreases their yields by basis points on high dispersion days
() and just
basis points on
low dispersion days (), as compared to a daily yield change one
standard deviation from its mean of roughly basis points (in Table 1) over
the entire sample. Consistently, the correlation between daily
five-year bond yield changes and unanticipated daily net order flow
(the adjusted of the
above regression) is much greater during high dispersion days (
)
than during low dispersion days (
).
We also find evidence in favor of Corollary 1 in the two-year
bond market, although only when we use the dispersion of analysts'
forecasts about Nonfarm Payroll Employment () and Influential announcements
() as proxies for
information heterogeneity, and in the ten-year bond market when we
use the Nonfarm Payroll announcement alone. This may be due to the
fact that not all macroeconomic announcements are equally important
ex ante, thus making the aggregate dispersion of beliefs across
announcements a noisy measure of such heterogeneity. We explore
this issue in greater depth in Section 4.2.
In the model of Section 2, equilibrium market liquidity (
and
) is a
function of several parameters beyond the one determining the
intensity of information heterogeneity among speculators
(). For example, in
the benchmark equilibrium with no public signal (Proposition 1),
also depends on
the intensity of noise trading (
), the
number of informed traders (), and the volatility of the intrinsic value of the
asset (
). The
regression model of Eq. (11), whose estimates
are reported in Table 4, does not explicitly control for any of
these parameters. These omissions have the potential to bias our
inference.
To begin with, in our model the parameters
,
, and
are unrelated to the
dispersion of beliefs. If this were true, the estimation of Eq.
(11) would in principle be unbiased.
Nevertheless, omitted variable biases may arise from relaxing some
of the model's most stringent assumptions. For example, if we
allowed for endogenous entry of informed traders, the equilibrium
number of market participants might be correlated with their
dispersion of beliefs, since the latter would affect investors'
potential profits from trading. In addition, misspecification
biases may arise from the intertemporal dynamics of either
speculators' participation, intensity of noise trading, or
fundamental uncertainty. It is difficult to control for these
variables. In this section, we do our best to gauge the robustness
of the results presented above to their inclusion. The analysis
that follows indicates that these results are indeed robust.
Specifically, we conduct several robustness checks. First, the
inclusion of lagged unanticipated order flow in Eq. (11) allows us to assess the relevance of any
transient, noninformation effect (hence not just inventory control
effects but also those due to noise trading,
) on the
relationship between trades and price changes (see Hasbrouck,
1991). As previously mentioned, the estimation of Eq. (11) in Table 4 indicates that the impact of
unanticipated government bond order flow on yield changes is
permanent, i.e., cannot be explained by transitory noise effects.
Alternatively, we determine the importance of noise trading by
computing order flow and yield changes over disjoint intervals of
each day in our sample, as in Brandt and Kavajecz (2004), rather
than concurrently. In particular, we aggregate unanticipated order
flow in the morning (from 7:30 a.m. to 12:00 p.m.), labeled as time
, and average yields
from 12:00 p.m. until the end of each trading day (5:00 p.m.),
labeled as time . We
then regress bond yield changes at time on unanticipated order flow at
time . This procedure not
only prevents non-synchronous measurement errors (as argued by
Brandt and Kavajecz, 2004) but also allows us to identify the long
run or permanent effect of order flow on prices. The resulting
estimates of market liquidity, not reported here, are qualitatively
similar to those from Eq. (11) presented in
Table 4.
We also control for the number of informed traders () and the volatility of the intrinsic
value of the asset (
). We do
so by including in Eq. (11) additional
variables capturing the interaction between (i.e., the product of):
(i) order flow and daily realized volatility,16(ii) order flow and the number of
transactions, and (iii) order flow and a weight linearly increasing
as the announcement date approaches.17 In our model, the degree of
information heterogeneity affects both equilibrium price volatility
and the aggressiveness of informed trading (proxied by the number
of transactions, as in Section 3.2.2). Depending on the strength of
these effects, the inclusion of those cross terms in Eq. (11) may reduce the statistical significance of the
relation between market liquidity and dispersion of beliefs.
Instead, we find no evidence that order flow interacts with either
the number of transactions or the proximity to the announcement
date. The product of order flow and daily realized volatility is
statistically significant only in the five-year Treasury bond
market.18 This is
not surprising, since we expect informed investors to be more
active in the most liquid trading venues (e.g., Chowdhry and Nanda,
1991), as so the five-year bond market is generally deemed (e.g.,
Fleming, 2003). It is therefore possible that our proxy for
realized volatility is successfully capturing the time-varying
participation of informed traders only in the market where such
participation is probably most important. Nonetheless, neither the
economic nor the statistical significance of the dispersion of
beliefs dummies in Table 4 are affected by the inclusion of these
interaction terms in Eq. (11).
Lastly, we control for variables outside our model that might
spuriously affect our results. For example, Treasury auction dates
might have a liquidity effect on the secondary bond market. Thus,
if our proxies for dispersion of beliefs were spuriously correlated
with auction dates, an additional omitted variable bias might
arise. We account for this eventuality by including the interaction
between order flow and dummies for these dates in Eq. (11).19 The
liquidity of U.S. Treasury bonds may also be affected by their
repurchase agreement (repo) rates, i.e., by their specialness. According to Moulton (2004), the
relative repo specialness of on-the-run Treasury securities (such
as those in our database) generally increases in proximity of
auction dates. Hence, the inclusion of auction dummies in Eq.
(11) may control for spurious liquidity shocks
induced by time-varying specialness as well. Similarly, we include
day-of-the-week and annual effects to control for weekly
seasonality and temporal trends in the order flow and/or the
dispersion of beliefs. None of these effects are statistically
significant.
When we introduce a public signal in the model (Proposition 2),
market liquidity increases (Corollary 2), because the presence of a
trade-free source of information and more aggressive trading by the
speculators mitigates the adverse selection risk for the
market-makers. In our empirical analysis, this translates into
observing a negative difference (since we work with yields) between
(of Eq.
(1)) and
(of Eq.
(3)) in the following regression:
,
(12)
where is a dummy
variable equal to one if either the Nonfarm Payroll Employment
report (), any of
the influential
announcements listed in Section 3.2.2 (), or any of the announcements italicized in Table
2 () is released on
day and equal to zero
otherwise. As in Eq. (11), we set to assess the relevance of
permanent (i.e., information) versus temporary (i.e., inventory
control) effects of unanticipated order flow on yield changes. We
estimate Eq. (12) for each announcement type
, , or and either two-year, five-year, or ten-year bond
yield changes, and report the resulting estimates in Table 5.
Consistent with Table 4, the evidence in Table 5 indicates that,
even during announcement days, both the contemporaneous and
cumulative impact of unanticipated order flow on yield changes (
and
, respectively)
are negative and statistically significant (often at the
level). Hence, the
correlation between unanticipated order flow and yield changes
during announcement days does not appear to be driven by inventory
control effects. Table 5 also shows that, in most cases, the
difference between
and
is not
statistically significant (except for the five-year Treasury notes
when or ). Our model suggests that this
would be the case if the public news surprises in our sample
( in Eq. (3)) were noisy, since
.
Yet, our model (Corollary 3) also implies that noisy public signals
should have little or no impact on price changes (i.e.,
as
well). This interpretation, although intriguing, is not exhaustive
since in unreported analysis we find that seven of the
macroeconomic news releases in our sample (the ``influential''
ones) do have a statistically significant impact on day-to-day bond
yield changes between 1992 and 2000 (i.e., at least some
are
statistically significant).
An alternative interpretation of the statistically
indistinguishable estimates for and
in Table 5
is that the release of public macroeconomic signals may increase
investors' information heterogeneity (as argued in Kim and
Verrecchia, 1994, 1997), hence compensating the reduction in
adverse selection costs due to the availability of trade-free
sources of information (as in our model). This interpretation is
consistent with the evidence reported by Green (2004), who finds
that the estimated half-hour price impact of order flow in the
Treasury bond market is actually higher during the thirty-minute
interval immediately after an announcement than during the
thirty-minute interval immediately before the announcement or on
non-announcement days.
However, the analysis of both the estimated correlation between
bond yield changes and unanticipated net order flow and the average
cumulative impact of the latter on the former provides stronger
support for Corollary 2. Indeed, the adjusted of Eq. (12)
is always higher for non-announcement days than for announcement
days (i.e.,
in Table 5), with the sole
exception of five-year notes when . Furthermore, the impact of unanticipated order
flow in either the two-year or the ten-year Treasury notes on the
corresponding yield changes is permanent during non-announcement
days (statistically significant
in Table 5), but
only transitory during Nonfarm Payroll announcement days
(statistically insignificant
in Table 5). This
suggests that dealers rely more heavily on unanticipated order flow
to set bond prices during non-announcement days than on
announcement days, consistent with our model and the findings in
Brandt and Kavajecz (2004).
Overall, the evidence reported in Table 5 indicates (albeit not
as strongly as in Section 4.1) that the release of public signals
does not increase (and occasionally reduces) adverse selection
costs and does not impair (and occasionally improves) market
liquidity. Nonetheless, both the above discussion and the
comparative statics of Figure 1B also indicate that any such
liquidity gain may crucially depend on the quality of the public
signal (
) and on
the degree of information heterogeneity among market participants
(). We explore
these issues next, starting with the latter.
In this section, we analyze the effect of information
heterogeneity on market liquidity during announcement days. For
that purpose, we estimate the following representation of Eq.
(10):
(13)
,
where () is a dummy equal to one on
days with high (low) dispersion of beliefs (identified in Section
3.2.2) and , to
account for multiple signals arriving on the same day. We report
the resulting estimates in Table 6, and assess their significance
after correcting the standard errors for heteroskedasticity and
serial correlation.
According to our model (Remark 2), greater dispersion of beliefs
among speculators reduces market liquidity during announcement days
(i.e.,
in Eq. (13)) only when the public signal is noisy, since the
latter induces those heterogeneously informed speculators to use
cautiously their private signals, thus increasing adverse selection
risks for the market-makers. Vice versa, if the quality of the
public signal is high (
is low),
more heterogeneously informed speculators display their caution by
relying less on their private signals (and more on the public
signal) in their trading activity, thus lowering the perceived
adverse selections risk for the market-makers and improving market
liquidity (i.e.,
in Eq. (13)).
Table 6 reveals that the difference between
and
is
always negative and, in most cases, both economically and
statistically significant. For instance, when we measure dispersion
of beliefs using the Nonfarm Payroll announcement, a one standard
deviation shock to unanticipated order flow decreases ten-year bond
yields by basis
points during high dispersion days, while it increases bond yields by basis points during low
dispersion days. This evidence suggests that the dispersion of
beliefs among market participants has an important impact on
Treasury bond market liquidity, in the direction predicted by our
model, even in the presence of public signals of macroeconomic
fundamentals. This evidence is also (indirectly) consistent with
the conjecture made in Section 4.2 that public signal noise is
``sufficiently'' high in our sample. In Section 4.2.3 below, we
gauge more explicitly the potential role of public signal noise on
market liquidity.
We now turn to the impact of public signals on yield changes.
According to the extended model of Section 2.2, a public signal can
induce price (and yield) changes through two channels that, in the
spirit of Evans and Lyons (2003), we call direct (through
market-makers' belief updating process) and indirect (through
speculators' trades in the order flow). Yet, in the model, the
direct channel is always more important than the indirect one. The
evidence presented in Table 6 confirms this latter result: The
adjusted of the
fully specified regressions of Eq. (13), i.e.,
including both the unanticipated order flow and the public
signal(s), , is
between and
times bigger than
the adjusted of the
regressions estimated using only unanticipated order flow,
.
Many of the results in Section 4.2.1 above are generally weaker
in correspondence with the aggregate proxies for information
heterogeneity described in Eq. (7). In
particular, the relevance of public signals for bond yield changes
(i.e., the difference between and
in Table
6) is declining in , the
number of announcements used in the analysis. This may be explained
by a potentially mistaken classification of certain macroeconomic
releases as important public announcements. Indeed, both Eq.
(7) and the corresponding classification of
announcement days implicitly assume that all U.S. macroeconomic
news releases listed in Table 2 are equally important. However, the
literature (e.g., Fleming and Remolona, 1997) suggests that not all
public information may be equally relevant ex ante to participants
in the U.S. Treasury bond markets.
This can be due to several factors: The dispersion of beliefs
might be higher for certain announcements than for others, some
announcements may not reveal any useful information to price bonds
(i.e., the days in which they occur are effectively
non-announcement days), or some announcements might be noisier than
others. According to our model, the availability of a public signal
of higher (lower) quality implies a higher (lower) impact of order
flow on equilibrium price changes during announcement days. In this
section, we examine the effect of public signal noise directly.
Specifically, Remark 1 and Corollary 3 state that adverse
selection costs are higher and the price reaction to public
announcement surprises is lower when the public signal noise is
high. Intuitively, when the public signal is noisy, the
market-makers rely more heavily on the order flow than on the
public signal, thus requiring greater compensation for providing
liquidity. The evidence in Table 7 supports this claim. There we
report estimates of the following equation:
(14)
,
where () is a dummy variable equal to
one on announcement days with high (low) public signal noise,
defined in Section 3.2.3 as the absolute value of the difference
between the actual announcement minus the last revision of the
announcement being on the top (bottom) () percentile of their
empirical distribution, and equal to zero otherwise, and
. We limit our
analysis to Nonfarm Payroll, Industrial Production, and Capacity
Utilization news releases, since those are the only announcements
in our MMS database for which RTDS revision data is available.
Table 7 shows that the impact of these public signals on bond
yield changes is generally more significant when their noise is
lower (columns
and
).
Accordingly, we also find that (i) the coefficients measuring the
contemporaneous and permanent impact of unanticipated order flow on
bond yield changes are generally insignificant on announcement days
when the public signal noise is low (columns
and
in Table 7), and
(ii) the adjusted of
order flow alone is generally higher on days with high public
signal noise ()
than on days with low public signal noise (), i.e.,
; yet, these differences
are not large. These results suggest that the impact of the release
of macroeconomic data on the process of price formation in the U.S.
Treasury market is decreasing in the quality of the public signals,
as argued in the model of Section 2.2, albeit not importantly
so.
Finally, we amend all the regression models specified above to
account for the potential omitted variable biases described in
Section 4.1.1. Many of these biases are in fact more likely to
arise when analyzing the impact of both information heterogeneity
and public signal noise on market liquidity during announcement
days. For example, the number of informed market participants is
likely to be endogenously higher during announcement days
regardless of their dispersion of beliefs, if they expect the
Treasury bond market to be more liquid then (e.g., Chowdhry and
Nanda, 1991). In addition, as observed in Section 3.2.3, public
signal noise may stem not only from the signal's intrinsic quality
but also from fundamental uncertainty (
in our
model), which affects market liquidity directly as well
(Proposition 2). Yet, we find that all our conclusions are robust
to the inclusion of the same control variables employed for our
analysis of non-announcement days.
The main goal of this paper is to deepen our understanding of
the links between daily bond yield movements, news about
fundamentals, and order flow conditional on the investors'
dispersion of beliefs and the public signals' noise. To that end,
we theoretically identify and empirically document important news
and order flow effects in the U.S. Treasury bond market. To guide
our analysis, we develop a parsimonious model of speculative
trading in the presence of asymmetric sharing of information among
imperfectly competitive traders and a public signal of the terminal
value of the traded asset. We then test its equilibrium
implications by studying the relation between daily two-year,
five-year, and ten-year U.S. Treasury bond yield changes and
unanticipated order flow and real-time U.S. macroeconomic news
releases.
Our evidence suggests that announcement and order flow surprises
produce conditional, persistent mean jumps, i.e., that the process
of price formation in the bond market is linked to information
about fundamentals and agents' beliefs. The nature of this linkage
is sensitive to the intensity of investors' dispersion of beliefs
and the noise of the public announcement (albeit more weakly so).
In particular, and consistent with our model, unanticipated order
flow is more highly correlated with bond yield changes when the
dispersion of beliefs across informed traders is high and the
public announcement is noisy.
These findings allow us to draw several implications for future
research. Existing term structure models are notorious for their
poor out-of-sample forecast performance (e.g., Duffee, 2002).
Recently, Diebold and Li (2003) use a variation of the Nelson and
Siegel (1987) exponential components framework to forecast yield
curve movements at short and long horizons, finding encouraging
results at short horizons. We show here that U.S. Treasury bond
order flow is contemporaneously correlated with daily yield changes
and that the significance of this relation depends on the degree of
information heterogeneity about macroeconomic fundamentals among
market participants. In future work, we intend to include order
flow information to forecast the term structure.
Our results also indicate that day-to-day bond yield changes and
order flow are most sensitive to Nonfarm Payroll Employment
announcements. Nominal bond yields depend on future inflation and
future capital productivity, hence naturally react to employment
announcement surprises. Previous studies observe that Nonfarm
Payroll Employment is the first news release for a given month
(e.g., Fleming and Remolona, 1997; Andersen et al., 2003). However,
our analysis implicitly accounts for the timing of the
announcements, by focusing exclusively on their surprise content.
Hence, the importance of this announcement should depend on its
predictive power. Yet, to the best of our knowledge, no study has
shown that the Nonfarm Payroll Employment is the best predictor for
future activity and inflation out of the macroeconomic announcements in our
sample.20 Thus, we
suspect that its importance goes beyond its predictive power for
real activity. Morris and Shin (2002) provide an interesting
theoretical explanation for this overreaction to Nonfarm Payroll news. They argue
that bond yields will be most reactive to the types of news
emphasized by the press. In their model, this overreaction to news
is rational and reflects the coordination role of public
information. We look forward to future research that further
investigates this possibility.
Proof. [Proof of Proposition 1]As noted in Section
2.1.1, the proof is by construction. We start by guessing that
equilibrium and
are given by
and
, respectively, where
. Those
expressions and the definition of
imply that,
for the
speculator,
.
(A-1)
Using Eq. (A-1), the first order condition of the maximization of
the
speculator's expected profit
is given by
,
(A-2)
where
. The
second order condition is satisfied, since . For Eq. (A-2) to be
true, it must be that
(A-3)
.
(A-4)
The distributional assumptions of Section 2.1 imply that the order
flow
is normally
distributed with mean
and variance
. Since
,
it ensues that
.
(A-5)
According to the definition of a Bayesian-Nash equilibrium in this
economy (Section 2.1.1),
. Therefore, our
conjecture for
implies that
(A-6)
.
(A-7)
The expressions for ,
, , and in Proposition 1 must solve the
system made of Eqs. (A-3), (A-4), (A-6), and (A-7) to represent a
linear equilibrium. Defining
from Eq.
(A-3) and plugging it into Eq. (A-6) leads us to . Thus, it must be that
to satisfy Eq.
(A-3). We are left with the task of finding and . Solving Eq. (A-4) for
, we obtain
.
(A-8)
We then equate Eq. (A-8) to Eq. (A-7) to get
. This expression implies that
, where
is the unique square root of , since
and . Substituting the solution
for into Eq. (A-8)
leads to
.
Both and Eq.
(2) then ensue from the definitions of
and . Finally, we
observe that Proposition 1 is equivalent to a symmetric Cournot
equilibrium with
speculators. Therefore, the ``backward reaction mapping''
introduced by Novshek (1984) to find n-firm Cournot equilibria proves that, given any
linear pricing rule, the symmetric linear strategies of Eq. (2)
indeed represent the unique Bayesian Nash equilibrium of the
Bayesian game among speculators.
Proof. [Proof of Corollary 1]Market liquidity is
increasing in the number of speculators since, in correspondence
with the same , the
finite difference
only when speculators' information is heterogeneous (
and
such that ) and
always negative otherwise. Moreover,
. Market liquidity
is decreasing in the heterogeneity of speculators' since
is a concave function of with its maximum at
, i.e., when
. Indeed,
, implying that
for
(i.e., when
),
for
(i.e., when
), and
finally
for
(i.e., when ).
Proof. [Proof of Proposition 2]This proof is similar
to the proof of Proposition 1 above, hence we only sketch its
outline. Here we start by guessing that equilibrium and are given by
and
, respectively,
where . Since the
definition of
implies that
and
, those expressions lead to the following first order
condition of the maximization of
:
(A-9)
.
For Eq. (A-9) to be
true, it must be that
(A-10)
(A-11)
(A-12)
The distributional assumptions of Section 2.1 imply that
(A-13)
.
Since
in equilibrium,
our conjecture for
implies that
(A-14)
(A-15)
.
(A-16)
The expressions for ,
, , , ,
and in Proposition
2 must solve the system made of Eqs. (A-10), (A-11), (A-12),
(A-14), (A-15), and (A-16) to represent a linear equilibrium.
First, we solve Eq. (A-11) for and equate the ensuing expression to Eq. (A-15)
to get
, since
. This implies
that
, where
and
are the unique square roots of and
,
respectively, since and
. Substituting this
expression into Eq. (A-11) implies that
. Substituting the solution for into Eq. (A-16), plugging both
the resulting expression for and the solution for into Eq. (A-12), and solving
for leads to
. Replacing
and in Eq. (A-16) with their
solutions above and
and with their
definitions in Section 2.2 gives
. Finally,
defining
from Eq.
(A-14) and plugging it into Eq. (A-10) leads to and . Eq. (4)
then ensues from the definition of
.
Proof. [Proof of Corollary 2]To prove this statement,
we compare and
under all
possible scenarios for
and . When
,
since
. Along the same
lines, when and
(),
. When and
(),
since
implies that
. Finally, it can be shown that, when and
(
) or
(
),
where
and
. In addition,
, since
both variables converge to zero at the limit.
Proof. [Proof of Remark 1]We prove this remark under
all possible scenarios for and .
When ,
since
. When and (),
. When and
(),
since
. When and
(
) or
(
), it can be
shown that
yields
a positive function of
,
,
, and under the assumptions of Sections
2.1 and 2.2. Finally, in all of the above scenarios,
.
Proof. [Proof of Remark 2]We prove this remark by
first comparing the equilibrium
when
either
() or (
). If speculators'
signals are perfectly correlated, then
; if speculators' private signals are uncorrelated, then
. It then follows that it exists a unique
such that
if
, given by
. More
generally, it can be shown that it exists a unique
(i.e.,
) such that
for
(i.e.,
for
) and negative (i.e.,
)
otherwise. Hence,
is
negatively related to
for large
and
positively related to
for small
, since
and
,
while
is always
positively related to
for any
.
Proof. [Proof of Corollary 3]The statement of the
corollary follows from
for any and
. Furthermore,
.
[1] Admati, A., and Pfleiderer, P., 1988, A Theory of Intraday
Trading Patterns: Volume and Price Variability, Review of Financial Studies, 1, 3-40.
[2] Andersen, T., and Bollerslev, T., 1998, Deutsche Mark-Dollar
Volatility: Intraday Activity Patterns, Macroeconomic
Announcements, and Longer Run Dependencies, Journal of Finance, 53, 219-265.
[3] Andersen, T., Bollerslev, T., Diebold, F., and Labys, P., 2003,
Modeling and Forecasting Realized Volatility, Econometrica, 71, 579-626.
[4] Andersen, T., Bollerslev, T., Diebold, F., and Vega, C., 2003,
Micro Effects of Macro Announcements: Real-Time Price Discovery in
Foreign Exchange, American Economic
Review, 93, 38-62.
[5] Andersen, T., Bollerslev, T., Diebold, F., and Vega, C., 2004,
Real-Time Price Discovery in Stock, Bond, and Foreign Exchange
Markets, Working Paper, Northwestern University.
[6] Aruoba, B., 2004, Empirical Properties of Macroeconomic
Revisions, Working Paper, University of Pennsylvania.
[7] Back, K., Cao, H., and Willard, G., 2000, Imperfect Competition
Among Informed Traders, Journal of
Finance, 55, 2117-2155.
[8] Balduzzi, P., Elton, E., and Green, C., 2001, Economic News and
Bond Prices: Evidence From the U.S. Treasury Market, Journal of Financial and Quantitative Analysis, 36,
523-543.
[9] Bandi, F., and Russell, J., 2005, Separating Microstructure
Noise from Volatility, Journal of Financial
Economics, forthcoming.
[10] Berry, T., Howe, K., 1994, Public Information Arrival,
Journal of Finance, 49, 1331-1346.
[11] Boyd, J., Hu, J., and Jagannathan, R., 2005, The Stock Market's
Reaction to Unemployment News: Why Bad News Is Usually Good For
Stocks, Journal of Finance, 60,
649-672.
[12] Brandt, M., and Kavajecz, K., 2004, Price Discovery in the U.S.
Treasury Market: The Impact of Order Flow and Liquidity on the
Yield Curve, Journal of Finance, 59,
2623-2654.
[13] Brenner, M., Pasquariello, P., and Subrahmanyam, M., 2005,
Financial Markets and the Macro Economy, Working Paper, Ross School
of Business, University of Michigan.
[14] Chowdhry, B., and Nanda, V., 1991, Multimarket Trading and
Market Liquidity, Review of Financial
Studies, 4, 483-511.
[15] Croushore, D., and Stark, T., 1999, A Real-Time Data Set of
Macroeconomists: Does the Data Vintage Matter? Federal Reserve Bank
of Philadelphia Working Paper No. 99-21.
[16] Croushore, D., and Stark, T., 2001, A Real-Time Data Set of
Macroeconomists, Journal of
Econometrics, 105, 111-130.
[17] Diamond, D., and Verrecchia, R., 1991, Disclosure, Liquidity,
and the Cost of Capital, Journal of
Finance, 46, 1325-1359.
[18] Diebold, F., and Li, C., 2003, Forecasting the Term Structure
of Government Bond Yields, Journal of
Econometrics, forthcoming.
[19] Diether, K., Malloy, C., and Scherbina, A., 2002, Differences
of Opinion and the Cross Section of Stock Returns, Journal of Finance, 57, 2113-2141.
[20] Duffee, G., 2002, Term Premia and Interest Rate Forecasts in
Affine Models, Journal of Finance, 57,
405-443.
[21] Easley, D., Hvidkjaer, S., and O'Hara, M., 2002, Is Information
Risk a Determinant of Asset Returns? Journal
of Finance, 57, 2185-2221.
[22] Estrella, A., and Mishkin, F., 1998, Predicting U.S.
Recessions: Financial Variables as Leading Indicators, Review of Economics and Statistics, 80, 45-61.
[23] Evans, M., and Lyons, R., 2002, Order Flow and Exchange Rate
Dynamics, Journal of Political Economy,
110, 170-180.
[24] Evans, M., and Lyons, R., 2003, How is Macro News Transmitted
to Exchange Rates, NBER Working Paper No. 9433.
[25] Evans, M., and Lyons, R., 2004, Exchange Rate Fundamentals and
Order Flow, Working Paper, Haas School of Business, University of
California at Berkeley.
[26] Faust, J., Rogers, J., and Wright, J., 2003, News and Noise in
G-7 GDP Announcements, Journal of Money,
Credit and Banking, forthcoming.
[27] Fleming, M., 1997, The Round-the-Clock Market of U.S. Treasury
Securities, Economic Policy Review,
Federal Reserve Bank of New York, 3, 9-32.
[28] Fleming, M., 2003, Measuring Treasury Market Liquidity,
Economic Policy Review, Federal Reserve
Bank of New York, 83-108.
[29] Fleming, M., and Remolona, E., 1997, What Moves the Bond
Market? Economic Policy Review, Federal
Reserve Bank of New York, 31-50.
[30] Fleming, M., and Remolona, E., 1999, Price Formation and
Liquidity in the U.S. Treasury Market: The Response to Public
Information, Journal of Finance, 54,
1901-1915.
[31] Foster, F., and Viswanathan, S., 1990, A Theory of the Interday
Variations in Volume, Variance, and Trading Costs in Securities
Markets, Review of Financial Studies,
3, 593-624.
[32] Foster, F., and Viswanathan, S., 1993, The Effect of Public
Information and Competition on Trading Volume and Price Volatility,
Review of Financial Studies, 6,
23-56.
[33] Foster, F., and Viswanathan, S., 1996, Strategic Trading When
Agents Forecast the Forecasts of Others, Journal of Finance, 51, 1437-1478.
[34] Garman, Mark B., 1976, Market Microstructure, Journal of Financial Economics, 3, 257-275.
[35] Goldreich, D., Hanke, B., and Nath, P., 2005, The Price of
Future Liquidity: Time-Varying Liquidity in the U.S. Treasury
Market, Review of Finance,
forthcoming.
[36] Goodhart, C., and O'Hara, M., 1997, High Frequency Data in
Financial Markets: Issues and Applications, Journal of Empirical Finance, 4, 73-114.
[37] Green, C., 2004, Economic News and the Impact of Trading on
Bond Prices, Journal of Finance, 59,
1201-1233.
[38] Griffiths, M., Smith, B., Turnbull, D., and White, R., 2000,
The Costs and the Determinants of Order Aggressiveness,
Journal of Financial Economics, 56,
65-88.
[39] Hasbrouck, J., 1991, Measuring The Information Content of Stock
Trades, Journal of Finance, 46,
179-207.
[40] Hasbrouck, J., 2003, Intraday Price Formation in U.S. Equity
Index Markets, Journal of Finance, 58,
2375-2399.
[41] Hasbrouck, J., 2004, Economic and Statistical Perspectives on
the Dynamics of Trade in Securities Markets, Teaching Notes, Stern
School of Business, New York University.
[42] Kallberg, J., and Pasquariello, P., 2004, Time-Series and
Cross-Sectional Excess Comovement in Stock Indexes, Working Paper,
Ross School of Business at University of Michigan.
[43] Kavajecz, K., and Collins, S., 1995, Rationality of Preliminary
Money Stock Estimates, Review of Economics and
Statistics, 77, 32-41.
[44] Kim., O., and Verrecchia, R., 1994, Market Liquidity and Volume
around Earnings Announcements, Journal of
Accounting and Economics, 17, 41-67.
[45] Kim., O., and Verrecchia, R., 1997, Pre-Announcement and
Event-Period Private Information, Journal of
Accounting and Economics, 24, 395-419.
[46] Koski, J., and Michaely, R., 2000, Prices, Liquidity, and the
Information Content of Trades, Review of
Financial Studies, 13, 659-696.
[47] Kuttner, K., 2001, Monetary Policy Surprises and Interest
Rates: Evidence from the Fed Funds Futures Market, Journal of Monetary Economics, 47, 523-544.
[48] Kyle, A., 1985, Continuous Auctions and Insider Trading,
Econometrica, 53, 1315-1335.
[49] Lee, C., and Ready, M., 1991, Inferring Trade Direction from
Intraday Data, Journal of Finance, 46,
733-746.
[50] Lucas, R., 1982, Interest Rates and Currency Prices in a
Two-Country World, Journal of Monetary
Economics, 10, 335-359.
[51] Mankiw, N., Runkle, D., and Shapiro, M., 1984, Are Preliminary
Announcements of the Money Stock Rational Forecasts?, Journal of Monetary Economics, 14, 15-27.
[52] McKelvey, R., Page, T., 1990, Public and Private Information:
An Experimental Study of Information Pooling, Econometrica, 58, 1321-1339.
[53] Moulton, P., 2004, Relative Repo Specialness in U.S.
Treasuries, Journal of Fixed Income,
14, 40-47.
[54] Mork, K., 1987, Ain't Behavin': Forecast Errors and Measurement
Errors in Early GNP Estimates, Journal of
Business and Economic Statistics, 5, 165-175.
[55] Mork, K., 1990, Forecastable Money-Growth Revisions: A Closer
Look at the Data, Canadian Journal of
Economics, 23, 593-616.
[56] Morris, S., and Shin, H., 2002, Social Value of Public
Information, American Economic Review,
92, 1521-1534.
[57] Novshek, W., 1984, Finding All n-Firm Cournot Equilibria, International Economic Review, 25, 61-70.
[58] Ranaldo, A., 2004, Order Aggressiveness in Limit Order Book
Markets, Journal of Financial Markets,
7, 53-74.
[59] Zarnowitz, V., and Lambros, L., 1987, Consensus and Uncertainty
in Economic Prediction, Journal of Political
Economy, 95, 591-621.
In this table we report the mean,
standard deviation, maximum, minimum, and first-order
autocorrelation coefficient ( ) for the
following variables: Two-year, five-year and ten-year on-the-run
daily yields (in percentage, i.e., multiplied by 100), daily yield
changes (in basis points, i.e., multiplied by 10,000), number of
buys, number of sells, daily net order flow
(number of buys minus number of sells),
daily abnormal order flow, and the daily number of transactions.
The daily abnormal, or unanticipated order flow (defined in Section
4 as
) is
computed by aggregating over each day all
half-hour intraday residuals from the estimation of the linear
autoregressive model of Hasbrouck (1991) in Eq. (8). The data source is GovPX. Our sample period starts
in January 2, 1992 and ends in December 29, 2000, for a total of
2,246 daily observations.
Table 2. Macroeconomic News Announcements and Dispersion of Beliefs
In this table we report the number
of observations, source, and release time for the 25 U.S.
macroeconomic announcements in our sample. We also report summary
statistics for the corresponding standard deviation across
professional forecasts, our proxy for dispersion of beliefs among
market participants, whenever available. Specifically, we report
the mean, standard deviation, Spearman rank correlation with the
Nonfarm Payroll standard deviation (Payroll), and the first-order
autocorrelation coefficient () for each
series . A "*", "**", or "***" indicate the latter two measures'
significance at 10%, 5%, or 1% level, respectively. The release
time in the table, in Eastern Standard Time (EST, with Daylight
savings time starting on the first Sunday of April and ending on
the last Sunday of October), is constant throughout the sample
except in the following circumstances: In 01/94, the personal
income announcement time moved from 10:00 a.m. to 8:30 a.m.;
beginning in 01/96, consumer credit was released regularly at 3:00
p.m. while prior to this date, its release times varied; in 12/93,
the personal consumption expenditures announcement time moved from
10:00 a.m. to 8:30 a.m.; whenever GDP is released on the same day
as durable goods orders, the durable goods orders announcement is
moved to 10:00 a.m.; on 07/96 the durable goods orders announcement
was released at 9:00 a.m.; in 01/97, the business inventory
announcement was moved from 10:00 a.m. to 8:30 a.m.; beginning in
3/28/94, the fed funds rate was released regularly at 2:15 p.m.,
while prior to this date, the release times varied. The sources for
the MMS data are: Bureau of Labor Statistics (BLS), Bureau of the
Census (BC), Bureau of Economic Analysis (BEA), Federal Reserve
Board (FRB), National Association of Purchasing Managers (NAPM),
Conference Board (CB), Financial Management Office (FMO), and
Employment and Training Administration (ETA). The standard
deviation across professional forecasts of Capacity Utilization,
Personal Income, Consumer Credit, Personal Consumption
Expenditures, Business Inventories, Government Budget, and Target
Federal Funds Rate (announcements 7, 8, 9, 11, 15, 16, and 24) is
not available.
Table 2: Macroeconomic News Announcements and Dispersion of Beliefs: Quarterly Announcements
Quarterly Announcements: Obs.
Quarterly Announcements: Source
Quarterly Announcements: Time
Quarterly Announcements: Mean
Quarterly Announcements: Stdev.
Quarterly Announcements: (Payroll)
Quarterly Announcements:
(1)
1- GDP Advance
36
BEA
8:30
0.480
0.170
0.162*
-0.181
2- GDP Preliminary
34
BEA
8:30
0.313
0.178
0.014
0.192
3- GDP Final
35
BEA
8:30
0.128
0.051
0.083
0.250
Table 2: Macroeconomic News Announcements and Dispersion of Beliefs: Monthly Announcements
Monthly Announcements: Obs.
Monthly Announcements: Source
Monthly Announcements: Time
Monthly Announcements: Mean
Monthly Announcements: Stdev.
Monthly Announcements: (Payroll)
Monthly Announcements:
(1)
Real Activity: 4- Nonfarm Payroll
108
BLS
8:30
41.814
14.212
1.000
0.424***
Real Activity: 5- Retail Sales
108
BC
8:30
0.302
0.158
0.109
0.047
Real Activity: 6- Industrial
Production
107
FRB
9:15
0.183
0.135
0.236**
0.358***
Real Activity: 7- Capacity
Utilization
107
FRB
9:15
n.a.
n.a.
n.a.
n.a.
Real Activity: 8- Personal Income
105
BEA
10:00/8:30
n.a.
n.a.
n.a.
n.a.
Real Activity: 9- Consumer Credit
108
FRB
15:00
n.a.
n.a.
n.a.
n.a.
Consumption: 10- New Home Sales
106
BC
10:00
19.270
10.235
0.151
0.099
Consumption: 11- Pers. Cons. Exp.
107
BEA
10:00/8:30
n.a.
n.a.
n.a.
n.a.
Investment: 12- Durable Goods
Orders
106
BC
8:30/9:00/10:00
1.034
0.333
0.077
0.412***
Investment: 13- Factory Orders
105
BC
10:00
0.587
0.577
0.219**
0.015
Investment: 14- Construction
Spending
105
BC
10:00
0.499
0.253
0.176*
0.192***
Investment: 15- Business
Inventories
106
BC
10:00/8:30
n.a.
n.a.
n.a.
n.a.
Government Purchases: 16- Government
Budget
107
FMO
14:00
n.a.
n.a.
n.a.
n.a.
Net Exports: 17- Trade Balance
107
BEA
8:30
0.790
0.851
0.122
0.018
Prices: 18- Producer Price
Index
108
BLS
8:30
0.130
0.049
0.186*
0.287***
Prices: 19- Consumer Price
Index
107
BLS
8:30
0.086
0.051
0.146
0.221**
Forward-Looking: 20- Consumer Conf.
Index
106
CB
10:00
1.646
0.609
0.079
0.230**
Forward-Looking: 21- NAPM Index
107
NAPM
10:00
0.961
0.303
0.242**
0.382***
Forward-Looking: 22- Housing Starts
106
BC
8:30
0.045
0.038
0.160
0.246***
Forward-Looking: 23- Index of Leading
Ind.
108
CB
8:30
0.202
0.137
0.134
0.480***
Table 2: Macroeconomic News Announcements and Dispersion of Beliefs: Six-Week Announcements
Six-Week Announcements: Obs.
Six-Week Announcements: Source
Six-Week Announcements: Time
Six-Week Announcements: Mean
Six-Week Announcements: Stdev.
Six-Week Announcements: (Payroll)
Six-Week Announcements:
(1)
24- Target Fed Funds
Rate
71
FRB
14:15
n.a.
n.a.
n.a.
n.a.
Table 2: Macroeconomic News Announcements and Dispersion of Beliefs: Weekly Announcements
Weekly Announcements: Obs.
Weekly Announcements: Source
Weekly Announcements: Time
Weekly Announcements: Mean
Weekly Announcements: Stdev.
Weekly Announcements: (Payroll)
Weekly Announcements:
(1)
25- Initial Unemp.
Claims
459
ETA
8:30
7.973
5.440
0.069
0.578***
Table 3. Dispersion of Beliefs and Traders Aggressiveness
In this table we report estimates of
the following equation:
,
where is
the number of transactions on day t, () is a dummy
variable equal to one on days with high (low) dispersion of beliefs
defined as the forecasts' standard deviation to be on the top
(bottom) 70
(30
) percentile of its empirical distribution, and zero
otherwise. We measure the degree of heterogeneity of beliefs in a
given month using three different methodologies. First, we only use
the standard deviation of forecasts of the Nonfarm Payroll
Employment report. Second, we aggregate the standard deviation of
forecasts across seven ``influential'' macroeconomic announcements:
Nonfarm Payroll Employment, Retail Sales, New Home Sales, Consumer
Confidence Index, NAPM Index, Index of Leading Indicators, and
Initial Unemployment Claims. Third, we aggregate the forecasts'
standard deviation across all available macroeconomic news
announcements underlined in Table 2. is the adjusted . All
reported coefficient estimates for , , and
are statistically significant at the 1% level. A
``
'', ``
'', or ``
'' indicate significance of the
difference
at the 10%, 5%, or 1% level,
respectively, using the Newey-West standard errors reported below
each coefficient estimate (s.e.).
Table 3: Dispersion of Beliefs and Traders Aggressiveness: Two-Year
Announcement
Two-Year: b_{h}
Two-Year: b_{m}
Two-Year: b_{l}
Two-Year: b_ {h}-b_{l}
Two-Year:
Nonfarm Payroll
Employment
366.687
362.978
374.983
-8.296
86.05%
Nonfarm Payroll
Employment: s.e.
5.729
4.811
5.773
8.133
Influential
Announcements
317.836
372.472
409.360
-91.524***
86.80%
Influential
Announcements: s.e.
5.596
4.684
5.665
7.963
All Announcements
321.120
362.468
421.500
-100.38***
86.95%
All Announcements: s.e.
5.543
4.655
5.659
7.921
Table 3. Dispersion of Beliefs and Traders Aggressiveness: Five-Year
Announcement
Five-Year: b_{h}
Five-Year: b_{m}
Five-Year: b_{l}
Five-Year: b_ {h}-b_{l}
Five-Year:
Nonfarm Payroll
Employment
603.503
570.535
648.080
-44.576***
85.73%
Nonfarm Payroll
Employment: s.e.
9.475
7.958
9.541
13.447
Influential
Announcements
562.774
626.650
599.127
-36.353***
85.54%
Influential
Announcements: s.e.
9.617
8.044
9.721
13.675
All Announcements
534.212
607.237
657.696
-123.484***
85.91%
All Announcements: s.e.
9.459
7.937
9.642
13.507
Table 3. Dispersion of Beliefs and Traders Aggressiveness: Ten-Year
Announcement
Ten-Year: b_{h}
Ten-Year: b_{m}
Ten-Year: b_{l}
Ten-Year: b_ {h}-b_{l}
Ten-Year:
Nonfarm Payroll
Employment
530.563
505.908
570.922
-40.359***
85.56%
Nonfarm Payroll
Employment: s.e.
8.353
7.015
8.411
11.854
Influential
Announcements
496.024
554.288
527.157
-31.132***
85.55%
Influential
Announcements: s.e.
8.490
7.096
8.576
12.068
All Announcements
452.617
546.248
584.260
-131.643***
86.20%
All Announcements: s.e.
8.266
6.931
8.420
11.799
Table 4. Market Liquidity on Non-announcement Days
In this table we report estimates of
the following regression model (Eq. (11)):
,
where
is the daily change in bond yields,
is unanticipated order flow (defined in
Section 4),
( )
is a dummy variable equal to one on non-announcement days (defined
in Section 4.1) with high (low) dispersion of beliefs, defined as
the forecasts' standard deviation to be on the top (bottom)
70
(30
) percentile of its empirical distribution, and zero
otherwise, and . We measure the
dispersion of beliefs in each trading day of a given month using
three different methodologies. In the first, we only use the
standard deviation of professional forecasts of the Nonfarm Payroll
Employment report. In the second, we aggregate the standard
deviations of forecasts of seven ``influential'' macroeconomic
announcements (listed in Section 3.2.2). In the third, we aggregate
the standard deviations of forecasts across all macroeconomic news
announcements for which the standard deviation across professional
forecasters is available (underlined in Table 2).
(
) is the
adjusted
conditional on high (low) dispersion
days, while is the
adjusted
including all observations. A
``
'', ``
'', or ``
'' indicate significance at the 10%,
5%, or 1% level, respectively, using the Newey-West standard errors
reported below each coefficient estimate (s.e.).
Table 4: Market Liquidity on Non-announcement Days: Two-Year
Announcement
_{h0}
_{m0}
_{l0}
_{h0}-_{l0}
_{i=0}^{5}_{hi}
_{i=0}^{5} _{mi}
_{i=0}^{5}_{li}
Nonfarm Payroll
-0.213***
-0.182***
-0.121***
-0.092***
-0.161**
-0.182***
-0.072
28.54%
6.66%
21.69%
Nonfarm Payroll: s.e.
0.033
0.025
0.034
0.048
0.067
0.050
0.056
Influential
-0.140***
-0.108***
-0.080***
-0.060***
-0.106***
-0.096***
-0.049**
14.61%
10.65%
15.52%
Influential: s.e.
0.016
0.010
0.010
0.019
0.031
0.022
0.022
All
-0.122***
-0.093***
-0.098***
-0.024
-0.152***
-0.086***
-0.086***
15.46%
16.92%
15.83%
All: s.e.
0.017
0.012
0.014
0.022
0.032
0.024
0.027
Table 4: Market Liquidity on Non-announcement Days: Five-Year
Announcement
_{h0}
_{m0}
_{l0}
_{h0}-_{l0}
_{i=0}^{5}_{hi}
_{i=0}^{5} _{mi}
_{i=0}^{5}_{li}
Nonfarm Payroll
-0.210***
-0.153***
-0.085***
-0.125***
-0.285***
-0.136***
0.019
41.38%
9.65%
23.30%
Nonfarm Payroll: s.e.
0.029
0.022
0.027
0.040
0.078
0.049
0.062
Influential
-0.151***
-0.122***
-0.087***
-0.064***
-0.142***
-0.106***
-0.050**
19.14%
11.97%
20.31%
Influential: s.e.
0.014
0.010
0.010
0.018
0.036
0.022
0.025
All
-0.155***
-0.097***
-0.102***
-0.053***
-0.167***
-0.079***
-0.083***
21.37%
18.76%
19.40%
All: s.e.
0.017
0.012
0.013
0.022
0.041
0.027
0.029
Table 4: Market Liquidity on Non-announcement Days: Ten-Year
Announcement
_{h0}
_{m0}
_{l0}
_{h0}-_{l0}
_{i=0}^{5}_{hi}
_{i=0}^{5} _{mi}
_{i=0}^{5}_{li}
Nonfarm Payroll
-0.170***
-0.129***
-0.071
-0.099
-0.192**
-0.269***
-0.017
15.10%
1.02%
10.29%
Nonfarm Payroll: s.e.
0.043
0.032
0.043
0.061
0.093
0.058
0.079
Influential
-0.081***
-0.093***
-0.079***
-0.002
-0.075**
-0.109***
-0.053
2.83%
4.72%
6.05%
Influential: s.e.
0.018
0.013
0.013
0.025
0.035
0.027
0.042
All
-0.075***
-0.086***
-0.071***
-0.004
-0.109**
-0.119***
-0.097**
3.82%
4.43%
6.16%
All: s.e.
0.023
0.017
0.019
0.029
0.053
0.033
0.038
Table 5. Market Liquidity in Announcement and Non-announcement Days
In this table we report estimates of
the following regression model (Eq. (12)):
,
where
is the daily change in bond yields,
is unanticipated order flow (defined in
Section 4),
is a dummy variable equal to one if
either the Nonfarm Payroll Employment report (), any
of the seven ``influential'' announcements listed in Section 3.2.2
(), or any of the
announcements for which the standard deviation across professional
forecasters is available (, underlined in Table
2) is released on day and equal to zero
otherwise, and . (
) is the
adjusted
from the estimation of Eq. (12) over just non-announcement (announcement) days,
while
is the adjusted from
the estimation of the fully specified regression above. A
``
'', ``
'', or ``
'' indicate significance at the 10%,
5%, or 1% level, respectively, using the Newey-West standard errors
reported below each coefficient estimate (s.e.).
Table 5: Market Liquidity in Announcement and Non-announcement Days: Two-Year
Announcement
_{0}
_{p0}
_{0}-_{p0}
_{i=0}^{5}_{i}
_{i=0}^{5}_{pi}
Nonfarm Payroll
-0.108***
-0.087***
-0.021
-0.131***
-0.013
15.31%
6.47%
14.72%
Nonfarm Payroll: s.e.
0.021
0.027
0.034
0.041
0.064
Influential
-0.103***
-0.112***
0.009
-0.075***
-0.059***
15.34%
12.29%
13.98%
Influential: s.e.
0.008
0.008
0.011
0.016
0.019
All
-0.102***
-0.109***
0.007
-0.096***
-0.059***
16.00%
13.24%
13.99%
All: s.e.
0.011
0.006
0.013
0.023
0.015
Table 5: Market Liquidity in Announcement and Non-announcement Days: Five-Year
Announcement
_{0}
_{p0}
_{0}-_{p0}
_{i=0}^{5}_{i}
_{i=0}^{5}_{pi}
Nonfarm Payroll
-0.124***
-0.168***
0.044**
-0.121***
-0.242***
21.03%
19.61%
21.37%
Nonfarm Payroll: s.e.
0.017
0.025
0.019
0.043
0.062
Influential
-0.117***
-0.137***
0.020*
-0.095***
-0.137***
19.88%
20.88%
20.76%
Influential: s.e.
0.007
0.008
0.011
0.017
0.020
All
-0.115***
-0.131***
0.016
-0.107***
-0.115***
20.29%
20.48%
20.70%
All: s.e.
0.011
0.006
0.012
0.024
0.016
Table 5: Market Liquidity in Announcement and Non-announcement Days: Ten-Year
Announcement
_{0}
_{p0}
_{0}-_{p0}
_{i=0}^{5}_{i}
_{i=0}^{5}_{pi}
Nonfarm Payroll
-0.087***
-0.053*
-0.034
-0.181***
-0.020
6.74%
3.59%
7.07%
s.e.
0.025
0.030
0.048
0.049
0.088
Influential
-0.086***
-0.086***
0.000
-0.083***
-0.086***
6.73%
5.73%
6.52%
Influential: s.e.
0.010
0.011
0.015
0.021
0.026
All
-0.077***
-0.090***
0.013
-0.103***
-0.076***
7.08%
5.99%
6.49%
All: s.e.
0.014
0.009
0.017
0.030
0.019
Table 6. Public Signals and Market Liquidity
In this table we report estimates of
the following regression model (Eq. (14)):
,
where
is the daily change in bond yields,
is unanticipated order flow (defined in
Section 4),
( )
is a dummy variable equal to one on days with high (low) dispersion
of beliefs (defined in Section 3.2.2), and zero otherwise,
and . We estimate the above
equation using only announcement days (defined in Section 4.2). The
coefficient
is the estimated price impact of the Nonfarm Payroll
announcement () or the average
estimated impact across either the ``influential''
() or all (
) macroeconomic announcements for which the standard
deviation across professional forecasters is available (i.e., those
underlined in Table 2).
(
) is the
adjusted
conditional on high (low) dispersion
days and only using
,
is the unconditional adjusted
using only
,
and
is the adjusted of
the fully specified regression above. A `` '', ``
'', or ``
'' indicate significance at the 10%,
5%, or 1% level, respectively, using the Newey-West standard errors
reported below each coefficient estimate (s.e.).
Table 6. Public Signals and Market Liquidity: Two-Year
Announcement
_{ph0}
_{pm0}
_{pl0}
_{ph0} -_{pl0}
_{i=0}^{5}_{phi}
_{i=0}^{5}_{pmi}
_{i=0}^{5}_{pli}
Nonfarm Pay.
6.279***
-0.141**
-0.117**
-0.116
-0.025*
0.087
-0.301***
-0.055
7.81%
-8.04%
8.51%
40.87%
Nonfarm Pay: s.e.
0.883
0.060
0.047
0.092
0.014
0.151
0.113
0.176
Influential
2.805***
-0.179***
-0.08***
-0.106***
-0.073***
-0.152***
-0.063**
-0.040
15.86%
9.57%
13.54%
30.27%
Influential: s.e.
0.322
0.019
0.012
0.016
0.024
0.047
0.031
0.036
All
1.490***
-0.165***
-0.092***
-0.093***
-0.072***
-0.130***
-0.030
-0.055**
16.65%
14.50%
13.79%
26.70%
All: s.e.
0.196
0.015
0.010
0.012
0.020
0.034
0.026
0.027
Table 6. Public Signals and Market Liquidity: Five Year
Announcement
_{ph0}
_{pm0}
_{pl0}
_{ph0} -_{pl0}
_{i=0}^{5}_{phi}
_{i=0}^{5}_{pmi}
_{i=0}^{5}_{pli}
Nonfarm Pay.
6.028***
-0.220***
-0.179***
-0.117**
-0.103***
-0.209
-0.253***
-0.087
11.45%
-4.37%
14.46%
46.68%
Nonfarm Pay: s.e.
0.855
0.065
0.042
0.049
0.034
0.161
0.097
0.138
Influential
2.670***
-0.184***
-0.111***
-0.124***
-0.060***
-0.202***
-0.129***
-0.083**
24.16%
15.27%
21.45%
34.00%
Influential: s.e.
0.318
0.017
0.012
0.015
0.023
0.048
0.030
0.038
All
1.259***
-0.183***
-0.111***
-0.124***
-0.059***
-0.192***
-0.100***
-0.083***
23.94%
24.78%
21.83%
31.27%
All: s.e.
0.194
0.014
0.010
0.012
0.019
0.039
0.025
0.027
Table 6. Public Signals and Market Liquidity: Ten-Year
Announcement
_{ph0}
_{pm0}
_{pl0}
_{ph0} -_{pl0}
_{i=0}^{5}_{phi}
_{i=0}^{5}_{pmi}
_{i=0}^{5}_{pli}
Nonfarm Pay.
4.195***
-0.239**
-0.017
0.076
-0.315**
-0.157
0.040
0.109
-10.27%
-3.53%
0.26%
22.81%
Nonfarm Pay: s.e.
0.815
0.097
0.081
0.105
0.143
0.206
0.178
0.224
Influential
2.445***
-0.103***
-0.068***
-0.072***
-0.031
-0.130**
-0.064*
-0.038
3.55%
5.33%
5.58%
16.95%
Influential: s.e.
0.329
0.024
0.018
0.023
0.033
0.062
0.039
0.057
All
1.329***
-0.117***
-0.079***
-0.068***
-0.049**
-0.120**
-0.070**
-0.014
4.26%
6.71%
6.31%
15.04%
All: s.e.
0.199
0.021
0.014
0.018
0.021
0.051
0.032
0.037
Table 7. Public Signal Noise and Market Liquidity
In this table we report estimates of
the following regression model (Eq. (14)):
,
where
is the daily change in bond yields,
is the unanticipated order flow
(defined in Section 4), (
) is a dummy variable equal to one on days with high
(low) public signal noise (defined in Section 3.2.3 using news
revisions), and zero otherwise, and . We
estimate Eq. (14) just for Nonfarm Payroll,
Industrial Production, and Capacity Utilization, since no other
revisions (from RTDS) are available.
is the adjusted using
public news as the only explanatory variable.
(
) is the
adjusted
of using contemporaneous order flow
alone in high (low) public signal noise days. is the adjusted of
the fully specified model above. A `` '', ``
'', or ``
'' indicate significance at the 10%,
5%, or 1% level, respectively, using the Newey-West standard errors
reported below each coefficient estimate (s.e.).
Table 7. Public Signal Noise and Market Liquidity: Two-Year
Ann.
_{snh}
_{snm}
_ {snl}
_{pnh0}
_{pnm0}
_{pnl0}
_{i=0}^{5}_{pnhi}
_{i=0}^{5}_{pnmi}
_{i=0}^{5}_{pnli}
Non. P.
6.861***
7.569***
5.205***
-0.132*
-0.164***
-0.108*
-0.105
-0.378***
0.041
32.67%
39.24%
39.00%
46.88%
Non. P: s.e.
1.678
1.288
1.609
0.067
0.050
0.062
0.191
0.140
0.152
In. P.
1.672*
1.468
0.820
-0.075*
-0.106***
-0.130**
0.037
0.154*
-0.008
2.38%
10.93%
9.50%
23.40%
In. P: s.e.
0.916
1.035
1.337
0.043
0.034
0.058
0.092
0.090
0.116
Cap. U.
1.643
1.399
2.123
-0.072
-0.092***
-0.097
0.113
0.075
0.052
9.01%
18.20%
18.80%
25.73%
Cap. U: s.e.
1.011
0.866
1.521
0.045
0.030
0.069
0.105
0.070
0.114
Table 7. Public Signal Noise and Market Liquidity: Five-Year
Ann.
_{snh}
_{snm}
_ {snl}
_{pnh0}
_{pnm0}
_{pnl0}
_{i=0}^{5}_{pnhi}
_{i=0}^{5}_{pnmi}
_{i=0}^{5}_{pnli}
Non. P.
5.959***
5.513***
4.267***
-0.196***
-0.212***
-0.210***
-0.411**
-0.343***
-0.290***
26.77%
39.16%
38.21%
51.06%
Non. P: s.e.
1.580
1.202
1.546
0.052
0.053
0.052
0.158
0.131
0.111
Ind P.
1.251
0.233
0.916
-0.099**
-0.157***
-0.122*
-0.035
0.048
-0.096
2.44%
22.80%
20.82%
23.05%
In. P: s.e.
0.963
1.125
1.597
0.043
0.034
0.067
0.113
0.094
0.138
Cap. U.
1.466
0.152
1.956
-0.128**
-0.152***
-0.085
-0.053
0.065
-0.135
7.66%
27.80%
24.85%
28.06%
Cap. U: s.e.
0.904
0.962
1.588
0.053
0.031
0.063
0.106
0.085
0.163
Table 7. Public Signal Noise and Market Liquidity: Ten-Year
Ann.
_{snh}
_{snm}
_ {snl}
_{pnh0}
_{pnm0}
_{pnl0}
_{i=0}^{5}_{pnhi}
_{i=0}^{5}_{pnmi}
_{i=0}^{5}_{pnli}
Non. P.
3.702**
3.165**
4.225**
-0.139
-0.078
0.036
-0.566**
0.267
0.116
20.88%
21.29%
19.84%
27.62%
Non. P: s.e.
1.648
1.209
1.615
0.101
0.087
0.085
0.220
0.182
0.183
Ind. P.
0.281
2.025*
1.940
0.059
-0.117
-0.131*
0.020
-0.071
0.036
3.70%
5.47%
7.69%
-0.96%
In. P: s.e.
0.991
1.084
1.538
0.077
0.073
0.078
0.142
0.11
0.143
Cap. U.
1.365
1.174
2.456*
-0.013
-0.057
-0.148**
0.013
-0.022
-0.09
8.15%
7.44%
10.64%
6.03%
Cap. U: s.e.
0.994
1.008
1.443
0.089
0.058
0.074
0.137
0.103
0.135
Figure 1. Equilibrium without and with a Public Signal
In this figure we plot the market
liquidity parameter defined in Proposition 1,
in Figure 1A, and the difference between the sensitivity of the equilibrium price to the order flow in the absence and in the presence of a public signal
in Figure 1B, as a function of the degree of
correlation of the speculators' signals, , in
the presence of M = 1, 2, or 4 speculators, when
. According to Proposition 1,
, while
in Proposition 2, where
and
. Since
,
, and
, the range of correlations
compatible with a positive definite is obtained by varying the
parameter
within the interval [0, 10] when M = 2, and the interval [0, 5] when M = 4.
Figure 1A: Equilibrium without and with a Public Signal: (lambda)
Description of Figure 1A: Equilibrium without and with a Public Signal: (lambda)
In this figure we plot the market liquidity parameter defined in
Proposition 1,
. We construct a simple numerical example by setting
.
We then vary the range of signal correlations (from very highly negative to
very highly positive) when the number of informed traders,
, , and . Multiple, perfectly heterogeneously informed
speculators ()
collectively trade as cautiously as a monopolist speculator. Under
these circumstances, adverse selection is at its highest, and
market liquidity at its lowest (
). A greater
number of competing speculators improves market depth, but
significantly so only if accompanied by more correlated private
signals. However, ceteris paribus, the improvement in market
liquidity is more pronounced (and informed trading less cautious)
when speculators' private signals are negatively correlated. When
, each
speculator expects her competitors' trades to be negatively
correlated to her own (pushing against her signal), hence trading on it to be
more profitable.
More detail. Figure 1A plots lambda on the vertical axis with range [0.2, 0.55]
and gamma on the horizontal axis with range [-1,+1]. For M=1, lambda is constant at 0.5 for
all values of gamma. For M=2, lambda starts at about 0.28 for gamma=-0.9, with lambda
increasing rapidly to 0.5 at gamma=0, then dropping off slowly to about 0.48 at gamma=1.
For M=4, lambda starts at about 0.23 for gamma=-0.3, with lambda
increasing rapidly to 0.5 at gamma=0, then dropping off to about 0.4 at gamma=1.
Figure 1B: Equilibrium without and with a Public Signal: (lambda - lambda_{p})
Description of Figure 1B: Equilibrium without and with a Public Signal: (lambda - lambda_{p})
In Figure 1B we plot the difference between the sensitivity of
the equilibrium price to the order flow in the absence and in the
presence of a public signal ,
, as
a function of the degree of correlation of the speculators'
signals, , in the
presence of ,
, or speculators, when
and the public
signal's noise
. The
increase in market depth is greater when is negative and the number of
speculators () is high. In
those circumstances, the availability of a public signal reinforces
speculators' existing incentives to place market orders on their
private signals
more aggressively. However, greater
,
ceteris paribus, increases
, since the
poorer quality of
(lower information-to-noise ratio
) induces the
market makers to rely more heavily on
to set
market-clearing prices, hence the speculators to trade less
aggressively.
More detail. Figure 1B plots lambda-lambda_p on the vertical axis with range [0.14, 0.26]
and gamma on the horizontal axis with range [-1,+1]. For M=1, lambda-lambda_p is constant at 0.2 for
all values of gamma. For M=2, lambda-lambda_p starts at about 0.17 for gamma=-0.9, with lambda-lambda_p
increasing rapidly to about 0.24 at gamma about -0.6, then dropping off slowly to about 0.19 at gamma=0.75,
and increasing slightly to gamma=1.
For M=4, lambda-lambda_p starts at about 0.15 for gamma=-0.3, with lambda-lambda_p
increasing rapidly to about 0.25 at gamma about -0.2, then dropping off to about 0.15 at gamma=0.75,
and increasing slightly to gamma=1.
Footnotes
1. According to Goodhart and O'Hara
(1997, p. 102), ``one puzzle in the study of asset markets, either
nationally or internationally, is that so little of the movements
in such markets can be ascribed to identified public `news'. In
domestic (equity) markets this finding is often attributed to
private information being revealed.'' This friction has been
recently studied by Brandt and Kavajecz (2004) and Green (2004) in
the U.S. Treasury bond market, by Andersen and Bollerslev (1998)
and Evans and Lyons (2002, 2003, 2004) in the foreign exchange
market, by Berry and Howe (1994) in the U.S. stock market, and by
Brenner, Pasquariello, and Subrahmanyam (2005) in the U.S.
corporate bond market, among others. Return to text
2. Foster and Viswanathan (1996) and
Back, Cao, and Willard (2000) extend Kyle (1985) to analyze the
impact of competition among heterogeneously informed traders on
market liquidity and price volatility in discrete-time and
continuous-time models of intraday trading, respectively. Foster
and Viswanathan (1993) show that, when the beliefs of perfectly
informed traders are represented by elliptically contoured
distributions, price volatility and trading volume depend on the
surprise component of public information. Yet, neither model's
equilibrium is in closed-form, except the (analytically
intractable) inverse incomplete gamma function in Back et al.
(2000). Hence, their implications are sensitive to the chosen
calibration parameters. Further, neither model, by its dynamic
nature, generates unambiguous comparative statics for the impact of
information heterogeneity or the availability of public information
on market liquidity. Finally, neither model can be easily
generalized to allow for both a public signal of the traded asset's
payoff and less than perfectly correlated private
information. Return to text
3. For instance, heterogeneously
informed investors may not trade immediately after public news are
released but instead wait to preserve (and exploit) their
informational advantage as long (and as much) as possible, as in
Foster and Viswanathan (1996). Return to
text
4. The assumption that the total
amount of information available to speculators is fixed (
) implies that
and
, hence
. Further, the absolute bound to the largest negative
private signal correlation compatible with a positive definite
,
, is a decreasing
function of . Return to text
5. This contrasts with the numerical
examples of the dynamics of market depth reported in Foster and
Viswanathan (1996, Figure 1C) and Back et al. (2000, Figure
3A). Return to text
6. Admati and Pfleiderer (1988) and
Foster and Viswanathan (1990) consider dynamic models of intraday
trading in which the private information of either perfectly
competitive insiders or a monopolistic insider is either fully or
partially revealed by the end of the trading period. McKelvey and
Page (1990) provide experimental evidence that individuals make
inferences from publicly available information using Bayesian
updating. Diamond and Verrecchia (1991) argue that the disclosure
of public information may reduce the volatility of the order flow,
leading some market makers to exit. Kim and Verrecchia (1994) show
that, in the absence of better informed agents but in the presence
of better information processors with homogeneous priors, the
arrival of a public signal leads to greater information asymmetry
and lower market liquidity. Return to
text
7. Specifically, it can be shown
that the one-shot equilibrium in Foster and Viswanathan (1993,
Proposition 1) is a special case of our Proposition 2 when private
signal correlations
for any ECC. Return to text
8. In our sample period (1992 to
2000), the major interdealer brokers in the U.S. Treasury market
are Cantor Fitzgerald Inc., Garban Ltd., Hilliard Farber & Co.
Inc., Liberty Brokerage Inc., RMJ Securities Corp., and Tullet and
Tokyo Securities Inc. Cantor Fitzgerald's share of the interdealer
Treasury market is about over our sample period (Goldreich et al., 2005).
Nevertheless, Cantor Fitzgerald is a dominant player only in the
``long end'' of the Treasury yield curve, which we do not study in
depth in this paper. Return to
text
9. Andersen and Bollerslev (1998),
among others, refer to the Nonfarm Payroll report as the ``king''
of announcements because of the significant sensitivity of most
asset markets to its release. Return to
text
10. In unreported analysis, we show
that these announcements represent the most important information
events in the U.S. Treasury Market, i.e., the only ones having a
statistically significant impact on day-to-day bond yield changes,
consistent with Fleming and Remolona (1997), among
others. Return to text
11. See Croushore and Stark (1999,
2001) for details of this database and examples of empirical
applications. The database is publicly available on the internet at
http://www.phil.frb.org/econ/forecast/reaindex.html. Return to text
12. Much of this evidence stems from
the analysis of either GDP or the RTDS variables listed above. The
evidence is more controversial for money stock announcements. For
instance, Mankiw, Runkle, and Shapiro (1984) and Mork (1990) find
that the preliminary growth rates of several Federal Reserve's
money aggregates are not efficient predictors of the growth rates
of finally-revised data. Yet, according to Kavajecz and Collins
(1995), the bias in preliminary monetary data may be attributed
either to the specific seasonal adjustment procedure used by the
Federal Reserve or to a different temporal aggregation than for
finally-revised, not-seasonally adjusted data. Monetary aggregates
are not included in our database. Return
to text
13. Indeed, the distributional
assumptions in Section 2.1 imply that
in both Propositions 1
and 2. Return to text
14. Our results are also robust to
different specifications of Eq. (8). For
example, we sample bond yields each time there is a transaction,
rather than at thirty-minute intervals. We also sample bond yields
at an `` optimal'' frequency determined according to the procedure
of Bandi and Russell (2005). The evidence presented below is
qualitatively and quantitatively similar to that obtained using
these alternative sampling procedures, as well as using the
aggregate raw (rather than unanticipated) order flow,
. The
robustness of our results reflects the fact that aggregate
unanticipated order flow,
, is
very closely related to
. Indeed,
regardless of the selected specification, the resulting
from Eq. (8) are lower than . Return to text
15. Nonetheless, the inference that
follows is robust to smaller or bigger values for . Return
to text
16. We estimate realized volatility
applying the procedure of Andersen, Bollerslev, Diebold, and Labys
(2003) to yield mid-quotes sampled at an ``optimal'' frequency
determined according to Bandi and Russel (2005). Return to text
17. Presumably, the number of
informed traders might increase as the public announcement date
approaches. We do not include this product term when measuring
dispersion of beliefs only with forecasts of Nonfarm Payroll
announcements (i.e., ), since then we only use the Fridays before
the announcement dates to control for potential day-of-the-week
effects. Return to text
18. The resulting adjusted
from the
introduction of this cross term in Eq. (8) for
five-year bond yield differentials increases from , , and (i.e., of Table 4) to , , and when measuring the dispersion
of beliefs with the standard deviation of professional forecasts of
Nonfarm Payroll (),
``influential'' (),
and all available macroeconomic news announcements (), respectively. Return to text
19. The history of auction dates we
use in the analysis is available on the U.S. Treasury website, at
http://www.publicdebt.treas.gov/of/ofaicqry.htm. Return to text
20. The NBER's Business Cycle Dating
Committee mentions that no single macroeconomic variable is the
most important predictor of recessions and expansions (e.g., see
http://www.nber.org/cycles/recessions.html). The committee takes
into account real GDP, real income, employment, industrial
production, and wholesale and retail sales to determine whether the
U.S. is in a recession or in an expansion. When running a horse
race between macroeconomic variables and financial variables to
predict the business cycle, Estrella and Mishkin (1998) do not even
consider Nonfarm Payroll announcements. Return to text


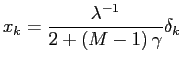 ,
,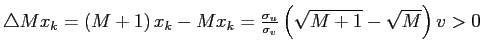
![$ \alpha=\frac{M\sigma_{v}^{2}\left( \sigma_{p}^{2}-\sigma_{v} ^{2}\right) }{\sigma_{p}^{2}\left[ \sigma_{v}^{2}+M\left( M-1\right) \chi\right] -\sigma_{v}^{4}}>0$](img92.gif)
![$ \beta=-\frac{\sigma_{v}^{4}\left( \sigma_{p}^{2}-\sigma_{v}^{2}\right) }{\sigma_{p}^{2}\left\{ \left[ \sigma_{v}^{2}+M\left( M-1\right) \chi\right] -\sigma_{v}^{4}\right\} } <0$](img93.gif)
 ,
,![$ \lambda_{p}=\frac{\alpha^{\frac{1}{2}}\sigma_{v}\left( \sigma_{p} ^{2}-\sigma_{v}^{2}\right) ^{\frac{1}{2}}}{\sigma_{u}\sigma_{p}\left[ 2+\left( M-1\right) \gamma_{p}\right] }>0$](img98.gif)
![$\displaystyle p_{1}=\frac{\alpha}{2+\left( M-1\right) \gamma_{p}}v+\lambda_{p}u+\left[ \lambda_{s}+\frac{M\beta}{2+\left( M-1\right) \gamma_{p}}\right] S_{p}$](img102.gif) .
. ,
, ,
,
 ,
, ,
,
 ,
,
 ,
, .
. .
.![$\displaystyle A_{1}=\frac{\psi}{B_{1}\left[ 2+\left( M-1\right) \gamma\right] }$](img267.gif) .
.![$ A_{1}=\frac{\sigma_{v}\psi^{\frac{1}{2}}}{\sigma_{u}\left[ 2+\left( M-1\right) \gamma\right] }$](img269.gif)

![$ \Delta\lambda=\lambda\left( \text{at }M+1\right) -\lambda\left( \text{at }M\right) =\frac{\sigma_{v}^{2}\sqrt{M+1}\left[ \sigma_{v} ^{2}+\left( M+1\right) M\chi\right] ^{\frac{1}{2}}}{\sigma_{u}\left[ \sigma_{v}^{2}\left( M+2\right) +\left( M+1\right) M\chi\right] } -\frac{\sigma_{v}^{2}\sqrt{M}\left[ \sigma_{v}^{2}+M\left( M-1\right) \chi\right] ^{\frac{1}{2}}}{\sigma_{u}\left[ \sigma_{v}^{2}\left( M+1\right) +M\left( M-1\right) \chi\right] }=0$](img276.gif)
![$ \lambda=\frac{\sigma_{v} ^{2}\sqrt{M}\left[ \sigma_{v}^{2}+M\left( M-1\right) \chi\right] ^{\frac{1}{2}}}{\sigma_{u}\left[ \sigma_{v}^{2}\left( M+1\right) +M\left( M-1\right) \chi\right] }$](img280.gif)
![$ \frac{\partial\lambda}{\partial\chi}=-\frac{M^{\frac{3}{2}}\left( M-1\right) ^{2}\sigma_{v}^{2}\left( M\chi-\sigma_{v}^{2}\right) } {2\sigma_{u}\left[ \sigma_{v}^{2}+M\left( M-1\right) \chi\right] ^{\frac{1}{2}}\left[ \sigma_{v}^{2}\left( M+1\right) +M\left( M-1\right) \chi\right] ^{2}}$](img281.gif)
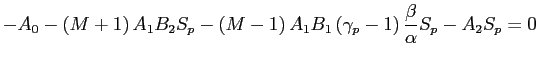 .
.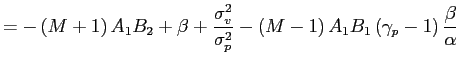
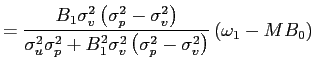
![$\displaystyle +\frac{\sigma_{v}^{2}\left[ \sigma_{u}^{2}-MB_{1}B_{2}\left( \sigma _{p}^{2}-\sigma_{v}^{2}\right) \right] }{\sigma_{u}^{2}\sigma_{p}^{2} +B_{1}^{2}\sigma_{v}^{2}\left( \sigma_{p}^{2}-\sigma_{v}^{2}\right) } S_{p}$](img300.gif) .
.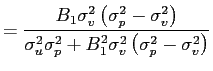
![$\displaystyle =\frac{\sigma_{v}^{2}\left[ \sigma_{u}^{2}-MB_{1}B_{2}\left( \sigma_{p}^{2}-\sigma_{v}^{2}\right) \right] }{\sigma_{u}^{2}\sigma_{p} ^{2}+B_{1}^{2}\sigma_{v}^{2}\left( \sigma_{p}^{2}-\sigma_{v}^{2}\right) }$](img302.gif) .
.![$ A_{1}^{2}=\frac{\alpha\sigma_{v}^{2}\left( \sigma_{p} ^{2}-\sigma_{v}^{2}\right) }{\sigma_{u}^{2}\sigma_{p}^{2}\left[ 2+\left( M-1\right) \gamma_{p}\right] ^{2}}$](img305.gif)
![$ A_{1}=\frac{\alpha^{\frac{1}{2}}\sigma _{v}\left( \sigma_{p}^{2}-\sigma_{v}^{2}\right) ^{\frac{1}{2}}}{\sigma _{u}\sigma_{p}\left[ 2+\left( M-1\right) \gamma_{p}\right] }>0$](img307.gif)

![$ B_{1}=\alpha\sigma_{u}\sigma_{p}\left[ \alpha\sigma_{v} ^{2}\left( \sigma_{p}^{2}-\sigma_{v}^{2}\right) \right] ^{-\frac{1}{2}}$](img312.gif)
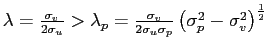
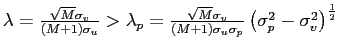
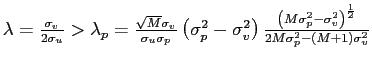
![$ \lambda=\frac{\sigma_{v} ^{2}\sqrt{M}\left[ \sigma_{v}^{2}+M\left( M-1\right) \chi\right] ^{\frac{1}{2}}}{\sigma_{u}\left[ \sigma_{v}^{2}\left( M+1\right) +M\left( M-1\right) \chi\right] }>\lambda_{p}=\frac{\alpha^{\frac{1}{2}}\sigma _{v}\left( \sigma_{p}^{2}-\sigma_{v}^{2}\right) ^{\frac{1}{2}}}{\sigma _{u}\sigma_{p}\left[ 2+\left( M-1\right) \gamma_{p}\right] }$](img320.gif)
![$ \gamma_{p}=\frac{\sigma_{p}^{2}\left( \sigma_{v}^{2}-M\chi\right) -\sigma_{v}^{4}}{\sigma_{p}^{2}\left[ \sigma_{v}^{2}+M\left( M-1\right) \chi\right] -\sigma_{v}^{4}}$](img321.gif)
![$ \alpha=\frac{M\sigma_{v}^{2}\left( \sigma_{p}^{2}-\sigma_{v}^{2}\right) }{\sigma_{p}^{2}\left[ \sigma_{v} ^{2}+M\left( M-1\right) \chi\right] -\sigma_{v}^{4}}$](img322.gif)
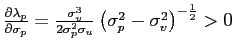
![$ \frac{\partial\lambda_{p}}{\partial\sigma_{p}} =\frac{\sqrt{M}\sigma_{v}^{3}\left[ \sigma_{v}^{4}\left( M+1\right) +\sigma_{p}^{2}\left( \sigma_{v}^{2}+2M^{2}\sigma_{p}^{2}-5M\sigma_{v} ^{2}\right) \right] }{\sigma_{p}^{2}\sigma_{u}\left[ 2\sigma_{p} ^{2}-\left( M+1\right) \sigma_{v}^{2}\right] ^{2}}\left( M\sigma_{p} ^{2}-\sigma_{v}^{2}\right) ^{-\frac{1}{2}}$](img326.gif)
 ,
, ,
,
 ,
,
 ,
,![$ \lambda_{p}=\frac{\alpha^{\frac{1}{2}}\sigma_{v}\left( \sigma_{p}^{2} -\sigma_{v}^{2}\right) ^{\frac{1}{2}}}{\sigma_{u}\sigma_{p}[2+(M-1)\gamma _{p}]}$](img2fig1eq.giforig874.gif)
![$ \gamma_{p}=\frac{\sigma_{p}^{2}\left( \sigma_{v}^{2}-M\chi\right) -\sigma_{v}^{4} } {\sigma_{p}^{2}\left[ \sigma_{v}^{2}+M\left( M-1\right) \chi\right] -\sigma_{v}^{4}}$](img331.giforig874.gif)