
Board of Governors of the Federal Reserve System
International Finance Discussion Papers
Number 912, December 2007 --- Screen Reader
Version*
Sovereign CDS and Bond Pricing Dynamics in Emerging Markets: Does the Cheapest-to-Deliver Option Matter?
NOTE: International Finance Discussion Papers are preliminary materials circulated to stimulate discussion and critical comment. References in publications to International Finance Discussion Papers (other than an acknowledgment that the writer has had access to unpublished material) should be cleared with the author or authors. Recent IFDPs are available on the Web at http://www.federalreserve.gov/pubs/ifdp/. This paper can be downloaded without charge from the Social Science Research Network electronic library at http://www.ssrn.com/.
Abstract:
We examine the relationships between credit default swap (CDS) premiums and bond yield spreads for nine emerging market sovereign borrowers. We find that these two measures of credit risk deviate considerably in the short run, due to factors such as liquidity and contract specifications, but we estimate a stable long-term equilibrium relationship for most countries. In particular, CDS premiums tend to move more than one-for-one with yield spreads, which we show is broadly consistent with the presence of a significant "cheapest-to-deliver" (CTD) option. In addition, we find a variety of cross-sectional evidence of a CTD option being incorporated into CDS premiums. In our analysis of the short-term dynamics, we find that CDS premiums often move ahead of the bond market. However, we also find that bond spreads lead CDS premiums for emerging market sovereigns more often than has been found for investment-grade corporate credits, consistent with the CTD option impeding CDS liquidity for our riskier set of borrowers. Furthermore, the CDS market is less likely to lead for sovereigns that have issued more bonds, suggesting that the relative liquidity of the two markets is a key determinant of where price discovery occurs.
Keywords: Credit derivatives, sovereign bonds, yield spreads, emerging markets, liquidity, options
JEL classification: G10, G14, G15
I. Introduction
In the past decade, the credit derivatives market has experienced rapid growth, and among credit derivatives, the credit default swap (CDS) has become the most widely traded instrument for transferring credit risk. According to survey data coordinated by the Bank for International Settlements, by the end of 2005, the total notional amount of outstanding CDS contracts had surpassed $13 trillion.1 CDS contracts can help isolate credit risk from other factors affecting bond prices such as illiquidity premiums, and thus may provide more accurate pricing and cleaner measurement of credit risk than is available from the underlying debt markets.
Most empirical comparisons of CDS and bond pricing, such as Hull and White (2000), Longstaff, Mithal, and Neiss (2005), Blanco, Brennan, and Marsh (2005), and Zhu (2005) have only considered investment-grade corporate names; these studies generally have concluded that arbitrage forces CDS premiums to be approximately equal to the underlying bond spreads in the absence of market frictions. Blanco, Brennan, and Marsh (2005) also report evidence that corporate CDSs seem to lead corporate bonds in reflecting changes in credit conditions. However, the number of CDS quoted for speculative-grade reference entities, while small until recent years, has since increased rapidly, and it is not obvious that investment-grade empirical regularities are necessarily applicable to riskier credits.
This paper makes three key contributions. First, we analyze the "cheapest to deliver" (CTD) option that is embedded in most CDS contracts, and we show that it can be quite important to determination of hedge ratios and to pricing relationships between bonds and CDS. We present evidence of the empirical importance of the option. Second, we find somewhat different dynamic relationships between CDS and bond prices than in the previous literature. These differences may arise because of the CTD option or because borrowers in our sample are riskier, but the differences in our results are also consistent with the relative importance of public and private information being a key determinant of differences in price dynamics across assets. Third, we examine pricing relationships for sovereign credit risk, with substantial variation in credit spreads over time and across reference entities. Most prior work on CDS has focused on investment-grade corporate names. Although the number of sovereign reference entities is smaller, cross-sectional relationships are often strong enough so that we obtain statistically significant results, and the sovereign market is large in the sense of the volume of credit risk transfer. Taken together, our arguments and evidence suggest that, particularly as the CDS market extends it reach to more speculative-grade names, market participants may wish to reconsider some features of the standard CDS contract, and may need to revise pricing models, trading strategies, and hedging strategies. There are matters of considerable practical importance to a rapidly growing market.
Our paper also differs from most previous work on CDS markets in its focus on the implications of the "cheapest-to-deliver" (CTD) option in CDS contracts. The CTD option often arises when the reference entity has more than one long-term debt instrument outstanding, because upon a default event, the protection buyer typically may choose to deliver virtually any long-term obligation that matches the currency and debt-seniority specified in the contract. Accordingly, there can be an incentive to deliver the (ex post) lowest-priced instrument that the protection buyer already owns or could acquire in secondary markets, even if the protection had been bought to hedge a different instrument. Most papers in the corporate CDS literature mention the CTD option in passing as a potential pricing complication, but few go further with addressing it. One exception is Packer and Zhu (2005), who consider price differences among CDS quotes for the same reference entities that differ only in how broadly a credit event is defined and in some cases, have varying restrictions on the set of deliverable instruments.2 In addition, Blanco, Brennan, and Marsh (2005), discuss a CTD option as the most likely explanation for an upward shift in CDS quotes for one firm in their sample (Fiat SpA), after it had issued an unusual bond that traded at low prices.
Our empirical focus is on emerging market sovereign credit risk, which differs in several respects from the investment-grade corporate credit risk addressed in prior studies of CDSs. First, sovereigns are among the largest high-yield borrowers in the world, typically with more bonds outstanding, longer maturities, larger issues, and more liquidity than their corporate counterparts. Second, during the period we study, the outstanding debt of our sovereign borrowers was almost entirely in the form of bonds, whereas corporate bond issuers nearly always also borrow from banks. Accordingly, some of the CDS market activity for corporate reference entities likely involves hedging illiquid loan positions, which we would not expect to be the case for our sovereign sample. Third, countries in financial distress generally do not enter bankruptcy proceedings or ever liquidate their assets, so the nature of default risk is somewhat different. In practice, sovereign defaults have been followed by exchange offers or other debt restructuring mechanisms, which tend to be shaped at least in part by either explicit or implicit political forces, which would not play the same role in statutory corporate bankruptcy proceedings. Fourth, our sample spans a wide range of creditworthiness, ranging from China, with an average 5-year bond spread over the swap curve of just 26 basis points during our sample, to Uruguay, with an average spread of 1,124 basis points.
Finally, for sovereign credit instruments, there may be less information asymmetry between market participants than there is among traders of corporate credit risk. The relative importance of public and private information can affect the process of price discovery, and if informed traders are choosing their trading venue strategically, also affect the dynamic relationship between credit pricing in the bond and CDS markets. With respect to sovereign credit risk, much of the relevant information about the national economy and the state of government finances tends to be in the public domain, so new information might tend to be reflected in observed prices more quickly in the more liquid market, if there are any differences in timing. But if price discovery for corporate credit risk is driven more by informed trading, this might occur in the market that is institutionally less transparent, which might consequently tend to be the less liquid market. Chakravarty, Gulen, and Mayhew (2004) document that relative liquidity measured by trading volume and bid-ask spreads plays an important role in capturing the relative contribution to price discovery by stocks and options. Consistent with their findings, we report evidence that bond spreads lead CDS premiums for emerging market sovereigns more often than has been found for investment-grade corporate credits, especially for sovereigns that have issued more bonds.
There has been relatively little work to date on sovereign CDS markets in the literature. Packer and Suthiphongchai (2003) document the growth in the sovereign CDS market and compare average sovereign CDS premiums to corporate CDS premiums by credit rating. Pan and Singleton (2006) use data on CDS contracts of several different maturities, in an attempt to separately identify default risk and recovery risk in the context of the Duffie and Singleton (2003) credit pricing framework. Among empirical studies with an emerging-market focus, the paper that appears to be most similar to the dynamic analysis undertaken here is Chan-Lau and Kim (2004), who look for lead-lag relationships among sovereign bond indices, sovereign CDS premiums, and national stock market indexes, reporting somewhat inconclusive results. In comparison, our analysis uses more closely matched credit market data, which enables us to cast our analysis in terms of an arbitrage relation. We also cover a longer sample period and more countries.
Previewing our main results, we find that sovereign CDS premiums and bond spreads do move in tandem in the long run. In the short run, when the prices deviate from their long-run equilibrium, CDS markets seem to lead bond markets in price discovery in some instances, but lag bond prices in other cases, with some evidence that the more liquid market tends to lead. We also offer a variety of evidence that CDS premiums are affected by the CTD option that arises in the standard CDS contract.
Our results concerning the importance of the CTD option have a number of further implications. First, the CTD option appears to be quantitatively important enough so that it should be accounted for in any CDS pricing model. In particular, we report post-default bond quotes for one sovereign issuer (Argentina), that vary widely enough to suggest that a CTD option could increase the value CDS protection by more than 20 percent. Second, the CTD option appears to have a significant effect on optimal hedging ratios versus the underlying debt, with protection buyers often over-hedged, if they match the CDS notional amount to the face value of their debt holdings. Our dynamic pricing analysis suggests that the correct hedging ratio could be as high as 1.5 for some credits. Third, the pay-off to a CDS protection buyer of a strategic delivery choice is a factor in optimal CDS contract design, particularly in the trade-off between flexibility and specificity in settlement procedures after a covered credit event. To the extent that the least valuable bond would always be delivered, even when the protection buyer had been hedging a position in a different asset, it is not at all clear that the wide choice in deliverable instruments available under prevailing market conventions is desirable, particularly if there is ex ante uncertainty about the extent to which the CTD option will be in-the-money after a credit event. Finally, the value of the CTD option incorporated into CDS pricing can make it more difficult to draw inferences from CDS premiums about the market price of the underlying credit risk. This is a potential drawback for risk management, and for policy makers who use market prices to monitor credit risk and credit market conditions.
II. Arbitrage Relation between a CDS and the Underlying Bond: Ideally and in Practice
As Duffie (1999) demonstrates, an exact arbitrage pricing
relation exists among a combination of three instruments - a risky
floating rate bond trading at par, a risk-free par floater of the
same maturity, and a CDS contract of the same maturity that
specifically references the risky bond. Note that the floater
without credit risk should consistently trade at par at all times
between issue and maturity. Upon a default event, the CDS
protection seller would compensate the protection buyer for the
difference between the face value and market value of the reference
bond upon default. Accordingly, an investor with a long position in
the risky bond and a corresponding short position in the risk-free
bond who bought CDS protection would receive a net payment of zero
either upon a default event or upon the maturity of the three
contracts (i.e., if there was no default). Thus the spread
(![]() between the yields on the risky and
risk-free bonds must equal the CDS premium (
between the yields on the risky and
risk-free bonds must equal the CDS premium (![]() in order to preclude an arbitrage opportunity. In other words, the
CDS basis, defined as (
in order to preclude an arbitrage opportunity. In other words, the
CDS basis, defined as (
![]() must equal zero in this
ideal case.
must equal zero in this
ideal case.
Blanco, Brennan, and Marsh (2005) and Hull, Predescu, and White (2004) discuss several factors that might complicate the arbitrage between CDS and bonds and lead to a non-zero measured CDS basis. First, most bonds have fixed coupons, which means that the value of the risk-free bond may be trading at a discount or premium to par at the time of a default event. These authors argue that this residual interest rate risk is not likely to be a significant factor in CDS pricing. Furthermore, in empirical applications, a yield spread measured from the prices of fixed rate bonds seems likely to be a very good estimate of what the bond spread would have been for the corresponding floating rate instruments, if they had also been trading.3
Second, there may be liquidity premiums in either the bond or CDS markets, which may vary over time. For example, Collin-Dufresne, Goldstein, and Martin (2001) conclude that liquidity premiums explain much of the variation in investment-grade bond yield spreads. To the extent that the market for individual risky bonds is less liquid than the market for risk-free bonds, the consequent illiquidity premium will tend to increase bond spreads, all else equal, and are thus a potential explanation for a negative CDS basis. It is also possible that pricing in the benchmark 5-year CDS market can incorporate liquidity effects. However the sign of any illiquidity component in CDS premiums is less clear, because a CDS is a derivative that is in net zero supply. It is conceivable that either protection buyers or protection sellers might compensate their counterparties for illiquidity at different times. However, Tang and Yan (2006) find evidence in a sample of U.S. corporate obligors that bond yields and CDS premiums incorporate illiquidity premiums of comparable magnitude.
Cheapest-to-Deliver (CTD) Option
Yet another complication arises from the fact that the standard
CDS contracts that are most widely traded and quoted do not apply
to a specific debt instrument. In practice, a variety of
dollar-denominated senior obligations of the reference entity are
available for delivery. For the Asian sovereigns in our sample,
either a loan or a bond with maturity under 30 years is eligible
for delivery. For the other reference entities in our sample, a
bond of any maturity may be delivered. Accordingly, after a
default event, a protection buyer has an incentive to deliver the
least valuable instrument that is eligible, even if it were a
different instrument that this investor was hedging with the CDS
contract, in practice. This "cheapest-to-deliver" (CTD) option
confounds the stylized example of exact arbitrage between a CDS and
the matching floating-rate bonds that was described above. In
particular, upon a default event, a protection buyer potentially
could reap a windfall equal to the difference between the value (
![]() - after the reference entity
defaults - of the par floater that exactly matches the CDS
reference name and CDS maturity and the value (
- after the reference entity
defaults - of the par floater that exactly matches the CDS
reference name and CDS maturity and the value (![]() after default of the cheapest instrument eligible
for delivery. With a CTD option of non-zero value, a
positive CDS basis (
after default of the cheapest instrument eligible
for delivery. With a CTD option of non-zero value, a
positive CDS basis (
![]() is now required to
preclude an arbitrage opportunity.
is now required to
preclude an arbitrage opportunity.
Thus, one key issue for whether the CTD option is empirically relevant is the relative treatment of senior claims with different terms when a default is resolved. One possible outcome is that holders of bonds of varying maturity and coupon rates will each recover the same proportion of face value, which would be consistent with the CTD option being of negligible importance. In practice, investors may have substantial uncertainty around the time of the default event about how different claims eventually will fare in resolution. All else equal, one might expect a bond with a higher coupon rate to be worth more in default. A higher coupon could add value to the extent that interest-in-arrears over some period of time counted toward the total admissible claim in an eventual settlement process.
The specific terms of debt instruments may also matter in cases where debt is restructured. To the extent that the terms of the restructured claims might inherit some of the characteristics of their antecedents (at least relative to each other), one might expect holders of debt with higher coupon rates and/or shorter maturities to recover a higher fraction of face value. Such an ordering is broadly consistent with the terms of Uruguay's mid-2003 distressed debt exchange, in which bond holders were offered different combinations of new securities with maturities averaging at least five years longer than the original bonds and similar coupon rates to the bonds for which they were being exchanged.
The diversity of prices of Argentine sovereign bonds after the November 2001 default, shown in Table 1, demonstrate that ex-default prices can vary widely across bonds with different characteristics. The quotes in the table range from a low of 23 for a 12 percent 30-year bond to a high of 43.5 for an 8-3/8 percent 2-year bond, and are generally decreasing in the remaining tenor of the bond. These price differences suggest that the CTD option can be of substantial importance in CDS pricing, at least for emerging-market sovereign names. For example, an investor in the 11 percent bond maturing October 2006 that had bought 5-year CDS protection in October 2001 apparently could have achieved a windfall of 13.5 percent of face value the following month by delivering the June 2031 bond (priced at 23) to the protection seller instead of the October 2006 bond (priced at 36.5). Accordingly, in this case, the CTD option appeared to have increased the value of CDS protection by about 21 percent (77 for delivering the 2031 bond versus 63.5 for the 2006 bond).
The most obvious testable implication of CTD options being important for CDS pricing is whether the CDS basis tends to be positive. But how should one expect this to vary across names and over time? One obvious factor is the treatment that would apply to differing claims in the event of default. However for sovereigns, there is likely a lot of uncertainty about this, because there have been relatively few defaults, and the negotiations preceding resolutions can be complicated, with political considerations potentially playing a much greater role than in corporate bankruptcy work-outs, which tend to be more rule-driven. For example, when Enron Corporation experienced a default event the month after Argentina's, the Merrill Lynch U.S. Corporate Bond Index included twelve Enron bonds, with coupons varying from 6.4 to 9.93 percent and maturities up to 27 years. However the December 31 prices (from Bloomberg) quoted for these bonds were all between 18.5 and 19.5, and two of Enron's senior loans were quoted at mid-prices averaging 18.5817 across three dealers (source: Loan Pricing Corporation). The near-uniformity across instruments in these quotes is at least anecdotal evidence that the CTD option was not as important for Enron, possibly because liquidation of the firm's assets was the most likely ultimate resolution for Enron, rather than a restructuring of its debt. Packer and Zhu (2005) argue that the CTD option is most important when a restructuring is the credit event.
All else equal, one might expect the CTD option to be worth more when there are a wider variety of debt instruments that would be eligible for delivery. In particular, certain bond features - such as a long maturity, a below-market coupon, illiquidity, or an issuer call option - might make the CTD option particularly valuable. Since many of these features should also tend to reduce the price of a bond for an issuer that is not in imminent danger of default, in some of our empirical work, we use the price of an issuer's cheapest bond (relative to par value) as a proxy for the value of the CTD option, conditional upon a default event. With respect to how the value of the CTD option for a given reference entity evolves over time, one complicating factor is the possibility that the set of deliverable instruments may grow (for example, by new bond issues) after CDS protection has been sold but before the CDS contract expires - it is unclear to what extent future bond issues would be anticipated by current CDS pricing. Accordingly, we use the characteristics of the set of deliverable bonds only in trying to explain cross-sectional differences in the average CDS basis across sovereign borrowers. Given that we find a linear co-integrating relationship between bond spreads and CDS premiums for most of the borrowers in our sample, it is likely that cross-sectional differences in the value of the CTD option are more important than are changes over time for a given name.
More readily quantifiable is the fact that all else equal, the CTD option should have a greater influence on CDS pricing when it is more likely that a protection buyer will be able to exercise the CTD option. In other words, the CDS basis ought to be an increasing function of the probability of default. This observation has testable implications both in cross-sectional and time series comparisons. First, all else equal, one would expect the CDS basis to be higher for riskier reference entities. Second, for a given name, one would expect the CDS premium to move more than one-for-one with the bond yield spread, as the component of the CDS premium that reflects compensation to the protection seller for providing the CTD option would tend to increase as the reference entity moved closer to default. Accordingly, we will test if the slope of this relation exceeds one. This argument is illustrated more formally by the following stylized example.
Special Case: Risk-Neutral Investors (or no Uncertainty about Recovery Rates in Default)
Suppose investors are risk-neutral and that the CTD option is
the only friction interfering with exact arbitrage between CDS and
bonds. Also assume that recovery rates are independent of
time-to-default (measured from when the CDS contract is entered).
As before, we have in mind an arbitrage portfolio of three
positions: long in the risky par bond, short in the risk-free par
bond, and buying CDS protection on the reference entity, all at the
same maturity date (![]() . We define a state
contingent annuity (with market value
. We define a state
contingent annuity (with market value ![]() that
pays a flow rate of one unit per year until either the reference
entity defaults or the maturity date (
that
pays a flow rate of one unit per year until either the reference
entity defaults or the maturity date (![]() of
the bond and CDS positions. We also define a state contingent
security (with market value
of
the bond and CDS positions. We also define a state contingent
security (with market value![]() that pays one
unit upon the default event, if the reference entity defaults
before the maturity date (
that pays one
unit upon the default event, if the reference entity defaults
before the maturity date (![]() . In this
context, the flow value of the yield spread on the risky bond
should be just enough to compensate an investor for the possible
credit loss, so that
. In this
context, the flow value of the yield spread on the risky bond
should be just enough to compensate an investor for the possible
credit loss, so that
PBS * VA = (VFACE - E [VMATCH]) * VD
where (VFACE) denotes the face value of the bond. Similarly, the flow value of the CDS premium should be just enough to compensate an investor for the possible credit loss, so that
PCDS * VA = (VFACE - E [VMIN]) * VD.
Note that these pricing relations are also valid for risk-averse
investors, if there is no uncertainty about recovery rates on the
"matching" bond (
![]() and on the "cheapest to
deliver" bond (
and on the "cheapest to
deliver" bond (![]() . Combining the two
expressions, the slope of the relation between the CDS premium and
the bond spread is
. Combining the two
expressions, the slope of the relation between the CDS premium and
the bond spread is
![$\displaystyle \frac{P_{CDS} }{P_{BS} }=\frac{V_{FACE} -E\left[ {V_{MIN} } \right] }{V_{FACE} -E\left[ {V_{MATCH} } \right] }. $](img19.gif)
This slope will exceed one whenever the expected value of the CTD option
is positive.
In a more general setting, with dependencies permitted between recovery rates on bonds in default and time-to-default (measured from when the CDS contract is entered), these pricing relations can become more complicated. For example, if default events that occur sooner are associated with lower recovery rates in the matching bond, a higher bond spread would be required (even for risk-averse investors) than the one in the expression given in the above. However, to the extent that similar effects also might occur in CDS pricing, the net impact of this sort of dependency on the CDS basis might not be quantitatively important.
III. Data Description
We obtain 5-year dollar-denominated sovereign CDS premiums daily
data (mid-quotes) from Mark-it Partners, for the period from
February 26, 2001 to March 31, 2005.![]() 4 All of
the CDS premiums we use are based on 5-year U.S. dollar contracts
with the CR restructuring clause, to avoid complicating our
analysis by the pricing implications of alternative contractual
terms of CDS contracts, which have been documented in Packer and
Zhu (2005).5 Quotes were available for at least
some of the days in this period for 33 emerging market sovereign
reference entities, and for at least 500 days for 21 of these
countries. Since the focus of this paper is a comparison of pricing
in the bond and CDS markets, it is important that our CDS quotes
and our bond market data be reasonably comparable. Accordingly, we
limit our study to the nine emerging-market countries for which we
were also able to obtain daily estimates of the yield on a 5-year
par coupon dollar sovereign bond from Bloomberg's fair market curve
analysis.
4 All of
the CDS premiums we use are based on 5-year U.S. dollar contracts
with the CR restructuring clause, to avoid complicating our
analysis by the pricing implications of alternative contractual
terms of CDS contracts, which have been documented in Packer and
Zhu (2005).5 Quotes were available for at least
some of the days in this period for 33 emerging market sovereign
reference entities, and for at least 500 days for 21 of these
countries. Since the focus of this paper is a comparison of pricing
in the bond and CDS markets, it is important that our CDS quotes
and our bond market data be reasonably comparable. Accordingly, we
limit our study to the nine emerging-market countries for which we
were also able to obtain daily estimates of the yield on a 5-year
par coupon dollar sovereign bond from Bloomberg's fair market curve
analysis.
The countries in our resulting sample are Brazil, China, Colombia, Mexico, the Philippines, Russia, Turkey, Uruguay, and Venezuela. Bloomberg's fair market curves are constructed with an optimization model that solves simultaneously for all maturity points and volatilities to best fit the existing yield data. We find that Bloomberg's 5-year sovereign yield estimates are much smoother than those constructed by linear interpolation, as in Blanco, Brennan, and Marsh (2005) and Zhu (2005). Because the maturity of our bond data and CDS data match, we get a cleaner reading of relative pricing in the CDS and bond markets than would be possible from the EMBI+ bond spread data that were used by Chan-Lau and Kim (2004), which are based on a composite of the issuing sovereign's most liquid bonds outstanding at that point in time. Accordingly, the EMBI+ indices vary in maturity structure over time and across sovereign issuers, and the EMBI+ spread data will have a structural break whenever a bond enters or exits the index. In addition, for many countries, the EMBI+ includes Brady bonds with collateral enhancements, which can further complicate measurement and interpretation of the spread. In constructing bond yield spreads, we use the 5-year U.S. dollar swap rate as a proxy for the risk-free rate. In terms of the arbitrage relations that was discussed in the previous section, the spread of a 5-year par coupon bond over the swap rate is likely to be the best available estimate of the spread of a par floater over LIBOR, the predominant floating-rate benchmark.
Table 2 shows the number of available CDS quotes and the credit rating (as of March 2005) for each of the sovereign borrowers in our sample. Data availability is generally poorest in 2001, although some of our reference entities also have data gaps in later years. The credit standing of our sample names varies greatly, and only three (China, Mexico and Russia) out of the nine countries had investment grade credit ratings at the end of our sample period (and only China at the beginning of the period). Due to heterogeneity in the credit circumstances and debt characteristics across the reference entities in our sample, we were reluctant to make any assumptions about commonalities in market dynamics. Accordingly, the estimation of the dynamic relation between bond and CDS pricing in this paper is conducted one country at a time.
IV. Empirical Analysis
A. Cross-Sectional Analysis of the Average Sovereign CDS Basis
The leftmost columns in Table 3 show for each sovereign borrower the means over the sample period of the 5-year CDS basis and of the corresponding bond yield spread, with the countries sorted by the bond spread. The simplest theoretical treatments posit that the CDS basis (i.e., pCDS = pBS ), as discussed in Duffie (1999) and Hull and White (2000). In contrast, all nine of the sovereigns in our sample, had a positive average CDS basis, with the country means ranging from 14 basis points to 313 basis points. In other words, emerging-market sovereign CDS premiums are in general distinctly higher than the corresponding bond yield spreads, broadly consistent with the value of a non-trivial CTD option included in CDS premiums. In contrast, Blanco, Brennan, and Marsh (2005) report an average CDS basis of just 6 basis points for a sample of 33 U.S. and European investment-grade corporate reference entities, with only two of the firm-level averages above 25 basis points.
Furthermore, as is clear from the scatter plot shown in Figure 1, the CDS basis and the bond yield spread are highly correlated across these nine sovereign credits. The correlation coefficient of 76 percent is statistically significant at the 5 percent level. This is further evidence of the importance of the CTD option in emerging-market sovereign CDS pricing, because, the ex ante value of a CTD option is increasing in the probability of a default event, and there is a strong positive association between probability of default and the bond yield spread.
The remaining columns of Table 3 are some summary statistics of the set of bonds that were eligible for delivery against the CDS of each of our sovereign borrowers, with a particular focus on features that are likely to be associated with the cheapest-to-deliver bond. For each of these characteristics, we compute the cross-sectional correlation with the mean CDS basis. All else equal, this correlation should be non-zero whenever the variable in question effectively captures the expected value of the CTD option implicit in the CDS contract, conditional on a default event. In particular, we cannot reject a zero correlation between the CDS basis and the lowest coupon rate on the set of deliverable bonds, which ranges from a high of 7-7/8 percent for Brazil to a low of zero for Philippines, which issued several zero-coupon bonds with original maturities between 12 and 18 months. However, when we attempt to capture the extent to which a country has an outstanding bond with a coupon that is below-market, rather than low in an absolute sense, the result is stronger. We find a correlation of 66 percent between the CDS basis and the difference between the average 5-year bond yield and the lowest bond coupon, with the estimated parameter statistically significant at the 5 percent level. The positive sign is consistent with a CTD option value that is increasing in the extent to which the coupon on the CTD bond is exceeded by the coupon on a 5-year par bond obligation of the same borrower - the bond that "matches" the 5-year CDS contract in the idealized arbitrage relation discussed above.
We also find somewhat weaker evidence that the value of the CTD option is increasing in the longest deliverable maturity. Given that all of the sovereigns in our sample had bonds longer than 20 years in maturity outstanding, it was not clear ex ante that there would be enough cross-sectional variation to identify a maturity effect on the CTD option. Nevertheless, the estimated correlation of the CDS basis with the latest maturity year is 59 percent, and it is statistically significant at the 10 percent level. To the extent that both a below-market coupon and a long maturity might be aspects of adverse selection in the choice of which instrument to deliver against a CDS contract, both features should be captured by our final cross-sectional proxy measure of the conditional CTD option value - the lowest-priced bond, averaged over the sample period (see appendix for details). In addition, some of the other features of a bond that might be associated with a lower value post-default - such as an issuer pre-payment option or a small issue size that limits secondary market liquidity - should also be reflected in pre-default prices. A strong negative relation between the lowest bond price and the CDS basis, consistent with a CTD option value that is decreasing in the value of the bond that optimally would be delivered, is apparent from the scatter plot shown in Figure 2. The estimated coefficient of -72 percent is statistically significant at the 5 percent level.
B. Relation between Sovereign CDS Premiums and Bond Spreads over Time
The time series graphs in Figure 3 for each sovereign clearly illustrate that CDS premiums and bond yield spreads tend to go in the same direction over time, although the CDS premium often moves by more. As demonstrated earlier, a more than one-for-one response in CDS premiums to bond spreads is consistent with CTD option values entering CDS pricing, and we will consider shortly the slope of the relation in a more formal setting. The CDS basis - the difference between the two lines on each graph - peaks for many of our countries in 2002, after credit conditions had deteriorated. Some anecdotal commentary has suggested that difficulty in shorting a bond may help explain a wider CDS basis in an unfavorable credit environment with reduced market liquidity, because lack of liquidity would discourage an arbitrage involving a short bond position and selling CDS protection - an arbitrage that might otherwise be undertaken when the CDS premium was relatively high. Nevertheless, this is an incomplete explanation for CDS bases increasing with credit spreads, since it only addresses impediments to arbitrage correction, and does not provide any reason for upward pressure on the CDS basis. In fact, with reduced liquidity in debt markets, one might expect higher illiquidity premiums in bond yields to put downward pressure on the CDS basis. In addition, any positive effect on the CDS basis from higher shorting costs might tend to be offset in difficult times by higher counterparty risk, the risk that protection sellers will not pay if a credit event occurs, which tends to reduce the CDS basis. Factors like differences in liquidity between the two markets and imperfect measurement of the risk-free rate may also affect the measured CDS basis.
To assess the long-run relationship between sovereign CDS premiums and bond yield spreads, we estimate bivariate time series models of the first differences of these two credit prices for each country, using the Johansen (1991) co-integration framework. We use the Schwarz Information Criterion to choose lag lengths (up to a maximum of five) for the underlying VAR systems. For each sovereign, we report Johansen trace statistics in Table 4 for two hypothesis tests involving the number of unit roots in the bivariate system. The null hypothesis "Zero or One Co-integrating Vectors" for the first test is that there is at least one unit root in the system, which we do not reject at the 5 percent significance level for any of the nine borrowers in our sample. Accordingly, any linear long-term equilibrium relation between CDS premiums and bond yield spreads will take the form of a co-integrating relation between the two variables. The results of the second test show that we find such a co-integrating relation for seven of our nine sovereigns, rejecting the null hypothesis of "Zero Co-integrating Vectors", except in the cases of Russia and Venezuela. These co-integration results seem consistent with the overall picture in Figure 3, in which the two measures of credit pricing generally do seem to move together in the longer run. We can write our two-variable system as a vector error correction model (VECM):
![\begin{displaymath} \begin{array}[c]{l} \Delta p_{CDS,t} =\lambda_{1} (p_{CDS,t-1} -\alpha-\beta p_{BS,t-1} )+\sum\limits_{j=1}^{k} {\gamma_{1j} } \Delta p_{CDS,t-j} +\sum\limits_{j=1} ^{k} {\delta_{1j} } \Delta p_{BS,t-j} +\varepsilon_{1t}\ \Delta p_{BS,t} =\lambda_{2} (p_{CDS,t-1} -\alpha-\beta p_{BS,t-1} )+\sum\limits_{j=1}^{k} {\gamma_{2j} } \Delta p_{CDS,t-j} +\sum\limits_{j=1} ^{k} {\delta_{2j} } \Delta p_{BS,t-j} +\varepsilon_{1t}\ \end{array}\end{displaymath}](img23.gif)
where
![]() and
and
![]() are the change in the CDS
premium and in the bond spread at time
are the change in the CDS
premium and in the bond spread at time ![]() ,
respectively, the parenthetical expression in
,
respectively, the parenthetical expression in ![]() and
and ![]() (when set equal to zero) is the
long-run relation of
(when set equal to zero) is the
long-run relation of ![]() and
and ![]() in levels,
in levels,
![]() and
and
![]() are speed-of-adjustment
coefficients, and the lagged changes in
are speed-of-adjustment
coefficients, and the lagged changes in ![]() and
and
![]() allow for additional dynamics.
allow for additional dynamics.
Table 5 shows parameter estimates of this system and test
statistics for each of the seven countries for which we found a
co-integrating relationship. The chi-squared statistics in the
first column indicate that for all seven sovereigns, we reject at
the 1 percent significance level a joint restriction on the
co-integrating relationship of (![]() =0 and
=0 and
![]() =1), the equivalent of long-run parity
between bond spreads and CDS premiums. In particular, the estimates
of
=1), the equivalent of long-run parity
between bond spreads and CDS premiums. In particular, the estimates
of ![]() in the next column exceed one for every
country but China, with an average value of 1.30, and in most cases
we can reject
in the next column exceed one for every
country but China, with an average value of 1.30, and in most cases
we can reject ![]() =1 at the 10 percent significance
level. In other words, CDS premiums tends to move more than
one-for-one with the corresponding bond spreads, consistent with a
market friction arising from the presence of an economically
significant CTD option in the CDS contract specification. Somewhat
in contrast, Blanco, Brennan, and Marsh (2005) report that for many
of the U.S. and European investment-grade corporate reference
entities that they study, they cannot reject a unit slope in the
long-run relationship between bond spreads and CDS premiums.
=1 at the 10 percent significance
level. In other words, CDS premiums tends to move more than
one-for-one with the corresponding bond spreads, consistent with a
market friction arising from the presence of an economically
significant CTD option in the CDS contract specification. Somewhat
in contrast, Blanco, Brennan, and Marsh (2005) report that for many
of the U.S. and European investment-grade corporate reference
entities that they study, they cannot reject a unit slope in the
long-run relationship between bond spreads and CDS premiums.
C. Adjustment Dynamics and Price Leadership
The VECM representation also provides information about the
dynamics of adjustment to the long-term equilibrium relationship
between the sovereign CDS premiums and bond spreads. Interestingly,
with very few exceptions, we generally estimate a statistically
significant negative
![]() and a statistically significant
positive
and a statistically significant
positive
![]() . This means that both bond
spreads and CDS premiums partake in the adjustment to equilibrium.
For example, when the CDS premium is relatively high, it tends to
fall and the bond spread tends to rise in subsequent days.
Our estimated dynamics for the seven countries in Table 5 imply
fairly rapid adjustment, with 5 to 13 percent of a deviation from
the long-run relationship tending to dissipate within a day.
Nevertheless, deviations from the estimated long-run relationship
are clearly persisting longer than it would take for participants
in one market to observe the price in the other, consistent with
imperfections in the arbitrage relationship between bonds and
default swaps.
. This means that both bond
spreads and CDS premiums partake in the adjustment to equilibrium.
For example, when the CDS premium is relatively high, it tends to
fall and the bond spread tends to rise in subsequent days.
Our estimated dynamics for the seven countries in Table 5 imply
fairly rapid adjustment, with 5 to 13 percent of a deviation from
the long-run relationship tending to dissipate within a day.
Nevertheless, deviations from the estimated long-run relationship
are clearly persisting longer than it would take for participants
in one market to observe the price in the other, consistent with
imperfections in the arbitrage relationship between bonds and
default swaps.
The relative magnitude of
![]() and
and
![]() can be used to characterize the
contribution of each market towards price discovery, at least as
manifested in the recorded market prices. Prices in the more liquid
market should be quicker to reflect public information and have
less transitory noise. If one market always lags the other, then
the
can be used to characterize the
contribution of each market towards price discovery, at least as
manifested in the recorded market prices. Prices in the more liquid
market should be quicker to reflect public information and have
less transitory noise. If one market always lags the other, then
the ![]() coefficient in the equation for the
market that always leads should be zero. If both coefficients are
statistically significant with the expected signs, the relative
magnitude of the two coefficients reveals which market leads the
price discovery process more. Following Gonzalo and Granger (1995),
we construct a measure (GG) that reflects the contribution of each
market to price discovery, shown in the last column of Table 5 and
defined as the ratio of the speed of adjustment in the two markets
(
coefficient in the equation for the
market that always leads should be zero. If both coefficients are
statistically significant with the expected signs, the relative
magnitude of the two coefficients reveals which market leads the
price discovery process more. Following Gonzalo and Granger (1995),
we construct a measure (GG) that reflects the contribution of each
market to price discovery, shown in the last column of Table 5 and
defined as the ratio of the speed of adjustment in the two markets
(
![]() ,
with a lower bound of 0 and upper bound of 1. This statistic can be
interpreted as the fraction of overall movements in credit risk
compensation led by initial movements in CDS premiums (as opposed
to appearing initially in movements in bond spreads) based on the
estimated VECM. When the GG measure is close to 1, as we estimate
for China and Colombia, it implies that the CDS market leads in
price discovery. When the estimated measure is closer to
,
with a lower bound of 0 and upper bound of 1. This statistic can be
interpreted as the fraction of overall movements in credit risk
compensation led by initial movements in CDS premiums (as opposed
to appearing initially in movements in bond spreads) based on the
estimated VECM. When the GG measure is close to 1, as we estimate
for China and Colombia, it implies that the CDS market leads in
price discovery. When the estimated measure is closer to
![]() than either extreme, as it is for most of the other countries,
both markets contribute to price discovery, and there is no clear
evidence on which market leads.
than either extreme, as it is for most of the other countries,
both markets contribute to price discovery, and there is no clear
evidence on which market leads.
Our average GG measure for these 7 countries is 58 percent, suggesting that the CDS market leads a little more often than it lags, but contrasting somewhat with an average GG measure of 79 percent reported by Blanco, Brennan, and Marsh (2005) for investment-grade corporate reference entities that implies CDS premiums generally lead bond prices. It is possible that the CDS market plays less of a leadership role for emerging market sovereign credit pricing, simply because the CTD option is more of an obstacle to CDS liquidity. Another possibility is that compared to most corporate bond issuers, our sample of sovereigns (limited to those for which it is possible to estimate a daily yield curve from dollar-denominated bond prices) has relatively liquid bonds.
Table 6 further explores differences in our VECM estimates across countries. In particular, we compare the GG price leadership statistic to proxies for relative CDS and bond market liquidity for our small cross-section of emerging-market sovereigns. The first two columns show averages of daily bid-ask spreads from Bloomberg for the 5-year CDS (per year, as a percent of notional value) and for the issuer's most liquid bond (as a percent of face value). If price discovery tends to occur in the more liquid market, than we should expect that all else equal, the CDS market will lead more for names with low CDS bid-ask spreads and high bond bid-ask spreads. The estimated correlations shown in the table have the expected signs, but they are too weak to be statistically significant for a sample of only 7 reference entities. As can be seen in the scatter plot in Figure 4, the correlation of the GG measure with the ratio of the bond bid-ask spread to the CDS bid-ask spread is stronger (66 percent), but it is still not statistically significant at the 5 percent level. The positive sign, however, suggests that when the bond market is relatively illiquid (high bid-ask spread), price discovery tends to shift to the CDS market (higher GG measure), which is consistent with the findings of Chakravarty, Gulen, and Mayhew (2004) that the level of contribution of options to price discovery is higher when liquidity is higher relative to stocks. Presuming that most of the relevant information about a sovereign borrower's credit risk is widely disseminated, it seems to make sense for it to tend to show most quickly in the more liquid market. In contrast, when private information is relatively more important, bid-ask spreads ought to be higher, all else equal, in the market where informed agents trade, as less-informed liquidity providers would need to be compensated for adverse selection.
We also consider one additional proxy for relative bond market liquidity - the number of the issuer's bonds outstanding during our sample period that would have been eligible for delivery, which we take to be more of a proxy for collective bond market liquidity than that of any given bond. The scatter plot in Figure 5 implies a negative relation between the number of eligible bonds and the GG measure of CDS price leadership, consistent with price discovery occurring in the bond market more often when there are more bonds that might be traded. The correlation of -80 percent between these variables is statistically significant at the 5 percent level, as reported in Table 6. Again, this result is consistent with public information being reflected first in the more liquid market.
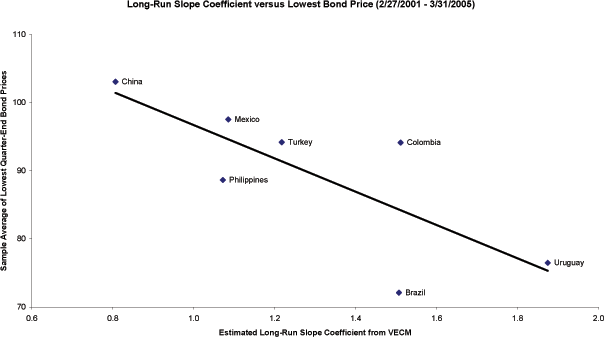
Next we consider how our estimated long-run slope coefficient varies across the emerging-market sovereign borrowers in our sample. As noted before, the CTD option should tend to cause CDS premiums to move more than one-for-one with bond yield spreads. Furthermore, the slope should be higher when the windfall to the protection buyer of delivering the CTD bond is greater. The scatter plot in Figure 6 shows a strong negative relation between the estimated slope coefficient and the average over the sample of the price of the cheapest deliverable bond, consistent with the value of the CTD option accounting for long-run relations between CDS premiums and bond yield spreads with greater than unit slopes. Furthermore, the correlation of -77 percent between these variables reported in Table 6 is statistically significant at the 5 percent level.
To the extent that the CTD option makes the CDS contract an imperfect hedge for a position in the underlying debt, introducing an additional source of uncertainty that could adversely affect either counterparty, it is conceivable that the CTD option is an impediment to CDS liquidity. Accordingly, since the estimated long-run slope coefficient is a proxy for the importance of the CTD option, one might expect a higher slope to be associated with relative illiquidity in the CDS market. Consistent with this conjecture, we compute a correlation of 77 percent between the estimated slope and the CDS bid-ask spread for the six sovereign names in Table 6 for which two-sided CDS quotes were available from Bloomberg, although the coefficient is not statistically significant at the 5 percent level. Interestingly, to the extent that the CTD option might impede CDS liquidity, we do not find evidence that it reduces the extent to which price discovery occurs in the CDS market - the correlation between the estimated slope coefficient and the GG measure of CDS price leadership that we report in Table 6 is close to zero. A negative correlation would be consistent with the CTD option serving as a friction that pushed the price discovery process back into the underlying debt market.
V. Conclusions
In this paper, we analyze the relationship between sovereign CDS premiums and bond yield spreads for nine emerging-market sovereign credits over a four-year period. For most countries in our sample, we find that sovereign CDS premiums and bond spreads are linked by a stable linear long-run equilibrium relation. The two prices of credit risk, however, often diverge from the equilibrium in the short run, with these temporary deviations typically dissipating at a rate of 5 to 13 percent per day. This gradual convergence in prices implies that there is some predictability of relative price changes between the two markets, which is sustained by some combination of illiquidity in at least one of the two markets and risk that arises from the imperfections in the underlying arbitrage relation.
CDS markets seem to lead bond markets in price discovery in some instances, but lag bond prices in other cases. We find some evidence that the relatively more liquid market tends to lead the other. In particular, across our sovereign borrowers, we calculate that the GG measure of relative CDS price leadership is correlated (i) positively with the ratio of the bond bid-ask spread to the CDS bid-ask spread and (ii) negatively with the number of bonds outstanding (a proxy for collective bond market liquidity), with a statistically significant coefficient in the second case. Price leadership in the more liquid market is consistent with sovereign credit risk pricing being driven mostly by public information. Overall, the bond market leads more often for our emerging-market sovereign borrowers than has been reported by Blanco, Brennan, and Marsh (2005) for investment-grade corporate names. Accordingly, the CDS market may not be as clear-cut a choice as a benchmark for credit pricing for sovereign bond issuers as it is for corporate borrowers.
We also derive the pricing implications of the CTD option in CDS contracts, and report a variety of evidence that the CTD option is quantitatively important in our sample, and in particular that the value of the CTD option is an important determinant of the CDS basis - the difference in credit pricing between the CDS and bond markets. For example, we find that the CDS basis tends to be higher for a borrower for which the ex post CTD option is likely to be larger, because it has issued at least one bond with a below-market coupon, long maturity, and/or low pre-default market value, as a fraction of the face value that would be insured by CDS protection. We also find that the CDS basis tends to be higher for riskier reference entities with lower credit ratings and higher bond yield spreads. This is consistent with the presence of the CTD option, because all else equal, the option is more valuable ex ante when the probability of a default event is higher. Similarly, in our dynamic analysis, we find that CDS premiums tend to move more than one-for-one with bond yield spreads; all else equal, a rising yield spread is associated with an increasing probability of a credit event. In addition, we report a statistically significant negative correlation across sovereign borrowers between the estimated long-run slope and the cheapest bond price, further evidence that CDS premiums move more than one-for-one with bond yield spreads specifically because of the CTD option. We also report some weaker evidence that suggests the estimated long-run slope is negatively associated with CDS liquidity, consistent with the CTD option creating a market friction that is an impediment to liquidity.
Our results concerning the importance of the CTD option have a number of further implications. First, the CTD option appears to be quantitatively important enough so that it should be accounted for in any CDS pricing model. Second, the CTD option appears to have a significant effect on optimal hedging ratios versus the underlying debt, with protection buyers often over-hedged, if they match the CDS notional amount to the face value of their debt holdings. Third, the pay-off to a CDS protection buyer of a strategic delivery choice is a factor in optimal CDS contract design, particularly in the trade-off between flexibility and specificity in settlement procedures after a covered credit event. To the extent that the least valuable bond would always be delivered, even when the protection buyer had been hedging a position in a different asset, it is not at all clear that the wide choice in deliverable instruments available under prevailing market conventions is desirable, particularly if there is ex ante uncertainty about the extent to which the CTD option will be in-the-money after a credit event. Finally, the value of the CTD option incorporated into CDS pricing can make it more difficult to draw inferences from CDS premiums about the market price of the underlying credit risk. This is a potential drawback for risk management, and to policy makers who use market prices to monitor credit risk and credit market conditions.
References
Blanco, R., S. Brennan, and I. W. Marsh, 2005, An Empirical Analysis of the Dynamic Relationship Between Investment Grade Bonds and Credit Default Swaps, Journal of Finance 60, 2255-2281.
Chakravarty, S., H. Gulen, and S. Mayhew, 2004, Informed Trading in Stock and Option Markets, Journal of Finance, 59 (3), 1235-1257.
Chan-Lau, J. A., and Y. S. Kim, 2004, Equity Prices, Credit Default Swaps, and Bond Spreads in Emerging Markets, IMF working paper 04/27.
Collin-Dufresne, Pierre, Robert S. Goldstein, and J. Spencer Martin, 2001, The Determinants of Credit Spread Changes, Journal of Finance 56 (6), 2177-2207 (December).
Duffie, D., 1999, Credit Swap Valuation, Financial Analysts Journal 55, 73-87.
Duffie, D., and J. Liu, 2001, Floating-Fixed Credit Spreads, Financial Analysts Journal 57 (3), 76-87.
Duffie, Darrell, and Kenneth J. Singleton, 2003, Credit Risk. Princeton: Princeton University Press.
Elton, E., M. J. Gruber, D. Agrawal, and C. Mann, 2001, Explaining the Rate Spread on Corporate Bonds, Journal of Finance 56 (1), 247-277.
Gonzalo, J., and C. W. J. Granger, 1995, Estimation of Common Long-Memory Components in Co-integrated Systems, Journal of Business and Economic Statistics 13, 27-35.
Hull, John, Mirela Predescu, and Alan White, 2004, The Relationship between Credit Default Swap Spreads, Bond Yields, and Credit Rating Announcements, Journal of Banking and Finance 28 (11), 2789-2811 (November).
Hull, J. C., and A. White, 2000, Valuing Credit Default Swaps I: No Counterparty Default Risk, Journal of Derivatives 8, 29-40.
Johansen, S., 1991, Estimation and Hypothesis Testing of Co-integration Vectors in Gaussian Vector Autoregressive Models, Econometrica 59, 1551-1580.
Longstaff, F., S. Mithal, and E. Neiss, 2005, Corporate Yield Spreads: Default Risk or Liquidity? New Evidence from the Credit-Default Swap Market, Journal of Finance 60 (5), 2213-2253.
Packer, F., and Chamaree Suthiphongchai, 2003, Sovereign Credit Default Swaps, BIS Quarterly Review, December, 79-88.
Packer, F., and H. Zhu, 2005, Contractual Terms and CDS Pricing, BIS Quarterly Review, March.
Pan, J., and K. J. Singleton, 2007, Default and Recovery Implicit in the Term Structure of Sovereign Spreads, manuscript.
Tang, D., and H. Yan, 2006, Liquidity and Credit Default Swap Spreads, SSRN working paper.
Zhu, H., 2006, An Empirical Comparison of Credit Spreads between the Bond Market and the Credit Default Swap Market, Journal of Financial Services Research, Vol. 29 (3), 211-235.
APPENDIX: Notes on the Construction of the Cross-Sectional Data for Tables 3 and 6
The Mean 5-Year CDS Basis and the Mean 5-Year Bond Spread are computed for each country as the average of daily prices over the days for which quotes for both the sovereign bond yield and the sovereign CDS premium were available.
The Lowest Annual Bond Coupon, the Number of Bonds, and the Longest Deliverable Bond Maturity are drawn from the set of bonds (eligible for delivery against a CDS contract) outstanding for any part of the sample period. Source: Bloomberg.
The Mean of Lowest Bond Price is, for each country, the average over the sample period of the lowest quarter-end price quoted among bonds issued by the corresponding sovereign that were then included in the Merrill Lynch non-Brady U.S. Dollar Sovereign index. Source: Bloomberg.
The Mean CDS Bid-Ask Spread and the Mean Bond Bid-Ask Spread are computed as the average of daily bid-ask spreads, as a percent of the mid-quote, beginning January 24, 2003, the first day for which CDS bid and ask quotes were available for each of the first six sovereigns listed in Table 6. The Mean Bond Bid-Ask Spread for each sovereign is measured for the U.S. dollar-denominated bond with the lowest average bid-ask spread over the period from January 24, 2003 to March 31, 2005 (source: Bloomberg). The specific sovereign bonds are:
| China | 7.3% | 12/15/2008 |
|---|---|---|
| Philippines | 10-5/8% | 3/16/2025 |
| Mexico | 8.3% | 8/15/2031 |
| Turkey | 11-3/4% | 6/15/2010 |
| Brazil | 11% | 8/17/2040 |
| Colombia | 11-3/4% | 2/25/2020 |
| Uruguay | 7-7/8% | 1/15/2033 |
Table 1. Prices of Argentine Sovereign Dollar-Denominated Bonds after the 2001 Default
Prices are November 30, 2001 quotes for the Argentine constituents of Merrill Lynch's U.S. Dollar Emerging Market Sovereign Plus Non-Brady Index. These bonds had been downgraded to D by Standard and Poor's on November 19, 2001.
| Maturity Date | Remaining Maturity (Years) | Annual Coupon (Percent) | Face Amount ($ millions) | Price |
|---|---|---|---|---|
| 12/20/2003 | 2.1 |
8.375 |
1,843 |
43.50 |
| 12/4/2005 | 4.0 |
11.000 |
862 |
40.50 |
| 10/9/2006 | 4.9 |
11.000 |
1,213 |
36.50 |
| 12/19/2008 | 7.1 |
7.000 |
11,456 |
32.25 |
| 4/7/2009 | 7.4 |
11.750 |
1,163 |
30.50 |
| 3/15/2010 | 8.3 |
11.375 |
860 |
31.00 |
| 2/21/2012 | 10.2 |
12.375 |
905 |
30.00 |
| 6/15/2015 | 13.5 |
11.750 |
903 |
29.00 |
| 1/30/2017 | 15.2 |
11.375 |
2,491 |
35.60 |
| 6/19/2018 | 16.6 |
12.250 |
7,463 |
24.25 |
| 9/19/2027 | 25.8 |
9.750 |
891 |
32.25 |
| 6/19/2031 | 29.6 |
12.000 |
8,821 |
23.00 |
| face-weighted average | - |
- |
- |
29.47 |
Table 2. Availability of Quotes for CDS Premiums (February 26, 2001 to March 31, 2005)
The CDS premiums are averages across dealers of mid-quotes for 5-year contracts compiled by Mark-it Partners.
| Country | Credit Rating (3/31/2005) | Number of Observations |
|---|---|---|
| Brazil | B |
1,049 |
| China | A |
974 |
| Colombia | BB |
978 |
| Mexico | BBB |
980 |
| Philippines | B |
1,033 |
| Russia | BBB |
923 |
| Turkey | B |
1,061 |
| Uruguay | B |
516 |
| Venezuela | B |
1,039 |
Table 3. CDS Basis and Sovereign Bond Characteristics
For each country, this table reports the average 5-year dollar sovereign bond yield spread and CDS basis for the period from February 26, 2001 to March 31, 2005 and summary statistics on the set of international sovereign dollar-denominated bonds that were outstanding during (either part or all of) the same period. Countries are listed in order of increasing bond spread.
| Country | Mean 5-Year CDS basis | Mean 5-Year Bond Spread | Lowest Annual Bond Coupon | Mean 5-Year Yield minus Lowest Coupon | Longest Deliverable Bond Matures in: | Mean of Lowest Bond Price |
|---|---|---|---|---|---|---|
| China | 14 | 26 | 3.75% | 0.48% | 2027 | 103.1 |
| Mexico | 36 | 156 | 4.63% | 0.87% | 2034 | 97.5 |
| Russia | 63 | 361 | 5.00% | 0.81% | 2030 | 79.1 |
| Philippines | 99 | 364 | 0.00% | 7.73% | 2030 | 88.7 |
| Colombia | 157 | 437 | 7.25% | 1.20% | 2033 | 94.1 |
| Turkey | 117 | 567 | 7.25% | 3.20% | 2034 | 94.2 |
| Venezuela | 313 | 601 | 2.25% | 6.93% | 2034 | 77.6 |
| Brazil | 215 | 818 | 7.88% | 4.54% | 2040 | 72.1 |
| Uruguay | 217 | 1,124 | 6.52% | 10.29% | 2033 | 76.5 |
| Correlation with CDS basis | 1 | 0.76 | 0.12 | 0.66 | 0.59 | -0.72 |
| (P-Value) | - | (0.02) | (0.76) | (0.05) | (0.10) | (0.03) |
Table 4. Johansen Co-integration Trace Tests
This table shows trace statistics and P-values of Johansen tests from two-equation systems in CDS premiums and bond spreads for each of nine emerging market sovereigns over the period from February 26, 2001 to March 31, 2005. Lag lengths (up to a maximum of 5 lags) were chosen on the basis of the Schwarz Information Criterion. For the two countries shown in bold face, the null hypothesis of no co-integration between the CDS premium and the bond spread is not rejected at the 5 percent level.
| Country | Number of Observations | Null Hypothesis: Zero or One Co-integrating Vectors | Null Hypothesis: Zero Co-integrating Vectors |
|---|---|---|---|
| Brazil | 1,004 |
0.96 (0.94) |
52.31* (0.00) |
| China | 933 |
8.35 (0.07) |
43.16* (0.00) |
| Colombia | 933 |
2.21 (0.74) |
35.01* (0.00) |
| Mexico | 936 |
5.18 (0.27) |
31.03* (0.00) |
| Philippines | 878 |
3.45 (0.51) |
48.62* (0.00) |
| Russia | 882 |
6.85 (0.14) |
9.19 (0.72) |
| Turkey | 1,016 |
1.60 (0.85) |
25.80* (0.01) |
| Uruguay | 495 |
3.35 (0.53) |
33.02* (0.00) |
| Venezuela | 665 |
4.95 (0.30) |
11.81 (0.47) |
Table 5. Vector Error Correction Model (VECM) Estimates
This table reports results of the Vector Error Correction model applied to 5-year U.S. dollar sovereign CDS premiums and bond yield spreads (over the swap curve) for the period from February 26, 2001 to March 31, 2005. Results are reported for the seven countries for which the results in Table 6 indicate that a co-integration relationship exists. The model is specified as follows:
![\begin{displaymath} \begin{array}[c]{l} \Delta p_{CDS,t} =\lambda_{1} (p_{CDS,t-1} -\alpha-\beta p_{BS,t-1} )+\sum\limits_{j=1}^{k} {\gamma_{1j} } \Delta p_{CDS,t-j} +\sum\limits_{j=1} ^{k} {\delta_{1j} } \Delta p_{BS,t-j} +\varepsilon_{1t}\ \Delta p_{BS,t} =\lambda_{2} (p_{CDS,t-1} -\alpha-\beta p_{BS,t-1} )+\sum\limits_{j=1}^{k} {\gamma_{2j} } \Delta p_{CDS,t-j} +\sum\limits_{j=1} ^{k} {\delta_{2j} } \Delta p_{BS,t-j} +\varepsilon_{1t}\ \end{array}\end{displaymath}](img46.gif)
![]() 2/(
2/(![]() 2-
2-![]() 1) is the
Granger-Gonzalo measure of relative contribution to price
discovery, with values above 50% implying that the CDS market leads
more often than not. Lag lengths (up to a maximum of 5 lags) are
chosen on the basis of the Schwarz Information Criterion.
1) is the
Granger-Gonzalo measure of relative contribution to price
discovery, with values above 50% implying that the CDS market leads
more often than not. Lag lengths (up to a maximum of 5 lags) are
chosen on the basis of the Schwarz Information Criterion.
| Country | χ2(2) for α=0 & β=1 (p-value) | β (std. error) | λ1 (t-statistic) | λ2 (t-statistic) | λ2/(λ2-λ1) |
|---|---|---|---|---|---|
| Brazil | 46.67 (0.00) | 1.51 (0.04) | -0.08 (-3.46) | 0.05 (4.02) | 37% |
| China | 24.57 (0.00) | 0.81 (0.15) | -0.01 (-1.03) | 0.11 (4.75) | 94% |
| Colombia | 32.24 (0.00) | 1.51 (0.08) | -0.003 (-0.21) | 0.05 (4.42) | 95% |
| Mexico | 13.23 (0.00) | 1.09 (0.10) | -0.06 (-4.06) | 0.02 (1.63) | 24% |
| Philippines | 36.30 (0.00) | 1.07 (0.11) | -0.07 (-4.35) | 0.03 (2.39) | 32% |
| Turkey | 14.45 (0.00) | 1.22 (0.08) | -0.02 (-2.06) | 0.03 (3.25) | 62% |
| Uruguay | 9.99 (0.01) | 1.87 (0.33) | -0.02 (-2.23) | 0.03 (2.85) | 59% |
| mean | - | 1.30 | - | - | 58% |
Table 6. VECM Estimates, Bid-Ask Spreads, and Bond Characteristics
Bid-ask spreads are measured as a percent of face (bonds) or notional (CDS) value. For each issuer, the figure for the bond with the lowest average daily bid-ask spread is used. The number of bonds reported reflects any outstanding for part or all of the 2001-2005 sample that would have been eligible for delivery. Countries are listed in increasing order of the estimated slope coefficient from the VECM estimation reported in Table 5. The statistics in parentheses are P-values for a null hypothesis of a zero correlation.
| Country | Mean CDS Bid-Ask Spread | Mean Bond Bid-Ask Spread | Ratio of Mean Bid-Ask Spreads | Number of Bonds | Mean of Lowest Bond Price | Slope coefficient β | CDS price leadership λ2/(λ2-λ1) |
|---|---|---|---|---|---|---|---|
| China | 0.04 | 0.37 | 9.17 | 12 | 103.1 | 0.81 | 94% |
| Philippines | 0.19 | 0.70 | 3.62 | 23 | 88.7 | 1.07 | 32% |
| Mexico | 0.20 | 0.77 | 3.90 | 25 | 97.5 | 1.09 | 24% |
| Turkey | 0.37 | 0.45 | 1.24 | 19 | 94.2 | 1.22 | 62% |
| Brazil | 0.42 | 0.43 | 1.03 | 27 | 72.1 | 1.51 | 37% |
| Colombia | 0.23 | 1.31 | 5.75 | 20 | 94.1 | 1.51 | 95% |
| Uruguay | N.A. | 1.70 | N.A. | 23 | 76.5 | 1.87 | 59% |
| Correlation with: λ2 / (λ2-λ1) | -0.39 (0.45) | 0.17 (0.72) | 0.66 (0.16) | -0.80 (0.03) | - | -0.01 (0.99) | 1 |
| Correlation with: β | 0.77 (0.08) | - | -0.57 (0.24) | - | -0.77 (0.04) | 1 | - |
Figure 1. Average CDS Basis versus Average Bond Spread
Because it is associated with the probability of a default event, we use the bond spread as a rough proxy for the relative probability that a CDS protection buyer will have an opportunity to exercise a cheapest-to-deliver option before the CDS contract matures.
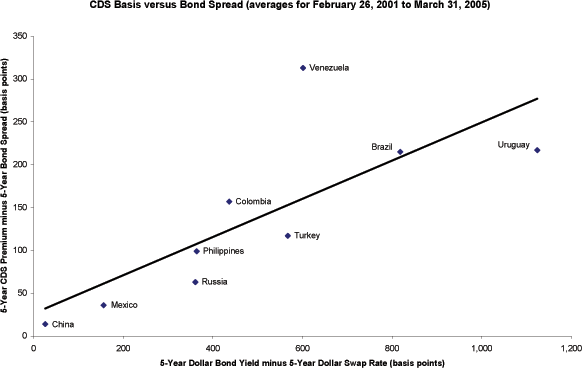
Figure 2. Average CDS Basis versus Lowest Bond Price
We use the issuer's lowest-priced bond as a rough proxy for the relative value (upon a default event) of the cheapest-to-deliver bond.
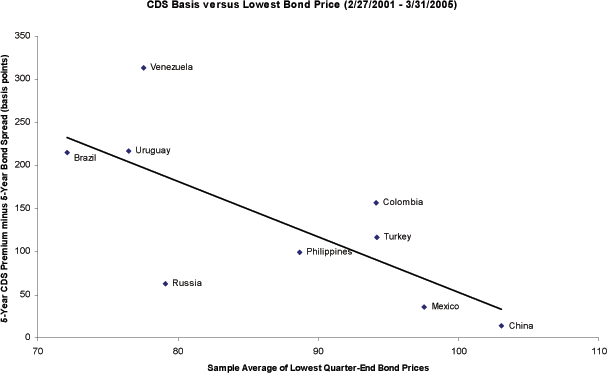
Figure 3. Sovereign CDS Premiums and Bond Spreads
This figure plots the time series of 5-year dollar sovereign CDS premiums and bond yield spreads (with the swap rate as the risk-free rate) in nine emerging markets over the period of February 26, 2001 - March 31, 2005.
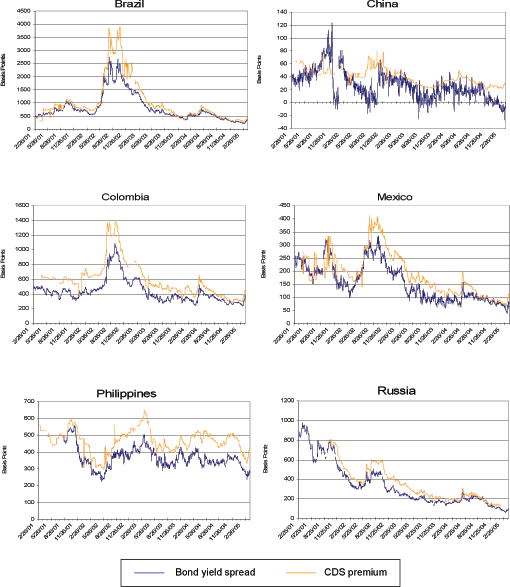
Figure 3 (continued). Sovereign CDS Premiums and Bond Spreads
This figure plots the time series of 5-year dollar sovereign CDS premiums and bond yield spreads (with the swap rate as the risk-free rate) in nine emerging markets over the period of February 26, 2001 - March 31, 2005.
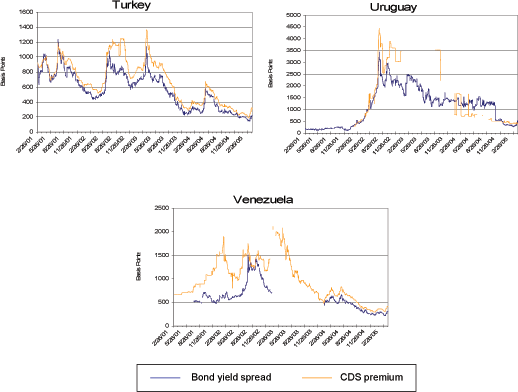
Figure 4. VECM Estimates of the Share of the CDS in Price Leadership [λ2 / (λ2 - λ1)] versus Ratio of Bid-Ask Spreads
We use the ratio (from Table 6) of the average bid-ask spread for the reference entity's most liquid bond to the average bid-ask spread for the 5-year CDS as a rough proxy for the relative liquidity of the CDS.
![Figure 4 shows the VECM estimates of the share of the CDS in price leadership [λ2 / (λ2 - λ1)] versus ratio of bid-ask spreads for China, Mexico, Philippines, Brazil, Turkey and Columbia over the period of February 27, 2001 – March 31, 2005. We use the ratio (from Table 6) of the average bid-ask spread for the reference entity’s most liquid bond to the average bid-ask spread for the 5-year CDS as a rough proxy for the relative liquidity of the CDS. The positive slope of the trend line in the scatter plot shows a positive correlation of the GG measure with the ratio of the bond bid-ask spread to the CDS bid-ask spread.](figure4.gif)
Figure 5. VECM Estimates of the Share of the CDS in Price Leadership [λ2 / (λ2 - λ1)] versus Number of Eligible Bonds
We use the number of different sovereign bonds eligible for delivery against the CDS contract (from Table 6) as a rough proxy for the issuer's overall bond market liquidity.
![Figure 5 shows the VECM estimates of the share of the CDS in price leadership [λ2 / (λ2 - λ1)] versus number of eligible bonds for China, Mexico, Philippines, Brazil, Turkey, Uruguay and Columbia over the period of February 27, 2001 – March 31, 2005. We use the number of different sovereign bonds eligible for delivery against the CDS contract (from Table 6) as a rough proxy for the issuer’s overall bond market liquidity. The negative slope of the trend line in the scatter plot implies a negative relation between the number of eligible bonds and the GG measure of CDS price leadership.](figure5.gif)
Figure 6. VECM Long-Run Slope Coefficient Estimates (β from Table 5) versus Lowest Bond Price
We use the issuer's lowest-priced bond as a rough proxy for the relative value (upon a default event) of the cheapest-to-deliver bond. The cheapest-to-deliver option should also be reflected in the sensitivity of CDS premiums to bond spreads (i.e., the slope coefficient).
Footnotes
* Staff economists of the Division of International Finance of the Federal Reserve Board. The authors are indebted to Jennifer Judge for her excellent research assistance. We also thank Mark Carey, Jon Faust, Jingzhi Huang, Jaime Marquez, Jon Wongswan, Hao Zhou, Haibin Zhu, and seminar participants at the Federal Reserve Board and 2006 Global Finance Conference for helpful comments and/or assistance. The views in this paper are solely the responsibility of the authors and should not be interpreted as reflecting the views of the Board of Governors of the Federal Reserve System or of any other person associated with the Federal Reserve System. Contacts: [email protected] (202)452-2349; [email protected] (202)452-3540. The views in this paper are solely the responsibility of the authors and should not be interpreted as reflecting the views of the Board of Governors of the Federal Reserve System or of any other person associated with the Federal Reserve System. Return to text
1. In a CDS contract, one party (the protection seller) agrees to compensate the counterparty (the protection buyer) if a particular debtor (the reference entity, or name) experiences any one of a number of defined credit events that indicate it is unable or may be unable to service its debts. In exchange, the protection seller receives a premium, typically expressed as a per annum rate in basis points on the amount of coverage (the notional amount). The premium is paid quarterly or semi-annually until either the maturity date of the contract or the occurrence of a credit event. Return to text
2. In particular, they find that for two variations on CDS contracts that both define debt restructuring as a credit event, the "modified restructuring" contract, which limits deliverable obligations to those with a maturity at most 30 months after the termination of the CDS contract is quoted on average 2.77 percent or 3.36 basis points higher than a similar contract without this restriction. Return to text
3. See Duffie and Liu (2001) for a discussion of floating-fixed credit spreads. Return to text
4. Market participants often refer to CDS premiums as "CDS spreads", which is slightly misleading, since they are not measured as a difference between two prices. However, this practice highlights the notion that they are seen as analogous to yield spreads. Return to text
5. Mark-It's "CR" quotes refer to contracts where restructuring is a credit event. See Packer and Zhu (2005) for a comparison of four documentation variations that have been used in CDS (they refer to this variation as "FR"). Return to text
This version is optimized for use by screen readers. Descriptions for all mathematical expressions are provided in LaTex format. A printable pdf version is available. Return to text