
Board of Governors of the Federal Reserve System
International Finance Discussion Papers
Number 939, August 2008 --- Screen Reader
Version*
Foreign Exposure to Asset-Backed Securities of U.S. Origin
NOTE: International Finance Discussion Papers are preliminary materials circulated to stimulate discussion and critical comment. References in publications to International Finance Discussion Papers (other than an acknowledgment that the writer has had access to unpublished material) should be cleared with the author or authors. Recent IFDPs are available on the Web at http://www.federalreserve.gov/pubs/ifdp/. This paper can be downloaded without charge from the Social Science Research Network electronic library at http://www.ssrn.com/.
Abstract:
The financial turmoil which began in August 2007 originated, in part, because investors reassessed the quality of the assets underlying many asset-backed securities (ABS), particularly U.S. mortgages. The prominence of European banks in the early stages of the turmoil created the perception that foreigners held an outsized share of risky U.S. securities and prompted questions of why Europeans were so exposed. This paper evaluates that perception by quantifying foreign exposure to ABS with U.S. underlying collateral. Using the latest survey data on foreign portfolio holdings of U.S. securities, we find that the ultimate losses that foreigners could incur arising from U.S. underlying assets are small relative to most scale variables, although initial total mark-to-market losses are estimated to be significantly larger. Among other reasons for this difference between ultimate and initial losses, we demonstrate that the securitization chain can amplify mark-to-market price declines in the presence of uncertainty or illiquidity. Finally, we show that, relative to the size of the market, foreigners' holdings of U.S. mortgage-backed securities do not appear to be elevated compared with their holdings of other U.S. assets.
Keywords: Financial turmoil, securitization, ABS, mark-to-market
JEL classification: G15, G20
I Introduction
The financial turmoil that began in August 2007 originated, in part, because investors reassessed the quality of the assets underlying many asset-backed securities (ABS), particularly U.S. mortgages. The prominence of European banks in the early stages of the turmoil created the perception that foreigners held an outsized share of risky U.S. securities and prompted questions of why Europeans were so exposed. This paper evaluates that perception by quantifying foreign exposure to ABS with U.S. underlying collateral. Using the latest survey data on foreign portfolio holdings of U.S. securities, we anticipate that the ultimate losses that foreigners could incur arising from U.S. underlying assets are small relative to most scale variables; although initial total mark-to-market losses are expected to be significantly larger. The main reason for the difference is that the base used in calculating ultimate losses is about one-third of that used in calculating mark-to-market losses. Also, the loss rates for calculating mark-to-market losses are higher because they include illiquidity discounts, and these discounts can be further amplified along the securitization chain. Finally, we show that, relative to the size of the market, foreigners' holdings of U.S. mortgage-backed securities (MBS) do not appear to be elevated compared to their holdings of other U.S. assets.
The general term "exposure" has been used widely in the press and turmoil analyses, but it is rarely a well-defined concept. For example, exposure of a specific set of entities, such as European banks, is different than the exposure of the whole foreign sector. Similarly, exposure for regulatory purposes may differ from ultimate expected losses. Therefore, to address our question of how much foreigners would lose, we first develop a conceptual framework for understanding exposure. We then quantify foreign holdings of, and exposure to, ABS whose underlying collateral originated in the United States. We consider a broad set of underlying assets, encompassing not just residential mortgages but also several types of consumer loans and commercial mortgages.1 This choice of assets is partly determined by data availability but also seems appropriate as the turmoil has raised uncertainty about the creditworthiness of many similar types of collateral.
This paper focuses on high-quality estimates for the base (holdings or exposure) used to calculate mark-to-market and ultimate losses to foreigners and only provides round figures for loss rates as a hypothetical scenario. Our estimate of gross foreign exposure provides the appropriate base to calculate foreign mark-to-market losses. Using a hypothetical 20 percent markdown in the price of all ABS held by foreigners, we estimate that foreign mark-to-market losses will be $475 billion. Our estimate of net foreign exposure can be used to calculate ultimate losses that foreigners will incur in the long run. Using a hypothetical scenario of default rates and recovery rates, we estimate foreign ultimate losses of about $75 billion. We show that our estimates of foreign losses are consistent with those implied by the global loss estimates reported by the International Monetary Fund (IMF) (2008) and Greenlaw et al. (2008).
The following outlines the remainder of this paper. The next section provides a brief overview of the ABS market. Sections III, IV, and V define and measure three different exposure concepts: gross foreign exposure, foreign holdings of U.S.-issued assets, and net foreign exposure. In section VI we estimate a "pure" version for each of these concepts by parsing out the collateral of mixed country origin. In section VII we estimate ultimate losses and mark-to-market losses to foreigners from holding U.S. assets. In section VIII we discuss how the illiquidity discounts are amplified along the securitization chain. Section IX compares our loss estimates to those obtained in other studies of the financial turmoil. Section X concludes by addressing the question of whether or not foreigners hold a disproportionate share of risky ABS. For the most problematic assets, those backed by U.S. nonconforming mortgages, we find that foreigners' holdings are not disproportionate to their holdings of other U.S. assets.
II Asset-Backed Securities
Traditional ABS are issues of medium-term and long-term notes that are usually backed by long-term receivables such as residential mortgages, commercial mortgages, home equity loans, auto loans, credit card loans, and student loans. That is, traditional ABS are the secondary assets with indirect exposure to the credit risk of the underlying assets. The assets underlying ABS often take the form of a pass-through, or trust, certificate that gives the owner of the certificate the right to the cash flows generated by the underlying assets. This trust certificate is often not a publicly traded security. We consider the unpooled whole loans and the trust certificates for the pooled loans to be the underlying assets because they are typically not mixed with other collateral.2 We also refer to them as primary assets.
ABS can be structured with various maturities, can be issued in any country and in any currency, and can have various legal structures. They are often repackaged several times, making it difficult to keep track of the original underlying assets. Repackaged securities are generally issued by special-purpose vehicles (SPVs) or structured investment vehicles (SIVs)--entities created solely for this purpose. Different issues of ABS with similar risk-return characteristics, often mixed with other types of collateral, can be repackaged as collateralized debt obligations (CDOs).3Entities can, in turn, issue short-term asset-backed commercial paper (ABCP) to finance the purchase of both CDOs and traditional ABS.4 We will generally use the term ABS to refer to all secondary assets, both long term and short term--that is, ABS, CDOs, medium-term notes, and ABCP.
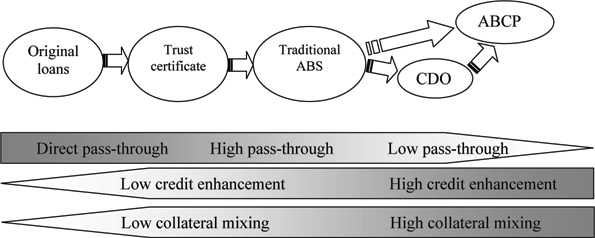
Figure 1 illustrates the various types of securities created in a typical repackaging chain. Each stage of the repackaging may be undertaken by a different entity, domestic or foreign, and may collateralize the new security with assets from many sources. Typically, the securities at the beginning of the chain have a high degree of pass-through. That is, the returns closely reflect the flows coming from the underlying assets. In particular, we assume that in the first stage of packaging, from whole loans to trust certificate or other security, the pass-through is direct.5 As these securities move from traditional ABS to CDOs and then to ABCP, the use of credit enhancements makes the contractual returns to the investors less dependent on the flows originating from the underlying asset. Issuers of these securities can hedge some of the default risk on the underlying assets through the use of credit derivatives. Liquidity support facilities also serve to guarantee that outside capital can be brought in on a contingent basis. These features are more and more predominant as we move further down the repackaging chain. Finally, we note that in the early stages of repackaging, there is very little mixing of different types of collateral. On the other hand, CDOs and ABCP can be backed by multiple types of collateral, which can include high-quality unsecured corporate debt and other instruments whose credit worthiness were not questioned in the turmoil.
Figure 1: Various securities generated by multiple repackaging
Our measures of exposure include exposure to all types of collateral found in ABS. While quite broad, these measures are still relevant because investors cannot choose to separate the good collateral from the bad when trading a composite security. Therefore, any hint of problems in the collateral taints the entire issue of ABS to some degree. Our measures include exposure to all of the types of assets that we have discussed, from original loans and private trust or pass-through certificates to public issues such as ABS, CDOs, synthetic CDOs, and ABCP.
The three measures of exposure we introduce, in order of decreasing magnitude, are: gross foreign exposure, foreign holdings of U.S.-issued assets, and net foreign exposure. We first define these concepts and illustrate them with a simple example. We initially will ignore the fact that some ABS held by foreigners are backed not only by U.S. collateral but may have some foreign collateral mixed in as well. These measures include ABS backed by unmixed U.S. collateral and mixed country collateral but exclude those backed by unmixed foreign collateral. Later, we will introduce a "pure" version for each of these three concepts, which will allow us to focus on exposure to exclusively U.S. collateral.
III Gross Foreign Exposure
We define gross foreign exposure as foreign holdings of both primary and secondary assets backed by collateral containing any U.S. assets, regardless of whether the asset (in the case of secondary assets) was issued by a U.S. entity or a foreign entity. This definition of gross foreign exposure is perhaps closest to what market participants are referring to when using the term exposure generally. Figure 2 illustrates how gross foreign exposure is generated abroad. The entities are named according to whether they are domestic (D) or foreign (F), as well as according to their position in the securitization chain. For the sake of illustration, we assume that all underlying assets originated in the United States and also that all ABS are purely pass-through securities. In reality, the different legal structures and the use of credit derivatives affect how much risk is passed on through the chain. Also, for simplicity, in these examples we will discuss ultimate losses to foreigners assuming a 100 percent default rate followed by a 0 percent recovery rate on the underlying U.S. assets.
Figure 2: Gross foreign exposure, foreign holdings, and net foreign exposure
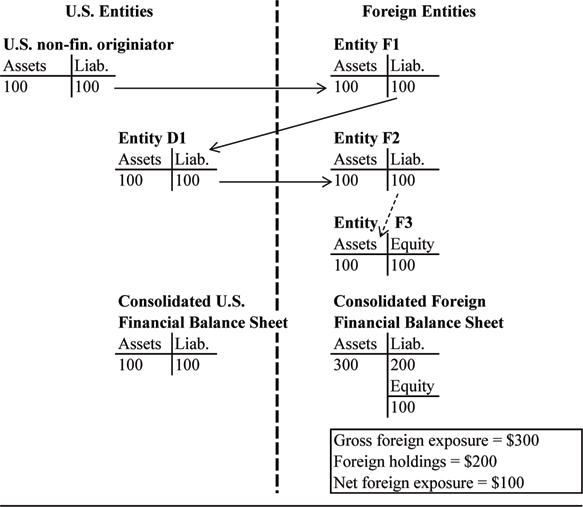
Note: Dashed lines denote transactions or positions not captured in the Treasury International Capital (TIC) system.
In this example, the U.S. originator sells $100 of ABS to foreign entity F1. F1 repackages the ABS and sells it to U.S. entity D1. D1 repackages it once again and sells it to foreign entity F2. A final repackaging is done by F2, which issues ABS and sells it to foreign entity F3. Gross foreign exposure equals $300 and is the sum of the assets of F1, F2, and F3. Gross foreign exposure overstates the ultimate losses that foreigners would incur should the underlying assets devalue. If the U.S. underlying assets experienced a default rate of 100 percent (with zero recovery), the only entity that would incur losses would be F3, whose assets would drop by $100. The other entities with no equity capital would experience an offsetting drop in their liabilities.
To measure gross foreign exposure, we must separate it into two components. The first is foreign holdings of ABS and primary assets issued by U.S. entities. The second is foreign holdings of ABS issued by foreign entities. To capture foreign holdings of ABS issued by U.S. residents, we use data from the "Report on Foreign Portfolio Holdings of U.S. Securities as of June 30, 2007" (Department of the Treasury, 2008). In the diagram above, these correspond to the liabilities of the U.S. originator and U.S. entity D1 vis-à-vis foreign entities F1 and F2, respectively. Holdings of the primary assets are based on monthly Treasury International Capital (TIC) reports. Table 1 summarizes our exposure estimates, and table 2 provides the details on these estimates. As of June 2007, our estimate for this first component is $1.2 trillion, as shown in line 10 of table 2 (middle column).6 To capture foreign holdings of ABS issued by other foreign entities (that is, the assets of F3 in the diagram), we first determine the total amount of foreign-issued ABS (which could be held by U.S. or foreign entities), and then subtract the portion that is held by U.S. residents. In table 2, this number can be obtained by adding lines 11 and 14, then subtracting line 17. The result is roughly $1.4 trillion.7Therefore, after rounding, we estimate gross foreign exposure to be the sum of these two figures, or $2.6 trillion (table 2, line 9). To put this figure in perspective, it is about 7 percent of foreign market capitalization (table 1, line 1). The range of uncertainty around these estimates is shown in the first column of table 2. The uncertainty mainly comes from three sources. First, there is uncertainty regarding how well the cross-border transactions involving primary assets (for example, whole loans or trust certificates) are being captured in the Treasury data. Second, there is substantial uncertainty regarding the collateral composition in terms of U.S. versus foreign origin. Finally, there is uncertainty about whether the issuer is a U.S. or foreign entity, especially for the ABCP programs.
IV Foreign Holdings of U.S.-Issued Assets (Nets out foreign claims on foreign issuers)
Since some foreigners have claims on each other, gross foreign exposure overstates the ultimate losses arising from U.S. underlying assets that foreigners could incur even if the underlying assets lost all of their value. Many offshore foreign entities that finance the purchase of ABS by issuing a repackaged ABS are "shell" companies with virtually no equity. To the extent that the securities they issue are pass-through securities, a downward reassessment of their assets would be equally matched by a corresponding decrease in the value of their liabilities, with no direct losses incurred. In figure 2, foreign entities F1 and F2 acquired their assets from U.S. entities. However, F3 acquired its assets from foreign entity F2. F2 can be viewed as an offshore shell company that simply issued an ABS to finance the purchase of another ABS.8 Therefore, the transaction between F2 and F3 generated additional exposure without the creation of additional underlying collateral. When we net out the claims of F3 on the foreign issuer F2, we arrive at our definition of foreign holdings of U.S.-issued assets. Specifically, foreign holdings are defined as only those holdings of primary and secondary assets that were issued by U.S.-resident entities. In the example illustrated by figure 2, foreign holdings are $200, which corresponds to the holdings of foreign entities F1 and F2. Using data from the Treasury, we estimate that these foreign holdings were about $1.2 trillion as of June 2007. Details regarding this estimate are shown in lines 1 through 8 of table 2. These foreign holdings represent about 28 percent of the total liabilities of U.S. ABS issuers (table 1, line 3).
V Net Foreign Exposure (Nets out U.S. claims on foreign issuers)
Foreign holdings still overstate potential ultimate losses to foreigners stemming from the reduction in value of U.S. primary assets because the securitization chain can go back and forth between the United States and abroad. This cross-border activity generates more foreign holdings (and exposure) even though the amount of underlying assets remains the same. Therefore, it is useful to introduce a concept, net foreign exposure, which ensures that no more than one dollar of exposure is generated for each dollar of primary assets. This measure nets out the U.S. holdings of ABS that were issued by foreign entities but backed by U.S. assets.
Figure 2 illustrates the concept of net foreign exposure. Both gross foreign exposure ($300) and foreign holdings ($200) overstate the losses that foreigners would incur should the underlying assets devalue. If the U.S. assets lost all of their market value, each entity's assets would decline by $100, but only entity F3 would lose equity. The other entities with no equity capital would experience an offsetting drop in their liabilities. Our concept of net foreign exposure is the maximum long-run potential losses that foreigners could incur by holding assets of U.S. origin. Net foreign exposure in this example equals foreign holdings of U.S.-issued assets ($200) minus U.S. residents' claims on foreign entities in the form of ABS. Since U.S. entity D1 purchased the ABS from foreign entity F1, it has $100 in claims on foreigners. Therefore, the result for net foreign exposure is $100.
Based on the "Report of U.S. Portfolio Holdings of Foreign Securities as of December 31, 2006" (Department of the Treasury, 2007), we estimate that U.S. residents' claims on foreigners in the form of ABS backed by U.S. assets totaled $110 billion (table 2, line 26). We also net out U.S. claims on foreigners in the form of intercompany loans made by U.S. ABCP and medium-term note issuers to their foreign parents, which are estimated at $245 billion (line 27). Netting out both of these claims from foreign holdings of U.S.-issued ABS and primary assets, we estimate that net foreign exposure (line 24) was roughly $0.8 trillion as of June 2007.
VI Pure Foreign Exposure and Holdings
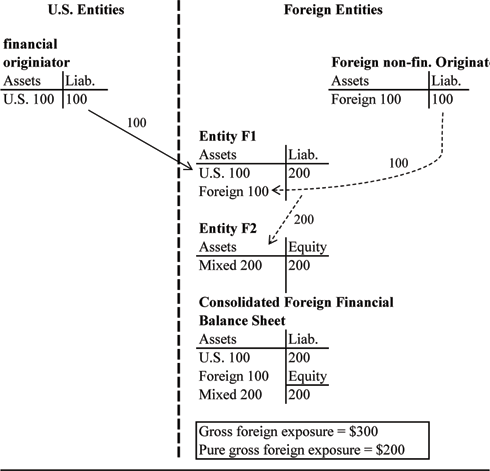
Frequently, secondary repackaging combines collateral of foreign origin with assets backed by collateral ultimately of U.S. origin. When this occurs, it is generally possible for the entity that constructed the ABS to distinguish the U.S. collateral from foreign collateral, but it is usually difficult for subsequent purchasers of later-generation ABS to disentangle its origins. Because of uncertainty regarding the collateral composition of ABS when collateral of various countries is mixed (just as when safe assets are combined with problematic assets), the prices of these securities also declined for fear that they might contain the U.S. assets in question. So far, our measures for gross foreign exposure, foreign holdings, and net foreign exposure treat any ABS with either U.S. collateral or mixed collateral as foreign exposure to U.S. ABS because it was "tainted" by U.S. underlying assets. However, in order to know the genuine exposure of foreigners to the U.S. assets, we must introduce a pure version for each of our estimates.
The concept of pure exposure is illustrated in figure 3. In this example, foreign entity F1 purchases assets from two different sources, one of entirely U.S. origin and another of entirely foreign origin. Using these underlying assets, F1 issues an ABS of $200, which is purchased by F2. As a result, the ABS held by F2 is collateralized by assets that are 50 percent from U.S. origin and 50 percent from foreign origin. If entity F2 were to parse through the assets underlying the mixed-collateral ABS it holds, it would find $100 of assets from U.S. origin.
In this example, gross foreign exposure to U.S. underlying assets is $300, coming from the $100 in unmixed U.S. assets held by F1 and all of the $200 in mixed assets held by F2. In contrast, pure gross foreign exposure is $200, coming clearly from the $100 in unmixed U.S. assets of F1 but also from the portion (50 percent) of the mixed assets of F2 that represent collateral that originated from the United States. Notice that this cannot be calculated without knowing the whole history of the securitization chain, something market participants may not know. Nonetheless, it is the concept that is relevant to understand what portion of gross foreign exposure can be directly affected by the default of U.S. underlying assets. Similarly, pure foreign holdings and pure net foreign exposure can be derived by summing up the unmixed U.S. collateral with the U.S. portion of the mixed-country collateral.9
We cannot measure pure gross foreign exposure, pure foreign holdings, and pure net foreign exposure without knowing the portion of mixed collateral that actually originated in the United States. These estimates can, however, be bounded by counting 0 percent of mixed collateral and 100 percent of mixed collateral. The lower and upper bounds for the pure measures are shown in the third column of table 2. Pure gross foreign exposure is estimated to be between $2.1 trillion and $2.6 trillion (line 9). Pure foreign holdings are estimated to be between $1.1 trillion and $1.2 trillion (line 1). Pure net foreign exposure is estimated to be between $0.7 trillion and $0.8 trillion (line 24).
Figure 3: Pure gross foreign exposure
Note: Dashed lines denote transactions or positions not captured in the Treasury International Capital (TIC) system.
VII Ultimate versus Mark-to-Market Losses
Thus far, we have given only estimates for foreign holdings of and exposure to U.S. underlying assets, not their losses. Ultimate losses are losses that remain after workouts are completed and all recoveries are received. Therefore, for estimating foreign ultimate losses arising from the U.S. assets they hold, we need to apply default and recovery rates to net foreign exposure, because this treatment ensures that no more than one dollar of exposure is generated for each dollar of primary assets. Our ultimate loss estimates are based on expected defaults on underlying assets, such as U.S. nonconforming mortgages and student, credit card, auto, home equity, and corporate loans.10 In contrast, mark-to-market "losses" represent markdowns that foreign entities would make to their assets when the prices of the securities they hold are adjusted to reflect current market prices. In other words, the losses are generated by a price markdown on gross foreign exposure. (The exception is the direct pass-through stage that packages whole loans into trust certificates; these whole loans are included in gross foreign exposure but not in the base to which mark-to-market losses are applied.)11 In the long run, some of these markdowns on the assets that make up gross foreign exposure may be recovered if ABS prices are readjusted upward.12
The right-hand portion of table 1 shows how the exposure estimates translate into the two types of losses. From the Treasury data, we can decompose net foreign exposure into about $650 billion in ABS backed by nonconforming mortgage loans (line 5) and a remainder of $185 billion.13 If we assume a default rate of 20 percent on nonconforming mortgages and a recovery rate of 50 percent, the direct ultimate losses to foreigners related to these mortgages would be about $65 billion.14 The remaining $185 billion of net foreign exposure consists of ABS backed by a variety of asset classes, such as student, credit card, home equity, auto, and corporate loans (line 6). We expect defaults in these sectors to be somewhat lower than those in the U.S. nonconforming mortgage sector. Therefore, after assuming a default rate of 10 percent with a recovery rate of 50 percent, we obtain additional ultimate losses of $10 billion related to these holdings.15 By adding these figures, lines 5 and 6 of table 1, we arrive at expected ultimate losses of about $75 billion. These hypothetical losses represent about one-half of 1 percent of total foreign claims on the United States (line 7).
When estimating mark-to-market losses, we need to consider not only the discounts affecting security prices from higher expected credit risk but also discounts generated by uncertainty and illiquidity. The turmoil brought increased uncertainty about the credit risk of underlying loans but, importantly, it also highlighted the lack of transparency in these securities, creating a "lemons" problem. When potential buyers are unsure of the composition of assets underlying the securities and unsure about what parts of the chain will bear the losses, their uncertainty brings down prices as if each security in a repackaging chain contained bad collateral and would bear the loss. The illiquidity caused by this uncertainty induces further downward pressure on prices. Given these factors, we apply an average 20 percent markdown to gross foreign exposure less whole loans ($2.6 trillion - 0.2 trillion = $2.4 trillion), yielding mark-to-market "losses" to foreigners of roughly $475 billion (table 1, line 2).16 These mark-to-market losses are about six times larger than the expected ultimate losses of $75 billion to foreigners.
VIII Amplification of Illiquidity Discounts
The difference between ultimate losses and mark-to-market losses can be broken into two dimensions: the difference in the base and the difference in the rate of loss applied to that base. This paper has explained in detail the difference in the two bases for our ultimate loss and mark-to-market calculations: net foreign exposure and gross foreign exposure. Moving to the second difference, this section discusses why the rate of markdown used in the mark-to-market exercise is larger than the default rate (after recovery) used in the ultimate loss scenario.
First, since ultimate losses are long-run outcomes by definition, they only include credit risk and not any discounts stemming from illiquidity or uncertainty in the market that will be resolved in the long run. The financial turmoil has put downward pressure on prices of structured finance products across the whole spectrum of securities shown in figure 1, even those with only minimal ties to the riskiest underlying assets.17 As mentioned above, in addition to discounts from higher expected credit risk, large mark-to-market discounts are generated by uncertainty about the quality of the underlying assets, by illiquidity, and by price volatility. Since these factors are all closely related and undistinguishable from one another in aggregate data, we will refer to the price discounts they generate as the illiquidity discount.
This illiquidity discount is the main reason why the mark-to-market discount used here, and in most similar analyses, is larger than the expected credit default rates on underlying assets. Moreover, this discount can be magnified along the securitization chain when there is lack of transparency, exaggerating the size of mark-to-market discounts even further.18 Figure 4 illustrates how the amplification of the illiquidity discount occurs. This example uses the same securitization chain shown previously in figure 1. A mortgage pool is securitized as a trust certificate, which in turn is re-packaged as a traditional ABS that becomes the collateral for a CDO, which finally becomes the underlying asset of ABCP. The key assumption is how much information market participants have regarding the price of underlying securities (or the characteristics necessary to accurately estimate a market price in the case of securities that are not traded). An investor holding an ABS (in the general sense) only observes the prices of the securities that are one step removed from it in the securitization chain. For example, an investor holding a CDO can observe the price of the ABS underlying that CDO but cannot observe the price of the trust certificate which underlies the ABS, because the trust certificate is two steps removed from the CDO in the chain.
Figure 4: Amplification of the illiquidity discount
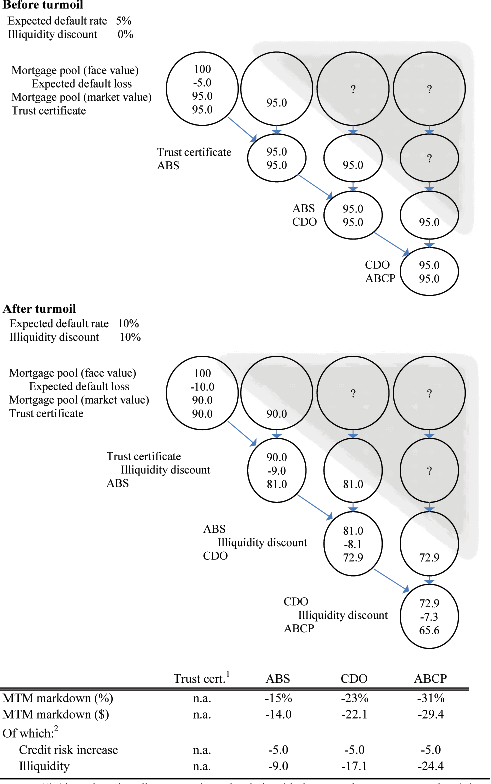
Notes:
(1) Since there is a direct pass-through relationship between the mortgage pool and the trust certificate, there is no balance sheet and therefore no need for mark-to-market accounting.
(2) In practice, one cannot separate the price markdowns into the credit components and the illiquidity component. We treat them separately here to illustrate how the illiquidity discount gets magnified along the chain.
The top panel of figure 4, labeled "Before turmoil," illustrates how the securities along the chain would be priced if the expected default rate on the original mortgages were 5 percent and there was no illiquidity discount. The absence of the illiquidity discount implies that investors perceive the securities to be liquid and that they believe prices accurately reflect expected credit losses. To price the mortgage pool and trust certificate, the face value of the underlying mortgages is discounted for the expected default losses ($5). An investor purchasing the ABS knows that it is backed by the trust certificate and believes that the market price of $95 for that trust certificate accurately reflects the expected default loss associated with it. Thus, no further price discounts are applied to the ABS, and its market price is the same as that of the trust certificate. Similarly, the investor holding a CDO knows that it is backed by an ABS priced at $95 and has complete faith in this price.
The bottom panel, labeled "After turmoil," illustrates how these same securities would be priced if the expected default rate increases to 10 percent and market participants lose faith in the prices. Market participants are no longer sure whether the prices of the underlying assets accurately reflect expected credit losses. They are also unsure to what extent the effect of illiquidity has already been incorporated into the price of the underlying asset.19 Therefore, at every stage along the securitization chain, investors demand an illiquidity discount that is applied to the observed price of the underlying asset. However, since each discounted security later becomes the underlying asset of the next security in the chain, the illiquidity discounts are applied to prices that have already been discounted, resulting in a magnification of the mark-to-market markdowns along the chain. Referring back to the bottom panel of the figure, market participants price the ABS by applying the illiquidity discount to the observed price of the trust certificate underlying it. Similarly, market participants price the CDO by marking down for illiquidity the ABS that underlies it, unaware that the ABS has already been marked down previously in the chain.
Thus, in this example, the market price of the ABCP ($65.60) at the end of chain incorporates an illiquidity discount that has been applied three times, resulting in a 31 percent markdown from its pre-turmoil price of $95. In contrast, the ABS earlier in the chain only incorporated one illiquidity discount and thus has a smaller markdown of 15 percent relative to its pre-turmoil price of $95. The percentage and dollar markdowns are noted at the bottom of the figure, along with their decomposition into credit risk and illiquidity components. In practice, of course, market participants cannot decompose the price markdowns into these components. This decomposition, however, is useful to illustrate how the illiquidity discount becomes magnified along the chain.
Ultimate losses in this example total $10; of this, $5 was expected before the turmoil and $5 is the additional post-turmoil loss on the primary asset from increased defaults. However, summing across all entities in the chain, the markdown from increased credit risk is $15. This larger markdown is the effect of the larger base-that is, the larger gross exposure-created by the securitization chain. In addition, the rate of markdown for each entity includes not only the 5 percentage point increase in expected loss from credit risk, but also the 10 percent illiquidity discount. The amplification of that discount, which is also caused by the securitization chain, results in an even higher average markdown; in this case, the average markdown across the three entities is 23 percent.
There may be some evidence of such amplified markdowns in market prices during the turmoil. If price markdowns were only a result of upward reassessment of credit risk for U.S. mortgages, diversified securities further down the securitization chain (for example, CDOs) should experience smaller price declines than securities earlier in the chain, such as MBS. However, the amplification of the illiquidity discount described above would imply that CDOs could experience larger price declines than the securities which underlie them in the chain. We find some evidence that CDO prices were marked down more than the prices of the underlying loans themselves.
Figure 5: CDO versus ABS-subprime spreads
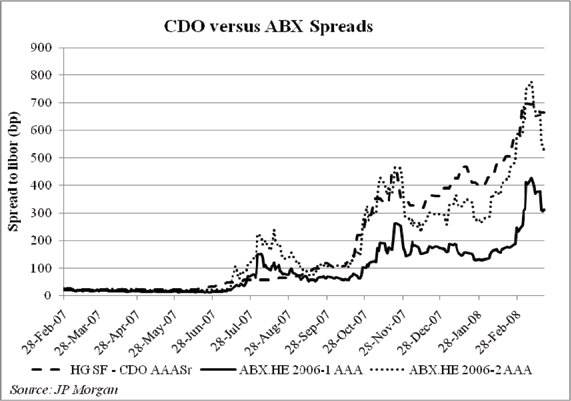
To illustrate how severely CDOs were affected during the turmoil, figure 5 compares the spread to the London interbank offered rate, or Libor, of a CDO index with that of two ABS indices consisting only of subprime home equity loans. The CDO index consists of high-grade structured finance CDOs that are collateralized by senior-AAA tranches of ABS. The two ABX indices each consist of 20 AAA-rated pass-through ABS collateralized entirely by subprime home equity loans originated in 2005 (2006-1) and 2006 (2006-2).20 Before the financial turmoil began, all three indices were relatively flat with spreads of roughly 20 basis points above the three-month Libor rate. By March 2008, the CDO index showed spreads that were twice as high as the 2006-1 subprime ABX index and slightly higher than the 2006-2 subprime ABX index. The CDOs that make up this index contain only a portion of subprime loans in their collateral, yet they experienced similar or larger price markdowns than the pass-through certificates securitized entirely by subprime loans. Thus, it seems that the markdown on CDOs was as large as or larger than the markdown on its riskier components. A Moody's 2008 report shows that this pattern is not limited to structured finance CDOs, but also is apparent in collateralized loan obligations and synthetic corporate CDOs relative to their underlying assets. It may be that the senior-AAA tranches backing the CDOs were more severely downgraded because their quality was below average for their class. However, amplification of either illiquidity or "lemons" discounts along the securitization chain would also explain the phenomena.
IX Comparison to Other Loss Estimates
To this point, we have focused on the exposure and loss incurred by foreigners. However, other papers on the subject of the turmoil have estimated global losses with no distinction between the losses accruing to U.S. and foreign residents. To compare our work with that of others, we need global counterparts to our bases for both ultimate losses and mark-to-market losses. We derive this information mainly from the Flow of Funds data (Federal Reserve Board, 2008). The appropriate base for ultimate losses is the total amount of U.S. mortgages and consumer loans outstanding. This category includes loans that went into the securitization chain (table 4, top panel) and ultimately held by U.S. and foreign residents as well as unsecuritized loans (table 4, bottom panel) that stayed on the balance sheets of U.S. entities. The appropriate base for mark-to-market losses is all ABS outstanding (table 5, line 1)-that is, traditional ABS, CDOs, and ABCP issued both in the United States and abroad.21 In each case we apply our hypothetical loss rates (default rate times recovery rate) or markdowns to the global bases to obtain hypothetical global loss estimates.
IX.1 The IMF Estimate
In its April 2008 Global Financial Stability Report the IMF estimates that losses to the global financial system originating from U.S. underlying assets will total $945 billion. Although labeled mark-to-market losses, this estimate is not directly comparable to ours, primarily because it is a hybrid of ultimate losses on unsecuritized loans ($225 billion) and mark-to-market losses on securitized loans ($720 billion). Futhermore, detail on foreign losses is only provided for subprime loans held by the banking sector.
For ultimate losses, the IMF only gives estimates for unsecuritized loans, not for loans that went into the securitization chain. In the bottom panel of table 4, we compare their loss estimates for unsecuritized loans to our hypothetical global loss estimates. To make the composition of the unsecuritized bases comparable, we use all mortgages (including conforming prime mortgages) in our base and exclude corporate loans from the IMF's base. Using our hypothetical net loss rates of 10 percent for the nonconforming mortgages, 0 percent for conforming prime mortgages, and 5 percent for other loans, we obtain an estimate of $420 billion in ultimate losses to the U.S. entities that hold these loans (line 6). The IMF's loss estimate of $165 billion is much smaller.22However, if we use the same loss rates as the IMF, our comparable figure would be $170 billion. Therefore, the difference between the IMF's unsecuritized estimates and ours (which do not use foreign holdings data) stems primarily from the loss rate assumption.
More relevant to this paper is the IMF's estimate for mark-to-market losses on securities. Table 5 makes a similar set of comparisons for mark-to-market losses that table 4 did for ultimate losses. For comparability, table 5 includes outstanding agency and government-sponsored enterprise (GSE) bonds backed by home mortgages (line 2) because they are in the IMF's base, but both our estimates and the IMF's use a loss rate of zero for these securities. Using our hypothetical markdown of 20 percent, we obtain an estimate of $1,210 billion in mark-to-market losses globally on securities backed by U.S. assets (line 3). The IMF's estimate, excluding corporate loans, is again much smaller at $690 billion. In this case, however, the difference cannot be attributed to the loss rate, because the implied IMF markdown is also 20 percent.23 Instead, the difference comes from the base, which is the sum of the ABS outstanding. The IMF has similar figures to ours for consumer ABS, commercial mortgage-backed securities, CDOs and collateralized loan obligations issued in the United States, but the IMF appears to undercount nonconforming MBS, ABCP, and all types of ABS issued abroad. For example, the IMF shows just $1,100 billion in nonprime traditional MBS (IMF calls this ABS). Yet the Flow of Funds statistical release (Federal Reserve Board, 2008) shows $2,240 billion of home mortgages held as assets by issuers of traditional ABS, suggesting issuance of at least that much MBS.24
IX.2 Estimates by Greenlaw et al. and Others
Other recent analyses focus on loan losses in the U.S. nonconforming mortgage market and cite figures between $250 billion and $500 billion.25 These losses, mainly calculated on mortgage default assumptions, are global counterparts to our ultimate losses for foreigners. We can make a rough comparison to the foreign component of one of these analyses, by Greenlaw et al., who estimate global ultimate losses of $400 billion on nonconforming mortgages. They allocate holdings of subprime MBS across U.S. and foreign institution types, attributing just 16 percent of the total to foreign institutions (banks and hedge funds). If one applies Greenlaw's 16 percent foreign share to the global loss estimate of $400 billion, one obtains ultimate losses for foreign institutions of $64 billion. This amount is almost identical to our foreign ultimate loss estimate of $65 billion (table 1, line 5) for nonconforming mortgages. Alternatively, one could sum the two global mortgage-related losses on table 4, $225 billion for securitized loans (line 1) and $215 billion for unsecuritized loans (line 4), yielding $440 billion in global losses. This figure is similar to the estimate from Greenlaw et al. and within the range of the other estimates.
X Conclusion
This paper develops a conceptual framework for understanding foreign exposure to U.S. assets and attempts to measure three concepts of exposure. We then use these measures to construct expected mark-to-market losses and ultimate losses to foreigners. When predicting ultimate losses, we apply hypothetical default rates to our net foreign exposure measure, which ensures that each dollar of underlying U.S. assets can generate, at most, one dollar of loss. In a hypothetical scenario with a 20 percent default rate on nonconforming mortgages and a 10 percent default rate on other types of underlying loans (with a 50 percent recovery rate for each), we predict that foreigners would ultimately lose $75 billion on their holdings of ABS backed by U.S. assets. Then again, the mark-to-market losses stemming from a price markdown in all foreign-held ABS can be as much as six times larger using a 20 percent price markdown. Mark-to-market losses are so much greater for three reasons: They sum the markdowns of all entities in the securitization chain, they include illiquidity discounts, and those discounts can be amplified along the securitization chain when there is uncertainty and lack of transparency.
Finally, this paper began by alluding to the perception that foreigners hold a disproportionate share of exposure to U.S. MBS. We find that this is not the case; however, there are several dimensions to consider. First, foreigners hold about 39 percent of outstanding ABS backed by U.S. assets, including securities of U.S. origin repackaged abroad (table 6, line 2). Therefore, foreigners will bear 39 percent of any mark-to-market markdowns associated with those securities. This percentage is somewhat larger than the foreign share of holdings of other U.S. credit securities (Treasury securities, agency securities, and corporate bonds), which is about 28 percent (table 3, lines 3, 4, and 5). However, these other credit market securities mainly represent only one level of securitization, whereas the ABS market is characterized by a multiple securitization of the same underlying loan. Netting out the repackaging, foreigners are exposed, on net, to only about 22 percent of securitized loans of U.S. origin, either directly in the form of underlying loans or indirectly through securities (table 6, line 5, third column). In particular, it is the repackaging abroad of ABS of U.S. origin as well as foreign holdings of these repackaged securities that explains why foreigners' share of ultimate losses on securitized loans (table 6, line 5, sixth column) is considerably lower than their share of mark-to-market losses.26
It is true that among ABS, foreigners disproportionately hold residential MBS (table 6, lines 6 and 7), which may incur more ultimate losses relative to other types of ABS. Nonetheless, foreigners' net share of securitized nonconforming residential mortgages is still just 29 percent, nearly comparable to their 28 percent holdings of Treasury securities, agency securities, and corporate bonds noted above. Foreigners' 12 percent share of other types of securitized credit, such as commercial mortgages or consumer loans (line 7), appears low in comparison.
Finally, we have only considered the portions of the U.S. mortgage and consumer loan markets that were securitized. A substantial fraction of mortgages and consumer loans are never securitized, and we find no evidence that foreign residents hold any of these unsecuritized loans. One could be concerned with how much of the whole U.S. mortgage and consumer debt markets, and their losses, foreigners are exposed to, on net. Of the approximately $10.1 trillion (table 6, line 4) in outstanding U.S. mortgage and consumer debt (excluding conforming mortgages), foreigners have net exposure of $835 billion from the securitized portion (line 5) and none from the unsecuritized (line 8). Therefore, foreigners' net exposure is 8 percent of these debt markets (this is a weighted average of 15 percent for nonconforming residential mortgages and 3 percent for commercial mortgages and consumer debt). In comparison, table 3 (line 2) shows that foreigners hold about 16 percent of all U.S. credit market instruments, which includes all loans.27 Therefore, foreign net exposure to U.S. mortgage and consumer credit markets is similar or undersized relative to other credit holdings. As a final caution to the reader, recall that all of our estimates, like other analyses, exclude the effect of derivatives and other off-balance-sheet items as well as contingent or implicit support that may be provided to ABS issuers by their bank sponsors.
References
Brunnermeier, Markus, and Lasse Heje Pedersen, 2007, "Market Liquidity and Funding Liquidity," June 2007 Working Paper, forthcoming in the Review of Financial Studies, http://www.princeton.edu/~markus/research/papers/liquidity.
Department of Commerce, 2008, "U.S. International Transactions: Fourth Quarter of 2007," Survey of Current Business 8(2), April.
Department of the Treasury, 2007, "Report on U.S. Portfolio Holdings of Foreign Securities as of December 31, 2006," http://www.treas.gov/tic/fpis.shtml.
__________________, 2008, "Report on Foreign Portfolio Holdings of U.S. Securities as of June 30, 2007," http://www.treas.gov/tic/fpis.shtml.
Federal Reserve Board, 2008, "Flow of Funds Accounts of the United States, Z.1 Release," March 6, http://www.federalreserve.gov/releases/z1/20080306/
Goldman Sachs, 2007, "The Subprime Issue: A Global Assessment of Losses, Contagion, and Strategic Implications," November 20.
Greenlaw, David, Hatzius, Jan, Kashyap, Anil K., and Hyun Song Shin, 2008, "Leveraged Losses: Lessons from the Mortgage Market Meltdown," report prepared for the U.S. Monetary Policy Forum Conference, February 29, http://www.chicagogsb.edu/usmpf/docs/usmpf2008confdraft.pdf.
International Monetary Fund, 2008, "Global Financial Stability Report," April 2008, http://www.imf.org/External/Pubs/FT/GFSR/2008/01/index.htm.
Lehman Brothers, 2007, "Securitized Products Outlook 2008: Bumpy Road to Recovery," December 13.
Moody's Investor Service, 2007a, "ABCP 1st Quarter Program Index," April 30.
__________________, 2007b, "EMEA ABCP Market Summary," July.
__________________, 2007c, "Moody's Update on Bank-Sponsored ABCP Programs: A Review of Credit and Liquidity Issues," September 12.
__________________, 2007d, "Challenging Times for the U.S. Subprime Mortgage Market," March 7.
__________________, 2008, "2008 U.S. CDO Outlook and 2007 Review," March 3.
Standard & Poor's, 2007, Global Stock Markets Factbook 2007. New York, NY: Standard & Poor's.
Table 1: Loss Estimates and Measures of Foreign Holdings of and Exposure to Asset Backed Securities of U.S. Origin (as of June 2007, Billions of U.S. dollars)
| Line | Measure | Base: Level | Base: as percent of: Total liab. of U.S. ABS issuers ($4.3 tr.)1 | Base: as percent of: Foreign equity market capitalization ($35 tr.)2 | Hypothetical Losses: Mark-to-market3 | Hypothetical Losses: Ultimate4 |
|---|---|---|---|---|---|---|
| 1 | Gross foreign exposure | $2,565 | 59.7% | 7.3% | - | - |
| 2 | Gross foreign exposure: Excluding whole loans5 | $2,365 | - | - | $475 | - |
| 3 | Foreign holdings | $1,190 | 27.7% | 3.4% | - | - |
| 4 | Net foreign exposure | $835 | 19.4% | 2.4% | - | $75 |
| 5 | Net foreign exposure: Non-conforming mtges.6 | $650 | - | - | - | $65 |
| 6 | Net foreign exposure: Other ABS and primary assets7 | $185 | - | - | - | $10 |
| 7 | Losses as a percent of total foreign claims on U.S. residents ($15.3 tr)8 | - | - | - | 3.1% | 0.5% |
Notes to Table 1
1 Source: Flow of Funds Z.1 Statistical Release Table L-126 line 11, Federal Reserve Board (2008).
2 As of year-end 2006. Source: Standard & Poors (2007).
3 We assume a 20% mark-down in the price of all ABS securities held by foreigners.
4 We assume a 20% default rate on non-conforming mortgages, and a 10% default rate on all other loans, with a 50% recovery rate.
5 We exclude $200 billion in whole loans held by foreigners (line 2 of Table 2) when estimating mark-to-market losses.
6 This figure is computed by adding net foreign exposure of MBS to the portion of net foreign exposure to primary assets that we estimate are in the form of non-conforming mortgages. As shown in Table 23 of the report "Foreign Portfolio Holdings of U.S. Securities� (Department of the Treasury, 2008), about two-thirds, or $595 billion, of long-term ABS held by foreigners were private-label (non-Agency) MBS. To obtain net exposure to MBS, we subtract from this figure $75 billion to account for U.S. residents� holdings of foreign-issued MBS backed by U.S. mortgages. Finally, we assume that two-thirds of the $200 billion estimate for primary assets held by foreigners, or about $130 billion, is in the form of non-conforming mortgages, bringing the figure to $650 billion. Although we present a point estimate for net foreign exposure to U.S. non-conforming mortgages, our information is consistent with a range from $520-$700 billion, owing to the uncertainty surrounding the estimates of the primary assets held by foreigners. To focus on subprime related exposure only, note that about half of private-label MBS are backed by subprime mortgages (Moody's, 2007d).
7 Computed by subtracting line 5 from line 4. TIC data at the security level suggest that these other ABS held by foreigners are primarily backed by student, credit card, auto, and home equity loans. They also include foreign holdings of CDOs (primarily backed by home equity loans) and CLOs (mainly backed by corporate leveraged loans), which are relatively small.
8 Source: Flow of Funds March 6, 2008 Z.1 Statistical Release, tables L.200-L.228 (Federal Reserve Board, 2008)
Table 2: Measures of Foreign Holdings of and Exposure to Asset Backed Securities of U.S. Origin (as of June 2007, Billions U.S. dollars):
Panel A: Line 1: Foreign Holdings
| Line | Measure | General Measure: Range1 | General Measure: Point Estimate | "Pure" Measure2 |
|---|---|---|---|---|
| 1 | Foreign Holdings (lines 2+3+6) | $1,020-$1,490 | $1,190 | $1,070-$1,190 |
| 2 | Whole loans originated in the U.S. (foreign held)3 | $50-$500 | $200 | $200 |
| 3 | Long-term ABS issued by U.S. residents (foreign held)4 | $900 | $900 | $790-$900 |
| 4 | Long-term ABS issued by U.S. residents (foreign held)4: Backed by unmixed collateral of U.S. origin | - | $790 | $790 |
| 5 | Long-term ABS issued by U.S. residents (foreign held)4: Backed by mixed country collateral | - | $110 | $0-$110 |
| 6 | ABCP issued by U.S. residents (foreign held)5 | $70-$90 | $90 | $80-$90 |
| 7 | ABCP issued by U.S. residents (foreign held)5: Backed by unmixed collateral of U.S. origin | - | $80 | $80 |
| 8 | ABCP issued by U.S. residents (foreign held)5: Backed by mixed country collateral | - | $10 | $0-$10 |
Table 2: Measures of Foreign Holdings of and Exposure to Asset Backed Securities of U.S. Origin (as of June 2007, Billions U.S. dollars):
Panel B: Line 9: Gross Foreign Exposure
| Line | Measure | General Measure: Range1 | General Measure: Point Estimate | "Pure" Measure2 |
|---|---|---|---|---|
| 9 | Gross foreign exposure (lines 10 + 11 + 14 - 17) | $2,045-$3,215 | $2,565 | $2,065-$2,565 |
| 10 | Foreign holdings (line 1) | $1,020-$1,490 | $1,190 | $1,070-$1,190 |
| 11 | Plus: Long-term ABS issued by foreign residents6 | $980-$1,530 | $1,255 | $860-$1,255 |
| 12 | Long-term ABS issued by foreign residents6: Backed by unmixed U.S. collateral | $735-$985 | $860 | $860 |
| 13 | Long-term ABS issued by foreign residents6: Backed by mixed country collateral | $245-$545 | $395 | $0-$395 |
| 14 | Plus: ABCP issued by foreign residents7 | $130-$330 | $230 | $175-$230 |
| 15 | ABCP issued by foreign residents7: Backed by unmixed collateral of U.S. origin | - | $175 | $175 |
| 16 | ABCP issued by foreign residents7: Backed by mixed country collateral | - | $55 | $0-$55 |
| 17 | Minus: Claims of U.S. residents on foreigners (lines 18 + 21) | $85-$135 | $110 | $40-$110 |
| 18 | Claims of U.S. residents on foreigners (lines 18 + 21): Long-term ABS issued by foreign residents (U.S. held)8 | $65-$105 | $85 | $20-$85 |
| 19 | Claims of U.S. residents on foreigners (lines 18 + 21): Long-term ABS issued by foreign residents (U.S. held)8: Backed by unmixed collateral of U.S. origin | - | $20 | $20 |
| 20 | Claims of U.S. residents on foreigners (lines 18 + 21): Long-term ABS issued by foreign residents (U.S. held)8: Backed by mixed country collateral | - | $65 | $0-$65 |
| 21 | Claims of U.S. residents on foreigners (lines 18 + 21): ABCP issued by foreign residents (U.S. held)9 | $20-$30 | $25 | $20-$25 |
| 22 | Claims of U.S. residents on foreigners (lines 18 + 21): ABCP issued by foreign residents (U.S. held)9: Backed by unmixed collateral of U.S. origin | - | $20 | $20 |
| 23 | Claims of U.S. residents on foreigners (lines 18 + 21): ABCP issued by foreign residents (U.S. held)9: Backed by mixed country collateral | - | $5 | $0-$5 |
Table 2: Measures of Foreign Holdings of and Exposure to Asset Backed Securities of U.S. Origin (as of June 2007, Billions U.S. dollars):
Panel C: Line 24: Net Foreign Exposure (lines 25 - 26 - 27)
| Line | Measure | General Measure: Range1 | General Measure: Point Estimate | "Pure" Measure2 |
|---|---|---|---|---|
| 24 | Net foreign exposure (line 25-26-27) | $765-$1,010 |
$835 | $715-$835 |
| 25 | Foreign holdings (line 1) | $1,020-$1,490 | $1,190 | $1,070-$1,190 |
| 26 | Minus: Claims of U.S.-residents on foreigners (line 17) | $85-$135 | $110 | $110 |
| 27 | Minus: Intercompany loans backed by ABS held abroad10 | $170-$345 | $245 | $245 |
| 28 | Intercompany loans backed by ABS held abroad10: Backed by unmixed collateral of U.S. origin | - | $135 | $135 |
| 29 | Intercompany loans backed by ABS held abroad10: Backed by mixed country collateral | - | $110 | $110 |
| 30 | Foreign holdings of Agency ABS11 | - | $570 | $570 |
Table 2: Measures of Foreign Holdings of and Exposure to Asset Backed Securities of U.S. Origin (as of June 2007, Billions U.S. dollars):
Panel D: Memorandum: Totals including unmixed foreign collateral
| M1 | Foreign holdings of long-term ABS issued by U.S. residents (as in line 3) | $900 |
| M2 | Foreign holdings of long-term ABS issued by U.S. residents (as in line 3): Backed by unmixed foreign collateral |
<$1 |
| M3 | Foreign holdings of ABCP issued by U.S. residents (as in line 6) | $115 |
| M4 | Foreign holdings of ABCP issued by U.S. residents (as in line 6): Backed by unmixed foreign collateral |
$25 |
| M5 | ABCP issued by foreign residents (as in line 14) | $360 |
| M6 | ABCP issued by foreign residents (as in line 14): Backed by unmixed foreign collateral |
$130 |
| M7 | U.S. residents' holdings long-term ABS issued by foreigners (as in line 18) | $235 |
| M8 | U.S. residents' holdings long-term ABS issued by foreigners (as in line 18): Backed by unmixed foreign collateral |
$150 |
| M9 | U.S. residents' holdings of ABCP issued by foreigners (as in line 21) | $40 |
| M10 | U.S. residents' holdings of ABCP issued by foreigners (as in line 21): Backed by unmixed foreign collateral |
$15 |
Notes to Table 2
1 The uncertainty range for the general measures mainly comes from three sources. First, there is uncertainty regarding how much the cross-border transactions of primary assets (e.g. whole loans or trust certificates) are being captures in the TIC data. Second, there is considerable uncertainty regarding the collateral composition in terms of U.S. versus foreign origin. Finally, there is uncertainty about whether the issuer is a U.S. or foreign entity, especially for the ABCP programs.
2 The lower and upper bounds for the pure measures are obtained by taking 0% and 100% of the mixed country collateral into the calculations.
3 Primary assets are loans or private trust certificates. However, these may not be captured well by the TIC system. It is not clear exactly where the TIC would report private placements of trust certificates or transfers of whole loans abroad. Some private trust certificates may be reported as securities but many are probably unreported. As for loans, banks are required to report loans that they service or administer that have been sold abroad. These are reported in category that includes corporate loans, not just consumer loans or securitized loans. The roughly $250-$300 billion liability position in this category over the past few years is reported by large banks and mostly in large financial centers such as the Cayman Islands, which gives no clues as to its composition. It is difficult to guess what portion of this should be included in foreign holdings to represent underlying collateral of ABS. The total must include large amounts of other types of loans but also some loans probably are unreported. The true figure is likely bounded between $50 billion and $500 billion. A round figure of $200 billion will be used.
4 Foreign holdings of ABS are obtained from Table 23 of the June 2007 report "Foreign Portfolio Holdings of U.S. Securities� (Department of the Treasury, 2008). Foreigners held $900 billion of long-term ABS securities issued in the U.S by the private sector. By matching a representative sample of CUSIPS to Bloomberg data, we estimated that about 88%, or roughly $790 billion, of the holdings of long-term secondary assets is backed strictly by U.S. assets. Another 12%, or $110 billion, is backed by mixed assets. As shown in line M2, less than $1 billion is backed by unmixed foreign assets.
5 As shown in Table 24 of the June 2007 report "Foreign Portfolio Holdings of U.S. Securities� (Department of the Treasury, 2008), foreigners held about $115 billion of U.S. issued ABCP. Using the collateral descriptions obtained from several Moody's reports, we estimated that about 71%, or $80 billion, is backed by unmixed U.S. collateral, and 9%, or $10 billion, is backed by mixed collateral. As shown in line M4, the remainder is backed by unmixed foreign collateral.
6 We estimate the outstanding amount of ABS issued by foreign entities by aggregating over total issuances between January 2000 and June 2007, using the SDC Platinum database. In the years prior to 2000, issuannces were less than $30 billion. Conceptually, we should also subtract the amounts that matured. However, this amount is negligible since most of the issuance occurred in recent years, and the average maturity is 20 years.
7 To estimate the portion of foreign issued ABCP, we assume that all commercial paper issued in the United States is issued by a U.S. entity. This is a reasonable assumption since the vast majority of European-bank sponsored ABCP programs who issue commercial paper in the United States rely on a Delaware affiliate to do so. Some U.S. bank sponsored ABCP programs often have a foreign affiliate which issues ABCP in the European market. Using data from Moody's (Moody's Investor Service, 2007a, 2007b, 2007c), we estimate that the outstanding amount of ABCP issued by foreign entities was about $360 billion as of June 30, 2007 (line M5).
8 Table 22 of the report "U.S. Holdings of Foreign Securities" (Department of the Treasury, 2007) shows that U.S. residents held about $235 billion in long-term ABS issued by foreign residents (line M9). Using collateral information is from Bloomberg, we estimate that $85 billion is backed by unmixed collateral of U.S. origin and mixed country collateral.
9 We identified $40 billion of U.S. holdings of foreign issued ABCP (line M7), by matching the issuer names using the security-level data underlying the "Report of U.S. Portfolio Holdings of Foreign Securities as of December 31, 2006" (Department of the Treasury, 2007) to those found in the "ABCP 1st Quarter 2007 Program Index" (Moody's Investor Service, 2007a). To determine the collateral composition we relied on several Moody's reports on ABCP (see references Moody's Investors Service 2007b, 2007c).
10 This represents claims of U.S. affiliates to their foreign parents, in the form of intercompany loans. The funds for these loans are generated by ABCP and medium term notes issuances of the U.S. affiliate. The Bureau of Economic Analysis (BEA) recently identified certain U.S. ABCP programs with this structure and recorded a decrease of about $158 billion in these claims when the U.S. affiliates were unable to roll over maturing ABCP in the second half of 2007 (Department of Commerce, 2008). Using data from the Depository Trust Company (DTC), we estimate that the outstanding stock of these claims before the turmoil was about $500 billion. Furthermore, based on a Moody's (2007b) report on ABCP, we assume that 27 percent of this figure is backed by unmixed collateral from the United States, 22 percent by mixed country collateral, and the remaining portion by unmixed foreign collateral.
11 Source: Table 23 of the June 2007 report "Foreign Portfolio Holdings of U.S. Securities� (Department of the Treasury, 2008).
Table 3: Liabilities and Equity of the Domestic Economy and Amounts Held by the Rest of the World1 (as of June 2007, Billions of U.S. dollars)
| Line | Measure | Total | Held by Rest of World2 | Row Share of Total (Percent) |
|---|---|---|---|---|
| 1 | Total liabilities and equity of which: | 122,098 | 15,264 | 13% |
| 2 | Credit market instruments | 44,419 | 6,942 | 16% |
| 3 | Credit market instruments: Treasury securities3 | 4,904 | 2,194 | 45% |
| 4 | Credit market instruments: Agency- and GSE-backed sec.4 | 6,784 | 1,413 | 21% |
| 5 | Credit market instruments: Corporate & municipal credit securities (non asset-backed)5 | 8,236 | 2,045 | 25% |
| 6 | Credit market instruments: Corporate ABS + ABCP6 | 4,565 | 990 | 22% |
| 7 | Credit market instruments: Other credit market instruments7 | 19,929 | 300 | 2% |
| 8 | Checkable, time & savings deposits plus currency | 8,757 | 605 | 7% |
| 9 | Corporate equities and fund shares8 | 27,768 | 3,130 | 11% |
| 10 | Other9 | 41,154 | 4,587 | 11% |
Notes to Table 3
1 Source: Flow of Funds March 6, 2008 Z.1 Statistical Release, tables L.200-L.228 (Federal Reserve Board, 2008).
2 For lines 3,4,5, 6 and 9, the amounts held by rest of the world were obtained from tables 1, 23 and 24 of the "Report on Foreign Portfolio Holdings of U.S. Securities," as of June 30, 2007 (Department of the Treasury, 2008). We exclude $25 billion in U.S. issued ABCP backed by foreign collateral from the survey figure of $115 billion (see note 5 of Table 2 for more details).
3 Total includes savings bonds and holdings of the Federal Reserve System.
4 Includes Agency- amd GSE- backed mortgage pools, and GSE bond issues. GSE assets include mortgages, corporate bonds, and other credit market instruments.
5 Includes open market paper.
6 Includes ABS whose collateral may include Treasury securities, Agency- and GSE- backed securities, and trade credit. We also add an estimated $625 billion in CDOs backed by U.S. assets outstanding that are not in the Flow of Funds tables. Flow of Funds ABCP figure of $890 billion (L.208 line 9) is replaced with our estimate of $550 billion derived from Moody's (2007a, 2007b, and 2007c).
7 Includes mortgages, consumer credit, bank loans, and other loans and advances.
8 Includes equities, mutual fund shares, and money market fund shares.
9 Includes SDR certificates and Treasury currency, net interbank liabilities, Federal funds and security RPs, trade credit, security credit, life insurance reserves, pension fund reserves, taxes payable, equity in noncorp. businesses, foreign direct investment in the United States, and other miscellaneous liabilities.
Table 4: Estimates of U.S. and Foreign Ultimate Losses on Net Exposure (Billions of U.S. dollars): Panel A: Securitized Loans
| Line | Securitized loans | Outstanding amount | Loss Rate1 | U.S. and Foreign Losses |
|---|---|---|---|---|
| 1 | Securitized into: MBS2 | 2,240 | 10% | 225 |
| 2 | Securitized into: CMBS & Other3 | 1,595 | 5% | 80 |
| 3 | Total Securitized | 3,835 |
- |
305 |
Table 4: Estimates of U.S. and Foreign Ultimate Losses on Net Exposure (Billions of U.S. dollars): Panel B: Unsecuritized Loans
| Line | Unsecuritized loans | Outstanding amount | Loss Rate | U.S. Losses | Comparison to IMF estimates: IMF base | Comparison to IMF estimates: Implied IMF Loss Rate4 | Comparison to IMF estimates: Compar-able loss | Comparison to IMF estimates: IMF estimate5 |
|---|---|---|---|---|---|---|---|---|
| 4 | All mortgages6 | 4,660 | see memo | 215 | 4,700 | 2.4% | 115 | 115 |
| 5 | Commercial real estate, consumer loans, and other7 | 4,100 | 5% | 205 | 3,800 | 1.3% | 55 | 50 |
| 6 | Total Unsecuritized | 8,760 | - | 420 | - | - | 170 | 165 |
| 7 | Total securitized + unsecuritized | 12,595 | - | 725 | - | - | - | - |
Table 4: Estimates of U.S. and Foreign Ultimate Losses on Net Exposure (Billions of U.S. dollars): Panel C: Memorandum: Approximate breakdown on unsecuritized mortgages8
| Line | Unsecuritized Mortgage | Outstanding Amount | Loss Rate | U.S. Losses |
|---|---|---|---|---|
| M1 | Non-conforming | 2,160 | 10% | 215 |
| M2 | Conforming | 2,500 | 0% | 0 |
| M3 | Global Net Exposure9 | 10,095 | - | - |
Notes to Table 4
1 Loss rate is the default rate times a 50 percent recovery rate.
2 These are the assets of ABS issuers shown in line 19 of Flow of Funds table L.218.
3 These are the assets of ABS issuers shown in Flow of Funds tables L.219, L.220, L.221, and L.222, plus $200 billion in whole loans held by foreigners (Table 2 line 2).
4 Calculated from Table 1.5 of the Global Financial Stability Report (IMF, 2008), excluding corporate and leveraged loans.
5 See note 4.
6 From Flow of Funds table L.218. Computed by taking total assets (line 5) minus those of ABS issuers, and Agency- and GSE- backed mortgage pools (lines 18-19). Includes subprime, alt-A, jumbo, and conforming mortgages.
7 From Flow of Funds tables L.219, L.220, L.221 and L.222. Computed by taking total assets minus those of ABS issuers, and Agency- and GSE- backed mortgage pools.
8 Precise data on the breakdown of outstanding mortgage debt in the Flow of Funds into categories of prime, near-prime, and subprime is not available. We estimate these breakdowns with a combination of data from Mortgage Bankers Association, Loan Performance, Moodys, and Flow of Funds.
9 Excluding conforming mortgages. Equals line 7 minus line M2.
Table 5: U.S. and Foreign Mark-to-Market Losses on Gross Exposure (As of June 2007, Billions of U.S. Dollars)
| Line | Measure | Total ABS backed by U.S. assets subject to mark-to-market accounting1 | Loss Rate | U.S. and Foreign Losses | Comparison to IMF estimates: IMF base2 | Comparison to IMF estimates: Implied IMF loss rate3 | Comparison to IMF estimates: Comparable loss | Comparison to IMF estimates: IMF estimate |
|---|---|---|---|---|---|---|---|---|
| 1 | ABS outstanding (excl. agency securities) | 6,050 | 20% | 1,210 | 3,440 | 20% | 1,265 | 690 |
| 2 | Agency securities backed by conforming home mortgages4 | 3,940 | 0% | 0 | 3,800 | 0% | 0 | 0 |
| 3 | Total | 9,990 | - | 1,210 | 7,240 | - |
0 | 690 |
Table 5: U.S. and Foreign Mark-to-Market Losses on Gross Exposure (As of June 2007, Billions of U.S. Dollars): Memorandum: U.S. + Foreign Gross Exposure
| Line | Measure | Total | % |
|---|---|---|---|
| M1 | Loans that are assets of ABS issuers (excl. conforming mtges.)5 | 3,835 | - |
| M2 | U.S. + foreign gross exposure (excl. conforming mtges.)6 | 9,885 | 100% |
| M3 | U.S. + foreign gross exposure (excl. conforming mtges.)6: Foreign gross exposure | 2,565 | 26% |
| M4 | U.S. + foreign gross exposure (excl. conforming mtges.)6: U.S. gross exposure | 7,320 | 74% |
Notes to Table 5
1 Includes ABS issued by U.S. and foreign entities backed by U.S. assets. ABS here refers to all secondary assets, both long term and short term (i.e. ABS, CDOs, medium term notes, and ABCP). The original loans and the trust certificates are not subject to mark-to-market accounting (see section VII of the paper for more details). U.S. issued ABS equals total liabilities of ABS issuers from Flow of Funds table L.126. The ABCP amounts are replaced with our estimate of $550 billion derived from Moody's (2007a, 2007b, and 2007c). We also add an additional $625 billion to account for CDOs backed by U.S. assets (estimate based on Moody's, 2008 report). Foreign issued ABS equals the sum of lines 11 and 14 from Table 2 of this report.
2 Calculated from bottom panel of table 1.5 of the Global Financial Stability Report (IMF, 2008), excluding corporate debt. The IMF base appears to undercount the assets backing non-conforming MBS issued in the United States, ABCP, and all types of ABS issued abroad.
3 Calculated as the ratio of IMF's (2008) mark-to-market loss estimates to their outstanding amounts.
4 Source: Flow of Funds table L.218 line 18. Excludes GSE bond issues that are not explicitly mortgage backed pools.
5 Includes mortgages (Flow of Funds table L.126 line 5) plus consumer credit (Flow of Funds table L.126 line 9) plus $200 billion of U.S. originated whole loans that are assets of foreign ABS issuers (Table 2, line 2).
6 Equals the sum of lines 1 and M1.
Table 6: Foreign Shares of Global Gross and Net Exposure and Losses (as of June 2007, Billions of U.S. dollars): Panel A: By Instrument
| Line | Instrument | Gross Exposure: Global3 | Gross Exposure: Foreign4 | Gross Exposure: Foreign Share | Mark-to-Market Losses1: Global3 | Mark-to-Market Losses1: Foreign4 | Mark-to-Market Losses1: Foreign Share |
|---|---|---|---|---|---|---|---|
| 1 | Total | 9,885 | 2,565 | 26% | 1,210 | 475 | 39% |
| 2 | ABS Outstanding5 | 6,050 | 2,365 | 39% | 1,210 | 475 | 39% |
| 3 | Underlying Securitized Loans6 | 3,835 | 200 | 5% | n.a. | n.a. | n.a. |
Table 6: Foreign Shares of Global Gross and Net Exposure and Losses (as of June 2007, Billions of U.S. dollars): Panel B: By Type of underlying assets
| Line | Underlying Asset | Net Exposure: Global3 | Net Exposure: Foreign4 | Net Exposure: Foreign Share | Ultimate Losses2: Global3 | Ultimate Losses2: Foreign4 | Ultimate Losses2: Foreign Share |
|---|---|---|---|---|---|---|---|
| 4 | Total | 10,095 | 835 | 8% | 725 | 75 | 10% |
| 5 | Securitized Loans (Loans underlying ABS) | 3,835 | 835 | 22% | 305 | 75 | 25% |
| 6 | Securitized Loans (Loans underlying ABS): Non-conforming home mortgages | 2,240 | 650 | 29% | 225 | 65 | 29% |
| 7 | Securitized Loans (Loans underlying ABS): Commercial real estate, consumer loans, and other | 1,595 | 185 | 12% | 80 | 10 | 12% |
| 8 | Unsecuritized Loans (excl. conforming mtges.)7 | 6,260 | 0 | 0% | 420 | 0 | 0% |
| 9 | Unsecuritized Loans (excl. conforming mtges.)7: Non-conforming home mortgages | 2,160 | 0 | 0% | 215 | 0 | 0% |
| 10 | Unsecuritized Loans (excl. conforming mtges.)7: Commercial real estate, consumer loans, and other | 4,100 | 0 | 0% | 205 | 0 | 0% |
Notes to Table 6
1 Mark-to-market losses are generated by a hypothetical 20 percent markdown.
2 Ultimate losses are generated by the following hypothetical default and recovery rates: 20 percent default and 50 percent recovery on non-conforming mortgages, 10 percent default and 50 percent recovery on other loans.
3 Global gross exposure and mark-to-market losess are taken from Table 5, and global net exposure and ultimate losses from Table 4. Agency securities and underlying conforming mortgages are excluded from the calculations.
4 From Tables 1 and 2.
5 Outstanding issues of ABS equals the assets of ABS issuers. Mark-to-market assets include trust certificates but not the underlying loans.
6 Mark-to-market losses are not applied to loan pools and trust certificates that are assets of ABS issuers. See section VII of the paper for more details.
7 Excludes $2.5 tr. in unsecuritized conforming mortgages.
Footnotes
* The authors are economists in the International Finance Division of the Federal Reserve Board. The authors are indebted to Mark Carey, Steven Kamin, Andreas Lehnert, Carol Bertaut, Nathan Sheets, and Ralph Tryon for helpful comments and suggestions. Grant Long provided excellent research assistance. The views in this paper are solely the responsibility of the authors and should not be interpreted as reflecting the views of the Board of Governors of the Federal Reserve System or of any other person associated with the Federal Reserve System. Return to text
1. Loan types are discussed in section II. We omit agency mortgages from the baseline figures because they were not initially involved in the turmoil and continue to have low credit risk. Foreign holdings of agency ABS are shown at the bottom of table 2. Return to text
2. We only need to consider these whole loans and trust certificates if they are sold or transferred to foreign entities. Return to text
3. Our use of the term CDO also includes collateralized loan obligations, whose underlying assets consist mainly of bank loans. Return to text
4. Assets backing ABCP also often include short-term trade receivables. Return to text
5. By saying "the pass-through is direct," we mean that returns are completely dependent on the underlying loans, there is no potential role for equity (and therefore no potential loss to the trust itself), and no tranching by seniority (that is, no tranche is clearly subordinate to another in receiving flows). Return to text
6. The $1.2 trillion is our estimate for foreign holdings of U.S.-issued assets, which will be discussed in detail in the next section. This estimate includes ABS backed by unmixed U.S. collateral and mixed country collateral but excludes those backed by unmixed foreign collateral. Collateral origin at the security level is obtained from Bloomberg. Return to text
7. Our source for these foreign issues, the SDC Platinum Database, poorly identifies collateral origin, which generates significant uncertainty about how to divide foreign issues between unmixed U.S. collateral, mixed country collateral, and unmixed foreign collateral. Return to text
8. Even though F2 was established without equity, this does not necessarily imply that all losses on its assets are passed on to F3. F2 may be fully or partially supported by a third party that insulates investors from a deterioration of the asset performance by providing cash to cover some or all of the shortfalls with respect to repayment. In a credit event, the support facility absorbs some or all of the losses, thus reducing those incurred by F3 by a corresponding amount. Return to text
9. Note that to calculate pure net foreign exposure, we must also take into account the U.S. portion of the mixed-country collateral that underlies the claims of U.S. residents on foreigners. Return to text
10. Our scenario assumes that losses on prime mortgages will not exceed the combined resources of the government-sponsored enterprises and the mortgage insurers. Therefore, we expect ultimate losses in this sector to be zero. Return to text
11. Since there is a direct pass-through relationship between the loan pool and the trust certificate, there is no potential role for equity, no balance sheet, and, therefore, no need for mark-to-market accounting. Return to text
12. Any foreigners that purchase and hold these discounted ABS and do not follow mark-to-market accounting practices would benefit from large realized returns. If, however, U.S. residents purchase the discounted ABS, then the losses recovered by foreigners would be smaller. Return to text
13. Although we present a point estimate for net foreign exposure to U.S. nonconforming mortgages, our information is consistent with a range from $520 billion to $700 billion due to the uncertainty surrounding the estimates of the primary assets held by foreigners. This figure includes foreign holdings of primary and secondary assets backed by jumbo, alt-A, and subprime mortgages. It does not take into account any contingent support that foreign banks may have to provide to cover defaults on U.S. assets. See note 8 at the bottom of table 1 for more details. Return to text
14. Similarly, the true ultimate loss estimate is a range from $52 billion to $70 billion. The assumption of a 20 percent default rate on nonconforming mortgages is loosely based on the current trend in serious delinquencies for subprime and alt-A mortgages (averaging the trends for fixed-rate and variable-rate mortgages). Return to text
15. The assumption of a 10 percent default rate on ABS other than nonconforming mortgages reflects an average of low expected default rates on student, auto, and credit card loans (historically about 2 percent to 5 percent during downturns) and higher default rates on leveraged corporate loans and home equity loans. Return to text
16. The 20 percent markdown is a round figure for illustration. However, it is not unreasonable because price indices of subprime ABS have fallen about 45 percent, on average, from June 2007 to spring 2008, whereas other ABS prices have fallen much less (for example, indices of commercial MBS have fallen about 5 percent, on average, over the same period). Return to text
17. The forced liquidation of Carlyle Capital fund's assets, which consisted mostly of agency-sponsored AAA-rated MBS, is a good example of this. Return to text
18. This amplification effect is distinct from other loss amplification effects pointed out in Brunnermeier and Pedersen (2007) and Greenlaw et al. (2008). Return to text
19. For this exercise, we are agnostic as to what caused the illiquidity in the first place. As discussed, the illiquidity discount could come from investors' uncertainty about the composition of the assets that ultimately underlie the securities they hold or from uncertainty regarding the expected default rates associated with those assets. Investors may simply demand compensation because these securities suddenly became illiquid, and that illiquidity can make prices even more volatile and less transparent. Return to text
20. Due to the ABX labeling convention, mortgages originated in the second half of 2005 are indexed by the ABX 2006-1. Return to text
21. Just as with the foreign mark-to-market calculation, the underlying loans themselves are not counted in the base for mark-to-market losses. Return to text
22. The IMF's total unsecuritized $225 billion loss estimate includes $60 billion in losses on corporate loans. Return to text
23. The IMF markdown is 20 percent on the aggregate of all securities, excluding corporate bonds and prime MBS. Return to text
24. Part of what the IMF is missing may be MBS backed by prime jumbo mortgages, which they could assume have a loss rate of zero. However, it does not appear that their category "prime ABS" includes these prime jumbo MBS because their total outstanding for the category, $3,800 billion, barely accounts for outstanding agency and GSE-backed MBS. Return to text
25. Goldman Sachs (2007) mortgage loss estimates ranged from $243 billion to $495 billion, and those of Lehman Brothers (2007) ranged from $250 billion to $320 billion. Finally Greenlaw et al. (2008) use two different methods to arrive at an estimated mortgage loss of $400 billion. Return to text
26. A simple extension of the example in figure 2 can help illustrate this effect. Imagine one additional leg, that foreign entity F3 is just a pass-through entity that repackages the ABS and sells the new securities to a U.S. entity D2. Note that in this case, net foreign exposure is zero, and so are foreign ultimate losses. U.S. entities would bear 100 percent of global ultimate losses. However, gross foreign exposure is $300, which is 60 percent of all ABS outstanding (or $300 out of $500). Therefore, foreigners would incur 60 percent of global mark-to-market losses but none of the global ultimate losses. Return to text
27. This comparison is not exactly the right one because line 2, total credit market instruments, includes not only unsecuritized loans and securities but also the loans underlying the securities. In contrast, we subtract out the loans underlying the securities when measuring the foreign share of net exposure to ABS. Rather than attempting to subtract out underlying loans for every instance of securitization among all credit market instruments (which would not be just ABS but also agency and GSE-backed securities and possibly include financing corporations and real estate investment trusts), we assert that this subtraction would generate an appropriate comparator that is clearly greater than 16 percent. This simply reinforces the conclusion that the foreign share of exposure to the whole U.S. credit market is at least as large as or larger than their share of exposure to U.S. mortgages. Return to text
This version is optimized for use by screen readers. Descriptions for all mathematical expressions are provided in LaTex format. A printable pdf version is available. Return to text