
Board of Governors of the Federal Reserve System
International Finance Discussion Papers
Number 963, March 2009 --- Screen Reader
Version*
The Taylor Rule and Interval Forecast For Exchange Rates1
NOTE: International Finance Discussion Papers are preliminary materials circulated to stimulate discussion and critical comment. References in publications to International Finance Discussion Papers (other than an acknowledgment that the writer has had access to unpublished material) should be cleared with the author or authors. Recent IFDPs are available on the Web at http://www.federalreserve.gov/pubs/ifdp/. This paper can be downloaded without charge from the Social Science Research Network electronic library at http://www.ssrn.com/.
Abstract:
This paper attacks the Meese-Rogoff puzzle from a different perspective: out-of-sample interval forecasting. Most studies in the literature focus on point forecasts. In this paper, we apply Robust Semiparametric (RS) interval forecasting to a group of Taylor rule models. Forecast intervals for twelve OECD exchange rates are generated and modified tests of Giacomini and White (2006) are conducted to compare the performance of Taylor rule models and the random walk. Our contribution is twofold. First, we find that in general, Taylor rule models generate tighter forecast intervals than the random walk, given that their intervals cover out-of-sample exchange rate realizations equally well. This result is more pronounced at longer horizons. Our results suggest a connection between exchange rates and economic fundamentals: economic variables contain information useful in forecasting the distributions of exchange rates. The benchmark Taylor rule model is also found to perform better than the monetary and PPP models. Second, the inference framework proposed in this paper for forecast-interval evaluation can be applied in a broader context, such as inflation forecasting, not just to the models and interval forecasting methods used in this paper.
Keywords: The exchange rate disconnect puzzle, exchange rate forecast, interval forecasting
JEL classification: F31, C14, C53
1. Introduction
Recent studies explore the role of monetary policy rules, such as Taylor rules, in exchange rate determination. They find empirical support in these models for the linkage between exchange rates and economic fundamentals. Our paper extends this literature from a different perspective: interval forecasting. We find that the Taylor rule models can outperform the random walk, especially at long horizons, in forecasting twelve OECD exchange rates based on relevant out-of-sample interval forecasting criteria. The benchmark Taylor rule model is also found to perform relatively better than the standard monetary model and the purchasing power parity (PPP) model.
In a seminal paper, Meese and Rogoff (1983) find that economic fundamentals - such as the money supply, trade balance and national income - are of little use in forecasting exchange rates. They show that existing models cannot forecast exchange rates better than the random walk in terms of out-of-sample forecasting accuracy. This finding suggests that exchange rates may be determined by something purely random rather than economic fundamentals. Meese and Rogoff's (1983) finding has been named the Meese-Rogoff puzzle in the literature.
In defending fundamental-based exchange rate models, various combinations of economic variables and econometric methods have been used in attempts to overturn Meese and Rogoff's finding. For instance, Mark (1995) finds greater exchange rate predictability at longer horizons.4 Groen (2000) and Mark and Sul (2001) detect exchange rate predictability by using panel data. Kilian and Taylor (2003) find that exchange rates can be predicted from economic models at horizons of 2 to 3 years, after taking into account the possibility of nonlinear exchange rate dynamics. Faust, Rogers, and Wright (2003) find that the economic models consistently perform better using real-time data than revised data, though they do not perform better than the random walk.
Recently, there is a growing strand of literature that uses Taylor rules to model exchange rate determination. Engel and West (2005) derive the exchange rate as a present-value asset price from a Taylor rule model. They also find a positive correlation between the model-based exchange rate and the actual real exchange rate between the US dollar and the Deutschmark (Engel and West, 2006). Mark (2007) examines the role of Taylor-rule fundamentals for exchange rate determination in a model with learning. In his model, agents use least-square learning rules to acquire information about the numerical values of the model's coefficients. He finds that the model is able to capture six major swings of the real Deutschmark-Dollar exchange rate from 1973 to 2005. Molodtsova and Papell (2009) find significant short-term out-of-sample predictability of exchange rates with Taylor-rule fundamentals for 11 out of 12 currencies vis-á-vis the U.S. dollar over the post-Bretton Woods period. Molodtsova, Nikolsko-Rzhevskyy, and Papell (2008a, 2008b) find evidence of out-of-sample predictability for the dollar/mark nominal exchange rate with forecasts based on Taylor rule fundamentals using real-time data, but not revised data. Chinn (forthcoming) also finds that Taylor rule fundamentals do better than other models at the one year horizon. With a present-value asset pricing model as discussed in Engel and West (2005), Chen and Tsang (2009) find that information contained in the cross-country yield curves are useful in predicting exchange rates.
Our paper joins the above literature of Taylor-rule exchange rate models. However, we address the Meese and Rogoff puzzle from a different perspective: interval forecasting. A forecast interval captures a range in which the exchange rate may lie with a certain probability, given a set of predictors available at the time of forecast. Our contribution to the literature is twofold. First, we find that for twelve OECD exchange rates, the Taylor rule models in general generate tighter forecast intervals than the random walk, given that their intervals cover the realized exchange rates (statistically) equally well. This finding suggests an intuitive connection between exchange rates and economic fundamentals beyond point forecasting: the use of economic variables as predictors helps narrow down the range in which future exchange rates may lie, compared to random walk forecast intervals. Second, we propose an inference framework for cross-model comparison of out-of-sample forecast intervals. The proposed framework can be used for forecast-interval evaluation in a broader context, not just for the models and methods used in this paper. For instance, the framework can also be used to evaluate out-of-sample inflation forecasting.
As we will discuss later, we in fact derive forecast intervals from estimates of the distribution of changes in the exchange rate. Hence, in principle, evaluations across models can be done based on distributions instead of forecast intervals. However, focusing on interval forecasting performance allows us to compare models in two dimensions that are more relevant to practitioners: empirical coverage and length.
While the literature on interval forecasting for exchange rates is sparse, several authors have studied out-of-sample exchange rate density (distribution) forecasts, from which interval forecasts can be derived. Diebold, Hahn and Tay (1999) use the RiskMetrics model of JP Morgan (1996) to compute half-hour-ahead density forecasts for Deutschmark/Dollar and Yen/Dollar returns. Christoffersen and Mazzotta (2005) provide option-implied density and interval forecasts for four major exchange rates. Boero and Marrocu (2004) obtain one-day-ahead density forecasts for the Euro nominal effective exchange rate using self-exciting threshold autoregressive (SETAR) models. Sarno and Valente (2005) evaluate the exchange rate density forecasting performance of the Markov-switching vector equilibrium correction model that is developed by Clarida, Sarno, Taylor and Valente (2003). They find that information from the term structure of forward premia help the model to outperform the random walk in forecasting out-of-sample densities of the spot exchange rate. More recently, Hong, Li, and Zhao (2007) construct half-hour-ahead density forecasts for Euro/Dollar and Yen/Dollar exchange rates using a comprehensive set of univariate time series models that capture fat tails, time-varying volatility and regime switches.
There are several common features across the studies listed above, which make them different from our paper. First, the focus of the above studies is not to make connections between the exchange rate and economic fundamentals. These studies use high frequency data, which are not available for most conventional economic fundamentals. For instance, Diebold, Hahn, and Tay (1999) and Hong, Li, and Zhao (2007) use intra-day data. With the exception of Sarno and Valente (2005), all the studies focus only on univariate time series models. Second, these studies do not consider multi-horizon-ahead forecasts, perhaps due to the fact that their models are often highly nonlinear. Iterating nonlinear density models multiple horizons ahead is analytically difficult, if not infeasible. Lastly, the above studies assume that the densities are analytically defined for a given model. The semiparametric method used in this paper does not impose such restrictions.
Our choice of the semiparametric method is motivated by the difficulty of using macroeconomic models in exchange rate interval forecasting: these models typically do not describe the future distributions of exchange rates. For instance, the Taylor rule models considered in this paper do not describe any features of the data beyond the conditional means of future exchange rates. We address this difficulty by applying Robust Semiparametric forecast intervals (hereon RS forecast intervals) of Wu (2009).5 This method is useful since it does not require the model be correctly specified, or contain parametric assumptions about the future distribution of exchange rates.
We apply RS forecast intervals to a set of Taylor rule models that differ in terms of the assumptions on policy and interest rate smoothing rules. Following Molodtsova and Papell (2009), we include twelve OECD exchange rates (relative to the US dollar) over the post-Bretton Woods period in our dataset. For these twelve exchange rates, the out-of-sample RS forecast intervals at different forecast horizons are generated from the Taylor rule models and then compared with those of the random walk. The empirical coverages and lengths of forecast intervals are used as the evaluation criteria. Our empirical coverage and length tests are modified from Giacomini and White's (2006) predictive accuracy tests in the case of rolling, but fixed-size, estimation samples.
For a given nominal coverage (probability), the empirical coverage of forecast intervals derived from a forecasting model is the probability that the out-of-sample realizations (exchange rates) lie in the intervals. The length of the intervals is a measure of its tightness: the distance between its upper and lower bound. In general, the empirical coverage is not the same as its nominal coverage. Significantly missing the nominal coverage indicates poor quality of the model and intervals. One certainly wants the forecast intervals to contain out-of-sample realizations as close as possible to the probability they target. Most evaluation methods in the literature focus on comparing empirical coverages across models, following the seminal work of Christoffersen (1998). Following this literature, we first test whether forecast intervals of the Taylor rule models and the random walk have equally accurate empirical coverages. The model with more accurate coverages is considered the better model. In the cases where equal coverage accuracy cannot be rejected, we further test whether the lengths of forecast intervals are the same. The model with tighter forecast intervals provides more useful information about future values of the data, and hence is considered as a more useful forecasting model.
It is also important to establish what this paper is not
attempting. First, the inference procedure does not carry the
purpose of finding the correct model specification. Rather,
inference is on how useful models are in generating forecast
intervals, measured in terms of empirical coverages and lengths.
Second, this paper does not consider the possibility that there
might be alternatives to RS forecast intervals for the exchange
rate models we consider. Some models might perform better if
parametric distribution assumptions (e.g. the forecast errors are
conditionally heteroskedastic and ![]() distributed)
or other assumptions (e.g. the forecast errors are independent of
the predictors) are added. One could presumably estimate the
forecast intervals differently based on the same models, and then
compare those with the RS forecast intervals, but this is out of
the scope of this paper. As we described, we choose the RS method
for the robustness and flexibility achieved by the semiparametric
approach.
distributed)
or other assumptions (e.g. the forecast errors are independent of
the predictors) are added. One could presumably estimate the
forecast intervals differently based on the same models, and then
compare those with the RS forecast intervals, but this is out of
the scope of this paper. As we described, we choose the RS method
for the robustness and flexibility achieved by the semiparametric
approach.
First, the models considered in this paper are standard
macroeconomic models for exchange rate determination. These models
do not contain theory about the underlying distributions. Using RS
forecast intervals allows us to refrain from having to impose
subjective additional structures on the models. Our goal is to use
existing models to generate forecast intervals, instead of
developing new models. Second, RS forecast intervals are good
candidates as they always consistently estimates their population
counterparts, independent of the properties of the models and error
terms (
![]() ). With the sample sizes
we have, RS forecast intervals are deemed good approximations to
the truth.
). With the sample sizes
we have, RS forecast intervals are deemed good approximations to
the truth.
Our benchmark Taylor rule model is from Engel and West (2005) and Engel, Wang, and Wu (2008). For the purpose of comparison, several alternative Taylor rule models are also considered. These setups have been studied by Molodtsova and Papell (2009) and Engel, Mark, and West (2007). In general, we find that the Taylor rule models perform better than the random walk model, especially at long horizons: the models either have more accurate empirical coverages than the random walk, or in cases of equal coverage accuracy, the models have tighter forecast intervals than the random walk. The evidence of exchange rate predictability is much weaker in coverage tests than in length tests. In most cases, the Taylor rule models and the random walk have statistically equally accurate empirical coverages. So, under the conventional coverage test, the random walk model and the Taylor rule models perform equally well. However, the results of length tests suggest that Taylor rule fundamentals are useful in generating tighter forecasts intervals without losing accuracy in empirical coverages.
We also consider two other popular models in the literature: the monetary model and the model of purchasing power parity (PPP). Based on the same criteria, both models are found to perform better than the random walk in interval forecasting. As with the Taylor rule models, most evidence of exchange rate predictability comes from the length test: economic models have tighter forecast intervals than the random walk given statistically equivalent coverage accuracy. The PPP model performs worse than the benchmark Taylor rule model and the monetary model at short horizons. The benchmark Taylor rule model performs slightly better than the monetary model at most horizons.
Our findings suggest that exchange rate movements are linked to economic fundamentals. However, we acknowledge that the Meese-Rogoff puzzle remains difficult to understand. Although Taylor rule models offer statistically significant length reductions over the random walk, the reduction of length is quantitatively small, especially at short horizons. Forecasting exchange rates remains a difficult task in practice. There are some impressive advances in the literature, but most empirical findings remain fragile. As mentioned in Cheung, Chinn, and Pascual (2005), forecasts from economic fundamentals may work well for some currencies during certain sample periods but not for other currencies or sample periods. Engel, Mark, and West (2007) recently show that a relatively robust finding is that exchange rates are more predictable at longer horizons, especially when using panel data. We find greater predictability at longer horizons in our exercise. It would be of interest to investigate connections between our findings and theirs.
Several recent studies have attacked the puzzle from a different angle: there are reasons that economic fundamentals cannot forecast the exchange rate, even if the exchange rate is determined by these fundamentals. Engel and West (2005) show that existing exchange rate models can be written in a present-value asset-pricing format. In these models, exchange rates are determined not only by current fundamentals but also by expectations of what the fundamentals will be in the future. When the discount factor is large (close to one), current fundamentals receive very little weight in determining the exchange rate. Not surprisingly, the fundamentals are not very useful in forecasting. Nason and Rogers (2008) generalize the Engel-West theorem to a class of open-economy dynamic stochastic general equilibrium (DSGE) models. Other factors such as parameter instability and mis-specification (for instance, Rossi 2005) may also play important roles in understanding the puzzle. It is interesting to investigate conditions under which we can reconcile our findings with these studies.
The remainder of this paper is organized as follows. Section two describes the forecasting models we use, as well as the data. In section three, we illustrate how the RS forecast intervals are constructed from a given model. We also propose loss criteria to evaluate the quality of the forecast intervals and test statistics that are based on Giacomini and White (2006). Section four presents results of out-of-sample forecast evaluation. Finally, section five contains concluding remarks.
2. Models and Data
Seven models are considered in this paper. Let
![]() be the index of these models and
the first model be the benchmark model. A general setup of the
models takes the form of:
be the index of these models and
the first model be the benchmark model. A general setup of the
models takes the form of:
| (1) |
where
![]() is
is ![]() -period changes
of the (log) exchange rate, and
-period changes
of the (log) exchange rate, and
![]() contains economic variables
that are used in model
contains economic variables
that are used in model ![]() . Following the literature of
long-horizon regressions, both short- and long-horizon forecasts
are considered. Models differ in economic variables that are
included in matrix
. Following the literature of
long-horizon regressions, both short- and long-horizon forecasts
are considered. Models differ in economic variables that are
included in matrix
![]() . In the benchmark model,
. In the benchmark model,
![$\displaystyle \mathbf{X}_{1,t}\equiv\left[ \begin{array}[c]{ccc} \pi_{t}-\pi_{t}^{\ast} & y_{t}^{gap}-y_{t}^{gap\ast} & q_{t}\\ & & \end{array} \right] ,$](img10.gif) |
where ![]() (
(
![]() ) is the inflation rate, and
) is the inflation rate, and
![]() (
(
![]() ) is the output gap in the
home (foreign) country. The real exchange rate
) is the output gap in the
home (foreign) country. The real exchange rate ![]() is defined as
is defined as
![]() , where
, where
![]() (
(
![]() ) is the (log) consumer price
index in the home (foreign) country. This setup is motivated by the
Taylor rule model in Engel and West (2005) and Engel, Wang, and Wu
(2008). The next subsection describes this benchmark Taylor rule
model in detail.
) is the (log) consumer price
index in the home (foreign) country. This setup is motivated by the
Taylor rule model in Engel and West (2005) and Engel, Wang, and Wu
(2008). The next subsection describes this benchmark Taylor rule
model in detail.
We also consider the following models that have been studied in the literature:
| Model 2: | ![\begin{displaymath}\mathbf{X}_{2,t}\equiv\left[ \begin{array}[c]{cc} \pi_{t}-\pi_{t}^{\ast} & y_{t}^{gap}-y_{t}^{gap\ast}\ & \end{array}\right] \end{displaymath}](img19.gif) |
| Model 3: | ![\begin{displaymath}\mathbf{X}_{3,t}\equiv\left[ \begin{array}[c]{ccc} \pi_{t}-\pi_{t}^{\ast} & y_{t}^{gap}-y_{t}^{gap\ast} & i_{t-1}-i_{t-1}^{\ast }\ & & \end{array}\right] \end{displaymath}](img20.gif) , , |
| where |
|
| Model 4: | ![\begin{displaymath}\mathbf{X}_{4,t}\equiv\left[ \begin{array}[c]{cccc} \pi_{t}-\pi_{t}^{\ast} & y_{t}^{gap}-y_{t}^{gap\ast} & q_{t} & i_{t-1} -i_{t-1}^{\ast}\ & & & \end{array}\right] \end{displaymath}](img23.gif) |
| Model 5: | |
| Model 6: | |
| where |
|
| Model 7: |
Models 2-4 are the Taylor rule models studied in Molodtsova and
Papell (2009). Model 2 can be considered as the constrained
benchmark model in which PPP always holds. Molodtsova and Papell
(2009) include interest rate lags in models 3 and 4 to take into
account potential interest rate smoothing rules of the central
bank.6 Model 5 is the purchasing power parity
(PPP) model and model 6 is the monetary model. Both models have
been widely used in the literature. See Molodtsova and Papell
(2009) for the PPP model and Mark (1995) for the monetary model.
Model 7 is the driftless random walk model (
![]() ).7 Given a date
).7 Given a date
![]() and horizon
and horizon ![]() , the
objective is to estimate the forecast distribution of
, the
objective is to estimate the forecast distribution of
![]() conditional on
conditional on
![]() , and subsequently build
forecast intervals from the estimated forecast distribution. Before
moving to the econometric method, we first describe the Taylor rule
model that motivates the setup of our benchmark model.
, and subsequently build
forecast intervals from the estimated forecast distribution. Before
moving to the econometric method, we first describe the Taylor rule
model that motivates the setup of our benchmark model.
2.1 Benchmark Taylor Rule Model
Our benchmark model is the Taylor rule model that is derived in Engel and West (2005) and Engel, Wang, and Wu (2008). Following Molodtsova and Papell (2009), we focus on models that depend only on current levels of inflation and the output gap.8 The Taylor rule in the home country takes the form of:
| (2) |
where
![]() is the central bank's target for
the short-term interest rate at time
is the central bank's target for
the short-term interest rate at time ![]() ,
, ![]() is the equilibrium long-term rate,
is the equilibrium long-term rate, ![]() is the inflation rate,
is the inflation rate, ![]() is
the target inflation rate, and
is
the target inflation rate, and
![]() is the output gap. The foreign
country is assumed to follow a similar Taylor rule. In addition, we
follow Engel and West (2005) to assume that the foreign country
targets the exchange rate in its Taylor rule:
is the output gap. The foreign
country is assumed to follow a similar Taylor rule. In addition, we
follow Engel and West (2005) to assume that the foreign country
targets the exchange rate in its Taylor rule:
| (3) |
where
![]() is the targeted exchange rate.
Assume that the foreign country targets the PPP level of the
exchange rate:
is the targeted exchange rate.
Assume that the foreign country targets the PPP level of the
exchange rate:
![]() , where
, where
![]() and
and
![]() are logarithms of home and
foreign aggregate prices. In equation (3), we assume
that the policy parameters take the same values in the home and
foreign countries. Molodtsova and Papell (2009) denote this case as
"homogeneous Taylor rules". Our empirical results also hold in the
case of heterogenous Taylor rules. To simplify our presentation, we
assume that the home and foreign countries have the same long-term
inflation and interest rates. Such restrictions have been relaxed
in our econometric model after we include a constant term in
estimations.
are logarithms of home and
foreign aggregate prices. In equation (3), we assume
that the policy parameters take the same values in the home and
foreign countries. Molodtsova and Papell (2009) denote this case as
"homogeneous Taylor rules". Our empirical results also hold in the
case of heterogenous Taylor rules. To simplify our presentation, we
assume that the home and foreign countries have the same long-term
inflation and interest rates. Such restrictions have been relaxed
in our econometric model after we include a constant term in
estimations.
We do not consider interest rate smoothing in our benchmark
model. That is, the actual interest rate (![]() ) is
identical to the target rate in the benchmark model:
) is
identical to the target rate in the benchmark model:
| (4) |
Molodtsova and Papell (2009) consider the following interest rate smoothing rule:
| (5) |
where ![]() is the interest rate smoothing
parameter. We include these setups in models 3 and 4. Note that our
estimation methods do not require the monetary policy shock
is the interest rate smoothing
parameter. We include these setups in models 3 and 4. Note that our
estimation methods do not require the monetary policy shock
![]() and the interest rate smoothing shock
and the interest rate smoothing shock
![]() to satisfy any assumptions, aside
from smoothness of their distributions when conditioned on
predictors.
to satisfy any assumptions, aside
from smoothness of their distributions when conditioned on
predictors.
Substituting the difference of equations (2) and (3) into Uncovered Interest-rate Parity (UIP), we have:
![$\displaystyle s_{t}=E_{t}\left\{ (1-b)\sum_{j=0}^{\infty }b^{j}(p_{t+j}-p^{*}_{t+j})-b\sum_{j=0}^{\infty}b^{j}\left[ \delta_{y} (y^{gap}_{t+j}-y_{t+j}^{gap\ast})+\delta_{\pi}(\pi_{t+j}-\pi^{*}_{t+j})\right] \right\} ,$](img54.gif) |
(6) |
where the discount factor
![]() . Under some
conditions, the present value asset pricing format in equation
(6) can be written
into an error-correction form:9
. Under some
conditions, the present value asset pricing format in equation
(6) can be written
into an error-correction form:9
| (7) |
where the deviation of the exchange rate from its equilibrium level is defined as:
![$\displaystyle z_{t}=s_{t}-p_{t}+p_{t}^{\ast}+\frac{b}{1-b}\left[ \delta_{y}(y_{t}^{gap}-y_{t}^{gap\ast})+\delta_{\pi}(\pi_{t}-\pi_{t}^{\ast })\right] .$](img57.gif)
|
(8) |
We use equation (7)
as our benchmark setup in calculating h-horizon-ahead out-of-sample
forecasting intervals. According to equation (8), the matrix
![]() in equation (1) includes
economic variables
in equation (1) includes
economic variables
![]() ,
,
![]() , and
, and
![]() .10
.10
2.2 Data
The forecasting models and the corresponding forecast intervals are estimated using monthly data for twelve OECD countries. The United States is treated as the foreign country in all cases. For each country we synchronize the beginning and end dates of the data across all models estimated. The twelve countries and periods considered are: Australia (73:03-06:6), Canada (75:01-06:6), Denmark (73:03-06:6), France (77:12-98:12), Germany (73:03-98:12), Italy (74:12-98:12), Japan (73:03-06:6), Netherlands (73:03-98:12), Portugal (83:01-98:12), Sweden (73:03-04:11), Switzerland (75:09-06:6), and the United Kingdom (73:03-06:4).
The data is taken from Molodtsova and Papell (2009).11 With
the exception of interest rates, the data is transformed by taking
natural logs and then multiplying by 100. The nominal exchange
rates are end-of-month rates taken from the Federal Reserve Bank of
St. Louis database. Output data (![]() ) are proxied by
Industrial Production (IP) from the International Financial
Statistics (IFS) database. IP data for Australia and Switzerland
are only available at a quarterly frequency, and hence are
transformed from quarterly to monthly observations using the
quadratic-match average option in Eviews 4.0 by Molodtsova and
Papell (2009). Following Engel and West (2006), the output gap (
) are proxied by
Industrial Production (IP) from the International Financial
Statistics (IFS) database. IP data for Australia and Switzerland
are only available at a quarterly frequency, and hence are
transformed from quarterly to monthly observations using the
quadratic-match average option in Eviews 4.0 by Molodtsova and
Papell (2009). Following Engel and West (2006), the output gap (
![]() ) is calculated by quadratically
de-trending the industrial production for each country.
) is calculated by quadratically
de-trending the industrial production for each country.
Prices data (![]() ) are proxied by Consumer Price
Index (CPI) from the IFS database. Again, CPI for Australia is only
available at a quarterly frequency and the quadratic-match average
is used to impute monthly observations. Inflation rates are
calculated by taking the first differences of the logs of CPIs. The
money market rate from IFS (or "call money rate") is used as a
measure of the short-term interest rate set by the central bank.
Finally, M1 is used to measure the money supply for most countries.
M0 for the UK and M2 for Italy and Netherlands is used due to the
unavailability of M1 data.
) are proxied by Consumer Price
Index (CPI) from the IFS database. Again, CPI for Australia is only
available at a quarterly frequency and the quadratic-match average
is used to impute monthly observations. Inflation rates are
calculated by taking the first differences of the logs of CPIs. The
money market rate from IFS (or "call money rate") is used as a
measure of the short-term interest rate set by the central bank.
Finally, M1 is used to measure the money supply for most countries.
M0 for the UK and M2 for Italy and Netherlands is used due to the
unavailability of M1 data.
3. Econometric Method
For a given
model ![]() , the objective is to estimate from equation
(1)
the distribution of
, the objective is to estimate from equation
(1)
the distribution of
![]() conditional on data
conditional on data
![]() that is observed up to
time
that is observed up to
time ![]() . This is the
. This is the ![]() -horizon-ahead
forecast distribution of the exchange rate, from which the
corresponding forecast interval can be derived. For a given
-horizon-ahead
forecast distribution of the exchange rate, from which the
corresponding forecast interval can be derived. For a given
![]() , the forecast interval of coverage
, the forecast interval of coverage
![]() is an interval in which
is an interval in which
![]() is supposed to lie with a
probability of
is supposed to lie with a
probability of ![]() .
.
Models ![]() in equation (1) provide
only point forecasts of
in equation (1) provide
only point forecasts of
![]() . In order to construct
forecast intervals for a given model, we apply robust
semiparametric (RS) forecast intervals to all models. The nominal
. In order to construct
forecast intervals for a given model, we apply robust
semiparametric (RS) forecast intervals to all models. The nominal
![]() -coverage forecast interval of
-coverage forecast interval of
![]() conditional on
conditional on
![]() can be obtained by the
following three-step procedure:
can be obtained by the
following three-step procedure:
- Step 1.
- Estimate model
 by OLS and obtain residuals
 , for
, for
 .
. - Step 2.
- For a range of values of
 (sorted residuals
 ), estimate
the conditional distribution of
), estimate
the conditional distribution of
 by:
by:
(9) where
 ,
,
 is a multivariate Gaussian
kernel with a dimension the same as that of
is a multivariate Gaussian
kernel with a dimension the same as that of
 , and
, and  is the
smoothing parameter or bandwidth.12
is the
smoothing parameter or bandwidth.12 - Step 3.
- Find the
 and
and
 quantiles of the estimated
distribution, which are denoted by
quantiles of the estimated
distribution, which are denoted by
 and
and
 ,
repectively. The estimate of the
,
repectively. The estimate of the  -coverage
forecast interval for
-coverage
forecast interval for
 conditional on
 is:
is:
(10)
For each model ![]() , the above method uses the
forecast models in equation (1) to estimate
the location of the forecast distribution, while the nonparametric
kernel distribution estimate is used to estimate the shape. As a
result, the interval obtained from this method is
semiparametric. Wu (2009) shows that under some weak
regularity conditions, this method consistently estimates the
forecast distribution,13 and hence the forecast intervals of
, the above method uses the
forecast models in equation (1) to estimate
the location of the forecast distribution, while the nonparametric
kernel distribution estimate is used to estimate the shape. As a
result, the interval obtained from this method is
semiparametric. Wu (2009) shows that under some weak
regularity conditions, this method consistently estimates the
forecast distribution,13 and hence the forecast intervals of
![]() conditional on
conditional on
![]() , regardless of the
quality of model
, regardless of the
quality of model ![]() . That is, the forecast intervals
are robust. Stationarity of economic variables is one of
those regularity conditions. In our models, exchange rate
differences, interest rates and inflation rates are well-known to
be stationary, while empirical tests for real exchange rates and
output gaps generate mixed results. These results may be driven by
the difficulty of distinguishing a stationary, but persistent,
variable from a non-stationary one. In this paper, we take the
stationarity of these variables as given.
. That is, the forecast intervals
are robust. Stationarity of economic variables is one of
those regularity conditions. In our models, exchange rate
differences, interest rates and inflation rates are well-known to
be stationary, while empirical tests for real exchange rates and
output gaps generate mixed results. These results may be driven by
the difficulty of distinguishing a stationary, but persistent,
variable from a non-stationary one. In this paper, we take the
stationarity of these variables as given.
Model 7 is the random walk model. The estimator in equation
(9) becomes the
Empirical Distribution Function (EDF) of the exchange rate
innovations. Under regularity conditions, equation (9) consistently
estimates the unconditional distribution of
![]() , and can be used to form
forecast intervals for
, and can be used to form
forecast intervals for
![]() . The forecast intervals of
economic models and the random walk are compared. Our interest is
to test whether RS forecast intervals based on economic models are
more accurate than those based on the random walk model. We focus
on the empirical coverage and the length of forecast intervals in
our tests.
. The forecast intervals of
economic models and the random walk are compared. Our interest is
to test whether RS forecast intervals based on economic models are
more accurate than those based on the random walk model. We focus
on the empirical coverage and the length of forecast intervals in
our tests.
Following Christoffersen (1998) and related work, the first
standard we use is the empirical coverage. The empirical coverage
should be as close as possible to the nominal coverage (![]() ). Significantly missing the nominal coverage indicates
the inadequacy of the model and predictors for the given sample
size. For instance, if 90% forecast intervals calculated from a
model contain only 50% of out-of-sample observations, the model can
hardly be identified as useful for interval forecasting. This case
is called under-coverage. In contrast, over-coverage implies that
the intervals could be reduced in length (or improved in
tightness), but the forecast interval method and model are unable
to do that for the given sample size. An economic model is said to
outperform the random walk if its empirical coverage is more
accurate than that of the random walk.
). Significantly missing the nominal coverage indicates
the inadequacy of the model and predictors for the given sample
size. For instance, if 90% forecast intervals calculated from a
model contain only 50% of out-of-sample observations, the model can
hardly be identified as useful for interval forecasting. This case
is called under-coverage. In contrast, over-coverage implies that
the intervals could be reduced in length (or improved in
tightness), but the forecast interval method and model are unable
to do that for the given sample size. An economic model is said to
outperform the random walk if its empirical coverage is more
accurate than that of the random walk.
On the other hand, the empirical coverage of an economic model may be equally accurate as that of the random walk model, but the economic model has tighter forecast intervals than the random walk. We argue that the lengths of forecast intervals signify the informativeness of the intervals given that these intervals have equally accurate empirical coverages. In this case, the economic model is also considered to outperform the random walk in forecasting exchange rates. The empirical coverage and length tests are conducted at both short and long horizons for the six economic models relative to the random walk for each of the twelve OECD exchange rates.
We use tests that are applications of the unconditional predictive accuracy inference framework of Giacomini and White (2006). Unlike the tests of Diebold and Mariano (1995) and West (1996), our forecast evaluation tests do not focus on the asymptotic features of the forecasts. Rather, in the spirit of Giacomini and White (2006), we are comparing the population features of forecasts generated by rolling samples of fixed sample size. This contrasts to the traditional forecast evaluation methods in that although it uses asymptotic approximations to do the testing, the inference is not on the asymptotic properties of forecasts, but on their population finite sample properties. We acknowledge that the philosophy of this inference framework remains a point of contention, but it does tackle three important evaluation difficulties in this paper. First, it allows for evaluation of forecast intervals that are not parametrically derived. The density evaluation methods developed in well-known studies such as Diebold, Gunther, Tay (1998), Corradi and Swanson (2006a) and references within Corradi and Swanson (2006b) require that the forecast distributions be parametrically specified. Giacomini and White's (2006) method overcomes this challenge by allowing comparisons among parametric, semiparametric and nonparametric forecasts. As a result, in the cases of semiparametric and nonparametric forecasts, it also allows comparison of models with predictors of different dimensions, as evident in our exercise. Second, by comparing the finite sample properties of RS forecast intervals derived from different models, we avoid rejecting models that are mis-specified,14 but are nonetheless good approximations useful for forecasting. Finally, we can individually (though not jointly) test whether the forecast intervals differ in terms of empirical coverages and lengths, for the given estimation sample, and are not confined to focus only on empirical coverages or holistic properties of forecast distribution, such as probability integral transform.
3.1 Test of Equal Empirical Coverages
Suppose the sample size available to the researcher is
![]() and all data are collected in a vector
and all data are collected in a vector
![]() . Our inference procedure is
based on a rolling estimation scheme, with the size of the rolling
window fixed while
. Our inference procedure is
based on a rolling estimation scheme, with the size of the rolling
window fixed while
![]() . Let
. Let ![]() and
and ![]() be the size of the rolling window.
For each horizon
be the size of the rolling window.
For each horizon ![]() and model
and model ![]() , a
sequence of
, a
sequence of
![]()
![]() -coverage forecast intervals are generated using
rolling data:
-coverage forecast intervals are generated using
rolling data:
![]() for forecast
for date
for forecast
for date ![]() ,
,
![]() for forecast
for date
for forecast
for date ![]() , and so on, until forecast for date
, and so on, until forecast for date
![]() is generated using
is generated using
![]() .
.
Under this fixed-sample-size rolling scheme, for each finite
![]() we have
we have ![]() observations to
compare the empirical coverages and lengths across
observations to
compare the empirical coverages and lengths across ![]() models (
models (
![]() ). By fixing
). By fixing ![]() ,
we allow the finite sample properties of the forecast intervals to
be preserved as
,
we allow the finite sample properties of the forecast intervals to
be preserved as
![]() . Thus, the forecast
intervals and the associated forecast losses are simply functions
of a finite and fixed number of random variables. We are interested
in approximating the population moments of these objects by taking
. Thus, the forecast
intervals and the associated forecast losses are simply functions
of a finite and fixed number of random variables. We are interested
in approximating the population moments of these objects by taking
![]() . A loose analogy would
be finding the finite-sample properties of a certain parameter
estimator when the sample size is fixed at
. A loose analogy would
be finding the finite-sample properties of a certain parameter
estimator when the sample size is fixed at ![]() , by a
bootstrap with an arbitrarily large number of bootstrap
replications.
, by a
bootstrap with an arbitrarily large number of bootstrap
replications.
We conduct individual tests for the empirical coverages and
lengths. In each test, we define a corresponding forecast loss,
propose a test statistic and derive its asymptotic distribution. As
defined in equation (10),
let
![]() be the
be the
![]() horizon ahead RS forecast interval of
model
horizon ahead RS forecast interval of
model ![]() with a nominal coverage of
with a nominal coverage of ![]() . For out-of-sample forecast evaluation, we require
. For out-of-sample forecast evaluation, we require
![]() to be
constructed using data from
to be
constructed using data from
![]() to
to ![]() . The
coverage accuracy loss is defined as:
. The
coverage accuracy loss is defined as:
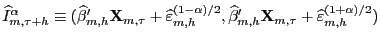
![$\displaystyle CL_{m,h}^{\alpha}=\left[ P(Y_{\tau+h}\in\widehat{I}^{\alpha}_{m,\tau +h})-\alpha\right] ^{2}.$](img137.gif)
|
(11) |
For economic models (![]() ), the goal is to
compare the coverage accuracy loss of RS forecast intervals of
model
), the goal is to
compare the coverage accuracy loss of RS forecast intervals of
model ![]() with that of the random walk (
with that of the random walk (![]() ). The null and alternative hypotheses are:
). The null and alternative hypotheses are:
Define the sample analog of the coverage accuracy loss in equation (11):
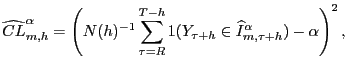 |
where
![]() is an index
function that equals one when
is an index
function that equals one when
![]() , and equals zero
otherwise. Applying the asymptotic test of Giacomini and White
(2006) to the sequence
, and equals zero
otherwise. Applying the asymptotic test of Giacomini and White
(2006) to the sequence
![]() and applying the Delta method, we can show that
and applying the Delta method, we can show that
| (12) |
where
![]() denotes convergence
in distribution, and
denotes convergence
in distribution, and
![]() is the long-run covariance
matrix between
is the long-run covariance
matrix between
![]() and
and
![]() . The matrix
. The matrix
![]() is defined as:
is defined as:
![]() can be estimated consistently
by its sample analog
can be estimated consistently
by its sample analog
![]() , while
, while
![]() can be estimated by some HAC
estimator
can be estimated by some HAC
estimator
![]() , such as Newey and
West (1987).15The test statistic for coverage test
is defined as:
, such as Newey and
West (1987).15The test statistic for coverage test
is defined as:
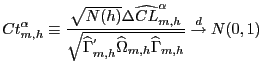
|
(13) |
3.2 Test of Equal Empirical Lengths
Define the length loss as:
| (14) |
where
![]() is the Lesbesgue measure. To
compare the length loss of RS forecast intervals of economic models
is the Lesbesgue measure. To
compare the length loss of RS forecast intervals of economic models
![]() with that of the random walk
(
with that of the random walk
(![]() , the null and alternative hypotheses
are:
, the null and alternative hypotheses
are:
The sample analog of the length loss for model ![]() is defined as:
is defined as:
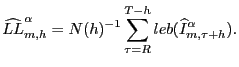 |
Directly applying the test of Giacomini and White (2006), we have
| (15) |
where
![]() is the long-run variance of
is the long-run variance of
![]() . Let
. Let
![]() be the HAC estimator
of
be the HAC estimator
of
![]() . The test statistic for
empirical length is defined as:
. The test statistic for
empirical length is defined as:
|
(16) |
3.3 Discussion
The coverage accuracy loss function is symmetric in our paper.
In practice, an asymmetric loss function may be better when looking
for an exchange rate forecast model to help make policy or business
decisions. Under-coverage is arguably a more severe problem than
over-coverage in practical situations. However, the focus of this
paper is the disconnect between economic fundamentals and the
exchange rate. Our goal is to investigate which model comes closer
to the data: the random walk or fundamental-based models. It is not
critical in this case whether coverage inaccuracy comes from the
under- or over-coverage. We acknowledge that the use of symmetric
coverage loss remains a caveat, especially since we are using the
coverage accuracy test as a pre-test for the tests of length.
Clearly, there is a tradeoff between the empirical coverage and the
length of forecast intervals. Given the same center,16
intervals with under-coverage have shorter lengths than intervals
with over-coverage. In this case, the length test is in favor of
models that systematically under-cover the targeted nominal
coverage when compared to a model that systematically over-covers.
This problem cannot be detected by the coverage accuracy test with
symmetric loss function because over- and under-coverage are
treated equally. However, our results in section 4 show that there
is no evidence of systematic under-coverage for the economic models
considered in this paper. For instance, in Table 1,
one-month-ahead (![]() ) forecast intervals over-cover
the nominal coverage (90%) for eight out of twelve exchange
rates.17 Note that under-coverage does not
guarantee shorter intervals either in our paper, because forecast
intervals of different models usually have different
centers.18 In addition, we also compare the
coverage of economic models and the random walk directly in an
exercise not reported in this paper. There is no evidence that the
coverage of economic models is systematically smaller than that of
the random walk.19
) forecast intervals over-cover
the nominal coverage (90%) for eight out of twelve exchange
rates.17 Note that under-coverage does not
guarantee shorter intervals either in our paper, because forecast
intervals of different models usually have different
centers.18 In addition, we also compare the
coverage of economic models and the random walk directly in an
exercise not reported in this paper. There is no evidence that the
coverage of economic models is systematically smaller than that of
the random walk.19
As we have mentioned, comparisons across models can also be done at the distribution level. We choose interval forecasts for two reasons. First, interval forecasts have been widely used and reported by the practitioners. For instance, the Bank of England calculates forecast intervals of inflation in its inflation reports. Second, compared to evaluation metrics for density forecasts, the empirical coverage and length loss functions of interval forecasts, and the subsequent interpretations of test rejection/acceptance are more intuitive.
4. Results
We apply RS
forecast intervals for each model for a given nominal coverage of
![]() . There is no particular reason
why we chose 0.9 as the nominal coverage. Some auxiliary results
show that our qualitative findings do not depend on the choice of
. There is no particular reason
why we chose 0.9 as the nominal coverage. Some auxiliary results
show that our qualitative findings do not depend on the choice of
![]() . Due to different sample sizes across
countries, we choose different sizes for the rolling window
(
. Due to different sample sizes across
countries, we choose different sizes for the rolling window
(![]() ) for different countries. Our rule is very
simple: for countries with
) for different countries. Our rule is very
simple: for countries with ![]() , we choose
, we choose
![]() , otherwise we set
, otherwise we set ![]() .20 Again, from our experience,
tampering with
.20 Again, from our experience,
tampering with ![]() does not change the qualitative
results, unless
does not change the qualitative
results, unless ![]() is chosen to be unusually big or
small.
is chosen to be unusually big or
small.
For time horizons
![]() and models
and models ![]() , we construct a sequence of
, we construct a sequence of ![]() 90%
forecast intervals
90%
forecast intervals
![]() for the
for the
![]() -horizon change of the exchange rate
-horizon change of the exchange rate
![]() . Then we compare economic
models and the random walk by computing empirical coverages,
lengths and test statistics
. Then we compare economic
models and the random walk by computing empirical coverages,
lengths and test statistics
![]() and
and
![]() as described in section 3. We first
report the results of our benchmark model. After that, results of
alternative models are reported and discussed.
as described in section 3. We first
report the results of our benchmark model. After that, results of
alternative models are reported and discussed.
4.1 Results of Benchmark Model
Table 1 shows results of
the benchmark Taylor rule model. For each time horizon ![]() and exchange rate, the first column (Cov.) reports the
empirical coverage for the given nominal coverage of 90%. The
second column (Leng.) reports the length of forecast intervals (the
distance between upper and lower bounds). The length is multiplied
by 100 and therefore expressed in terms of the percentage change of
the exchange rate. For instance, the empirical coverage and length
of the one-month-ahead forecast interval for the Australian dollar
are
and exchange rate, the first column (Cov.) reports the
empirical coverage for the given nominal coverage of 90%. The
second column (Leng.) reports the length of forecast intervals (the
distance between upper and lower bounds). The length is multiplied
by 100 and therefore expressed in terms of the percentage change of
the exchange rate. For instance, the empirical coverage and length
of the one-month-ahead forecast interval for the Australian dollar
are ![]() and
and ![]() , respectively.
It means that on average, with a chance of 89.5%, the
one-month-ahead change of AUD/USD lies in an interval with length
, respectively.
It means that on average, with a chance of 89.5%, the
one-month-ahead change of AUD/USD lies in an interval with length
![]() %. We use superscripts
%. We use superscripts ![]() ,
,
![]() , and
, and ![]() to denote that the
null hypothesis of equal empirical coverage accuracy/length is
rejected in favor of the Taylor rule model at a confidence level of
10%, 5%, and 1% respectively. Superscripts
to denote that the
null hypothesis of equal empirical coverage accuracy/length is
rejected in favor of the Taylor rule model at a confidence level of
10%, 5%, and 1% respectively. Superscripts ![]() ,
,
![]() , and
, and ![]() are used for
rejections in favor of the random walk analogously.
are used for
rejections in favor of the random walk analogously.
We summarize our findings in three panels. In the first panel ((1) Coverage Test), the row of "Model Better" reports the number of exchange rates that the Taylor rule model has more accurate empirical coverages than the random walk. The row of "RW Better" reports the number of exchange rates for which the random walk outperforms the Taylor rule model under the same criterion. In the second panel ((2) Length Test Given Equal Coverage Accuracy), a better model is the one with tighter forecast intervals given equal coverage accuracy. In the last panel ((1)+(2)), a better model is the one with either more accurate coverages, or tighter forecast intervals given equal coverage accuracy.
For most exchange rates and time horizons, the Taylor rule model and the random walk model have statistically equally accurate empirical coverages. The null hypothesis of equal coverage accuracy is rejected in only six out of sixty tests (two rejections each at horizons 6, 9, and 12). Five out of six rejections are in favor of the Taylor rule model. That is, the empirical coverage of the Taylor rule model is closer to the nominal coverage than those of the random walk. However, based on the number of rejections (5) in a total of sixty tests, there is no strong evidence that the Taylor rule model can generate more accurate empirical coverages than the random walk.
In cases where the Taylor rule model and the random walk have
equally accurate empirical coverages, the Taylor rule model
generally has equal or significantly tighter forecast intervals
than the random walk. In forty-two out of fifty-four cases, the
null hypothesis of equally tight forecast intervals is rejected in
favor of the Taylor rule model. In contrast, the null hypothesis is
rejected in only three cases in favor of the random walk. The
evidence of exchange rate predictability is more pronounced at
longer horizons. At horizon twelve (![]() ), for all
cases where empirical coverage accuracies between the random walk
and the Taylor rule model are statistically equivalent, the Taylor
rule model has significantly tighter forecast intervals than the
random walk.
), for all
cases where empirical coverage accuracies between the random walk
and the Taylor rule model are statistically equivalent, the Taylor
rule model has significantly tighter forecast intervals than the
random walk.
As for each individual exchange rate, the benchmark Taylor rule model works best for the French Franc, the Deutschmark, the Dutch Guilder, the Swedish Krona, and the British Pound: for all time horizons, the model has tighter forecast intervals than the random walk, while their empirical coverages are statistically equally accurate. The Taylor rule model performs better than the random walk in most horizons for the remaining exchange rates except the Portuguese Escudo, for which the Taylor rule model outperforms the random walk only at long horizons.
4.2 Results of Alternative Models
Five alternative economic models are also compared with the random walk: three alternative Taylor rule models that are studied in Molodtsova and Papell (2009), the PPP model, and the monetary model. Tables 2-6 report results of these alternative models.
In general, results of coverage tests do not show strong evidence that economic models can generate more accurate coverages than the random walk at either short or long horizons. However, after considering length tests, we find that economic models perform better than the random walk, especially at long horizons. Taylor rule model 4 (the benchmark model with interest rate smoothing Table 4) and the PPP model (Table 5) perform the best among alternative models. Results of these two models are very similar to that of the benchmark Taylor rule model. At horizon twelve, both models outperform the random walk for most exchange rates under our out-of-sample forecast interval evaluation criteria. The performance of Taylor rule model 2 (Table 2) and 3 (Table 3) is relatively less impressive than other models, but for more than half of the exchange rates, the economic models outperform the random walk at several horizons in out-of-sample interval forecasts.
Comparing the benchmark Taylor rule model, the PPP model and the monetary model, the performance of the PPP model (Table 5) is worse than the other two models at short horizons. Compared to the Taylor rule and PPP models, the monetary model outperforms the random walk for a smaller number of exchange rates at horizons 6, 9, and 12. Overall, the benchmark Taylor rule model seems to perform slightly better than the monetary and PPP models. Molodtsova and Papell (2009) find similar results in their point forecasts.
Table 7 shows results
with heterogeneous Taylor rules.21 In this model, we
relaxed the assumption that the Taylor rule coefficients are the
same in the home and foreign countries. We replace
![]() and
and
![]() in matrix
in matrix
![]() of the benchmark model with
of the benchmark model with
![]() and
and
![]() , where
, where
![]() ,
,
![]() ,
,
![]() , and
, and
![]() are Taylor rule
coefficients estimated from the data of home and foreign countries.
The main findings in the benchmark model also hold in Table 7.
are Taylor rule
coefficients estimated from the data of home and foreign countries.
The main findings in the benchmark model also hold in Table 7.
4.3 Discussion
After Mark (1995) first documents exchange rate predictability at long horizons, long-horizon exchange rate predictability has become a very active area in the literature. With panel data, Engel, Mark, and West (2007) recently show that the long-horizon predictability of the exchange rate is relatively robust in the exchange rate forecasting literature. We find similar results in our interval forecasts. The evidence of long-horizon predictability seems robust across different models and currencies when both empirical coverage and length tests are used. At horizon twelve, all economic models outperform the random walk for six exchange rates: the Australian Dollar, French Franc, Italian Lira, Japanese Yen, Swedish Krona, and the British Pound in the sense that interval lengths of economic models are smaller than those of the random walk, given equivalent coverage accuracy. This is true only for the Danish Kroner and Swiss Franc at horizon one. We also notice that there is no clear evidence of long-horizon predictability based on the tests of empirical coverage accuracy only.
Molodtsova and Papell (2009) find strong out-of-sample exchange
rate predictability for Taylor rule models even at the short
horizon. In our paper, the evidence for exchange rate
predictability at short horizons is not very strong. This finding
may be a result of some assumptions we have used to simplify our
computation. For instance, an ![]() -coverage
forecast interval in our paper is always constructed using the
-coverage
forecast interval in our paper is always constructed using the
![]() and
and
![]() quantiles. Alternatively, we
can choose quantiles that minimize the length of intervals, given
the nominal coverage.22 In addition, the development of more
powerful testing methods may also be helpful. The evidence of
exchange rate predictability in Molodtsova and Papell (2009) is
partly driven by the testing method recently developed by Clark and
West (2006, 2007). We acknowledge that whether or not short-horizon
results can be improved remains an interesting question, but do not
pursue this in the current paper. The purpose of this paper is to
show the connection between the exchange rate and economic
fundamentals from an interval forecasting perspective.
Predictability either at short- or long-horizons will serve this
purpose.
quantiles. Alternatively, we
can choose quantiles that minimize the length of intervals, given
the nominal coverage.22 In addition, the development of more
powerful testing methods may also be helpful. The evidence of
exchange rate predictability in Molodtsova and Papell (2009) is
partly driven by the testing method recently developed by Clark and
West (2006, 2007). We acknowledge that whether or not short-horizon
results can be improved remains an interesting question, but do not
pursue this in the current paper. The purpose of this paper is to
show the connection between the exchange rate and economic
fundamentals from an interval forecasting perspective.
Predictability either at short- or long-horizons will serve this
purpose.
Though we find that economic fundamentals are helpful for forecasting exchange rates, we acknowledge that exchange rate forecasting in practice is still a difficult task. The forecast intervals from economic models are statistically tighter than those of the random walk, but they remain fairly wide. For instance, the distance between the upper and lower bound of three-month-ahead forecast intervals is usually a 20% change of the exchange rates. Figures 1-3 show the length of forecast intervals generated by the benchmark Taylor rule model and the random walk for the British Pound, the Deutschmark, and the Japanese Yen at different horizons.23 At the horizon of 12 months, the length of forecast intervals in the Taylor rule model is usually smaller than that in the random walk. However, at shorter horizons, such as 1 month, the difference is quantitatively small.
5. Conclusion
There is a growing strand of literature that uses Taylor rules to model exchange rate movements. Our paper contributes to the literature by showing that Taylor rule fundamentals are useful in forecasting the distribution of exchange rates. We apply Robust Semiparametric forecast intervals of Wu (2009) to a group of Taylor rule models for twelve OECD exchange rates. The forecast intervals generated by the Taylor rule models are in general tighter than those of the random walk, given that these intervals cover the realized exchange rates equally well. The evidence of exchange rate predictability is more pronounced at longer horizons, a result that echoes previous long-horizon studies such as Mark (1995). The benchmark Taylor rule model is also found to perform better than the monetary and PPP models based on out-of-sample interval forecasts.
Though we find some empirical support for the connection between the exchange rate and economic fundamentals, we acknowledge that the detected connection is weak. The reductions of the lengths of forecast intervals are quantitatively small, though they are statistically significant. Forecasting exchange rates remains a difficult task in practice. Engel and West (2005) argue that as the discount factor gets closer to one, present value asset pricing models place greater weight on future fundamentals. Consequently, current fundamentals have very weak forecasting power and exchange rates appear to follow approximately a random walk. Under standard assumptions in Engel and West (2005), the Engel-West theorem does not imply that exchange rates are more predictable at longer horizons or that economic models can outperform the random walk in forecasting exchange rates based on out-of-sample interval forecasts. However, modifications to these assumptions may be able to reconcile the Engel-West explanation with empirical findings of exchange rate predictability. For instance, Engel, Wang, and Wu (2008) find that when there exist stationary, but persistent, unobservable fundamentals, for example risk premium, the Engel-West explanation predicts long-horizon exchange rate predictability in point forecasts, though the exchange rate still approximately follows a random walk at short horizons. It would also be of interest to study conditions under which our findings in interval forecasts can be reconciled with the Engel-West theorem.
We believe other issues, such as parameter instability (Rossi, 2005), nonlinearity (Kilian and Taylor, 2003), real time data (Faust, Rogers, and Wright, 2003, Molodtsova, Nikolsko-Rzhevskyy, and Papell, 2008a, 2008b), and model selection (Sarno and Valente, forthcoming) are all contributing to the Meese-Rogoff puzzle. Panel data are also found helpful in detecting exchange rate predictability, especially at long horizons. For instance, see Mark and Sul (2001), Engel, Mark, and West (2007), and Rogoff and Stavrakeva (2008). It would be interesting to incorporate these studies into interval forecasting. We leave these extensions for future research.
Table 1.-Panel 1: Results of Benchmark Taylor Rule Model
| Cov. h=1 | Leng. h=1 | Cov. h=3 | Leng. h=3 | Cov. h=6 | Leng. h=6 | Cov. h=9 | Leng. h=9 | Cov. h=12 | Leng. h=12 | |
|---|---|---|---|---|---|---|---|---|---|---|
Australian Dollar | 0.895 | 7.114 | 0.888 | 14.209c | 0.959 | 21.140 | 0.942 | 26.613 | 0.963 | 29.175c |
Canadian Dollar | 0.814 | 3.480 | 0.794 | 6.440c | 0.738 | 8.483c | 0.675 | 8.669c | 0.596x | 9.707c |
Danish Kroner | 0.920 | 8.676c | 0.939 | 17.415c | 0.954 | 26.198 | 0.922 | 28.712c | 0.968 | 37.123c |
French Franc | 0.912 | 8.921c | 0.860 | 15.728c | 0.928c | 26.007c | 0.957 | 29.924c | 0.934 | 36.883c |
Deutschmark | 0.927 | 8.327c | 0.879 | 18.634c | 0.894 | 27.923c | 0.960a | 33.734c | 0.969 | 39.618c |
Italian Lira | 0.899 | 8.291c | 0.875 | 18.305 | 0.910 | 26.788c | 0.846 | 32.545c | 0.874 | 37.151c |
Japanese Yen | 0.915 | 9.633z | 0.909 | 19.762 | 0.892 | 28.451c | 0.932 | 33.793c | 0.883 | 37.728c |
Dutch Guilder | 0.917 | 8.726c | 0.907 | 18.615c | 0.933 | 27.458c | 0.941b | 30.902c | 0.959a | 40.177c |
Portuguese Escudo | 0.901 | 8.580z | 0.928 | 18.758z | 0.894c | 23.552c | 0.825 | 27.086 | 0.867 | 32.092c |
Swedish Krona | 0.839 | 7.360c | 0.860 | 15.413c | 0.874 | 23.930c | 0.820 | 28.090c | 0.834 | 37.432c |
Swiss Franc | 0.947 | 9.358c | 0.916 | 19.655 | 0.963 | 26.553c | 0.963 | 30.780c | 0.899 | 35.008c |
British Pound | 0.919 | 8.413a | 0.923 | 16.592c | 0.912 | 23.317c | 0.900 | 26.942c | 0.855 | 25.905c |
Note: –h denotes forecast horizons for monthly data. –For each horizon (h), the first column (Cov.) reports empirical coverages given a nominal coverage of 90%. The second column (Leng.) reports the length of forecast intervals in terms of percentage change of the exchange rate. Empirical coverages and lengths are averages across N(h) out-of-sample trials. –Superscripts a, b, c in the column of Cov. (Leng.) denote rejections of equal coverage accuracy (equal length) in favor of the economic model at a 10%, 5% and 1% confidence level respectively. Superscripts x, y, z are defined analogously for rejections in favor of the random walk
Table 1.-Panel 2: Results of Benchmark Taylor Rule Model, Coverage Test
| h=1 | h=3 | h=6 | h=9 | h=12 | |
|---|---|---|---|---|---|
| Model Better | 0 | 0 | 2 | 2 | 1 |
| RW Better | 0 | 0 | 0 | 0 | 1 |
Note: In this panel, a better model is the one with more accurate empirical coverages. RW is the abbreviation of Random Walk.
Table 1.-Panel 3: Results of Benchmark Taylor Rule Model, Length Test Given Equal Coverage Accuracy
| h=1 | h=3 | h=6 | h=9 | h=12 | |
|---|---|---|---|---|---|
| Model Better | 8 | 8 | 8 | 8 | 10 |
| RW Better | 2 | 1 | 0 | 0 | 0 |
Note: In this panel, a better model is the one with tighter forecast intervals given equal coverage accuracy.
Table 1.-Panel 4: Results of Benchmark Taylor Rule Model, Coverage Test and Length Test Given Equal Coverage Accuracy
| h=1 | h=3 | h=6 | h=9 | h=12 | |
|---|---|---|---|---|---|
| Model Better | 8 | 8 | 10 | 10 | 11 |
| RW Better | 2 | 1 | 0 | 0 | 1 |
Note: In this panel, a better model is the one with either more accurate coverages or tighter forecast intervals given equal coverage accuracy.
Table 2.-Panel 1: Results of Benchmark Taylor Rule Model Two
| Cov. h=1 | Leng. h=1 | Cov. h=3 | Leng. h=3 | Cov. h=6 | Leng. h=6 | Cov. h=9 | Leng. h=9 | Cov. h=12 | Leng. h=12 | |
|---|---|---|---|---|---|---|---|---|---|---|
Australian Dollar | 0.884 | 7.146y | 0.899 | 15.086c | 0.928 | 21.327 | 0.901 | 27.329 | 0.872 | 30.815b |
Canadian Dollar | 0.825 | 3.442c | 0.783 | 6.321c | 0.814 | 8.490c | 0.858 | 10.034c | 0.825 | 11.921c |
Danish Kroner | 0.915 | 8.753a | 0.939 | 17.764c | 0.954 | 27.479z | 0.953 | 33.426y | 0.942 | 40.717 |
French Franc | 0.951 | 9.042c | 0.930 | 18.783 | 0.949c | 29.161c | 0.936 | 34.994c | 0.868 | 42.081c |
Deutschmark | 0.917 | 9.090 | 0.869 | 19.217 | 0.952 | 29.746 | 0.941a | 39.093a | 0.980 | 44.571z |
Italian Lira | 0.928 | 9.196 | 0.875 | 18.322 | 0.895 | 26.926c | 0.869 | 35.883c | 0.898a | 41.235z |
Japanese Yen | 0.915 | 9.568x | 0.914 | 19.734 | 0.912 | 29.344c | 0.937 | 36.834 | 0.942 | 44.385c |
Dutch Guilder | 0.908 | 8.586c | 0.888 | 18.782c | 0.962 | 29.777 | 0.990 | 39.507z | 0.990 | 47.514z |
Portuguese Escudo | 0.916 | 8.005 | 0.957 | 17.924z | 0.909c | 24.270b | 0.889 | 28.533z | 0.883a | 35.338c |
Swedish Krona | 0.867 | 7.624 | 0.860 | 16.132 | 0.857 | 24.500c | 0.837 | 32.825 | 0.811 | 37.772c |
Swiss Franc | 0.941 | 9.953b | 0.928 | 20.105 | 0.982 | 29.758c | 0.994 | 38.267z | 0.962 | 45.965z |
British Pound | 0.919 | 8.627z | 0.933 | 17.334c | 0.922 | 26.227c | 0.937 | 31.044c | 0.957 | 36.397c |
Note: –h denotes forecast horizons for monthly data. –For each horizon (h), the first column (Cov.) reports empirical coverages given a nominal coverage of 90%. The second column (Leng.) reports the length of forecast intervals in terms of percentage change of the exchange rate. Empirical coverages and lengths are averages across N(h) out-of-sample trials. –Superscripts a, b, c in the column of Cov. (Leng.) denote rejections of equal coverage accuracy (equal length) in favor of the economic model at a 10%, 5% and 1% confidence level respectively. Superscripts x, y, z are defined analogously for rejections in favor of the random walk.
Table 2.-Panel 2: Results of Benchmark Taylor Rule Model Two, Coverage Test
| h=1 | h=3 | h=6 | h=9 | h=12 | |
|---|---|---|---|---|---|
| Model Better | 0 | 0 | 2 | 1 | 2 |
| RW Better | 0 | 0 | 0 | 0 | 0 |
Note: In this panel, a better model is the one with more accurate empirical coverages. RW is the abbreviation of Random Walk.
Table 2.-Panel 3: Results of Benchmark Taylor Rule Model Two, Length Test Given Equal Coverage Accuracy
| h=1 | h=3 | h=6 | h=9 | h=12 | |
|---|---|---|---|---|---|
| Model Better | 5 | 5 | 6 | 4 | 6 |
| RW Better | 3 | 1 | 1 | 4 | 3 |
Note: In this panel, a better model is the one with tighter forecast intervals given equal coverage accuracy.
Table 2.-Panel 4: Results of Benchmark Taylor Rule Model Two, Coverage Test and Length Test Given Equal Coverage Accuracy
| h=1 | h=3 | h=6 | h=9 | h=12 | |
|---|---|---|---|---|---|
| Model Better | 5 | 5 | 8 | 5 | 8 |
| RW Better | 3 | 1 | 1 | 4 | 3 |
Note: In this panel, a better model is the one with either more accurate coverages or tighter forecast intervals given equal coverage accuracy.
Table 3.-Panel 1: Results of Benchmark Taylor Rule Model Three
| Cov. h=1 | Leng. h=1 | Cov. h=3 | Leng. h=3 | Cov. h=6 | Leng. h=6 | Cov. h=9 | Leng. h=9 | Cov. h=12 | Leng. h=12 | |
|---|---|---|---|---|---|---|---|---|---|---|
Australian Dollar | 0.884 | 7.229z | 0.899 | 15.055c | 0.881 | 21.055 | 0.885 | 26.359c | 0.867 | 30.234c |
Canadian Dollar | 0.831 | 3.453b | 0.789 | 6.408c | 0.814 | 8.629c | 0.864 | 10.220c | 0.819 | 11.971c |
Danish Kroner | 0.920 | 8.753b | 0.934 | 17.649c | 0.949 | 27.523z | 0.948 | 33.307 | 0.936 | 40.070 |
French Franc | 0.951 | 9.171 | 0.740 | 14.488c | 0.722 | 20.313c | 0.915 | 35.562a | 0.813 | 41.350c |
Deutschmark | 0.908 | 9.020 | 0.897 | 19.303 | 0.914 | 29.676 | 0.901c | 37.291c | 0.878 | 44.761z |
Italian Lira | 0.928 | 8.900a | 0.875 | 17.206c | 0.872 | 26.674c | 0.839 | 34.819c | 0.787 | 39.569c |
Japanese Yen | 0.905 | 9.179c | 0.878 | 18.907c | 0.892 | 25.883c | 0.927 | 31.259c | 0.894 | 37.049c |
Dutch Guilder | 0.927 | 8.910 | 0.907 | 19.204a | 0.952 | 29.426a | 0.951a | 36.896c | 0.959 | 46.321z |
Portuguese Escudo | 0.930 | 7.961 | 0.942 | 16.883c | 0.955a | 23.786 | 0.905 | 26.620c | 0.850 | 33.745c |
Swedish Krona | 0.867 | 7.316c | 0.848 | 15.017c | 0.840 | 23.241c | 0.791 | 29.265c | 0.757 | 33.751c |
Swiss Franc | 0.929 | 9.761b | 0.922 | 19.517c | 0.939 | 28.437b | 0.926c | 37.519 | 0.911 | 45.619 |
British Pound | 0.929 | 8.239a | 0.939 | 16.213c | 0.927 | 23.951c | 0.905 | 28.720c | 0.952 | 34.900c |
Note: –h denotes forecast horizons for monthly data. –For each horizon (h), the first column (Cov.) reports empirical coverages given a nominal coverage of 90%. The second column (Leng.) reports the length of forecast intervals in terms of percentage change of the exchange rate. Empirical coverages and lengths are averages across N(h) out-of-sample trials. –Superscripts a, b, c in the column of Cov. (Leng.) denote rejections of equal coverage accuracy (equal length) in favor of the economic model at a 10%, 5% and 1% confidence level respectively. Superscripts x, y, z are defined analogously for rejections in favor of the random walk.
Table 3.-Panel 2: Results of Benchmark Taylor Rule Model Three, Coverage Test
| h=1 | h=3 | h=6 | h=9 | h=12 | |
|---|---|---|---|---|---|
| Model Better | 0 | 0 | 1 | 3 | 0 |
| RW Better | 0 | 0 | 0 | 0 | 0 |
Note: In this panel, a better model is the one with more accurate empirical coverages. RW is the abbreviation of Random Walk.
Table 3.-Panel 3: Results of Benchmark Taylor Rule Model Three, Length Test Given Equal Coverage Accuracy
| h=1 | h=3 | h=6 | h=9 | h=12 | |
|---|---|---|---|---|---|
| Model Better | 7 | 11 | 8 | 8 | 8 |
| RW Better | 1 | 0 | 1 | 0 | 2 |
Note: In this panel, a better model is the one with tighter forecast intervals given equal coverage accuracy.
Table 3.-Panel 4: Results of Benchmark Taylor Rule Model Three, Coverage Test and Length Test Given Equal Coverage Accuracy
| h=1 | h=3 | h=6 | h=9 | h=12 | |
|---|---|---|---|---|---|
| Model Better | 7 | 11 | 9 | 11 | 8 |
| RW Better | 1 | 0 | 1 | 0 | 2 |
Note: In this panel, a better model is the one with either more accurate coverages or tighter forecast intervals given equal coverage accuracy.
Table 4.-Panel 1: Results of Benchmark Taylor Rule Model Four
| Cov. h=1 | Leng. h=1 | Cov. h=3 | Leng. h=3 | Cov. h=6 | Leng. h=6 | Cov. h=9 | Leng. h=9 | Cov. h=12 | Leng. h=12 | |
|---|---|---|---|---|---|---|---|---|---|---|
Australian Dollar | 0.895 | 7.119 | 0.888 | 14.424c | 0.928 | 20.966 | 0.927 | 25.304c | 0.872 | 27.492c |
Canadian Dollar | 0.814 | 3.425c | 0.771 | 6.366c | 0.698 | 8.019c | 0.651 | 8.631c | 0.494y | 7.693c |
Danish Kroner | 0.920 | 8.703c | 0.929 | 17.536c | 0.964 | 26.025 | 0.984x | 30.891c | 0.963 | 36.545c |
French Franc | 0.892 | 8.361c | 0.870 | 16.079c | 0.938c | 25.950c | 0.883 | 30.016c | 0.791 | 35.755c |
Deutschmark | 0.927 | 8.314c | 0.879 | 18.652c | 0.894 | 26.803c | 0.931c | 33.350c | 0.969 | 36.393c |
Italian Lira | 0.891 | 8.663c | 0.838 | 17.575c | 0.865 | 26.387c | 0.746 | 32.270c | 0.724 | 36.422c |
Japanese Yen | 0.905 | 9.157c | 0.863 | 18.708c | 0.866 | 24.417c | 0.869 | 28.730c | 0.851 | 31.470c |
Dutch Guilder | 0.936 | 8.815 | 0.897 | 18.368c | 0.914 | 26.700c | 0.931c | 30.036c | 0.796 | 29.462c |
Portuguese Escudo | 0.901 | 8.525z | 0.913a | 17.110 | 0.939c | 23.461c | 0.889 | 27.096a | 0.917 | 28.778c |
Swedish Krona | 0.861 | 7.289c | 0.860 | 15.321c | 0.869 | 23.340c | 0.773 | 27.198c | 0.728 | 31.843c |
Swiss Franc | 0.947 | 9.149c | 0.940 | 19.782a | 0.811 | 22.796c | 0.808 | 26.148c | 0.671 | 26.683c |
British Pound | 0.919 | 8.113a | 0.913 | 15.765c | 0.875 | 21.679 | 0.825 | 27.312c | 0.839 | 29.081c |
Note: –h denotes forecast horizons for monthly data. –For each horizon (h), the first column (Cov.) reports empirical coverages given a nominal coverage of 90%. The second column (Leng.) reports the length of forecast intervals in terms of percentage change of the exchange rate. Empirical coverages and lengths are averages across N(h) out-of-sample trials. –Superscripts a, b, c in the column of Cov. (Leng.) denote rejections of equal coverage accuracy (equal length) in favor of the economic model at a 10%, 5% and 1% confidence level respectively. Superscripts x, y, z are defined analogously for rejections in favor of the random walk.
Table 4.-Panel 2: Results of Benchmark Taylor Rule Model Four, Coverage Test
| h=1 | h=3 | h=6 | h=9 | h=12 | |
|---|---|---|---|---|---|
| Model Better | 0 | 1 | 2 | 2 | 0 |
| RW Better | 0 | 0 | 0 | 1 | 1 |
Note: In this panel, a better model is the one with more accurate empirical coverages. RW is the abbreviation of Random Walk.
Table 4.-Panel 3: Results of Benchmark Taylor Rule Model Four, Length Test Given Equal Coverage Accuracy
| h=1 | h=3 | h=6 | h=9 | h=12 | |
|---|---|---|---|---|---|
| Model Better | 9 | 11 | 8 | 9 | 11 |
| RW Better | 1 | 0 | 0 | 0 | 0 |
Note: In this panel, a better model is the one with tighter forecast intervals given equal coverage accuracy.
Table 4.-Panel 4: Results of Benchmark Taylor Rule Model Four, Coverage Test and Length Test Given Equal Coverage Accuracy
| h=1 | h=3 | h=6 | h=9 | h=12 | |
|---|---|---|---|---|---|
| Model Better | 9 | 12 | 10 | 11 | 11 |
| RW Better | 1 | 0 | 0 | 1 | 1 |
Note: In this panel, a better model is the one with either more accurate coverages or tighter forecast intervals given equal coverage accuracy.
Table 5.-Panel 1: Results of Purchasing Power Parity Model
| Cov. h=1 | Leng. h=1 | Cov. h=3 | Leng. h=3 | Cov. h=6 | Leng. h=6 | Cov. h=9 | Leng. h=9 | Cov. h=12 | Leng. h=12 | |
|---|---|---|---|---|---|---|---|---|---|---|
Australian Dollar | 0.895 | 7.114z | 0.883 | 15.558 | 0.912 | 21.311 | 0.880 | 26.120c | 0.856 | 30.316c |
Canadian Dollar | 0.819 | 3.570z | 0.806 | 6.872 | 0.767 | 9.615 | 0.728 | 11.078c | 0.615 | 12.306c |
Danish Kroner | 0.925 | 8.697c | 0.939 | 18.333 | 0.938 | 25.887c | 0.937 | 31.673c | 0.957 | 37.447c |
French Franc | 0.922 | 8.904c | 0.940 | 18.029c | 0.918c | 25.786c | 0.904 | 29.789c | 0.802 | 34.209c |
Deutschmark | 0.936 | 9.079 | 0.935 | 18.797c | 0.942 | 27.677c | 1.000 | 33.585c | 0.990 | 40.570c |
Italian Lira | 0.913 | 8.780c | 0.868 | 17.767c | 0.827 | 25.044c | 0.769 | 30.190c | 0.772 | 34.806c |
Japanese Yen | 0.920 | 9.662z | 0.899 | 19.903 | 0.912 | 28.689c | 0.932 | 33.973c | 0.899 | 38.568c |
Dutch Guilder | 0.936 | 8.862y | 0.935 | 18.904c | 0.952 | 27.928c | 1.000 | 33.468c | 0.990 | 41.812c |
Portuguese Escudo | 0.916 | 8.421y | 0.928 | 19.027y | 0.924c | 23.918 | 0.857 | 27.450 | 0.867 | 32.467c |
Swedish Krona | 0.861 | 7.541c | 0.876 | 16.089 | 0.886 | 24.345c | 0.855 | 31.744b | 0.799 | 37.943c |
Swiss Franc | 0.941 | 9.708c | 0.946 | 19.694b | 0.976 | 27.197c | 0.950b | 31.725c | 0.880 | 36.235c |
British Pound | 0.934 | 8.571y | 0.933 | 16.954c | 0.932 | 24.064c | 0.947 | 28.761c | 0.925a | 31.372c |
Note: –h denotes forecast horizons for monthly data. –For each horizon (h), the first column (Cov.) reports empirical coverages given a nominal coverage of 90%. The second column (Leng.) reports the length of forecast intervals in terms of percentage change of the exchange rate. Empirical coverages and lengths are averages across N(h) out-of-sample trials. –Superscripts a, b, c in the column of Cov. (Leng.) denote rejections of equal coverage accuracy (equal length) in favor of the economic model at a 10%, 5% and 1% confidence level respectively. Superscripts x, y, z are defined analogously for rejections in favor of the random walk.
Table 5.-Panel 2: Results of Purchasing Power Parity Model, Coverage Test
| h=1 | h=3 | h=6 | h=9 | h=12 | |
|---|---|---|---|---|---|
| Model Better | 0 | 0 | 2 | 1 | 1 |
| RW Better | 0 | 0 | 0 | 0 | 0 |
Note: In this panel, a better model is the one with more accurate empirical coverages. RW is the abbreviation of Random Walk.
Table 5.-Panel 3: Results of Purchasing Power Parity Model, Length Test Given Equal Coverage Accuracy
| h=1 | h=3 | h=6 | h=9 | h=12 | |
|---|---|---|---|---|---|
| Model Better | 5 | 6 | 8 | 10 | 11 |
| RW Better | 6 | 1 | 0 | 0 | 0 |
Note: In this panel, a better model is the one with tighter forecast intervals given equal coverage accuracy.
Table 5.-Panel 4: Results of Purchasing Power Parity Model, Coverage Test and Length Test Given Equal Coverage Accuracy
| h=1 | h=3 | h=6 | h=9 | h=12 | |
|---|---|---|---|---|---|
| Model Better | 5 | 6 | 10 | 11 | 12 |
| RW Better | 6 | 1 | 0 | 0 | 0 |
Note: In this panel, a better model is the one with either more accurate coverages or tighter forecast intervals given equal coverage accuracy.
Table 6.-Panel 1: Results of Monetary Model
| Cov. h=1 | Leng. h=1 | Cov. h=3 | Leng. h=3 | Cov. h=6 | Leng. h=6 | Cov. h=9 | Leng. h=9 | Cov. h=12 | Leng. h=12 | |
|---|---|---|---|---|---|---|---|---|---|---|
Australian Dollar | 0.879 | 7.108 | 0.848 | 15.151 | 0.830 | 20.090 | 0.770 | 24.642c | 0.745 | 30.099b |
Canadian Dollar | 0.842 | 4.027x | 0.829 | 7.492 | 0.744 | 10.518 | 0.645 | 10.689b | 0.675 | 12.993c |
Danish Kroner | 0.905 | 8.770b | 0.893 | 17.943 | 0.897 | 25.017c | 0.853 | 28.581c | 0.809 | 32.504c |
French Franc | 0.922 | 8.791c | 0.910 | 18.237c | 0.949b | 26.322c | 0.957 | 31.032c | 0.956 | 35.971c |
Deutschmark | 0.908 | 8.595 | 0.841 | 17.436c | 0.808 | 24.622c | 0.772 | 28.052c | 0.704 | 31.364c |
Italian Lira | 0.913 | 8.858c | 0.882 | 18.439b | 0.925 | 26.585c | 0.931 | 34.857c | 0.913 | 40.885c |
Japanese Yen | 0.930 | 9.556 | 0.919 | 19.374c | 0.887 | 28.614c | 0.864 | 33.401c | 0.809 | 36.520c |
Dutch Guilder | 0.917 | 8.753a | 0.916 | 19.408 | 0.962 | 29.149b | 0.970 | 38.173 | 0.898c | 41.716c |
Portuguese Escudo | 0.901 | 8.086 | 0.986 | 18.484 | 0.985 | 24.744 | 0.984 | 27.230 | 1.000 | 34.222 |
Swedish Krona | 0.850 | 7.504a | 0.848 | 17.097x | 0.811 | 23.878c | 0.826 | 31.287 | 0.805 | 34.710c |
Swiss Franc | 0.905 | 9.078c | 0.820 | 17.020c | 0.732 | 21.212c | 0.609 | 22.741c | 0.513x | 23.225c |
British Pound | 0.909 | 7.811c | 0.882 | 14.945c | 0.787 | 20.788c | 0.677 | 24.311c | 0.656 | 26374c |
Note: –h denotes forecast horizons for monthly data. –For each horizon (h), the first column (Cov.) reports empirical coverages given a nominal coverage of 90%. The second column (Leng.) reports the length of forecast intervals in terms of percentage change of the exchange rate. Empirical coverages and lengths are averages across N(h) out-of-sample trials. –Superscripts a, b, c in the column of Cov. (Leng.) denote rejections of equal coverage accuracy (equal length) in favor of the economic model at a 10%, 5% and 1% confidence level respectively. Superscripts x, y, z are defined analogously for rejections in favor of the random walk.
Table 6.-Panel 2: Results of Monetary Model, Coverage Test
| h=1 | h=3 | h=6 | h=9 | h=12 | |
|---|---|---|---|---|---|
| Model Better | 0 | 0 | 1 | 0 | 1 |
| RW Better | 0 | 0 | 0 | 0 | 1 |
Note: In this panel, a better model is the one with more accurate empirical coverages. RW is the abbreviation of Random Walk.
Table 6.-Panel 3: Results of Monetary Model, Length Test Given Equal Coverage Accuracy
| h=1 | h=3 | h=6 | h=9 | h=12 | |
|---|---|---|---|---|---|
| Model Better | 7 | 6 | 8 | 9 | 9 |
| RW Better | 1 | 1 | 0 | 0 | 0 |
Note: In this panel, a better model is the one with tighter forecast intervals given equal coverage accuracy.
Table 6.-Panel 4: Results of Monetary Model, Coverage Test and Length Test Given Equal Coverage Accuracy
| h=1 | h=3 | h=6 | h=9 | h=12 | |
|---|---|---|---|---|---|
| Model Better | 7 | 6 | 9 | 9 | 10 |
| RW Better | 1 | 1 | 0 | 0 | 1 |
Note: In this panel, a better model is the one with either more accurate coverages or tighter forecast intervals given equal coverage accuracy.
Table 7.-Panel 1: Results of Heterogenous Taylor Rules
| Cov. h=1 | Leng. h=1 | Cov. h=3 | Leng. h=3 | Cov. h=6 | Leng. h=6 | Cov. h=9 | Leng. h=9 | Cov. h=12 | Leng. h=12 | |
|---|---|---|---|---|---|---|---|---|---|---|
Australian Dollar | 0.915 | 7.155 | 0.909 | 14.690c | 0.959 | 20.547 | 0.963y | 26.364 | 0.947 | 29.583c |
Canadian Dollar | 0.825 | 3.526 | 0.794 | 6.525c | 0.797 | 9.040c | 0.787 | 10.370c | 0.693 | 11.352c |
Danish Kroner | 0.915 | 8.548c | 0.929 | 17.930c | 0.938 | 25.328c | 0.890 | 30.504c | 0.904 | 36.624c |
French Franc | 0.912 | 8.864c | 0.880 | 15.970c | 0.845 | 20.693c | 0.968 | 30.436c | 0.714 | 22.789c |
Deutschmark | 0.917 | 8.605c | 0.907 | 18.356c | 0.894 | 28.121c | 0.911c | 31.378c | 0.939 | 33.779c |
Italian Lira | 0.913 | 8.659c | 0.890 | 18.664 | 0.887 | 25.840c | 0.831 | 32.037c | 0.693 | 32.236c |
Japanese Yen | 0.920 | 9.637z | 0.888 | 19.352b | 0.871 | 28.018c | 0.932 | 33.388c | 0.878 | 36.859c |
Dutch Guilder | 0.936 | 8.851 | 0.916 | 18.822c | 0.942 | 27.259c | 0.970 | 31.410c | 0.990 | 39.882c |
Portuguese Escudo | 0.916 | 8.881z | 0.870 | 17.651 | 0.758 | 18.730c | 0.746 | 23.852c | 0.600 | 20.593c |
Swedish Krona | 0.828 | 7.428c | 0.854 | 15.658c | 0.903 | 24.315c | 0.861 | 29.866c | 0.876 | 36.235c |
Swiss Franc | 0.935 | 9.731c | 0.940 | 19.797 | 0.970 | 27.227c | 0.969 | 32.179c | 0.937 | 36.567c |
British Pound | 0.919 | 8.350 | 0.908 | 16.774c | 0.828 | 20.811c | 0.783 | 23.105c | 0.720 | 23.286c |
Note: –h denotes forecast horizons for monthly data. –For each horizon (h), the first column (Cov.) reports empirical coverages given a nominal coverage of 90%. The second column (Leng.) reports the length of forecast intervals in terms of percentage change of the exchange rate. Empirical coverages and lengths are averages across N(h) out-of-sample trials. –Superscripts a, b, c in the column of Cov. (Leng.) denote rejections of equal coverage accuracy (equal length) in favor of the economic model at a 10%, 5% and 1% confidence level respectively. Superscripts x, y, z are defined analogously for rejections in favor of the random walk.
Table 7.-Panel 2: Results of Heterogenous Taylor Rules, Coverage Test
| h=1 | h=3 | h=6 | h=9 | h=12 | |
|---|---|---|---|---|---|
| Model Better | 0 | 0 | 0 | 1 | 0 |
| RW Better | 0 | 0 | 0 | 1 | 0 |
Note: In this panel, a better model is the one with more accurate empirical coverages. RW is the abbreviation of Random Walk.
Table 7.-Panel 3: Results of Heterogenous Taylor Rules, Length Test Given Equal Coverage Accuracy
| h=1 | h=3 | h=6 | h=9 | h=12 | |
|---|---|---|---|---|---|
| Model Better | 6 | 9 | 11 | 10 | 12 |
| RW Better | 2 | 0 | 0 | 0 | 0 |
Note: In this panel, a better model is the one with tighter forecast intervals given equal coverage accuracy.
Table 7.-Panel 4: Results of Heterogenous Taylor Rules, Coverage Test and Length Test Given Equal Coverage Accuracy
| h=1 | h=3 | h=6 | h=9 | h=12 | |
|---|---|---|---|---|---|
| Model Better | 6 | 9 | 11 | 11 | 12 |
| RW Better | 2 | 0 | 0 | 1 | 0 |
Note: In this panel, a better model is the one with either more accurate coverages or tighter forecast intervals given equal coverage accuracy.
Figure 1a. Length of Forecast Intervals for Benchmark Taylor Rule and Random Walk Models (British Pound), 1-Month-Ahead Forecast
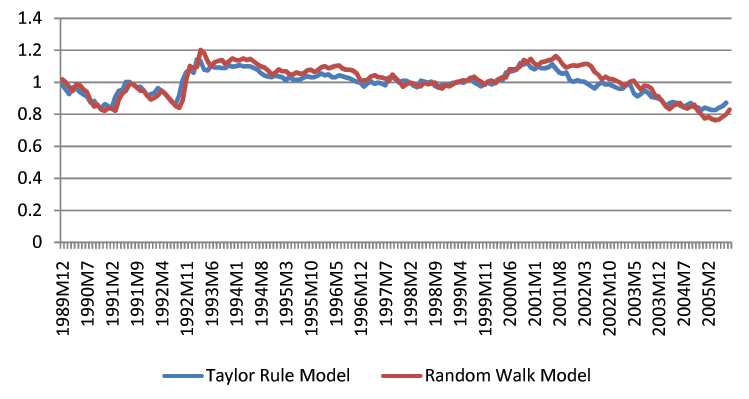
Note: To facilitate graphical comparisons, the 6- and 12-month-ahead forecast intervals of the random walk have been relocated such that they have the same center as the intervals of the Taylor rule model.
Data for Figure 1a
| Date | Taylor Rule | RW |
|---|---|---|
| 1989M12 | 1.0000 | 1.0190 |
| 1990M1 | 0.9848 | 1.0019 |
| 1990M2 | 0.9543 | 0.9714 |
| 1990M3 | 0.9257 | 0.9448 |
| 1990M4 | 0.9695 | 0.9886 |
| 1990M5 | 0.9600 | 0.9810 |
| 1990M6 | 0.9390 | 0.9562 |
| 1990M7 | 0.9238 | 0.9390 |
| 1990M8 | 0.9124 | 0.8876 |
| 1990M9 | 0.8743 | 0.8495 |
| 1990M10 | 0.8838 | 0.8610 |
| 1990M11 | 0.8495 | 0.8305 |
| 1990M12 | 0.8400 | 0.8229 |
| 1991M1 | 0.8629 | 0.8400 |
| 1991M2 | 0.8495 | 0.8362 |
| 1991M3 | 0.8400 | 0.8229 |
| 1991M4 | 0.9086 | 0.8952 |
| 1991M5 | 0.9467 | 0.9314 |
| 1991M6 | 0.9524 | 0.9467 |
| 1991M7 | 1.0019 | 0.9905 |
| 1991M8 | 1.0019 | 0.9886 |
| 1991M9 | 0.9848 | 0.9695 |
| 1991M10 | 0.9676 | 0.9467 |
| 1991M11 | 0.9714 | 0.9467 |
| 1991M12 | 0.9486 | 0.9162 |
| 1992M1 | 0.9143 | 0.8933 |
| 1992M2 | 0.9257 | 0.9029 |
| 1992M3 | 0.9352 | 0.9181 |
| 1992M4 | 0.9638 | 0.9486 |
| 1992M5 | 0.9467 | 0.9295 |
| 1992M6 | 0.9257 | 0.9029 |
| 1992M7 | 0.9010 | 0.8800 |
| 1992M8 | 0.8743 | 0.8514 |
| 1992M9 | 0.8648 | 0.8400 |
| 1992M10 | 0.9200 | 0.8895 |
| 1992M11 | 1.0152 | 1.0190 |
| 1992M12 | 1.0648 | 1.1029 |
| 1993M1 | 1.0800 | 1.0857 |
| 1993M2 | 1.0590 | 1.0971 |
| 1993M3 | 1.1448 | 1.2019 |
| 1993M4 | 1.1314 | 1.1829 |
| 1993M5 | 1.0781 | 1.1314 |
| 1993M6 | 1.0743 | 1.0971 |
| 1993M7 | 1.1029 | 1.1257 |
| 1993M8 | 1.0914 | 1.1352 |
| 1993M9 | 1.0933 | 1.1390 |
| 1993M10 | 1.0895 | 1.1143 |
| 1993M11 | 1.0895 | 1.1314 |
| 1993M12 | 1.1048 | 1.1486 |
| 1994M1 | 1.0971 | 1.1390 |
| 1994M2 | 1.1010 | 1.1371 |
| 1994M3 | 1.1086 | 1.1486 |
| 1994M4 | 1.0990 | 1.1390 |
| 1994M5 | 1.1010 | 1.1467 |
| 1994M6 | 1.0990 | 1.1295 |
| 1994M7 | 1.0895 | 1.1124 |
| 1994M8 | 1.0781 | 1.0990 |
| 1994M9 | 1.0571 | 1.0914 |
| 1994M10 | 1.0419 | 1.0743 |
| 1994M11 | 1.0362 | 1.0476 |
| 1994M12 | 1.0324 | 1.0590 |
| 1995M1 | 1.0419 | 1.0800 |
| 1995M2 | 1.0362 | 1.0686 |
| 1995M3 | 1.0324 | 1.0705 |
| 1995M4 | 1.0133 | 1.0514 |
| 1995M5 | 1.0324 | 1.0476 |
| 1995M6 | 1.0171 | 1.0610 |
| 1995M7 | 1.0152 | 1.0533 |
| 1995M8 | 1.0171 | 1.0552 |
| 1995M9 | 1.0305 | 1.0743 |
| 1995M10 | 1.0381 | 1.0781 |
| 1995M11 | 1.0324 | 1.0648 |
| 1995M12 | 1.0324 | 1.0762 |
| 1996M1 | 1.0400 | 1.0933 |
| 1996M2 | 1.0552 | 1.1010 |
| 1996M3 | 1.0438 | 1.0876 |
| 1996M4 | 1.0495 | 1.0952 |
| 1996M5 | 1.0324 | 1.1029 |
| 1996M6 | 1.0324 | 1.1048 |
| 1996M7 | 1.0438 | 1.0857 |
| 1996M8 | 1.0381 | 1.0781 |
| 1996M9 | 1.0305 | 1.0781 |
| 1996M10 | 1.0248 | 1.0724 |
| 1996M11 | 1.0133 | 1.0533 |
| 1996M12 | 1.0019 | 1.0114 |
| 1997M1 | 0.9981 | 1.0114 |
| 1997M2 | 0.9733 | 1.0152 |
| 1997M3 | 0.9943 | 1.0362 |
| 1997M4 | 1.0038 | 1.0457 |
| 1997M5 | 0.9905 | 1.0324 |
| 1997M6 | 0.9981 | 1.0305 |
| 1997M7 | 0.9924 | 1.0229 |
| 1997M8 | 0.9810 | 1.0076 |
| 1997M9 | 1.0305 | 1.0476 |
| 1997M10 | 1.0324 | 1.0248 |
| 1997M11 | 1.0152 | 1.0038 |
| 1997M12 | 0.9962 | 0.9714 |
| 1998M1 | 1.0095 | 0.9886 |
| 1998M2 | 1.0095 | 0.9981 |
| 1998M3 | 0.9962 | 0.9924 |
| 1998M4 | 0.9790 | 0.9810 |
| 1998M5 | 0.9695 | 0.9752 |
| 1998M6 | 1.0095 | 0.9962 |
| 1998M7 | 1.0038 | 0.9886 |
| 1998M8 | 0.9981 | 0.9924 |
| 1998M9 | 1.0038 | 0.9981 |
| 1998M10 | 0.9771 | 0.9695 |
| 1998M11 | 0.9657 | 0.9619 |
| 1998M12 | 0.9848 | 0.9829 |
| 1999M1 | 0.9771 | 0.9752 |
| 1999M2 | 0.9867 | 0.9867 |
| 1999M3 | 0.9962 | 1.0019 |
| 1999M4 | 0.9962 | 1.0057 |
| 1999M5 | 1.0038 | 1.0133 |
| 1999M6 | 0.9962 | 1.0095 |
| 1999M7 | 1.0114 | 1.0229 |
| 1999M8 | 1.0286 | 1.0343 |
| 1999M9 | 1.0000 | 1.0152 |
| 1999M10 | 0.9886 | 1.0038 |
| 1999M11 | 0.9752 | 0.9848 |
| 1999M12 | 0.9924 | 1.0057 |
| 2000M1 | 0.9962 | 1.0114 |
| 2000M2 | 0.9867 | 0.9943 |
| 2000M3 | 1.0076 | 1.0190 |
| 2000M4 | 1.0210 | 1.0324 |
| 2000M5 | 1.0114 | 1.0305 |
| 2000M6 | 1.0610 | 1.0819 |
| 2000M7 | 1.0667 | 1.0819 |
| 2000M8 | 1.0705 | 1.0838 |
| 2000M9 | 1.0781 | 1.0971 |
| 2000M10 | 1.1219 | 1.1390 |
| 2000M11 | 1.1105 | 1.1257 |
| 2000M12 | 1.1219 | 1.1467 |
| 2001M1 | 1.0914 | 1.1162 |
| 2001M2 | 1.0819 | 1.1067 |
| 2001M3 | 1.0990 | 1.1257 |
| 2001M4 | 1.0876 | 1.1295 |
| 2001M5 | 1.0876 | 1.1371 |
| 2001M6 | 1.0952 | 1.1429 |
| 2001M7 | 1.1124 | 1.1638 |
| 2001M8 | 1.0857 | 1.1429 |
| 2001M9 | 1.0610 | 1.1105 |
| 2001M10 | 1.0533 | 1.0914 |
| 2001M11 | 1.0610 | 1.1010 |
| 2001M12 | 1.0133 | 1.1067 |
| 2002M1 | 1.0019 | 1.1029 |
| 2002M2 | 1.0133 | 1.1086 |
| 2002M3 | 1.0057 | 1.1143 |
| 2002M4 | 1.0038 | 1.1143 |
| 2002M5 | 0.9905 | 1.0990 |
| 2002M6 | 0.9752 | 1.0648 |
| 2002M7 | 0.9619 | 1.0476 |
| 2002M8 | 0.9867 | 1.0190 |
| 2002M9 | 1.0000 | 1.0343 |
| 2002M10 | 0.9867 | 1.0210 |
| 2002M11 | 0.9886 | 1.0210 |
| 2002M12 | 0.9771 | 1.0095 |
| 2003M1 | 0.9676 | 1.0000 |
| 2003M2 | 0.9581 | 0.9810 |
| 2003M3 | 0.9619 | 0.9886 |
| 2003M4 | 0.9829 | 1.0038 |
| 2003M5 | 0.9829 | 1.0095 |
| 2003M6 | 0.9314 | 0.9790 |
| 2003M7 | 0.9124 | 0.9543 |
| 2003M8 | 0.9257 | 0.9790 |
| 2003M9 | 0.9486 | 0.9752 |
| 2003M10 | 0.9352 | 0.9600 |
| 2003M11 | 0.9086 | 0.9181 |
| 2003M12 | 0.9048 | 0.9124 |
| 2004M1 | 0.8990 | 0.8800 |
| 2004M2 | 0.8857 | 0.8495 |
| 2004M3 | 0.8533 | 0.8324 |
| 2004M4 | 0.8686 | 0.8514 |
| 2004M5 | 0.8762 | 0.8629 |
| 2004M6 | 0.8724 | 0.8705 |
| 2004M7 | 0.8552 | 0.8438 |
| 2004M8 | 0.8476 | 0.8362 |
| 2004M9 | 0.8590 | 0.8476 |
| 2004M10 | 0.8705 | 0.8610 |
| 2004M11 | 0.8438 | 0.8229 |
| 2004M12 | 0.8438 | 0.8000 |
| 2005M1 | 0.8267 | 0.7733 |
| 2005M2 | 0.8419 | 0.7848 |
| 2005M3 | 0.8343 | 0.7714 |
| 2005M4 | 0.8267 | 0.7638 |
| 2005M5 | 0.8267 | 0.7676 |
| 2005M6 | 0.8419 | 0.7848 |
| 2005M7 | 0.8514 | 0.8000 |
| 2005M8 | 0.8724 | 0.8305 |
| 2005M9 | 0.8438 | 0.8095 |
| 2005M10 | 0.8400 | 0.8057 |
| 2005M11 | 0.8552 | 0.8229 |
| 2005M12 | 0.8667 | 0.8362 |
| 2006M1 | 0.8419 | 0.8305 |
| 2006M2 | 0.8400 | 0.7943 |
| 2006M3 | 0.8305 | 0.7905 |
| 2006M4 | 0.8324 | 0.7924 |
Figure 1b. Length of Forecast Intervals for Benchmark Taylor Rule and Random Walk Models (British Pound), 6-month-ahead forecast
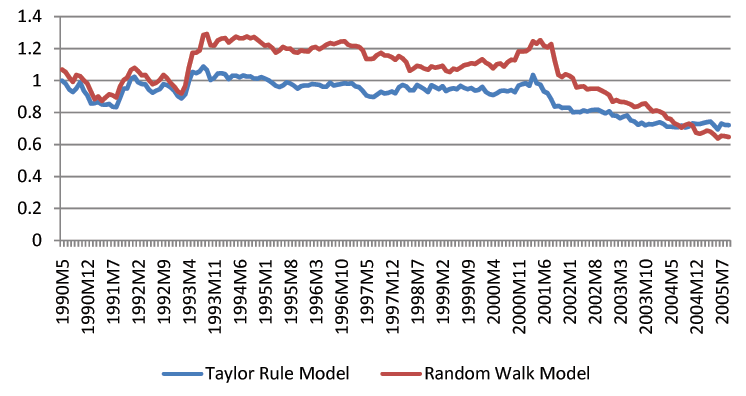
Note: To facilitate graphical comparisons, the 6- and 12-month-ahead forecast intervals of the random walk have been relocated such that they have the same center as the intervals of the Taylor rule model.
Data for Figure 1b
| Date | Taylor Rule | RW |
|---|---|---|
| 1990M5 | 1.0000 | 1.0687 |
| 1990M6 | 0.9804 | 1.0528 |
| 1990M7 | 0.9442 | 1.0184 |
| 1990M8 | 0.9282 | 0.9914 |
| 1990M9 | 0.9515 | 1.0350 |
| 1990M10 | 0.9902 | 1.0270 |
| 1990M11 | 0.9368 | 1.0018 |
| 1990M12 | 0.9080 | 0.9822 |
| 1991M1 | 0.8564 | 0.9288 |
| 1991M2 | 0.8583 | 0.8840 |
| 1991M3 | 0.8650 | 0.9000 |
| 1991M4 | 0.8509 | 0.8730 |
| 1991M5 | 0.8479 | 0.8933 |
| 1991M6 | 0.8540 | 0.9135 |
| 1991M7 | 0.8362 | 0.9074 |
| 1991M8 | 0.8337 | 0.8939 |
| 1991M9 | 0.8920 | 0.9638 |
| 1991M10 | 0.9497 | 1.0031 |
| 1991M11 | 0.9509 | 1.0184 |
| 1991M12 | 1.0104 | 1.0656 |
| 1992M1 | 1.0227 | 1.0798 |
| 1992M2 | 0.9896 | 1.0595 |
| 1992M3 | 0.9785 | 1.0331 |
| 1992M4 | 0.9761 | 1.0350 |
| 1992M5 | 0.9429 | 1.0031 |
| 1992M6 | 0.9239 | 0.9767 |
| 1992M7 | 0.9368 | 0.9859 |
| 1992M8 | 0.9460 | 1.0037 |
| 1992M9 | 0.9779 | 1.0350 |
| 1992M10 | 0.9712 | 1.0153 |
| 1992M11 | 0.9577 | 0.9859 |
| 1992M12 | 0.9362 | 0.9613 |
| 1993M1 | 0.9025 | 0.9301 |
| 1993M2 | 0.8883 | 0.9178 |
| 1993M3 | 0.9135 | 0.9663 |
| 1993M4 | 0.9939 | 1.0798 |
| 1993M5 | 1.0546 | 1.1724 |
| 1993M6 | 1.0460 | 1.1736 |
| 1993M7 | 1.0577 | 1.1890 |
| 1993M8 | 1.0877 | 1.2840 |
| 1993M9 | 1.0656 | 1.2908 |
| 1993M10 | 1.0031 | 1.2209 |
| 1993M11 | 1.0160 | 1.2184 |
| 1993M12 | 1.0442 | 1.2503 |
| 1994M1 | 1.0460 | 1.2613 |
| 1994M2 | 1.0399 | 1.2650 |
| 1994M3 | 1.0086 | 1.2374 |
| 1994M4 | 1.0301 | 1.2558 |
| 1994M5 | 1.0313 | 1.2736 |
| 1994M6 | 1.0209 | 1.2644 |
| 1994M7 | 1.0319 | 1.2638 |
| 1994M8 | 1.0252 | 1.2755 |
| 1994M9 | 1.0270 | 1.2644 |
| 1994M10 | 1.0135 | 1.2724 |
| 1994M11 | 1.0123 | 1.2540 |
| 1994M12 | 1.0215 | 1.2362 |
| 1995M1 | 1.0129 | 1.2190 |
| 1995M2 | 1.0018 | 1.2233 |
| 1995M3 | 0.9859 | 1.2049 |
| 1995M4 | 0.9669 | 1.1742 |
| 1995M5 | 0.9595 | 1.1871 |
| 1995M6 | 0.9693 | 1.2098 |
| 1995M7 | 0.9896 | 1.1982 |
| 1995M8 | 0.9816 | 1.2000 |
| 1995M9 | 0.9687 | 1.1785 |
| 1995M10 | 0.9491 | 1.1736 |
| 1995M11 | 0.9656 | 1.1883 |
| 1995M12 | 0.9693 | 1.1828 |
| 1996M1 | 0.9693 | 1.1822 |
| 1996M2 | 0.9785 | 1.2037 |
| 1996M3 | 0.9761 | 1.2098 |
| 1996M4 | 0.9730 | 1.1951 |
| 1996M5 | 0.9613 | 1.2074 |
| 1996M6 | 0.9613 | 1.2245 |
| 1996M7 | 0.9871 | 1.2337 |
| 1996M8 | 0.9693 | 1.2276 |
| 1996M9 | 0.9736 | 1.2350 |
| 1996M10 | 0.9785 | 1.2442 |
| 1996M11 | 0.9834 | 1.2448 |
| 1996M12 | 0.9798 | 1.2239 |
| 1997M1 | 0.9834 | 1.2147 |
| 1997M2 | 0.9638 | 1.2166 |
| 1997M3 | 0.9583 | 1.2098 |
| 1997M4 | 0.9356 | 1.1896 |
| 1997M5 | 0.9067 | 1.1350 |
| 1997M6 | 0.9000 | 1.1337 |
| 1997M7 | 0.8969 | 1.1374 |
| 1997M8 | 0.9129 | 1.1601 |
| 1997M9 | 0.9294 | 1.1724 |
| 1997M10 | 0.9190 | 1.1577 |
| 1997M11 | 0.9233 | 1.1558 |
| 1997M12 | 0.9319 | 1.1466 |
| 1998M1 | 0.9209 | 1.1294 |
| 1998M2 | 0.9583 | 1.1528 |
| 1998M3 | 0.9730 | 1.1380 |
| 1998M4 | 0.9638 | 1.1147 |
| 1998M5 | 0.9393 | 1.0601 |
| 1998M6 | 0.9399 | 1.0748 |
| 1998M7 | 0.9724 | 1.0914 |
| 1998M8 | 0.9595 | 1.0871 |
| 1998M9 | 0.9460 | 1.0736 |
| 1998M10 | 0.9288 | 1.0669 |
| 1998M11 | 0.9706 | 1.0890 |
| 1998M12 | 0.9589 | 1.0810 |
| 1999M1 | 0.9460 | 1.0853 |
| 1999M2 | 0.9656 | 1.0920 |
| 1999M3 | 0.9337 | 1.0601 |
| 1999M4 | 0.9466 | 1.0528 |
| 1999M5 | 0.9521 | 1.0742 |
| 1999M6 | 0.9460 | 1.0675 |
| 1999M7 | 0.9669 | 1.0810 |
| 1999M8 | 0.9540 | 1.0963 |
| 1999M9 | 0.9466 | 1.1006 |
| 1999M10 | 0.9528 | 1.1086 |
| 1999M11 | 0.9368 | 1.1043 |
| 1999M12 | 0.9417 | 1.1184 |
| 2000M1 | 0.9607 | 1.1325 |
| 2000M2 | 0.9288 | 1.1110 |
| 2000M3 | 0.9147 | 1.0982 |
| 2000M4 | 0.9092 | 1.0761 |
| 2000M5 | 0.9209 | 1.1012 |
| 2000M6 | 0.9356 | 1.1061 |
| 2000M7 | 0.9374 | 1.0871 |
| 2000M8 | 0.9331 | 1.1153 |
| 2000M9 | 0.9411 | 1.1294 |
| 2000M10 | 0.9270 | 1.1276 |
| 2000M11 | 0.9687 | 1.1822 |
| 2000M12 | 0.9773 | 1.1822 |
| 2001M1 | 0.9828 | 1.1834 |
| 2001M2 | 0.9669 | 1.1982 |
| 2001M3 | 1.0356 | 1.2448 |
| 2001M4 | 0.9834 | 1.2294 |
| 2001M5 | 0.9748 | 1.2515 |
| 2001M6 | 0.9325 | 1.2190 |
| 2001M7 | 0.9202 | 1.2061 |
| 2001M8 | 0.8840 | 1.2270 |
| 2001M9 | 0.8368 | 1.1258 |
| 2001M10 | 0.8417 | 1.0356 |
| 2001M11 | 0.8294 | 1.0221 |
| 2001M12 | 0.8301 | 1.0399 |
| 2002M1 | 0.8294 | 1.0307 |
| 2002M2 | 0.8018 | 1.0147 |
| 2002M3 | 0.8037 | 0.9571 |
| 2002M4 | 0.8031 | 0.9613 |
| 2002M5 | 0.8141 | 0.9638 |
| 2002M6 | 0.8061 | 0.9454 |
| 2002M7 | 0.8147 | 0.9491 |
| 2002M8 | 0.8166 | 0.9485 |
| 2002M9 | 0.8172 | 0.9485 |
| 2002M10 | 0.8043 | 0.9356 |
| 2002M11 | 0.7945 | 0.9245 |
| 2002M12 | 0.8080 | 0.9092 |
| 2003M1 | 0.7810 | 0.8669 |
| 2003M2 | 0.7798 | 0.8779 |
| 2003M3 | 0.7644 | 0.8675 |
| 2003M4 | 0.7748 | 0.8663 |
| 2003M5 | 0.7816 | 0.8589 |
| 2003M6 | 0.7503 | 0.8503 |
| 2003M7 | 0.7429 | 0.8344 |
| 2003M8 | 0.7239 | 0.8393 |
| 2003M9 | 0.7362 | 0.8528 |
| 2003M10 | 0.7196 | 0.8571 |
| 2003M11 | 0.7276 | 0.8313 |
| 2003M12 | 0.7252 | 0.8074 |
| 2004M1 | 0.7319 | 0.8129 |
| 2004M2 | 0.7393 | 0.8055 |
| 2004M3 | 0.7288 | 0.7945 |
| 2004M4 | 0.7117 | 0.7644 |
| 2004M5 | 0.7110 | 0.7595 |
| 2004M6 | 0.7092 | 0.7325 |
| 2004M7 | 0.7074 | 0.7221 |
| 2004M8 | 0.7190 | 0.7055 |
| 2004M9 | 0.7067 | 0.7221 |
| 2004M10 | 0.7123 | 0.7307 |
| 2004M11 | 0.7319 | 0.7184 |
| 2004M12 | 0.7294 | 0.6736 |
| 2005M1 | 0.7282 | 0.6669 |
| 2005M2 | 0.7344 | 0.6761 |
| 2005M3 | 0.7399 | 0.6865 |
| 2005M4 | 0.7436 | 0.6804 |
| 2005M5 | 0.7190 | 0.6613 |
| 2005M6 | 0.6945 | 0.6380 |
| 2005M7 | 0.7313 | 0.6546 |
| 2005M8 | 0.7221 | 0.6521 |
| 2005M9 | 0.7215 | 0.6466 |
| 2005M10 | 0.7215 | 0.6491 |
| 2005M11 | 0.7288 | 0.6632 |
| 2005M12 | 0.7319 | 0.6773 |
| 2006M1 | 0.7632 | 0.7031 |
| 2006M2 | 0.7387 | 0.6521 |
| 2006M3 | 0.7393 | 0.6472 |
| 2006M4 | 0.6871 | 0.6626 |
Figure 1c. Length of Forecast Intervals for Benchmark Taylor Rule and Random Walk Models (British Pound), 12-month-ahead forecast
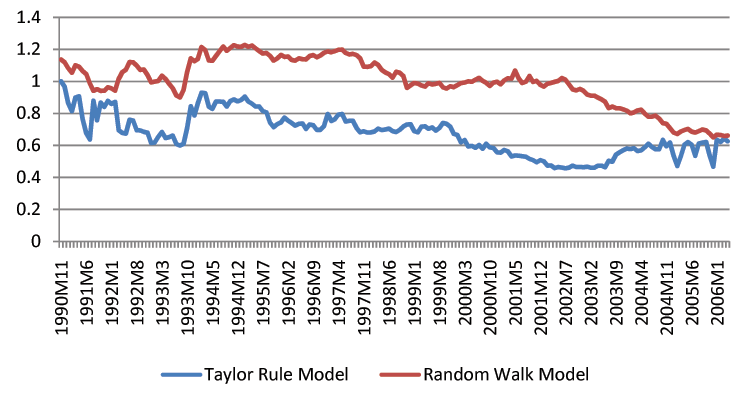
Note: To facilitate graphical comparisons, the 6- and 12-month-ahead forecast intervals of the random walk have been relocated such that they have the same center as the intervals of the Taylor rule model.
Data for Figure 1c
| Date | Taylor Rule | RW |
|---|---|---|
| 1990M11 | 1.0000 | 1.1366 |
| 1990M12 | 0.9668 | 1.1196 |
| 1991M1 | 0.8647 | 1.0826 |
| 1991M2 | 0.8136 | 1.0540 |
| 1991M3 | 0.8987 | 1.1005 |
| 1991M4 | 0.9066 | 1.0917 |
| 1991M5 | 0.7659 | 1.0656 |
| 1991M6 | 0.6750 | 1.0448 |
| 1991M7 | 0.6364 | 0.9875 |
| 1991M8 | 0.8788 | 0.9402 |
| 1991M9 | 0.7572 | 0.9510 |
| 1991M10 | 0.8672 | 0.9402 |
| 1991M11 | 0.8406 | 0.9415 |
| 1991M12 | 0.8780 | 0.9622 |
| 1992M1 | 0.8589 | 0.9560 |
| 1992M2 | 0.8709 | 0.9419 |
| 1992M3 | 0.6945 | 1.0154 |
| 1992M4 | 0.6783 | 1.0569 |
| 1992M5 | 0.6733 | 1.0731 |
| 1992M6 | 0.7597 | 1.1208 |
| 1992M7 | 0.7547 | 1.1200 |
| 1992M8 | 0.6949 | 1.0984 |
| 1992M9 | 0.6932 | 1.0714 |
| 1992M10 | 0.6849 | 1.0735 |
| 1992M11 | 0.6795 | 1.0394 |
| 1992M12 | 0.6148 | 0.9938 |
| 1993M1 | 0.6177 | 0.9983 |
| 1993M2 | 0.6534 | 1.0029 |
| 1993M3 | 0.6833 | 1.0345 |
| 1993M4 | 0.6459 | 1.0149 |
| 1993M5 | 0.6513 | 0.9855 |
| 1993M6 | 0.6613 | 0.9577 |
| 1993M7 | 0.6081 | 0.9116 |
| 1993M8 | 0.5994 | 0.8991 |
| 1993M9 | 0.6094 | 0.9465 |
| 1993M10 | 0.7073 | 1.0573 |
| 1993M11 | 0.8447 | 1.1445 |
| 1993M12 | 0.7866 | 1.1266 |
| 1994M1 | 0.8643 | 1.1403 |
| 1994M2 | 0.9290 | 1.2138 |
| 1994M3 | 0.9261 | 1.1955 |
| 1994M4 | 0.8418 | 1.1312 |
| 1994M5 | 0.8277 | 1.1287 |
| 1994M6 | 0.8738 | 1.1586 |
| 1994M7 | 0.8738 | 1.1876 |
| 1994M8 | 0.8726 | 1.2171 |
| 1994M9 | 0.8423 | 1.1905 |
| 1994M10 | 0.8771 | 1.2084 |
| 1994M11 | 0.8871 | 1.2262 |
| 1994M12 | 0.8751 | 1.2171 |
| 1995M1 | 0.8829 | 1.2163 |
| 1995M2 | 0.9041 | 1.2275 |
| 1995M3 | 0.8734 | 1.2167 |
| 1995M4 | 0.8605 | 1.2246 |
| 1995M5 | 0.8418 | 1.2067 |
| 1995M6 | 0.8439 | 1.1897 |
| 1995M7 | 0.8149 | 1.1739 |
| 1995M8 | 0.8057 | 1.1773 |
| 1995M9 | 0.7410 | 1.1594 |
| 1995M10 | 0.7140 | 1.1299 |
| 1995M11 | 0.7323 | 1.1424 |
| 1995M12 | 0.7430 | 1.1648 |
| 1996M1 | 0.7733 | 1.1532 |
| 1996M2 | 0.7543 | 1.1548 |
| 1996M3 | 0.7401 | 1.1345 |
| 1996M4 | 0.7235 | 1.1295 |
| 1996M5 | 0.7352 | 1.1436 |
| 1996M6 | 0.7372 | 1.1386 |
| 1996M7 | 0.7020 | 1.1378 |
| 1996M8 | 0.7302 | 1.1590 |
| 1996M9 | 0.7260 | 1.1644 |
| 1996M10 | 0.6974 | 1.1507 |
| 1996M11 | 0.6966 | 1.1615 |
| 1996M12 | 0.7194 | 1.1781 |
| 1997M1 | 0.7954 | 1.1876 |
| 1997M2 | 0.7522 | 1.1818 |
| 1997M3 | 0.7630 | 1.1889 |
| 1997M4 | 0.7924 | 1.1972 |
| 1997M5 | 0.7954 | 1.1980 |
| 1997M6 | 0.7493 | 1.1777 |
| 1997M7 | 0.7530 | 1.1689 |
| 1997M8 | 0.7534 | 1.1714 |
| 1997M9 | 0.7078 | 1.1640 |
| 1997M10 | 0.6812 | 1.1445 |
| 1997M11 | 0.6878 | 1.0922 |
| 1997M12 | 0.6804 | 1.0909 |
| 1998M1 | 0.6808 | 1.0946 |
| 1998M2 | 0.6870 | 1.1171 |
| 1998M3 | 0.7049 | 1.1034 |
| 1998M4 | 0.6957 | 1.0722 |
| 1998M5 | 0.6995 | 1.0565 |
| 1998M6 | 0.7049 | 1.0448 |
| 1998M7 | 0.6895 | 1.0232 |
| 1998M8 | 0.6837 | 1.0589 |
| 1998M9 | 0.6966 | 1.0544 |
| 1998M10 | 0.7177 | 1.0328 |
| 1998M11 | 0.7302 | 0.9597 |
| 1998M12 | 0.7327 | 0.9751 |
| 1999M1 | 0.6895 | 0.9900 |
| 1999M2 | 0.6816 | 0.9863 |
| 1999M3 | 0.7165 | 0.9738 |
| 1999M4 | 0.7194 | 0.9676 |
| 1999M5 | 0.7036 | 0.9880 |
| 1999M6 | 0.7119 | 0.9805 |
| 1999M7 | 0.6920 | 0.9851 |
| 1999M8 | 0.7094 | 0.9905 |
| 1999M9 | 0.7397 | 0.9622 |
| 1999M10 | 0.7352 | 0.9552 |
| 1999M11 | 0.7169 | 0.9689 |
| 1999M12 | 0.6712 | 0.9635 |
| 2000M1 | 0.6642 | 0.9755 |
| 2000M2 | 0.6189 | 0.9892 |
| 2000M3 | 0.6330 | 0.9929 |
| 2000M4 | 0.5936 | 1.0004 |
| 2000M5 | 0.5973 | 0.9967 |
| 2000M6 | 0.5845 | 1.0091 |
| 2000M7 | 0.6027 | 1.0216 |
| 2000M8 | 0.5795 | 1.0025 |
| 2000M9 | 0.6098 | 0.9905 |
| 2000M10 | 0.5878 | 0.9714 |
| 2000M11 | 0.5832 | 0.9929 |
| 2000M12 | 0.5575 | 0.9975 |
| 2001M1 | 0.5546 | 0.9813 |
| 2001M2 | 0.5712 | 1.0062 |
| 2001M3 | 0.5637 | 1.0191 |
| 2001M4 | 0.5313 | 1.0170 |
| 2001M5 | 0.5367 | 1.0668 |
| 2001M6 | 0.5363 | 1.0191 |
| 2001M7 | 0.5330 | 0.9896 |
| 2001M8 | 0.5297 | 0.9988 |
| 2001M9 | 0.5160 | 1.0340 |
| 2001M10 | 0.5077 | 0.9963 |
| 2001M11 | 0.4948 | 1.0029 |
| 2001M12 | 0.5081 | 0.9780 |
| 2002M1 | 0.5006 | 0.9676 |
| 2002M2 | 0.4736 | 0.9846 |
| 2002M3 | 0.4745 | 0.9900 |
| 2002M4 | 0.4587 | 0.9971 |
| 2002M5 | 0.4653 | 1.0025 |
| 2002M6 | 0.4620 | 1.0203 |
| 2002M7 | 0.4570 | 1.0108 |
| 2002M8 | 0.4620 | 0.9809 |
| 2002M9 | 0.4741 | 0.9498 |
| 2002M10 | 0.4653 | 0.9435 |
| 2002M11 | 0.4662 | 0.9527 |
| 2002M12 | 0.4633 | 0.9411 |
| 2003M1 | 0.4666 | 0.9170 |
| 2003M2 | 0.4608 | 0.9103 |
| 2003M3 | 0.4608 | 0.9103 |
| 2003M4 | 0.4728 | 0.8979 |
| 2003M5 | 0.4736 | 0.8871 |
| 2003M6 | 0.4633 | 0.8730 |
| 2003M7 | 0.5035 | 0.8323 |
| 2003M8 | 0.4981 | 0.8427 |
| 2003M9 | 0.5430 | 0.8323 |
| 2003M10 | 0.5575 | 0.8315 |
| 2003M11 | 0.5687 | 0.8248 |
| 2003M12 | 0.5799 | 0.8165 |
| 2004M1 | 0.5770 | 0.8007 |
| 2004M2 | 0.5820 | 0.8057 |
| 2004M3 | 0.5645 | 0.8186 |
| 2004M4 | 0.5687 | 0.8227 |
| 2004M5 | 0.5890 | 0.7983 |
| 2004M6 | 0.6102 | 0.7796 |
| 2004M7 | 0.5907 | 0.7792 |
| 2004M8 | 0.5758 | 0.7862 |
| 2004M9 | 0.5753 | 0.7684 |
| 2004M10 | 0.6351 | 0.7389 |
| 2004M11 | 0.5953 | 0.7347 |
| 2004M12 | 0.6185 | 0.7082 |
| 2005M1 | 0.5367 | 0.6800 |
| 2005M2 | 0.4720 | 0.6712 |
| 2005M3 | 0.5330 | 0.6866 |
| 2005M4 | 0.6040 | 0.6953 |
| 2005M5 | 0.6198 | 0.7020 |
| 2005M6 | 0.6040 | 0.6858 |
| 2005M7 | 0.5351 | 0.6800 |
| 2005M8 | 0.6110 | 0.6887 |
| 2005M9 | 0.6173 | 0.6990 |
| 2005M10 | 0.6210 | 0.6932 |
| 2005M11 | 0.5372 | 0.6737 |
| 2005M12 | 0.4670 | 0.6501 |
| 2006M1 | 0.6359 | 0.6671 |
| 2006M2 | 0.6214 | 0.6646 |
| 2006M3 | 0.6430 | 0.6584 |
| 2006M4 | 0.6260 | 0.6613 |
Figure 2a. Length of Forecast Intervals for Benchmark Taylor Rule and Random Walk Models (Deutschmark), 1-month-ahead forecast
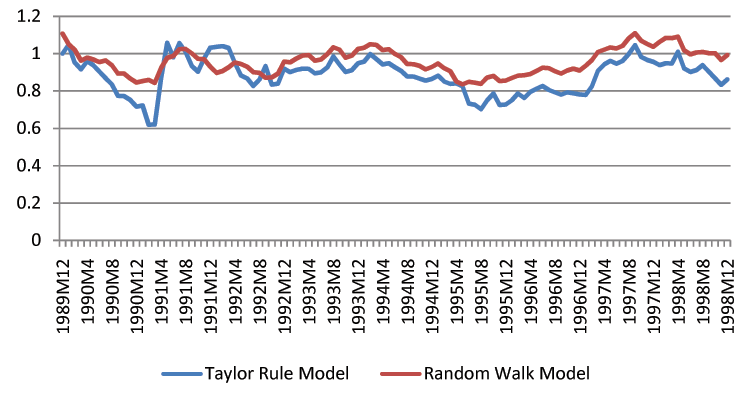
Note: To facilitate graphical comparisons, the 6- and 12-month-ahead forecast intervals of the random walk have been relocated such that they have the same center as the intervals of the Taylor rule model.
Data for Figure 2a
| Date | Taylor Rule | RW |
|---|---|---|
| 1989M12 | 1.0000 | 1.1060 |
| 1990M1 | 1.0471 | 1.0497 |
| 1990M2 | 0.9522 | 1.0190 |
| 1990M3 | 0.9156 | 0.9614 |
| 1990M4 | 0.9594 | 0.9777 |
| 1990M5 | 0.9385 | 0.9673 |
| 1990M6 | 0.9045 | 0.9535 |
| 1990M7 | 0.8678 | 0.9627 |
| 1990M8 | 0.8344 | 0.9372 |
| 1990M9 | 0.7729 | 0.8920 |
| 1990M10 | 0.7723 | 0.8920 |
| 1990M11 | 0.7520 | 0.8658 |
| 1990M12 | 0.7160 | 0.8442 |
| 1991M1 | 0.7212 | 0.8514 |
| 1991M2 | 0.6185 | 0.8580 |
| 1991M3 | 0.6198 | 0.8416 |
| 1991M4 | 0.8691 | 0.9228 |
| 1991M5 | 1.0576 | 0.9771 |
| 1991M6 | 0.9797 | 0.9869 |
| 1991M7 | 1.0569 | 1.0229 |
| 1991M8 | 1.0098 | 1.0242 |
| 1991M9 | 0.9326 | 1.0000 |
| 1991M10 | 0.9025 | 0.9719 |
| 1991M11 | 0.9732 | 0.9686 |
| 1991M12 | 1.0308 | 0.9300 |
| 1992M1 | 1.0366 | 0.8966 |
| 1992M2 | 1.0406 | 0.9058 |
| 1992M3 | 1.0301 | 0.9260 |
| 1992M4 | 0.9509 | 0.9509 |
| 1992M5 | 0.8822 | 0.9437 |
| 1992M6 | 0.8665 | 0.9287 |
| 1992M7 | 0.8266 | 0.8999 |
| 1992M8 | 0.8606 | 0.8966 |
| 1992M9 | 0.9326 | 0.8698 |
| 1992M10 | 0.8338 | 0.8724 |
| 1992M11 | 0.8384 | 0.8927 |
| 1992M12 | 0.9195 | 0.9562 |
| 1993M1 | 0.9005 | 0.9529 |
| 1993M2 | 0.9116 | 0.9725 |
| 1993M3 | 0.9188 | 0.9889 |
| 1993M4 | 0.9182 | 0.9915 |
| 1993M5 | 0.8940 | 0.9620 |
| 1993M6 | 0.8986 | 0.9679 |
| 1993M7 | 0.9260 | 0.9967 |
| 1993M8 | 0.9849 | 1.0334 |
| 1993M9 | 0.9411 | 1.0203 |
| 1993M10 | 0.9018 | 0.9764 |
| 1993M11 | 0.9110 | 0.9882 |
| 1993M12 | 0.9483 | 1.0242 |
| 1994M1 | 0.9568 | 1.0308 |
| 1994M2 | 0.9974 | 1.0497 |
| 1994M3 | 0.9712 | 1.0452 |
| 1994M4 | 0.9424 | 1.0183 |
| 1994M5 | 0.9483 | 1.0236 |
| 1994M6 | 0.9274 | 0.9980 |
| 1994M7 | 0.9084 | 0.9804 |
| 1994M8 | 0.8783 | 0.9437 |
| 1994M9 | 0.8763 | 0.9424 |
| 1994M10 | 0.8645 | 0.9332 |
| 1994M11 | 0.8547 | 0.9149 |
| 1994M12 | 0.8639 | 0.9274 |
| 1995M1 | 0.8815 | 0.9470 |
| 1995M2 | 0.8501 | 0.9215 |
| 1995M3 | 0.8370 | 0.9045 |
| 1995M4 | 0.8403 | 0.8495 |
| 1995M5 | 0.8253 | 0.8344 |
| 1995M6 | 0.7317 | 0.8488 |
| 1995M7 | 0.7251 | 0.8436 |
| 1995M8 | 0.7016 | 0.8364 |
| 1995M9 | 0.7493 | 0.8711 |
| 1995M10 | 0.7853 | 0.8796 |
| 1995M11 | 0.7238 | 0.8514 |
| 1995M12 | 0.7264 | 0.8541 |
| 1996M1 | 0.7487 | 0.8678 |
| 1996M2 | 0.7853 | 0.8815 |
| 1996M3 | 0.7624 | 0.8835 |
| 1996M4 | 0.7945 | 0.8901 |
| 1996M5 | 0.8109 | 0.9064 |
| 1996M6 | 0.8266 | 0.9234 |
| 1996M7 | 0.8043 | 0.9208 |
| 1996M8 | 0.7919 | 0.9045 |
| 1996M9 | 0.7801 | 0.8927 |
| 1996M10 | 0.7925 | 0.9084 |
| 1996M11 | 0.7873 | 0.9182 |
| 1996M12 | 0.7808 | 0.9084 |
| 1997M1 | 0.7788 | 0.9332 |
| 1997M2 | 0.8240 | 0.9640 |
| 1997M3 | 0.9077 | 1.0085 |
| 1997M4 | 0.9424 | 1.0209 |
| 1997M5 | 0.9607 | 1.0314 |
| 1997M6 | 0.9450 | 1.0268 |
| 1997M7 | 0.9601 | 1.0406 |
| 1997M8 | 0.9974 | 1.0805 |
| 1997M9 | 1.0445 | 1.1086 |
| 1997M10 | 0.9823 | 1.0687 |
| 1997M11 | 0.9660 | 1.0510 |
| 1997M12 | 0.9562 | 1.0360 |
| 1998M1 | 0.9385 | 1.0615 |
| 1998M2 | 0.9476 | 1.0838 |
| 1998M3 | 0.9463 | 1.0818 |
| 1998M4 | 1.0092 | 1.0903 |
| 1998M5 | 0.9202 | 1.0164 |
| 1998M6 | 0.9012 | 0.9954 |
| 1998M7 | 0.9116 | 1.0052 |
| 1998M8 | 0.9378 | 1.0085 |
| 1998M9 | 0.9038 | 1.0020 |
| 1998M10 | 0.8671 | 1.0013 |
| 1998M11 | 0.8325 | 0.9653 |
| 1998M12 | 0.8613 | 0.9921 |
Figure 2b. Length of Forecast Intervals for Benchmark Taylor Rule and Random Walk Models (Deutschmark), 6-month-ahead forecast
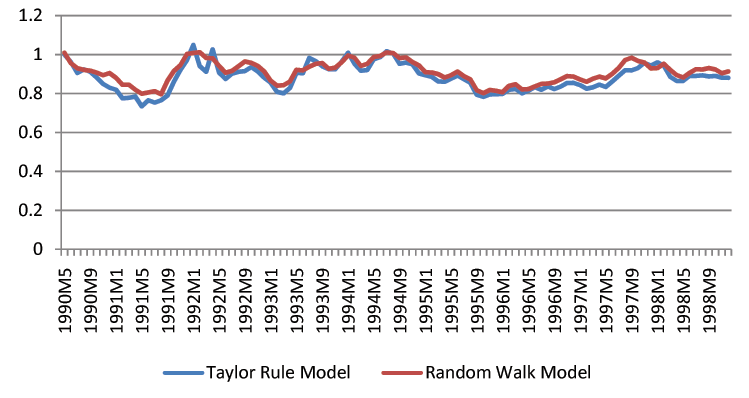
Note: To facilitate graphical comparisons, the 6- and 12-month-ahead forecast intervals of the random walk have been relocated such that they have the same center as the intervals of the Taylor rule model.
Data for Figure 2b
| Date | Taylor Rule | RW |
|---|---|---|
| 1990M5 | 1.0000 | 1.0091 |
| 1990M6 | 0.9614 | 0.9553 |
| 1990M7 | 0.9059 | 0.9300 |
| 1990M8 | 0.9235 | 0.9212 |
| 1990M9 | 0.9110 | 0.9171 |
| 1990M10 | 0.8822 | 0.9070 |
| 1990M11 | 0.8491 | 0.8944 |
| 1990M12 | 0.8296 | 0.9053 |
| 1991M1 | 0.8184 | 0.8807 |
| 1991M2 | 0.7747 | 0.8444 |
| 1991M3 | 0.7777 | 0.8446 |
| 1991M4 | 0.7844 | 0.8196 |
| 1991M5 | 0.7338 | 0.7991 |
| 1991M6 | 0.7651 | 0.8058 |
| 1991M7 | 0.7531 | 0.8116 |
| 1991M8 | 0.7647 | 0.7963 |
| 1991M9 | 0.7893 | 0.8671 |
| 1991M10 | 0.8610 | 0.9158 |
| 1991M11 | 0.9214 | 0.9457 |
| 1991M12 | 0.9714 | 1.0032 |
| 1992M1 | 1.0490 | 1.0085 |
| 1992M2 | 0.9406 | 1.0121 |
| 1992M3 | 0.9110 | 0.9830 |
| 1992M4 | 1.0257 | 0.9807 |
| 1992M5 | 0.9063 | 0.9409 |
| 1992M6 | 0.8749 | 0.9072 |
| 1992M7 | 0.9017 | 0.9165 |
| 1992M8 | 0.9114 | 0.9396 |
| 1992M9 | 0.9150 | 0.9644 |
| 1992M10 | 0.9354 | 0.9576 |
| 1992M11 | 0.9131 | 0.9419 |
| 1992M12 | 0.8813 | 0.9129 |
| 1993M1 | 0.8552 | 0.8656 |
| 1993M2 | 0.8082 | 0.8402 |
| 1993M3 | 0.8008 | 0.8425 |
| 1993M4 | 0.8285 | 0.8622 |
| 1993M5 | 0.9053 | 0.9216 |
| 1993M6 | 0.9034 | 0.9184 |
| 1993M7 | 0.9820 | 0.9371 |
| 1993M8 | 0.9650 | 0.9527 |
| 1993M9 | 0.9392 | 0.9559 |
| 1993M10 | 0.9252 | 0.9267 |
| 1993M11 | 0.9239 | 0.9328 |
| 1993M12 | 0.9619 | 0.9604 |
| 1994M1 | 1.0093 | 0.9960 |
| 1994M2 | 0.9521 | 0.9835 |
| 1994M3 | 0.9161 | 0.9415 |
| 1994M4 | 0.9201 | 0.9523 |
| 1994M5 | 0.9746 | 0.9871 |
| 1994M6 | 0.9866 | 0.9930 |
| 1994M7 | 1.0168 | 1.0115 |
| 1994M8 | 1.0040 | 1.0076 |
| 1994M9 | 0.9519 | 0.9816 |
| 1994M10 | 0.9585 | 0.9860 |
| 1994M11 | 0.9506 | 0.9616 |
| 1994M12 | 0.9027 | 0.9445 |
| 1995M1 | 0.8936 | 0.9099 |
| 1995M2 | 0.8856 | 0.9082 |
| 1995M3 | 0.8618 | 0.8993 |
| 1995M4 | 0.8603 | 0.8821 |
| 1995M5 | 0.8762 | 0.8938 |
| 1995M6 | 0.8917 | 0.9123 |
| 1995M7 | 0.8730 | 0.8883 |
| 1995M8 | 0.8546 | 0.8720 |
| 1995M9 | 0.7931 | 0.8162 |
| 1995M10 | 0.7827 | 0.8018 |
| 1995M11 | 0.7950 | 0.8183 |
| 1995M12 | 0.7959 | 0.8135 |
| 1996M1 | 0.7974 | 0.8061 |
| 1996M2 | 0.8192 | 0.8393 |
| 1996M3 | 0.8234 | 0.8476 |
| 1996M4 | 0.8006 | 0.8209 |
| 1996M5 | 0.8145 | 0.8228 |
| 1996M6 | 0.8326 | 0.8364 |
| 1996M7 | 0.8190 | 0.8497 |
| 1996M8 | 0.8364 | 0.8516 |
| 1996M9 | 0.8224 | 0.8576 |
| 1996M10 | 0.8351 | 0.8733 |
| 1996M11 | 0.8535 | 0.8896 |
| 1996M12 | 0.8548 | 0.8870 |
| 1997M1 | 0.8423 | 0.8722 |
| 1997M2 | 0.8243 | 0.8607 |
| 1997M3 | 0.8319 | 0.8754 |
| 1997M4 | 0.8449 | 0.8868 |
| 1997M5 | 0.8336 | 0.8777 |
| 1997M6 | 0.8614 | 0.9012 |
| 1997M7 | 0.8906 | 0.9315 |
| 1997M8 | 0.9192 | 0.9722 |
| 1997M9 | 0.9188 | 0.9835 |
| 1997M10 | 0.9300 | 0.9671 |
| 1997M11 | 0.9568 | 0.9593 |
| 1997M12 | 0.9432 | 0.9292 |
| 1998M1 | 0.9599 | 0.9307 |
| 1998M2 | 0.9417 | 0.9527 |
| 1998M3 | 0.8851 | 0.9220 |
| 1998M4 | 0.8646 | 0.8953 |
| 1998M5 | 0.8643 | 0.8826 |
| 1998M6 | 0.8896 | 0.9061 |
| 1998M7 | 0.8900 | 0.9254 |
| 1998M8 | 0.8930 | 0.9233 |
| 1998M9 | 0.8877 | 0.9309 |
| 1998M10 | 0.8904 | 0.9237 |
| 1998M11 | 0.8809 | 0.9044 |
| 1998M12 | 0.8800 | 0.9135 |
Figure 2c. Length of Forecast Intervals for Benchmark Taylor Rule and Random Walk Models (Deutschmark), 12-month-ahead forecast
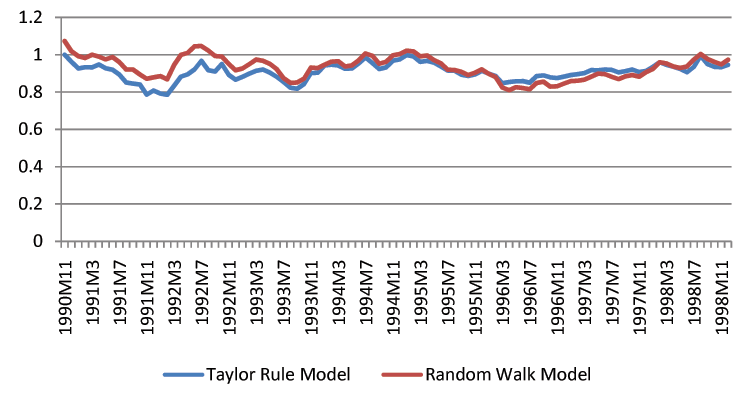
Note: To facilitate graphical comparisons, the 6- and 12-month-ahead forecast intervals of the random walk have been relocated such that they have the same center as the intervals of the Taylor rule model.
Data for Figure 2c
| Date | Taylor Rule | RW |
|---|---|---|
| 1990M11 | 1.0000 | 1.0730 |
| 1990M12 | 0.9630 | 1.0191 |
| 1991M1 | 0.9260 | 0.9919 |
| 1991M2 | 0.9336 | 0.9827 |
| 1991M3 | 0.9319 | 0.9999 |
| 1991M4 | 0.9477 | 0.9887 |
| 1991M5 | 0.9277 | 0.9752 |
| 1991M6 | 0.9195 | 0.9870 |
| 1991M7 | 0.8944 | 0.9604 |
| 1991M8 | 0.8508 | 0.9207 |
| 1991M9 | 0.8457 | 0.9206 |
| 1991M10 | 0.8409 | 0.8935 |
| 1991M11 | 0.7862 | 0.8712 |
| 1991M12 | 0.8084 | 0.8786 |
| 1992M1 | 0.7919 | 0.8850 |
| 1992M2 | 0.7852 | 0.8681 |
| 1992M3 | 0.8335 | 0.9454 |
| 1992M4 | 0.8828 | 0.9985 |
| 1992M5 | 0.8946 | 1.0087 |
| 1992M6 | 0.9213 | 1.0455 |
| 1992M7 | 0.9676 | 1.0467 |
| 1992M8 | 0.9170 | 1.0223 |
| 1992M9 | 0.9105 | 0.9929 |
| 1992M10 | 0.9506 | 0.9905 |
| 1992M11 | 0.8925 | 0.9505 |
| 1992M12 | 0.8665 | 0.9166 |
| 1993M1 | 0.8812 | 0.9259 |
| 1993M2 | 0.8987 | 0.9492 |
| 1993M3 | 0.9136 | 0.9743 |
| 1993M4 | 0.9205 | 0.9672 |
| 1993M5 | 0.9048 | 0.9514 |
| 1993M6 | 0.8814 | 0.9221 |
| 1993M7 | 0.8546 | 0.8745 |
| 1993M8 | 0.8238 | 0.8487 |
| 1993M9 | 0.8180 | 0.8511 |
| 1993M10 | 0.8425 | 0.8708 |
| 1993M11 | 0.9015 | 0.9311 |
| 1993M12 | 0.9033 | 0.9277 |
| 1994M1 | 0.9425 | 0.9467 |
| 1994M2 | 0.9467 | 0.9625 |
| 1994M3 | 0.9424 | 0.9655 |
| 1994M4 | 0.9248 | 0.9362 |
| 1994M5 | 0.9260 | 0.9424 |
| 1994M6 | 0.9538 | 0.9703 |
| 1994M7 | 0.9853 | 1.0060 |
| 1994M8 | 0.9548 | 0.9936 |
| 1994M9 | 0.9235 | 0.9510 |
| 1994M10 | 0.9322 | 0.9619 |
| 1994M11 | 0.9680 | 0.9971 |
| 1994M12 | 0.9750 | 1.0031 |
| 1995M1 | 0.9979 | 1.0219 |
| 1995M2 | 0.9918 | 1.0177 |
| 1995M3 | 0.9619 | 0.9915 |
| 1995M4 | 0.9675 | 0.9960 |
| 1995M5 | 0.9583 | 0.9714 |
| 1995M6 | 0.9369 | 0.9541 |
| 1995M7 | 0.9152 | 0.9192 |
| 1995M8 | 0.9145 | 0.9174 |
| 1995M9 | 0.8927 | 0.9085 |
| 1995M10 | 0.8867 | 0.8912 |
| 1995M11 | 0.8951 | 0.9029 |
| 1995M12 | 0.9138 | 0.9216 |
| 1996M1 | 0.8984 | 0.8973 |
| 1996M2 | 0.8864 | 0.8808 |
| 1996M3 | 0.8469 | 0.8246 |
| 1996M4 | 0.8543 | 0.8099 |
| 1996M5 | 0.8581 | 0.8265 |
| 1996M6 | 0.8585 | 0.8217 |
| 1996M7 | 0.8501 | 0.8143 |
| 1996M8 | 0.8857 | 0.8476 |
| 1996M9 | 0.8892 | 0.8561 |
| 1996M10 | 0.8789 | 0.8293 |
| 1996M11 | 0.8752 | 0.8311 |
| 1996M12 | 0.8825 | 0.8448 |
| 1997M1 | 0.8914 | 0.8582 |
| 1997M2 | 0.8959 | 0.8602 |
| 1997M3 | 0.9019 | 0.8665 |
| 1997M4 | 0.9177 | 0.8821 |
| 1997M5 | 0.9171 | 0.8985 |
| 1997M6 | 0.9212 | 0.8962 |
| 1997M7 | 0.9188 | 0.8810 |
| 1997M8 | 0.9055 | 0.8694 |
| 1997M9 | 0.9125 | 0.8843 |
| 1997M10 | 0.9206 | 0.8913 |
| 1997M11 | 0.9076 | 0.8821 |
| 1997M12 | 0.9128 | 0.9058 |
| 1998M1 | 0.9347 | 0.9231 |
| 1998M2 | 0.9601 | 0.9595 |
| 1998M3 | 0.9460 | 0.9533 |
| 1998M4 | 0.9359 | 0.9365 |
| 1998M5 | 0.9237 | 0.9295 |
| 1998M6 | 0.9066 | 0.9366 |
| 1998M7 | 0.9347 | 0.9725 |
| 1998M8 | 0.9940 | 1.0035 |
| 1998M9 | 0.9495 | 0.9771 |
| 1998M10 | 0.9350 | 0.9615 |
| 1998M11 | 0.9332 | 0.9477 |
| 1998M12 | 0.9456 | 0.9731 |
Figure 3a. Length of Forecast Intervals for Benchmark Taylor Rule and Random Walk Models (Japanese Yen), 1-month-ahead forecast
Note: To facilitate graphical comparisons, the 6- and 12-month-ahead forecast intervals of the random walk have been relocated such that they have the same center as the intervals of the Taylor rule model.
Data for Figure 3a
| Date | Taylor rule | RW |
|---|---|---|
| 1989M12 | 1.0000 | 0.9695 |
| 1990M1 | 0.9991 | 0.9706 |
| 1990M2 | 1.0087 | 0.9793 |
| 1990M3 | 1.0061 | 0.9841 |
| 1990M4 | 1.0695 | 1.0666 |
| 1990M5 | 1.1049 | 1.1024 |
| 1990M6 | 1.0753 | 1.0716 |
| 1990M7 | 1.0710 | 1.0382 |
| 1990M8 | 1.0340 | 1.0067 |
| 1990M9 | 1.0495 | 0.9950 |
| 1990M10 | 0.9858 | 0.9510 |
| 1990M11 | 0.9925 | 0.8902 |
| 1990M12 | 0.9930 | 0.8877 |
| 1991M1 | 1.0346 | 0.9197 |
| 1991M2 | 1.0305 | 0.9185 |
| 1991M3 | 1.0002 | 0.8968 |
| 1991M4 | 1.0998 | 0.9448 |
| 1991M5 | 1.0970 | 0.9429 |
| 1991M6 | 1.1097 | 0.9505 |
| 1991M7 | 1.1078 | 0.9611 |
| 1991M8 | 1.0886 | 0.9478 |
| 1991M9 | 1.0784 | 0.9409 |
| 1991M10 | 0.9780 | 0.9236 |
| 1991M11 | 0.9529 | 0.8993 |
| 1991M12 | 0.9462 | 0.8915 |
| 1992M1 | 0.9373 | 0.8805 |
| 1992M2 | 0.9158 | 0.8628 |
| 1992M3 | 0.9161 | 0.8782 |
| 1992M4 | 0.9502 | 0.9137 |
| 1992M5 | 0.9507 | 0.9184 |
| 1992M6 | 0.9347 | 0.8993 |
| 1992M7 | 0.9094 | 0.8723 |
| 1992M8 | 0.9030 | 0.8657 |
| 1992M9 | 0.9027 | 0.8681 |
| 1992M10 | 0.8747 | 0.8431 |
| 1992M11 | 0.8661 | 0.8333 |
| 1992M12 | 0.8844 | 0.8519 |
| 1993M1 | 0.8870 | 0.8530 |
| 1993M2 | 0.8951 | 0.8595 |
| 1993M3 | 0.8640 | 0.8305 |
| 1993M4 | 0.8160 | 0.8047 |
| 1993M5 | 0.7733 | 0.7731 |
| 1993M6 | 0.7599 | 0.7588 |
| 1993M7 | 0.6571 | 0.7387 |
| 1993M8 | 0.6414 | 0.7406 |
| 1993M9 | 0.6116 | 0.7136 |
| 1993M10 | 0.6299 | 0.7260 |
| 1993M11 | 0.6388 | 0.7360 |
| 1993M12 | 0.6651 | 0.7419 |
| 1994M1 | 0.7432 | 0.7559 |
| 1994M2 | 0.7707 | 0.7664 |
| 1994M3 | 0.6653 | 0.7311 |
| 1994M4 | 0.6419 | 0.7228 |
| 1994M5 | 0.6223 | 0.7117 |
| 1994M6 | 0.6367 | 0.7135 |
| 1994M7 | 0.6287 | 0.7051 |
| 1994M8 | 0.5732 | 0.6770 |
| 1994M9 | 0.5788 | 0.6873 |
| 1994M10 | 0.5437 | 0.6792 |
| 1994M11 | 0.5076 | 0.6763 |
| 1994M12 | 0.5075 | 0.6742 |
| 1995M1 | 0.5765 | 0.6890 |
| 1995M2 | 0.5552 | 0.6861 |
| 1995M3 | 0.5173 | 0.6636 |
| 1995M4 | 0.4977 | 0.6115 |
| 1995M5 | 0.6096 | 0.5772 |
| 1995M6 | 0.6199 | 0.5870 |
| 1995M7 | 0.6166 | 0.5832 |
| 1995M8 | 0.6907 | 0.6022 |
| 1995M9 | 0.7835 | 0.6534 |
| 1995M10 | 0.7001 | 0.7139 |
| 1995M11 | 0.7031 | 0.7159 |
| 1995M12 | 0.7041 | 0.7031 |
| 1996M1 | 0.7020 | 0.7025 |
| 1996M2 | 0.7208 | 0.7294 |
| 1996M3 | 0.7221 | 0.7297 |
| 1996M4 | 0.7230 | 0.7307 |
| 1996M5 | 0.7389 | 0.7394 |
| 1996M6 | 0.7229 | 0.7334 |
| 1996M7 | 0.7409 | 0.7507 |
| 1996M8 | 0.7394 | 0.7523 |
| 1996M9 | 0.7295 | 0.7432 |
| 1996M10 | 0.7460 | 0.7574 |
| 1996M11 | 0.7686 | 0.7745 |
| 1996M12 | 0.7708 | 0.7738 |
| 1997M1 | 0.7838 | 0.7690 |
| 1997M2 | 0.8110 | 0.7955 |
| 1997M3 | 0.8599 | 0.8306 |
| 1997M4 | 0.8580 | 0.8293 |
| 1997M5 | 0.8719 | 0.8486 |
| 1997M6 | 0.8300 | 0.8051 |
| 1997M7 | 0.7843 | 0.7720 |
| 1997M8 | 0.7936 | 0.7793 |
| 1997M9 | 0.8098 | 0.7966 |
| 1997M10 | 0.8272 | 0.8166 |
| 1997M11 | 0.8304 | 0.8177 |
| 1997M12 | 0.8632 | 0.8469 |
| 1998M1 | 0.9077 | 0.8763 |
| 1998M2 | 0.9062 | 0.8751 |
| 1998M3 | 0.8611 | 0.8501 |
| 1998M4 | 0.8824 | 0.8719 |
| 1998M5 | 0.9043 | 0.8899 |
| 1998M6 | 0.9280 | 0.9112 |
| 1998M7 | 0.9761 | 0.9479 |
| 1998M8 | 0.9736 | 0.9510 |
| 1998M9 | 0.9949 | 0.9773 |
| 1998M10 | 0.9842 | 0.9265 |
| 1998M11 | 0.8384 | 0.8431 |
| 1998M12 | 0.8210 | 0.8378 |
| 1999M1 | 0.7927 | 0.8154 |
| 1999M2 | 0.7644 | 0.7874 |
| 1999M3 | 0.7904 | 0.8108 |
| 1999M4 | 0.8114 | 0.8303 |
| 1999M5 | 0.8129 | 0.8324 |
| 1999M6 | 0.8303 | 0.8478 |
| 1999M7 | 0.8464 | 0.8390 |
| 1999M8 | 0.8224 | 0.8204 |
| 1999M9 | 0.7600 | 0.7784 |
| 1999M10 | 0.7040 | 0.7406 |
| 1999M11 | 0.6917 | 0.7343 |
| 1999M12 | 0.6671 | 0.7251 |
| 2000M1 | 0.6497 | 0.7108 |
| 2000M2 | 0.6701 | 0.7296 |
| 2000M3 | 0.7260 | 0.7580 |
| 2000M4 | 0.7084 | 0.7367 |
| 2000M5 | 0.6806 | 0.7319 |
| 2000M6 | 0.7185 | 0.7506 |
| 2000M7 | 0.7078 | 0.7354 |
| 2000M8 | 0.7187 | 0.7498 |
| 2000M9 | 0.7119 | 0.7489 |
| 2000M10 | 0.7100 | 0.7403 |
| 2000M11 | 0.7171 | 0.7514 |
| 2000M12 | 0.7209 | 0.7553 |
| 2001M1 | 0.7429 | 0.7775 |
| 2001M2 | 0.8222 | 0.8084 |
| 2001M3 | 0.8069 | 0.8045 |
| 2001M4 | 0.8809 | 0.8420 |
| 2001M5 | 0.8924 | 0.8576 |
| 2001M6 | 0.8857 | 0.8437 |
| 2001M7 | 0.8906 | 0.8478 |
| 2001M8 | 0.9435 | 0.8627 |
| 2001M9 | 0.8830 | 0.8410 |
| 2001M10 | 0.8547 | 0.8218 |
| 2001M11 | 0.8877 | 0.8415 |
| 2001M12 | 0.8999 | 0.8482 |
| 2002M1 | 0.9544 | 0.8869 |
| 2002M2 | 1.0358 | 0.9223 |
| 2002M3 | 1.0490 | 0.9290 |
| 2002M4 | 1.0152 | 0.9111 |
| 2002M5 | 1.0111 | 0.9090 |
| 2002M6 | 0.9612 | 0.8717 |
| 2002M7 | 0.8995 | 0.8503 |
| 2002M8 | 0.8490 | 0.8132 |
| 2002M9 | 0.8544 | 0.8207 |
| 2002M10 | 0.8644 | 0.8179 |
| 2002M11 | 0.8908 | 0.8370 |
| 2002M12 | 0.8647 | 0.8214 |
| 2003M1 | 0.8651 | 0.8233 |
| 2003M2 | 0.8493 | 0.8025 |
| 2003M3 | 0.8372 | 0.8021 |
| 2003M4 | 0.8265 | 0.7977 |
| 2003M5 | 0.8293 | 0.8058 |
| 2003M6 | 0.8153 | 0.7888 |
| 2003M7 | 0.8273 | 0.7926 |
| 2003M8 | 0.8298 | 0.7951 |
| 2003M9 | 0.8290 | 0.7948 |
| 2003M10 | 0.7912 | 0.7690 |
| 2003M11 | 0.7533 | 0.7334 |
| 2003M12 | 0.7120 | 0.7194 |
| 2004M1 | 0.6662 | 0.7099 |
| 2004M2 | 0.6629 | 0.7003 |
| 2004M3 | 0.7001 | 0.7031 |
| 2004M4 | 0.6752 | 0.7150 |
| 2004M5 | 0.6682 | 0.7094 |
| 2004M6 | 0.6981 | 0.7536 |
| 2004M7 | 0.6776 | 0.7335 |
| 2004M8 | 0.6453 | 0.6950 |
| 2004M9 | 0.6478 | 0.6997 |
| 2004M10 | 0.6451 | 0.6988 |
| 2004M11 | 0.6382 | 0.6905 |
| 2004M12 | 0.6180 | 0.6646 |
| 2005M1 | 0.6125 | 0.6590 |
| 2005M2 | 0.6112 | 0.6559 |
| 2005M3 | 0.6232 | 0.6528 |
| 2005M4 | 0.6226 | 0.6547 |
| 2005M5 | 0.6331 | 0.6668 |
| 2005M6 | 0.6221 | 0.6631 |
| 2005M7 | 0.6373 | 0.6765 |
| 2005M8 | 0.6546 | 0.6964 |
| 2005M9 | 0.6483 | 0.6880 |
| 2005M10 | 0.6544 | 0.6920 |
| 2005M11 | 0.6616 | 0.7145 |
| 2005M12 | 0.6750 | 0.7368 |
| 2006M1 | 0.6603 | 0.7360 |
| 2006M2 | 0.6201 | 0.7140 |
| 2006M3 | 0.6267 | 0.7287 |
| 2006M4 | 0.6238 | 0.7252 |
| 2006M5 | 0.6264 | 0.7239 |
| 2006M6 | 0.6703 | 0.6908 |
Figure 3b. Length of Forecast Intervals for Benchmark Taylor Rule and Random Walk Models (Japanese Yen), 6-month-ahead forecast
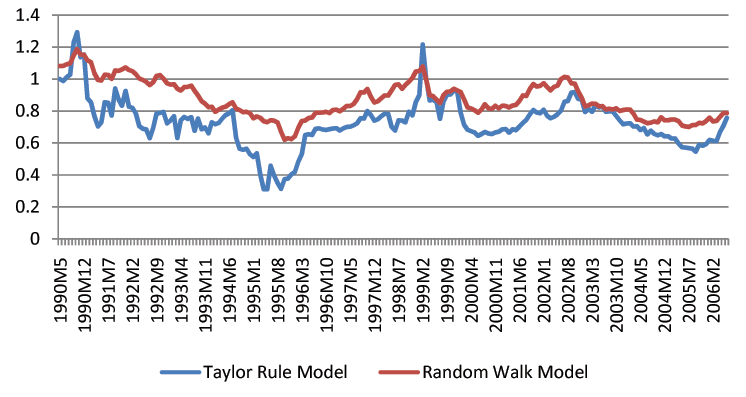
Note: To facilitate graphical comparisons, the 6- and 12-month-ahead forecast intervals of the random walk have been relocated such that they have the same center as the intervals of the Taylor rule model.
Data for Figure 3b
| Date | Taylor Rule | RW |
|---|---|---|
| 1990M5 | 1.0000 | 1.0812 |
| 1990M6 | 0.9872 | 1.0825 |
| 1990M7 | 1.0120 | 1.0922 |
| 1990M8 | 1.0282 | 1.0975 |
| 1990M9 | 1.2311 | 1.1483 |
| 1990M10 | 1.2928 | 1.1869 |
| 1990M11 | 1.1366 | 1.1537 |
| 1990M12 | 1.1536 | 1.1512 |
| 1991M1 | 0.8790 | 1.1163 |
| 1991M2 | 0.8542 | 1.1045 |
| 1991M3 | 0.7677 | 1.0369 |
| 1991M4 | 0.7039 | 0.9940 |
| 1991M5 | 0.7292 | 0.9911 |
| 1991M6 | 0.8556 | 1.0269 |
| 1991M7 | 0.8509 | 1.0255 |
| 1991M8 | 0.7721 | 1.0012 |
| 1991M9 | 0.9407 | 1.0537 |
| 1991M10 | 0.8734 | 1.0516 |
| 1991M11 | 0.8330 | 1.0601 |
| 1991M12 | 0.9249 | 1.0719 |
| 1992M1 | 0.8268 | 1.0571 |
| 1992M2 | 0.8198 | 1.0494 |
| 1992M3 | 0.7834 | 1.0301 |
| 1992M4 | 0.7062 | 1.0029 |
| 1992M5 | 0.6896 | 0.9943 |
| 1992M6 | 0.6842 | 0.9820 |
| 1992M7 | 0.6296 | 0.9623 |
| 1992M8 | 0.6932 | 0.9795 |
| 1992M9 | 0.7836 | 1.0190 |
| 1992M10 | 0.7882 | 1.0242 |
| 1992M11 | 0.7933 | 1.0029 |
| 1992M12 | 0.7222 | 0.9728 |
| 1993M1 | 0.7394 | 0.9655 |
| 1993M2 | 0.7675 | 0.9682 |
| 1993M3 | 0.6309 | 0.9403 |
| 1993M4 | 0.7411 | 0.9294 |
| 1993M5 | 0.7627 | 0.9501 |
| 1993M6 | 0.7502 | 0.9514 |
| 1993M7 | 0.7616 | 0.9586 |
| 1993M8 | 0.6755 | 0.9262 |
| 1993M9 | 0.7527 | 0.8975 |
| 1993M10 | 0.6862 | 0.8622 |
| 1993M11 | 0.6972 | 0.8463 |
| 1993M12 | 0.6603 | 0.8239 |
| 1994M1 | 0.7295 | 0.8260 |
| 1994M2 | 0.7172 | 0.7959 |
| 1994M3 | 0.7254 | 0.8097 |
| 1994M4 | 0.7523 | 0.8208 |
| 1994M5 | 0.7751 | 0.8274 |
| 1994M6 | 0.7863 | 0.8430 |
| 1994M7 | 0.8050 | 0.8547 |
| 1994M8 | 0.6317 | 0.8153 |
| 1994M9 | 0.5649 | 0.8061 |
| 1994M10 | 0.5571 | 0.7937 |
| 1994M11 | 0.5647 | 0.7958 |
| 1994M12 | 0.5284 | 0.7864 |
| 1995M1 | 0.5120 | 0.7551 |
| 1995M2 | 0.5352 | 0.7665 |
| 1995M3 | 0.4009 | 0.7576 |
| 1995M4 | 0.3106 | 0.7366 |
| 1995M5 | 0.3105 | 0.7304 |
| 1995M6 | 0.4579 | 0.7431 |
| 1995M7 | 0.3974 | 0.7401 |
| 1995M8 | 0.3495 | 0.7287 |
| 1995M9 | 0.3129 | 0.6715 |
| 1995M10 | 0.3725 | 0.6208 |
| 1995M11 | 0.3767 | 0.6313 |
| 1995M12 | 0.4034 | 0.6239 |
| 1996M1 | 0.4188 | 0.6420 |
| 1996M2 | 0.4821 | 0.6954 |
| 1996M3 | 0.5311 | 0.7381 |
| 1996M4 | 0.6490 | 0.7407 |
| 1996M5 | 0.6547 | 0.7562 |
| 1996M6 | 0.6503 | 0.7599 |
| 1996M7 | 0.6880 | 0.7890 |
| 1996M8 | 0.6911 | 0.7893 |
| 1996M9 | 0.6845 | 0.7904 |
| 1996M10 | 0.6811 | 0.7952 |
| 1996M11 | 0.6859 | 0.7872 |
| 1996M12 | 0.6904 | 0.8067 |
| 1997M1 | 0.6921 | 0.8084 |
| 1997M2 | 0.6779 | 0.7986 |
| 1997M3 | 0.6913 | 0.8138 |
| 1997M4 | 0.6999 | 0.8322 |
| 1997M5 | 0.7018 | 0.8314 |
| 1997M6 | 0.7101 | 0.8438 |
| 1997M7 | 0.7227 | 0.8729 |
| 1997M8 | 0.7548 | 0.9174 |
| 1997M9 | 0.7529 | 0.9159 |
| 1997M10 | 0.7990 | 0.9374 |
| 1997M11 | 0.7743 | 0.8892 |
| 1997M12 | 0.7389 | 0.8527 |
| 1998M1 | 0.7481 | 0.8608 |
| 1998M2 | 0.7672 | 0.8799 |
| 1998M3 | 0.7826 | 0.8978 |
| 1998M4 | 0.7818 | 0.8966 |
| 1998M5 | 0.7019 | 0.9285 |
| 1998M6 | 0.6785 | 0.9634 |
| 1998M7 | 0.7418 | 0.9666 |
| 1998M8 | 0.7406 | 0.9389 |
| 1998M9 | 0.7297 | 0.9630 |
| 1998M10 | 0.7945 | 0.9829 |
| 1998M11 | 0.7727 | 1.0064 |
| 1998M12 | 0.8549 | 1.0470 |
| 1999M1 | 0.8992 | 1.0504 |
| 1999M2 | 1.2164 | 1.0794 |
| 1999M3 | 1.0059 | 0.9987 |
| 1999M4 | 0.8664 | 0.8989 |
| 1999M5 | 0.8722 | 0.8933 |
| 1999M6 | 0.8555 | 0.8694 |
| 1999M7 | 0.7513 | 0.8496 |
| 1999M8 | 0.8570 | 0.8978 |
| 1999M9 | 0.9023 | 0.9194 |
| 1999M10 | 0.9026 | 0.9217 |
| 1999M11 | 0.9275 | 0.9388 |
| 1999M12 | 0.9212 | 0.9290 |
| 2000M1 | 0.7895 | 0.9183 |
| 2000M2 | 0.7129 | 0.8713 |
| 2000M3 | 0.6827 | 0.8225 |
| 2000M4 | 0.6732 | 0.8155 |
| 2000M5 | 0.6660 | 0.8053 |
| 2000M6 | 0.6443 | 0.7894 |
| 2000M7 | 0.6557 | 0.8103 |
| 2000M8 | 0.6693 | 0.8418 |
| 2000M9 | 0.6586 | 0.8181 |
| 2000M10 | 0.6552 | 0.8128 |
| 2000M11 | 0.6662 | 0.8336 |
| 2000M12 | 0.6707 | 0.8167 |
| 2001M1 | 0.6845 | 0.8327 |
| 2001M2 | 0.6873 | 0.8317 |
| 2001M3 | 0.6650 | 0.8221 |
| 2001M4 | 0.6860 | 0.8345 |
| 2001M5 | 0.6802 | 0.8388 |
| 2001M6 | 0.7010 | 0.8635 |
| 2001M7 | 0.7259 | 0.8978 |
| 2001M8 | 0.7444 | 0.8945 |
| 2001M9 | 0.7790 | 0.9393 |
| 2001M10 | 0.8058 | 0.9692 |
| 2001M11 | 0.7901 | 0.9535 |
| 2001M12 | 0.7865 | 0.9581 |
| 2002M1 | 0.8084 | 0.9749 |
| 2002M2 | 0.7691 | 0.9504 |
| 2002M3 | 0.7546 | 0.9288 |
| 2002M4 | 0.7637 | 0.9510 |
| 2002M5 | 0.7795 | 0.9586 |
| 2002M6 | 0.8007 | 0.9991 |
| 2002M7 | 0.8570 | 1.0128 |
| 2002M8 | 0.8634 | 1.0105 |
| 2002M9 | 0.9152 | 0.9737 |
| 2002M10 | 0.9182 | 0.9709 |
| 2002M11 | 0.8767 | 0.9234 |
| 2002M12 | 0.8720 | 0.8818 |
| 2003M1 | 0.7943 | 0.8289 |
| 2003M2 | 0.8124 | 0.8363 |
| 2003M3 | 0.7950 | 0.8471 |
| 2003M4 | 0.8349 | 0.8451 |
| 2003M5 | 0.8219 | 0.8293 |
| 2003M6 | 0.8280 | 0.8312 |
| 2003M7 | 0.7946 | 0.8102 |
| 2003M8 | 0.7986 | 0.8139 |
| 2003M9 | 0.7961 | 0.8094 |
| 2003M10 | 0.7687 | 0.8177 |
| 2003M11 | 0.7415 | 0.8004 |
| 2003M12 | 0.7171 | 0.8070 |
| 2004M1 | 0.7217 | 0.8095 |
| 2004M2 | 0.7240 | 0.8093 |
| 2004M3 | 0.7027 | 0.7829 |
| 2004M4 | 0.7050 | 0.7467 |
| 2004M5 | 0.6797 | 0.7446 |
| 2004M6 | 0.6938 | 0.7347 |
| 2004M7 | 0.6534 | 0.7247 |
| 2004M8 | 0.6766 | 0.7277 |
| 2004M9 | 0.6571 | 0.7357 |
| 2004M10 | 0.6474 | 0.7299 |
| 2004M11 | 0.6553 | 0.7607 |
| 2004M12 | 0.6410 | 0.7419 |
| 2005M1 | 0.6428 | 0.7423 |
| 2005M2 | 0.6277 | 0.7474 |
| 2005M3 | 0.6283 | 0.7464 |
| 2005M4 | 0.5976 | 0.7375 |
| 2005M5 | 0.5734 | 0.7099 |
| 2005M6 | 0.5708 | 0.7039 |
| 2005M7 | 0.5681 | 0.7006 |
| 2005M8 | 0.5649 | 0.7115 |
| 2005M9 | 0.5456 | 0.7136 |
| 2005M10 | 0.5890 | 0.7267 |
| 2005M11 | 0.5824 | 0.7228 |
| 2005M12 | 0.5930 | 0.7374 |
| 2006M1 | 0.6185 | 0.7591 |
| 2006M2 | 0.6135 | 0.7349 |
| 2006M3 | 0.6108 | 0.7391 |
| 2006M4 | 0.6672 | 0.7633 |
| 2006M5 | 0.7075 | 0.7871 |
| 2006M6 | 0.7570 | 0.7871 |
Figure 3c. Length of Forecast Intervals for Benchmark Taylor Rule and Random Walk Models (Japanese Yen), 12-month-ahead forecast
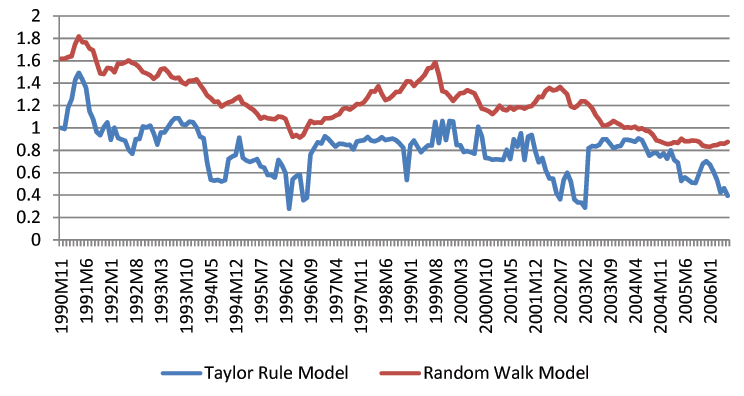
Note: To facilitate graphical comparisons, the 6- and 12-month-ahead forecast intervals of the random walk have been relocated such that they have the same center as the intervals of the Taylor rule model.
Data for Figure 3c
| Date | Taylor Rule | RW |
|---|---|---|
| 1990M11 | 1.0000 | 1.6165 |
| 1990M12 | 0.9901 | 1.6184 |
| 1991M1 | 1.1805 | 1.6329 |
| 1991M2 | 1.2577 | 1.6409 |
| 1991M3 | 1.4300 | 1.7498 |
| 1991M4 | 1.4912 | 1.8168 |
| 1991M5 | 1.4311 | 1.7661 |
| 1991M6 | 1.3602 | 1.7622 |
| 1991M7 | 1.1490 | 1.7088 |
| 1991M8 | 1.0786 | 1.6907 |
| 1991M9 | 0.9631 | 1.5872 |
| 1991M10 | 0.9354 | 1.4858 |
| 1991M11 | 1.0058 | 1.4815 |
| 1991M12 | 1.0488 | 1.5351 |
| 1992M1 | 0.8936 | 1.5329 |
| 1992M2 | 1.0013 | 1.4967 |
| 1992M3 | 0.9108 | 1.5752 |
| 1992M4 | 0.8965 | 1.5720 |
| 1992M5 | 0.8858 | 1.5847 |
| 1992M6 | 0.8041 | 1.6023 |
| 1992M7 | 0.7701 | 1.5802 |
| 1992M8 | 0.8993 | 1.5687 |
| 1992M9 | 0.9008 | 1.5398 |
| 1992M10 | 1.0123 | 1.4992 |
| 1992M11 | 1.0034 | 1.4863 |
| 1992M12 | 1.0202 | 1.4679 |
| 1993M1 | 0.9500 | 1.4384 |
| 1993M2 | 0.8499 | 1.4641 |
| 1993M3 | 0.9587 | 1.5233 |
| 1993M4 | 0.9606 | 1.5311 |
| 1993M5 | 1.0074 | 1.4992 |
| 1993M6 | 1.0563 | 1.4542 |
| 1993M7 | 1.0868 | 1.4432 |
| 1993M8 | 1.0865 | 1.4473 |
| 1993M9 | 1.0314 | 1.4056 |
| 1993M10 | 1.0272 | 1.3893 |
| 1993M11 | 1.0561 | 1.4203 |
| 1993M12 | 1.0505 | 1.4221 |
| 1994M1 | 1.0048 | 1.4330 |
| 1994M2 | 0.9223 | 1.3845 |
| 1994M3 | 0.9084 | 1.3416 |
| 1994M4 | 0.6862 | 1.2889 |
| 1994M5 | 0.5370 | 1.2651 |
| 1994M6 | 0.5297 | 1.2315 |
| 1994M7 | 0.5353 | 1.2347 |
| 1994M8 | 0.5219 | 1.1898 |
| 1994M9 | 0.5319 | 1.2104 |
| 1994M10 | 0.7222 | 1.2270 |
| 1994M11 | 0.7433 | 1.2368 |
| 1994M12 | 0.7589 | 1.2602 |
| 1995M1 | 0.9129 | 1.2777 |
| 1995M2 | 0.7351 | 1.2188 |
| 1995M3 | 0.7096 | 1.2050 |
| 1995M4 | 0.6967 | 1.1806 |
| 1995M5 | 0.7094 | 1.1607 |
| 1995M6 | 0.7212 | 1.1267 |
| 1995M7 | 0.6559 | 1.0818 |
| 1995M8 | 0.6451 | 1.0982 |
| 1995M9 | 0.5786 | 1.0853 |
| 1995M10 | 0.5788 | 1.0807 |
| 1995M11 | 0.5567 | 1.0773 |
| 1995M12 | 0.7131 | 1.1009 |
| 1996M1 | 0.6654 | 1.0964 |
| 1996M2 | 0.5964 | 1.0795 |
| 1996M3 | 0.2780 | 0.9947 |
| 1996M4 | 0.5406 | 0.9196 |
| 1996M5 | 0.5687 | 0.9352 |
| 1996M6 | 0.5834 | 0.9129 |
| 1996M7 | 0.3546 | 0.9374 |
| 1996M8 | 0.3770 | 1.0036 |
| 1996M9 | 0.7629 | 1.0609 |
| 1996M10 | 0.8200 | 1.0438 |
| 1996M11 | 0.8723 | 1.0489 |
| 1996M12 | 0.8593 | 1.0453 |
| 1997M1 | 0.9256 | 1.0854 |
| 1997M2 | 0.9018 | 1.0858 |
| 1997M3 | 0.8647 | 1.0900 |
| 1997M4 | 0.8324 | 1.1097 |
| 1997M5 | 0.8588 | 1.1219 |
| 1997M6 | 0.8560 | 1.1687 |
| 1997M7 | 0.8477 | 1.1777 |
| 1997M8 | 0.8487 | 1.1635 |
| 1997M9 | 0.8076 | 1.1857 |
| 1997M10 | 0.8792 | 1.2125 |
| 1997M11 | 0.8852 | 1.2113 |
| 1997M12 | 0.8906 | 1.2294 |
| 1998M1 | 0.9182 | 1.2718 |
| 1998M2 | 0.8876 | 1.3263 |
| 1998M3 | 0.8812 | 1.3242 |
| 1998M4 | 0.8928 | 1.3718 |
| 1998M5 | 0.9179 | 1.3014 |
| 1998M6 | 0.8911 | 1.2479 |
| 1998M7 | 0.8975 | 1.2598 |
| 1998M8 | 0.9038 | 1.2877 |
| 1998M9 | 0.8904 | 1.3200 |
| 1998M10 | 0.8606 | 1.3219 |
| 1998M11 | 0.8238 | 1.3689 |
| 1998M12 | 0.5344 | 1.4166 |
| 1999M1 | 0.8450 | 1.4146 |
| 1999M2 | 0.8870 | 1.3742 |
| 1999M3 | 0.8328 | 1.4094 |
| 1999M4 | 0.7842 | 1.4386 |
| 1999M5 | 0.8177 | 1.4729 |
| 1999M6 | 0.8436 | 1.5323 |
| 1999M7 | 0.8426 | 1.5373 |
| 1999M8 | 1.0542 | 1.5856 |
| 1999M9 | 0.8648 | 1.4738 |
| 1999M10 | 1.0621 | 1.3266 |
| 1999M11 | 0.8915 | 1.3183 |
| 1999M12 | 1.0623 | 1.2831 |
| 2000M1 | 1.0571 | 1.2417 |
| 2000M2 | 0.8477 | 1.2786 |
| 2000M3 | 0.8451 | 1.3094 |
| 2000M4 | 0.7853 | 1.3127 |
| 2000M5 | 0.7934 | 1.3370 |
| 2000M6 | 0.7821 | 1.3231 |
| 2000M7 | 0.7695 | 1.3078 |
| 2000M8 | 1.0103 | 1.2409 |
| 2000M9 | 0.9286 | 1.1713 |
| 2000M10 | 0.7329 | 1.1614 |
| 2000M11 | 0.7274 | 1.1469 |
| 2000M12 | 0.7153 | 1.1242 |
| 2001M1 | 0.7200 | 1.1540 |
| 2001M2 | 0.7169 | 1.1988 |
| 2001M3 | 0.7141 | 1.1651 |
| 2001M4 | 0.8048 | 1.1576 |
| 2001M5 | 0.7220 | 1.1871 |
| 2001M6 | 0.8976 | 1.1632 |
| 2001M7 | 0.8323 | 1.1860 |
| 2001M8 | 0.9516 | 1.1845 |
| 2001M9 | 0.7138 | 1.1709 |
| 2001M10 | 0.9214 | 1.1884 |
| 2001M11 | 0.9373 | 1.1946 |
| 2001M12 | 0.7969 | 1.2298 |
| 2002M1 | 0.6933 | 1.2786 |
| 2002M2 | 0.7306 | 1.2739 |
| 2002M3 | 0.6188 | 1.3317 |
| 2002M4 | 0.5480 | 1.3564 |
| 2002M5 | 0.5472 | 1.3345 |
| 2002M6 | 0.4140 | 1.3409 |
| 2002M7 | 0.3622 | 1.3644 |
| 2002M8 | 0.5346 | 1.3301 |
| 2002M9 | 0.5997 | 1.2998 |
| 2002M10 | 0.5211 | 1.1940 |
| 2002M11 | 0.3607 | 1.1789 |
| 2002M12 | 0.3331 | 1.2012 |
| 2003M1 | 0.3321 | 1.2379 |
| 2003M2 | 0.2874 | 1.2363 |
| 2003M3 | 0.8179 | 1.2090 |
| 2003M4 | 0.8381 | 1.1750 |
| 2003M5 | 0.8352 | 1.1125 |
| 2003M6 | 0.8484 | 1.0725 |
| 2003M7 | 0.8988 | 1.0203 |
| 2003M8 | 0.8980 | 1.0220 |
| 2003M9 | 0.8598 | 1.0378 |
| 2003M10 | 0.8190 | 1.0621 |
| 2003M11 | 0.8338 | 1.0423 |
| 2003M12 | 0.8399 | 1.0267 |
| 2004M1 | 0.8928 | 1.0008 |
| 2004M2 | 0.8935 | 1.0053 |
| 2004M3 | 0.8876 | 0.9998 |
| 2004M4 | 0.8756 | 1.0100 |
| 2004M5 | 0.9065 | 0.9886 |
| 2004M6 | 0.8899 | 0.9968 |
| 2004M7 | 0.8219 | 0.9763 |
| 2004M8 | 0.7525 | 0.9691 |
| 2004M9 | 0.7721 | 0.9371 |
| 2004M10 | 0.7795 | 0.8888 |
| 2004M11 | 0.7437 | 0.8780 |
| 2004M12 | 0.7726 | 0.8664 |
| 2005M1 | 0.7245 | 0.8546 |
| 2005M2 | 0.7996 | 0.8581 |
| 2005M3 | 0.7141 | 0.8726 |
| 2005M4 | 0.6893 | 0.8658 |
| 2005M5 | 0.5255 | 0.9023 |
| 2005M6 | 0.5579 | 0.8800 |
| 2005M7 | 0.5332 | 0.8804 |
| 2005M8 | 0.5097 | 0.8865 |
| 2005M9 | 0.5091 | 0.8853 |
| 2005M10 | 0.5945 | 0.8747 |
| 2005M11 | 0.6787 | 0.8420 |
| 2005M12 | 0.7025 | 0.8348 |
| 2006M1 | 0.6718 | 0.8310 |
| 2006M2 | 0.6096 | 0.8439 |
| 2006M3 | 0.5378 | 0.8463 |
| 2006M4 | 0.4247 | 0.8620 |
| 2006M5 | 0.4614 | 0.8573 |
| 2006M6 | 0.3945 | 0.8746 |
References
Berkowitz, J. and G. Lorenzo (2001) "Long-Horizon Exchange Rate Predictability?" The Review of Economics and Statistics 83(1), 81-91.
Boero, G. and E. Marrocu (2004) "The performance of SETAR models: a regime conditional evaluation of point, interval and density forecasts," International Journal of Forecasting 20(2), 305-320.
Chen, Y. and K. P. Tsang (2009) “What Does the Yield Curve Tell Us About Exchange Rate Predictability?” Manuscript, University of Washington, and Virginia Tech.
Cheung, Y., M. D. Chinn, and A. Pascual (2005) "Empirical Exchange Rate Models of the Nineties: Are Any Fit to Survive?" Journal of International Money and Finance 24, 1150-1175.
Chinn, M. D. (forthcoming) “Nonlinearities, Business Cycles and Exchange Rates,” Economics Notes.
Chinn, M. D. and R. A. Meese (1995) "Banking on Currency Forecasts: How Predictable Is Change in Money?" Journal of International Economics 38, 161-178.
Christoffersen, P. F. (1998) "Evaluating Interval Forecasts," International Economic Review 39(4), 841-862.
Christoffersen, P. F. and S. Mazzotta (2005) “The Accuracy of Density Forecasts from Foreign
Exchange Options,” Journal of Financial Econometrics 3(4), 578-605.
Clarida, R., Gali, J. and M. Gertler (1998) "Monetary Rules in Practice: Some International Evidence," European Economic Review 42, 1033-1067.
Clarida, R.H., L. Sarno, M. P. Taylor, and G. Valente (2003) "The Out-of-Sample Success of Term Structure Models as Exchange Rate Predictors: A Step Beyond," Journal of International Economics 60, 61-83.
Clark, T. and K. D. West (2006) "Using Out-of-Sample Mean Squared Prediction Errors to Test the Martingale Difference Hypothesis," Journal of Econometrics 135 (1-2), 155-186.
Clark, T. and K. D. West (2007) "Approximately Normal Tests for Equal Predictive Accuracy in Nested Models," Journal of Econometrics 138(1), 291-311.
Corradi, V. and N. Swanson (2006a) "Predictive Density and Conditional Confidence Interval Accuracy Tests," Journal of Econometrics 135, 187-228.
Corradi, V. and N. Swanson (2006b) "Predictive Density Evaluation," In Grangerm C.W.J., Elliott, G., Timmerman, A. (Eds.), Handbook of Economic Forecasting, Elsevier, Amsterdam.
Diebold, F. X., Gunther, T. A. and A. S. Tay (1998) "Evaluating Density Forecasts with Applications to Financial Risk Management," International Economic Review 39(4), 863-883.
Diebold, F. X., Hahn, J. and A .S. Tay (1999) "Multivariate Density Forecast Evaluation and Calibration in Financial Risk Management: High-Frequency Returns of Foreign Exchange," Review of Economics and Statistics 81, 661-673.
Diebold, F. X. and R. S. Mariano (1995) "Comparing Predictive Accuracy," Journal of Business and Economic Statistics 13, 253-263.
Engel, C., N. Mark, and K. West (2007) "Exchange Rate Models are Not as Bad as You Think," in NBER Macroeconomics Annual.
Engel, C. and K. West (2005) "Exchange Rates and Fundamentals," Journal of Political Economy 113, 485-517.
Engel, C. and K. D. West (2006) "Taylor Rules and the Deutschmark-Dollar Real Exchange Rate," Journal of Money, Credit and Banking 38(5), 1175-1194.
Engel, C., J. Wang, and J. J. Wu (2008) "Can Long-horizon Data Beat the Random Walk under the Engel-West Explanation?" Working Paper, University of Wisconsin-Madison, the Federal Reserve Bank of Dallas, and the Federal Reserve Board.
Faust, J., J. Rogers, and J. Wright, (2003) "Exchange Rate Forecasting: The Errors We've Really Made," Journal of International Economics 60, 35-59.
Giacomini, R. and H. White (2006) "Tests of Conditional Predictive Ability," Econometrica 74, 1545-1578.
Groen, J. J. (2000) "The Monetary Exchange Rate Model as a Long-Run Phenomenon," Journal of International Economics 52, 299-319.
Hall, P., R.C.L. Wolff, and Q. Yao (1999) "Methods for Estimating a Conditional Distribution Function," Journal of American Statistical Association 94, 154-163.
Hong, Y., H. Li, and F. Zhao (2007) "Can the Random Walk be Beaten in Out-of-Sample Density Forecasts: Evidence from Intraday Foreign Exchange Rates," Journal of Econometrics 141, 736-776.
J.P. Morgan (1996) RiskMetrics Technical Document.
Kilian, L. (1999) "Exchange Rates And Monetary Fundamentals: What Do We Learn From Long-Horizon Regressions?" Journal of Applied Econometrics 14, 491-510.
Kilian, L. and M. Taylor (2003) "Why Is It So Difficult to Beat the Random Walk Forecast of Exchange Rate?" Journal of International Economics 60, 85-107.
MacDonald, R. and M. P. Taylor (1994) "The Monetary Model of the Exchange Rate: Long-Run Relationships, Short-Run Dynamics, and How to Beat a Random Walk," Journal of International Money and Finance 13, 276-290.
Mark, N. C. (1995) "Exchange Rates and Fundamentals: Evidence on Long-Horizon Predictability,'' American Economic Review 85, 201-218.
Mark, N. C. (2007) "Changing Monetary Policy Rules, Learning, and Real Exchange Rate Dynamics," Manuscript, University of Notre Dame.
Mark, N. and D. Sul (2001) "Nominal Exchange Rates and Monetary Fundamentals Evidence from a Small Post-Bretton Woods Panel," Journal of International Economics 53, 29-52.
Meese, R. A. and K. Rogoff (1983) "Empirical Exchange Rate Models of the Seventies: Do they Fit Out-of-Sample?'' Journal of International Economics 14, 3-24.
Molodtsova, T. and D. H. Papell (2009) "Out-of-Sample Exchange Rate Predictability with Taylor Rule Fundamentals," Journal of International Economics, 77(2), 167-180.
Molodtsova, T., A. Nikolsko-Rzhevskyy, and D. H. Papell (2008a), "Taylor Rules with Real-Time Data: A Tale of Two Countries and One Exchange Rate," Journal of Monetary Economics 55, S63-S79.
Molodtsova, T., A. Nikolsko-Rzhevskyy, and D. H. Papell (2008b), “Taylor Rules and the
Euro,” Manuscript Emory University, University of Memphis, and University of Houston.
Nason, J. and J. Rogers (2008) "Exchange Rates and Fundamentals: A Generalization," International Finance Discussion Papers, Number 948, Board of Governors of the Federal Reserve System.
Newey, W. K. and K. D. West (1987) "A Simple, Positive Semi-definite, Heteroskedasticity and Autocorrelation Consistent Covariance Matrix" Econometrica 55, 703-708.
Rogoff, K. S. and V. Stavrakeva (2008) “The Continuing Puzzle of Short Horizon Exchange Rate
Forecasting,” NBER Working Paper No. 14071.
Rossi, B. (2005) "Testing Long-horizon Predictive Ability with High Persistence, and the Meese-Rogoff Puzzle," International Economic Review 46(1), 61-92.
Sarno, L. and G. Valente (2005) "Empirical Exchange Rate Models and Currency Risk: Some Evidence from Density Forecasts," Journal of International, Money and Finance 24(2), 363-385.
Sarno, L. and G. Valente (forthcoming) “Exchange Rates and Fundamentals: Footloose or Evolving
Relationship?” Journal of the European Economic Association.
West, K. D. (1996) "Asymptotic Inference About Predictive Ability," Econometrica 64, 1067-1084.
Wu, J. J. (2007) "Robust Semiparametric Forecast Intervals," Manuscript, the Federal Reserve Board.
APPENDIX
A.1 Monetary and Taylor Rule Models
In this section, we describe the monetary and Taylor rule models used in the paper.A.1.1 Monetary Model
Assume the money market clearing condition in the home country is:where ![]() is the log of money supply,
is the log of money supply, ![]() is the log of aggregate price,
is the log of aggregate price, ![]() is
the nominal interest rate,
is
the nominal interest rate, ![]() is the log of
output, and
is the log of
output, and ![]() is the money demand shock. A
symmetric condition holds in the foreign country and we use an
asterisk in superscript to denote variables in the foreign country.
Subtracting the foreign money market clearing condition from the
home, we have:
is the money demand shock. A
symmetric condition holds in the foreign country and we use an
asterisk in superscript to denote variables in the foreign country.
Subtracting the foreign money market clearing condition from the
home, we have:
![$\displaystyle i_t-i_t^\ast=\frac{1}{\alpha}\left[-(m_t-m_t^\ast)+(p_t-p_t^\ast)+\gamma(y_t-y_t^\ast)+(v_t-v_t^\ast)\right].$](img245.gif)
|
(A.1.1) |
The nominal exchange rate is equal to its purchasing power value plus the real exchange rate:
| (A.1.2) |
The uncovered interest rate parity in financial market takes the form:
| (A.1.3) |
where ![]() is the uncovered interest rate parity
shock. Substituting equations (A.1.1) and (A.1.2) into
(A.1.3), we have
is the uncovered interest rate parity
shock. Substituting equations (A.1.1) and (A.1.2) into
(A.1.3), we have
| (A.1.4) |
where
![]() . Solving
. Solving ![]() recursively and applying the "no-bubbles" condition, we
have:
recursively and applying the "no-bubbles" condition, we
have:
![$\displaystyle s_t=E_t\left\{(1-b)\sum_{j=0}^\infty b^j\left[m_{t+j}-m_{t+1}^\ast-\gamma(y_{t+j}-y_{t+1}^\ast)+q_{t+1}-(v_{t+j}-v_{t+j}^\ast)\right]-b\sum_{j=1}^\infty b^{j}\rho_{t+j}\right\}.$](img252.gif)
|
(A.1.5) |
In the standard monetary model, such as Mark (1995), purchasing
power parity (![]() ) and uncovered interest rate
parity hold (
) and uncovered interest rate
parity hold (![]() ). Furthermore, it is assumed
that the money demand shock is zero (
). Furthermore, it is assumed
that the money demand shock is zero (
![]() ) and
) and ![]() .
Equation (A.1.5) reduces to:
.
Equation (A.1.5) reduces to:
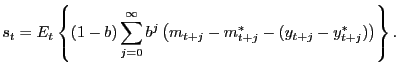 |
A.1.2 Taylor Rule Model
We follow Engel and West (2005) to assume that both countries follow the Taylor rule and the foreign country targets the exchange rate in its Taylor rule. The interest rate differential is:
| (A.1.6) |
where
![]() is the targeted exchange
rate. Assume that monetary authorities target the PPP level of the
exchange rate:
is the targeted exchange
rate. Assume that monetary authorities target the PPP level of the
exchange rate:
![]() . Substituting
this condition and the interest rate differential into the UIP
condition, we have:
. Substituting
this condition and the interest rate differential into the UIP
condition, we have:
| (A.1.7) |
where
![]() . Assuming that
uncovered interest rate parity holds (
. Assuming that
uncovered interest rate parity holds (![]() ) and
monetary shocks are zero, equation (A.1.7) reduces to the benchmark Taylor rule model in our paper:
) and
monetary shocks are zero, equation (A.1.7) reduces to the benchmark Taylor rule model in our paper:
 |
A.2 Long-horizon Regressions
In this section, we derive long-horizon regressions for the monetary model and the benchmark Taylor rule model.
A.2.1 Monetary Model
In the monetary model:
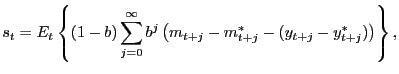 |
where ![]() and
and ![]() are logarithms
of domestic money stock and output, respectively. The superscript
are logarithms
of domestic money stock and output, respectively. The superscript
![]() denotes the foreign country. Money
supplies (
denotes the foreign country. Money
supplies (![]() and
and ![]() ) and
total outputs (
) and
total outputs (![]() and
and ![]() ) are
usually I(1) variables. The general form considered in Engel, Wang,
and Wu(2008) is:
) are
usually I(1) variables. The general form considered in Engel, Wang,
and Wu(2008) is:
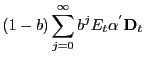 |
|||
| (A.2.1) | |||
where ![]() is the dimension of
is the dimension of
![]() and
and ![]() is an
is an
![]() identity matrix.
identity matrix. ![]() is the lag operator and
is the lag operator and
![]() . Assume
. Assume
![]() is non-diagonal and the covariance
matrix of
is non-diagonal and the covariance
matrix of
![]() is given by
is given by
![]() . We
assume that the change of fundamentals follows a VAR(p) process in
our setup. From proposition 1 of Engel, Wang, Wu (2008), we know
that for a fixed discount factor
. We
assume that the change of fundamentals follows a VAR(p) process in
our setup. From proposition 1 of Engel, Wang, Wu (2008), we know
that for a fixed discount factor ![]() and
and ![]() ,
,
is a correctly specified regression where the regressors and errors
do not correlate. In the case of ![]() , the
long-horizon regressions reduces to
, the
long-horizon regressions reduces to
Following the literature, for instance Mark (1995), we do not
include
![]() and its lags in our
long-horizon regressions. The monetary model can be written in the
form of (A.2.1) by setting
and its lags in our
long-horizon regressions. The monetary model can be written in the
form of (A.2.1) by setting
![]() ,
,
![]() . By
definition,
. By
definition,
![]() . This
corresponds to
. This
corresponds to
![]() ,
,
![]() in equation (1) of section 3.
in equation (1) of section 3.
A.2.2 Taylor Rule Model
In the Taylor rule model
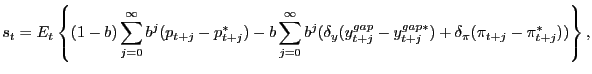 |
where ![]() ,
,
![]() and
and ![]() are
domestic aggregate price, output gap and inflation rate,
respectively.
are
domestic aggregate price, output gap and inflation rate,
respectively.
![]() and
and
![]() are coefficients of the Taylor
rule model. The aggregate prices
are coefficients of the Taylor
rule model. The aggregate prices ![]() and
and ![]() are usually I(1) variables. Inflation and output gap
are more likely to be I(0). Engel, Wang, and Wu (2008) consider a
setup which includes both stationary and non-stationary variables:
are usually I(1) variables. Inflation and output gap
are more likely to be I(0). Engel, Wang, and Wu (2008) consider a
setup which includes both stationary and non-stationary variables:
![$\displaystyle s_t=(1-b)\sum_{j=0}^\infty b^jE_t\left[f_{1t+j}\right]$](img310.gif) |
![$\displaystyle +b\sum_{j=0}^\infty b^jE_t\left[f_{2t+j}+u_{2t+j}\right]$](img311.gif) |
|
| (A.2.2) |
where ![]() and
and ![]() (
(![]() ) are observable (unobservable)
fundamentals.
) are observable (unobservable)
fundamentals.
![]() is the first difference
of
is the first difference
of
![]() , which contains I(1) economic
variables.24From proposition 2 of Engel, Wang,
and Wu (2008), we know that for a fixed discount factor
, which contains I(1) economic
variables.24From proposition 2 of Engel, Wang,
and Wu (2008), we know that for a fixed discount factor ![]() and
and ![]() ,
,
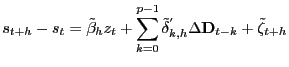 |
(A.2.3) |
is a correctly specified regression, where the regressors and
errors do not correlate. In the case of ![]() , the
long-horizon regressions reduces to:
, the
long-horizon regressions reduces to:
The Taylor rule model can be written into the form of (A.2.2) by setting
![$\displaystyle \mathbf{D}_{t}=\left[p_{t}\quad p^{*}_{t}\quad \sum_{s=-\infty}^t y^{gap}_{s}\quad \sum_{s=-\infty}^ty^{gap*}_s,\sum_{s=-\infty}^t\pi_{s}\quad \sum_{s=-\infty}^t\pi^{*}_{s}\right]'.$](img332.gif) |
By definition,
![]() . This corresponds to
. This corresponds to
![]() and
and
![]() , where
, where
![]() is the real exchange
rate.
is the real exchange
rate.
![]() and
and
![]() can be defined differently.
For instance,
can be defined differently.
For instance,
![]() and
and
![]() . Our results do not change qualitatively under this alternative
setup.
. Our results do not change qualitatively under this alternative
setup.
A.3 Model with Heterogeneous Taylor Rules
In the benchmark model, we assume that the Taylor rule coefficients are the same in the home and foreign countries. In this appendix, we relax the assumption of homogeneous Taylor rules in the benchmark model. It is straightforward to show in this case that the benchmark model changes to:
| (A.3.1) |
where the deviation of the exchange rate from its equilibrium level is defined as:
![$\displaystyle z_t=s_t-p_t+p_t^\ast+\frac{b}{1-b}\left[\delta_yy_t^{gap}-\delta_y^\ast y_t^{gap\ast}+\delta_\pi\pi_t-\delta_\pi^\ast\pi_t^\ast\right].$](img342.gif)
|
(A.3.2) |
According to equation (8), the matrix
![]() in equation (1) includes
economic variables
in equation (1) includes
economic variables
![]() ,
,
![]() , and
, and
![]() .25We
first estimate the Taylor rules in the home and foreign countries
according to equations (2) and (3). Then
.25We
first estimate the Taylor rules in the home and foreign countries
according to equations (2) and (3). Then
![]() ,
,
![]() ,
and
,
and
![]() are
used in the long-horizon regressions and interval forecasts. The
results are very similar to the benchmark model and reported in
Table 7.
are
used in the long-horizon regressions and interval forecasts. The
results are very similar to the benchmark model and reported in
Table 7.
Footnotes
1. We thank Menzie Chinn, Charles Engel, Bruce Hansen, Jesper Linde, Enrique Martinez-Garcia, Tanya Moldtsova, David Papell, Mark Wynne, and Ken West for invaluable discussions. We would also like to thank seminar participants at the Dallas Fed and the University of Houston for helpful comments. All views are those of the authors and do not necessarily reflect the views of the Federal Reserve Bank of Dallas, the Board of Governors or the Federal Reserve System. All GAUSS programs are available upon request. Return to text
2. Email: [email protected] Address: Research Department, Federal Reserve Bank of Dallas, 2200 N. Pearl Street, Dallas, TX 75201 Phone: (214) 922-6471. Return to text
3. Email: [email protected] Address: Board of Governors of the Federal Reserve System, 20th and C Streets, Washington, D.C. 20551 Phone: (202) 452-2556. Return to text
4. Chinn and Meese (1995) and MacDonald and Taylor (1994) find similar results. However, the long-horizon exchange rate predictability in Mark (1995) has been challenged by Kilian (1999) and Berkowitz and Giorgianni (2001) in subsequent studies. Return to text
5. For brevity, we omit RS and simply say forecast intervals when we believe that it causes no confusion. Return to text
6. The coefficients on lagged interest rates in the home and foreign countries can take different values in Molodtsova and Papell (2009). Return to text
7. We also tried the random walk with a drift. It does not change our results. Return to text
8. Clarida, Gali, and Gertler (1998) find empirical support for forward-looking Taylor rules. Forward-looking Taylor rules are ruled out because they require forecasts of predictors, which creates additional complications in out-of-sample forecasting. Return to text
9. See appendix for more detail. While the long-horizon regression format of the benchmark Taylor model is derived directly from the underlying Taylor rule model, this is not the case for the models with interest rate smoothing (models 3 and 4). Molodtsova and Papell (2009) only consider the short-horizon regression for the Taylor rule models. We include long-horizon regressions of these models only for the purpose of comparison. Return to text
10. We also tried the case of
![]() . Our results do not
change qualitatively. Return to
text
. Our results do not
change qualitatively. Return to
text
11. We thank the authors for the data, which we downloaded from David Papell's website. For the exact line numbers and sources of the data, see the data appendix of Molodtsova and Papell (2009). Return to text
12. We choose ![]() using the
method of Hall, Wolff, and Yao (1999). Return to text
using the
method of Hall, Wolff, and Yao (1999). Return to text
13. It is consistent in the sense of convergence in probability as the estimation sample size goes to infinity. Return to text
14. While RS intervals remedy mis-specifications asymptotically, it does not guarantee such corrections in a given finite sample. Return to text
15. We use Newey and West (1987) for our empirical work, with a window width of 12. Return to text
16. Center here means the half way point between the upper and lower bound for a given interval. Return to text
17. These nine exchange rates are the Danish Kroner, the French Franc, the Deutschmark, the Japanese Yen, the Dutch Guilder, the Portuguese Escudo, the Swiss Franc, and the British pound. Similar results hold at other horizons. Return to text
18. When comparing the intervals for
![]() , the random walk model
builds the forecast interval around 0, while economic model
, the random walk model
builds the forecast interval around 0, while economic model
![]() builds it around
builds it around
![]() .
Return to text
.
Return to text
19. Results are available upon request. Return to text
20. The only exception is Portugal, where only 192 data points were available. In this case, we choose R = 120. Return to text
21. See Appendix A.3 for details. Return to text
22. See Wu (2009) for more discussion. Return to text
23. Figures in other countries show similar patterns. Results are available upon request. Return to text
24. To incorporate I(0) economic
variables,
![]() contains the levels of I(1)
variables and the summation of I(0) variables from negative
infinity to time
contains the levels of I(1)
variables and the summation of I(0) variables from negative
infinity to time ![]() . Return
to text
. Return
to text
25. Another option to incorporate
heterogenous Taylor rules is to include ![]() ,
,
![]() ,
,
![]() ,
, ![]() , and
, and
![]() in
in
![]() . For instance, see
Moldtsova and Papell (2009). However, increasing the number of
regressors may cause the "curse of dimensionality" problem for our
semiparametric method. To be comparable to our benchmark model, we
define
. For instance, see
Moldtsova and Papell (2009). However, increasing the number of
regressors may cause the "curse of dimensionality" problem for our
semiparametric method. To be comparable to our benchmark model, we
define
![]() here such that the number
of regressors is the same as in the benchmark model. Return to text
here such that the number
of regressors is the same as in the benchmark model. Return to text
This version is optimized for use by screen readers. Descriptions for all mathematical expressions are provided in LaTex format. A printable pdf version is available. Return to text