
Board of Governors of the Federal Reserve System
International Finance Discussion Papers
Number 1012, December 2010 --- Screen Reader
Version*
Asymmetric Shocks in a Currency Union with Monetary and Fiscal Handcuffs**
NOTE: International Finance Discussion Papers are preliminary materials circulated to stimulate discussion and critical comment. References in publications to International Finance Discussion Papers (other than an acknowledgment that the writer has had access to unpublished material) should be cleared with the author or authors. Recent IFDPs are available on the Web at http://www.federalreserve.gov/pubs/ifdp/. This paper can be downloaded without charge from the Social Science Research Network electronic library at http://www.ssrn.com/.
Abstract:
This paper investigates the impact of the asymmetric shocks within a currency union in a framework that takes account of the zero bound constraint on policy rates, and also allows for constraints on fiscal policy. In this environment, we document that the usual optimal currency argument showing that the effects of shocks are mitigated to the extent that they are common across member states can be reversed. Countries can be worse off when their neighbors experience similar shocks, including policy-driven reductions in government spending.
Keywords: Monetary policy, fiscal policy, liquidity trap, zero bound constraint, open economy macroeconomics, DSGE model
JEL classification: E32, F41
1. Introduction
Following the intensification of the financial crisis in the fall of 2008, many countries implemented large fiscal stimulus packages aimed at mitigating the effects of the recession. A number of influential papers were supportive of these policy actions on the premise that fiscal multipliers were likely to be especially large in an environment in which monetary policy was unlikely to respond by raising interest rates.1 However, the rise in sovereign spreads in a number of European countries since late 2009, especially those with high government debt or deficit levels, has spurred plans for substantial and accelerated fiscal consolidation in those countries. Moreover, even some countries that have access to capital markets on very favorable terms appear committed to fiscal retrenchment.
This paper uses an open economy DSGE model to analyze how asymmetric shocks that are concentrated in a subset of member countries of a currency union affect the union both at an aggregate level, and differentially across member states. While this question has a long history in the optimal currency area literature, our framework takes explicit account of possible constraints on both monetary and fiscal policy. In particular, we assume that monetary policy is constrained by the zero lower bound (ZLB) on policy rates, and also consider the possibility that fiscal policy in at least some member countries may be constrained to react aggressively to debt or deficits.
Our model consists of two country blocks that are integrated into a currency union, and hence share a single currency. The model structure inherits many of the features of a broad class of new open economy macro models. These include the various nominal and real frictions that have been identified as empirically important in the closed economy models of Christiano, Eichenbaum, and Evans (2005) and Smets and Wouters (2003), as well as analogous frictions relevant in an open economy framework, such as costs of adjusting trade flows. The model also incorporates "rule of thumb" households which consume all of their after-tax income as in Erceg, Guerrieri, and Gust (2006), and a financial accelerator channel following the approach of Bernanke, Gertler, and Gilchrist (1999).Fiscal policy is determined separately by each country block, and includes rules for adjusting an endogenous component of government spending or taxes in response to government debt.
We calibrate the model to the euro area, identifying one country block as the "South", and the other the "North." Our analysis focuses on a "Large South" calibration in which the GDP of the South is half as large as of the North. We also examine an alternative "Small South" calibration in which the GDP of the South is a tiny fraction of the North's GDP. The latter closely approximates the case of a small open economy.
We begin by examining the effects of a contraction in government spending in the South. Under "normal conditions" in which monetary policy is unconstrained, the effects of fiscal contraction in a single small economy are considerably more severe than if a sizeable group of its neighbors also reduced spending (based on comparing our Small South and Large South calibrations). This reflects that the monetary authority essentially leaves interest rates unchanged in response to a contraction in a small economy, while reducing interest rates considerably in the case of a concerted fiscal contraction. Thus, as familiar from a standard optimal currency area rationale, a small country such as Portugal would be better off if it cut spending at the same time as its larger neighbors; and the smaller GDP decline would translate into a more rapid fall in the stock of debt. The fiscal contraction under the Large South calibration actually causes output to rise slightly in the North.
These implications contrast starkly with the case in which monetary policy is unable to reduce interest rates due to the ZLB constraint. In this environment, the impact of the fiscal shock on the South depends on agents' perceptions about how long the liquidity trap would last in the absence of additional shocks, and the severity of the associated recession. As a benchmark, we choose initial conditions to imply that the liquidity trap would last two years in the absence of an additional shock. Against this backdrop, a fiscal contraction in the Large South case has a considerably more negative impact than when a single small country reduces spending - so that a small country in the South is impacted more if its neighbors cut government spending at the same time. The implication that the fiscal multiplier is larger when monetary policy is constrained is consistent with previous closed economy analysis by Eggertsson (2008), Christiano, Eichenbaum, and Rebelo (2009), Woodford (2010), and Erceg and Lindé (2010).
The spillover effects to the North of the South's fiscal contraction to the North are negative and very sizeable, and cause a substantial deterioration in the North's government budget position. The implication of large spillover effects given the ZLB constraint has a close parallel to previous work by Bodenstein, Erceg, and Guerrieri (2009). However, the latter examined cross country spillovers in a two country framework in which each country conducted an independent monetary policy, and in which nominal exchange rates were free to adjust. In our model, spillovers to the North are large and negative when monetary policy is constrained by the zero bound, even though the North's exchange rate remains fixed in nominal terms (rather than appreciate, as would occur in the BEG framework).
The implication that the GDP contraction grows nonlinearly with the size of the South's spending shock makes it difficult to achieve progress in reducing government debt. Government debt in the South actually increases in the size of the spending contraction over a three year horizon. The impact on the currency union is exacerbated considerably if fiscal policy in the North aims to keep government debt stock from expanding. Such a policy turns out to be counterproductive, reducing currency union output and lengthening the period in which government debt rises.
Our results on the impact of monetary and fiscal constraints also applies to other shocks, including financial shocks. A rise in borrowing costs in the South turns out to have small spillover effects to the North under normal conditions, but can have vastly amplified effects when both monetary and fiscal policy are constrained. Moreover, reacting to cyclical deterioration in the budget position by tightening fiscal policy turns out to be counterproductive as long as the economy remains in a liquidity trap: the recession deepens in both South and North, and government budget positions deteriorate further.
An extensive literature on expansionary fiscal consolidation originating with Giavazzi and Pagano (1990) and Alesina and Perotti (1995,1997) has shown that sharp and durable cuts in government expenditure have appeared to boost output under certain conditions. The likelihood of achieving an output expansion is clearly enhanced to the extent that the fiscal consolidation reduces borrowing spreads. To examine this possibility, we amend our model to let credit spreads depend inversely on the government deficit, and stock of debt (on the premise that private borrowing costs are heavily influenced by the creditworthiness of the sovereign). In this environment, the adverse impact of fiscal consolidation in the "Large South" is greatly ameliorated, as are spillover effects to the North. If the financial spread is sufficiently sensitive to the government debt/deficit, the decline in spreads can even be large enough that the risk-free interest rate actually rises in response to fiscal consolidation, and output also rises after a few quarters. Under such conditions, the zero bound constraint has no material consequence for the South's GDP response, or for spillover effects to the North.
Taken together, our results suggest that the usual optimal currency area argument suggesting that the effects of shocks are mitigated to the extent that they are common across member states is not valid in an environment with monetary and fiscal constraints. As an upshot, coincident cuts in government spending across a large subset of member states - the South - can have an especially large contractionary effect if they occur when the monetary authority is likely to be constrained by the ZLB for a substantial period, with large adverse spillover effects to the North. Even so, while there appear to be substantial benefits of delaying the implementation of consolidation to a period when monetary policy is no longer constrained for countries that can already borrow on favorable terms, our analysis provides some rationale for aggressive and preemptive consolidation for countries that stand to reduce borrowing spreads markedly through rapid action.
The reminder of the paper is organized as follows. In the next Section, we present the two country open economy model. In Section 3, we discuss how we calibrate and compute the solution of the model under the zero lower bound for nominal interest rates. The results for the benchmark parameterization of the model are reported in Section 4. In Section 5, we assess the sensitivity of the results for alternative parameterizations of the model. Finally, we provide some conclusions in Section 6.
2. The Model
Our model consists of two country blocks that differ in size, but are otherwise isomorphic. The first country block is called the "South", and the second country block the "North." The country blocks share a common currency, and monetary policy is conducted by a single central bank. During "normal" times when the zero bound constraint on policy rates is not binding, the central bank adjusts policy rates in response to the aggregate inflation rate and output gap of the currency union. By contrast, fiscal policy may differ across the two blocks.
Given the isomorphic structure, our exposition below largely focuses on the structure of the South. It is important to recall, however, that differences in country size translate into difference in steady state trade shares. Thus, the standard small open economy paradigm emerges as a special case in which the population size of the South is calibrated to be an arbitrarily small fraction of the population of the currency union.
Our specification of the financial accelerator channel closely parallels earlier work by Bernanke, Gertler, and Gilchrist (1999) and Christiano, Motto, and Rostagno (2008). Given that the mechanics underlying the financial accelerator are well-understood, we simplify our exposition by focusing on a special case of our model which abstracts from a financial accelerator. We conclude our model description with a brief description of how the model is modified to include the financial accelerator (Section 2.6).
2.1 Firms and Price Setting
2.1.1 Production of Domestic Intermediate Goods
There is a continuum of differentiated intermediate goods
(indexed by
![]() ) in the South block, each of
which is produced by a single monopolistically competitive firm. In
the domestic market, firm
) in the South block, each of
which is produced by a single monopolistically competitive firm. In
the domestic market, firm ![]() faces a demand
function that varies inversely with its output price
faces a demand
function that varies inversely with its output price ![]() and directly with aggregate demand at home
and directly with aggregate demand at home
![]() :
:
![\begin{displaymath} Y_{Dt}(i)=\left[ \frac{P_{Dt}(i)}{P_{Dt}}\right] ^{\frac{-\left( 1+\theta _{p}\right) }{\theta _{p}}}Y_{Dt}, \end{displaymath}](img7.gif) |
(1) |
where ![]() , and
, and ![]() is an
aggregate price index defined below. Similarly, in the North block,
firm
is an
aggregate price index defined below. Similarly, in the North block,
firm ![]() faces the demand function:
faces the demand function:
![\begin{displaymath} X_{t}(i)=\left[ \frac{P_{Mt}^{\ast }(i)}{P_{Mt}^{\ast }}\right] ^{\frac{ -\left( 1+\theta _{p}\right) }{\theta _{p}}}M_{t}^{\ast }, \end{displaymath}](img11.gif) |
(2) |
where ![]() denotes the quantity demanded of
domestic good
denotes the quantity demanded of
domestic good ![]() in the North block,
in the North block,
![]() denotes the price that firm
denotes the price that firm
![]() sets in the North market,
sets in the North market,
![]() is the import price index in
the North, and
is the import price index in
the North, and ![]() is an aggregate of the
North's imports (we use an asterisk to denote the North block's
variables).
is an aggregate of the
North's imports (we use an asterisk to denote the North block's
variables).
Each producer utilizes capital services
![]() and a labor index
and a labor index
![]() (defined below) to
produce its respective output good. The production function is
assumed to have a constant-elasticity of substitution (CES)
form:
(defined below) to
produce its respective output good. The production function is
assumed to have a constant-elasticity of substitution (CES)
form:
| (3) |
The production function exhibits constant-returns-to-scale in both
inputs, and ![]() is a country-specific shock to the
level of technology. Firms face perfectly competitive factor
markets for hiring capital and labor. Thus, each firm chooses
is a country-specific shock to the
level of technology. Firms face perfectly competitive factor
markets for hiring capital and labor. Thus, each firm chooses
![]() and
and
![]() , taking as given both
the rental price of capital
, taking as given both
the rental price of capital ![]() and the
aggregate wage index
and the
aggregate wage index ![]() (defined below). Firms
can costlessly adjust either factor of production, which implies
that each firm has an identical marginal cost per unit of output,
(defined below). Firms
can costlessly adjust either factor of production, which implies
that each firm has an identical marginal cost per unit of output,
![]() .
.
We assume that each intermediate goods producer sets the same
price ![]() in both blocks of the currency
union, implying that
in both blocks of the currency
union, implying that
![]() and that
and that
![]() . The prices of the
intermediate goods are determined by Calvo-style staggered
contracts (see Calvo, 1983). In each period, a firm faces a
constant probability,
. The prices of the
intermediate goods are determined by Calvo-style staggered
contracts (see Calvo, 1983). In each period, a firm faces a
constant probability, ![]() , of being able to
reoptimize its price (
, of being able to
reoptimize its price (![]() ). This probability of
receiving a signal to reoptimize is independent across firms and
time. If a firm is not allowed to optimize its prices, we follow
Christiano, Eichenbaum and Evans (2005) and Smets and Wouters
(2003), and assume that the firm must reset its home price by a
weighted combination of the lagged and steady state rate of
inflation
). This probability of
receiving a signal to reoptimize is independent across firms and
time. If a firm is not allowed to optimize its prices, we follow
Christiano, Eichenbaum and Evans (2005) and Smets and Wouters
(2003), and assume that the firm must reset its home price by a
weighted combination of the lagged and steady state rate of
inflation
![]() for the non-optimizing firms. When
for the non-optimizing firms. When ![]() is
set close to unity, this formulation introduces structural inertia
into the price-setting equation.
is
set close to unity, this formulation introduces structural inertia
into the price-setting equation.
When a firm ![]() is allowed to reoptimize its price
in the domestic market in period
is allowed to reoptimize its price
in the domestic market in period ![]() , the firm
maximizes
, the firm
maximizes
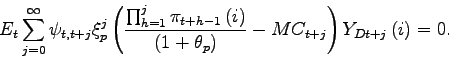
![\begin{displaymath} \mathbb{E}_{t}\sum_{j=0}^{\infty }\xi _{p}^{j}\psi _{t,t+j}\left[ \prod_{h=1}^{j}\pi _{t+h-1}P_{Dt}\left( i\right) Y_{Dt+j}\left( i\right) -MC_{t+j}Y_{Dt+j}\left( i\right) \right] . \end{displaymath}](img36.gif) |
(4) |
The operator
![]() represents the conditional
expectation based on the information available to agents at period
represents the conditional
expectation based on the information available to agents at period
![]() . The firm discounts profits received at date
. The firm discounts profits received at date
![]() by the state-contingent discount factor
by the state-contingent discount factor
![]() ; for notational simplicity, we
have suppressed all of the state indices.2 The first-order
condition for setting the contract price of good
; for notational simplicity, we
have suppressed all of the state indices.2 The first-order
condition for setting the contract price of good ![]() in
the home market is
in
the home market is
 |
(5) |
2.1.2 Production of the Domestic Output Index
Because households have identical Dixit-Stiglitz preferences, it
is convenient to assume that a representative aggregator combines
the differentiated intermediate products into a composite
home-produced good ![]() :
:
![\begin{displaymath} Y_{Dt}=\left[ \int_{0}^{1}Y_{Dt}\left( i\right) ^{\frac{1}{1+\theta _{p}}}di \right] ^{1+\theta _{p}}. \end{displaymath}](img49.gif) |
(6) |
The aggregator chooses the bundle of goods that minimizes the cost
of producing ![]() , taking the price
, taking the price
![]() of each intermediate
good
of each intermediate
good ![]() as given. The aggregator sells units
of each sectoral output index at its unit cost
as given. The aggregator sells units
of each sectoral output index at its unit cost ![]() :
:
![\begin{displaymath} P_{Dt}=\left[ \int_{0}^{1}P_{Dt}\left( i\right) ^{\frac{-1\, \,}{\theta _{p}\,}}di\right] ^{-\theta _{p}}. \end{displaymath}](img54.gif) |
(7) |
We also assume a representative aggregator in the foreign economy
who combines the differentiated home products ![]() into a single index for foreign imports:
into a single index for foreign imports:
![\begin{displaymath} M_{t}^{\ast }=\left[ \int_{0}^{1}X_{t}\left( i\right) ^{\frac{1}{1+\theta _{p}}}di\right] ^{1+\theta _{p}}, \end{displaymath}](img56.gif) |
(8) |
and sells ![]() at price
at price
![]() :
:
![\begin{displaymath} P_{Mt}^{\ast }=\left[ \int_{0}^{1}P_{Mt}^{\ast }\left( i\right) ^{\frac{-1\, \,}{\theta _{p}\,}}di\right] ^{-\theta _{p}}. \end{displaymath}](img59.gif) |
(9) |
2.1.3 Production of Consumption and Investment Goods
Final consumption goods are produced by a representative
consumption goods distributor. This firm combines purchases of
domestically-produced goods with imported goods to produce a final
consumption good (![]() according to a
constant-returns-to-scale CES production function:
according to a
constant-returns-to-scale CES production function:
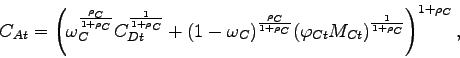 |
(10) |
where ![]() denotes the consumption good
distributor's demand for the index of domestically-produced goods,
denotes the consumption good
distributor's demand for the index of domestically-produced goods,
![]() denotes the distributor's demand for
the index of foreign-produced goods, and
denotes the distributor's demand for
the index of foreign-produced goods, and ![]() reflects costs of adjusting consumption imports.
The final consumption good is used by both households and by the
government. The form of the production function mirrors the
preferences of households and the government sector over
consumption of domestically-produced goods and imports.
Accordingly, the quasi-share parameter
reflects costs of adjusting consumption imports.
The final consumption good is used by both households and by the
government. The form of the production function mirrors the
preferences of households and the government sector over
consumption of domestically-produced goods and imports.
Accordingly, the quasi-share parameter ![]() may
be interpreted as determining the preferences of both the private
and public sector for domestic relative to foreign consumption
goods, or equivalently, the degree of home bias in consumption
expenditure. Finally, the adjustment cost term
may
be interpreted as determining the preferences of both the private
and public sector for domestic relative to foreign consumption
goods, or equivalently, the degree of home bias in consumption
expenditure. Finally, the adjustment cost term ![]() is assumed to take the quadratic form:
is assumed to take the quadratic form:
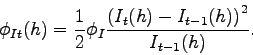
![\begin{displaymath} \varphi _{Ct}=\left[ 1-\frac{\varphi _{M_{C}}}{2}\left( \frac{\frac{M_{Ct}}{ C_{Dt}}}{\frac{M_{Ct-1}}{C_{Dt-1}}}-1\right) ^{2}\right] . \end{displaymath}](img67.gif) |
(11) |
This specification implies that it is costly to change the proportion of domestic and foreign goods in the aggregate consumption bundle, even though the level of imports may jump costlessly in response to changes in overall consumption demand.
Given the presence of adjustment costs, the representative
consumption goods distributor chooses (a contingency plan for)
![]() and
and ![]() to minimize its
discounted expected costs of producing the aggregate consumption
good:
to minimize its
discounted expected costs of producing the aggregate consumption
good:
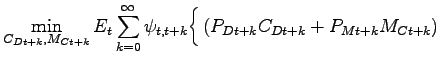 |
(12) |
![$\displaystyle \left. +P_{Ct+k}\left[ C_{A,t+k}-\left( \omega _{C}^{\frac{\rho _{C}}{ 1+\rho _{C}}}C_{Dt+k}^{\frac{1}{1+\rho _{C}}}+(1-\omega _{C})^{\frac{\rho _{C}}{1+\rho _{C}}}(\varphi _{Ct+k}M_{Ct+k})^{\frac{1}{1+\rho _{C}}}\right) ^{1+\rho _{C}}\right] \right \} . \notag$](img71.gif) |
The distributor sells the final consumption good to households and
the government at a price ![]() , which may be
interpreted as the consumption price index (or equivalently, as the
shadow cost of producing an additional unit of the consumption
good).
, which may be
interpreted as the consumption price index (or equivalently, as the
shadow cost of producing an additional unit of the consumption
good).
We model the production of final investment goods in an
analogous manner, although we allow the weight ![]() in the investment index to differ from that of the
weight
in the investment index to differ from that of the
weight ![]() in the consumption goods index.
3
in the consumption goods index.
3
2.2 Households and Wage Setting
We assume a continuum of monopolistically competitive households
(indexed on the unit interval), each of which supplies a
differentiated labor service to the intermediate goods-producing
sector (the only producers demanding labor services in our
framework). A representative labor aggregator (or "employment
agency") combines households' labor hours in the same proportions
as firms would choose. Thus, the aggregator's demand for each
household's labor is equal to the sum of firms' demands. The
aggregate labor index ![]() has the Dixit-Stiglitz
form:
has the Dixit-Stiglitz
form:
![\begin{displaymath} L_{t}=\left[ \int_{0}^{1}\left( \zeta N_{t}\left( h\right) \right) ^{\frac{1 }{1+\theta _{w}}}dh\right] ^{1+\theta _{w}}, \end{displaymath}](img76.gif) |
(13) |
where ![]() and
and ![]() is
hours worked by a typical member of household
is
hours worked by a typical member of household ![]() .
The parameter
.
The parameter ![]() is the size of a household of type
is the size of a household of type
![]() , and effectively determines the size of the
population in the South. The aggregator minimizes the cost of
producing a given amount of the aggregate labor index, taking each
household's wage rate
, and effectively determines the size of the
population in the South. The aggregator minimizes the cost of
producing a given amount of the aggregate labor index, taking each
household's wage rate
![]() as given, and then sells
units of the labor index to the production sector at their unit
cost
as given, and then sells
units of the labor index to the production sector at their unit
cost ![]() :
:
![\begin{displaymath} W_{t}=\left[ \int_{0}^{1}W_{t}{}\left( h\right) ^{\frac{-1}{\theta _{w}}}dh \right] ^{-\theta _{w}}. \end{displaymath}](img84.gif) |
(14) |
The aggregator's demand for the labor services of a typical member
of household ![]() is given by
is given by
![\begin{displaymath} N_{t}\left( h\right) =\left[ \frac{W_{t}\left( h\right) }{W_{t}}\right] ^{- \frac{1+\theta _{w}}{\theta _{w}}}L_{t}/\zeta . \end{displaymath}](img86.gif) |
(15) |
We assume that there are two types of households: households
that make intertemporal consumption, labor supply, and capital
accumulation decisions in a forward-looking manner by maximizing
utility subject to an intertemporal budget constraint (FL
households, for "forward-looking"); and the remainder that
simply consume their after-tax disposable income (HM households,
for "hand-to-mouth" households). The latter type receive no
capital rental income or profits, and choose to set their wage to
be the average wage of optimizing households. We denote the share
of FL households by ![]() and the share of HM
households by
and the share of HM
households by ![]() .
.
We consider first the problem faced by FL households. The
utility functional for an optimizing representative member of
household ![]() is
is
 |
|
 |
(16) |
where the discount factor ![]() satisfies
satisfies![]() As in Smets and Wouters
(2003, 2007), we allow for the possibility of external habit
formation in preferences, so that each household member cares about
its consumption relative to lagged aggregate consumption per capita
of optimizing agents,
As in Smets and Wouters
(2003, 2007), we allow for the possibility of external habit
formation in preferences, so that each household member cares about
its consumption relative to lagged aggregate consumption per capita
of optimizing agents, ![]() . The period utility
function depends on an each member's current leisure
. The period utility
function depends on an each member's current leisure
![]() , his end-of-period
real money balances,
, his end-of-period
real money balances,
![]() , and a
preference shock,
, and a
preference shock, ![]() . The inclusion of
money in the model - which is a zero nominal interest asset -
provides a rationale for the zero lower bound on nominal interest
rates in the model.
. The inclusion of
money in the model - which is a zero nominal interest asset -
provides a rationale for the zero lower bound on nominal interest
rates in the model.
Household ![]() faces a flow budget constraint in period
faces a flow budget constraint in period
![]() which states that its combined expenditure
on goods and on the net accumulation of financial assets must equal
its disposable income:
which states that its combined expenditure
on goods and on the net accumulation of financial assets must equal
its disposable income:
 |
(17) |
Investment in physical capital augments the per capita capital
stock ![]() according to a linear transition
law of the form:
according to a linear transition
law of the form:
| (18) |
where ![]() is the depreciation rate of capital.
is the depreciation rate of capital.
Financial asset accumulation of a typical member of FL household
![]() consists of increases in nominal money
holdings (
consists of increases in nominal money
holdings (
![]() and the net
acquisition of bonds. While the domestic financial market is
complete,4 cross-border asset trade is restricted
to a single non-state contingent bond issued by the government of
the North economy.
and the net
acquisition of bonds. While the domestic financial market is
complete,4 cross-border asset trade is restricted
to a single non-state contingent bond issued by the government of
the North economy.
The terms ![]() and
and ![]() represents each household member's net purchases of the government
bonds issued by the South and North governments, respectively. Each
type of bond pays one currency unit (e.g., euro) in the subsequent
period, and is sold at price (discount) of
represents each household member's net purchases of the government
bonds issued by the South and North governments, respectively. Each
type of bond pays one currency unit (e.g., euro) in the subsequent
period, and is sold at price (discount) of ![]() and
and
![]() , respectively. To ensure the
stationarity of foreign asset positions, we follow Turnovsky (1985)
by assuming that domestic households must pay a transaction cost
when trading in the foreign bond. The intermediation cost depends
on the ratio of economy-wide holdings of net foreign assets to
nominal GDP,
, respectively. To ensure the
stationarity of foreign asset positions, we follow Turnovsky (1985)
by assuming that domestic households must pay a transaction cost
when trading in the foreign bond. The intermediation cost depends
on the ratio of economy-wide holdings of net foreign assets to
nominal GDP, ![]() , and are given by:
, and are given by:
| (19) |
If the South is an overall net lender position internationally,
then a household will earn a lower return on any holdings of
foreign (i.e., North) bonds. By contrast, if the South has a net
debtor position, a household will pay a higher return on its
foreign liabilities. Given that the domestic government bond and
foreign bond have the same payoff, the price faced by domestic
residents net of the transaction cost is identical, so that
![]()
Each member of FL household ![]() earns after-tax
labor income,
earns after-tax
labor income,
![]() ,
where
,
where ![]() is a stochastic tax on labor
income. The household leases capital at the after-tax rental rate
is a stochastic tax on labor
income. The household leases capital at the after-tax rental rate
![]() , where
, where ![]() is a stochastic tax on capital income. The
household receives a depreciation write-off of
is a stochastic tax on capital income. The
household receives a depreciation write-off of
![]() per unit of capital.
Each member also receives an aliquot share
per unit of capital.
Each member also receives an aliquot share
![]() of the profits of
all firms and a lump-sum government transfer,
of the profits of
all firms and a lump-sum government transfer,
![]() and pays a lump-sum
tax
and pays a lump-sum
tax ![]() . Following Christiano, Eichenbaum
and Evans (2005), we assume that it is costly to change the level
of gross investment from the previous period, so that the
acceleration in the capital stock is penalized:
. Following Christiano, Eichenbaum
and Evans (2005), we assume that it is costly to change the level
of gross investment from the previous period, so that the
acceleration in the capital stock is penalized:
 |
(20) |
In every period ![]() , each member of FL household
, each member of FL household
![]() maximizes the utility functional (16) with respect to
its consumption, investment, (end-of-period) capital stock, money
balances, holdings of contingent claims, and holdings of domestic
and foreign bonds, subject to its labor demand function (15), budget
constraint (17), and transition
equation for capital (18). In doing so, a
household takes as given prices, taxes and transfers, and aggregate
quantities such as lagged aggregate consumption and the aggregate
net foreign asset position.
maximizes the utility functional (16) with respect to
its consumption, investment, (end-of-period) capital stock, money
balances, holdings of contingent claims, and holdings of domestic
and foreign bonds, subject to its labor demand function (15), budget
constraint (17), and transition
equation for capital (18). In doing so, a
household takes as given prices, taxes and transfers, and aggregate
quantities such as lagged aggregate consumption and the aggregate
net foreign asset position.
Forward-looking (FL) households set nominal wages in staggered
contracts that are analogous to the price contracts described
above. In particular, with probability ![]() ,
each member of a household is allowed to reoptimize its wage
contract. If a household is not allowed to optimize its wage rate,
we assume each household member resets its wage according
to:
,
each member of a household is allowed to reoptimize its wage
contract. If a household is not allowed to optimize its wage rate,
we assume each household member resets its wage according
to:
| (21) |
where ![]() is the gross nominal wage
inflation in period
is the gross nominal wage
inflation in period ![]() , i.e.
, i.e. ![]() , and
, and ![]() is the steady
state rate of change in the nominal wage (equal to gross price
inflation since steady state gross productivity growth is assumed
to be unity). Dynamic indexation of this form introduces some
element of structural persistence into the wage-setting process.
Each member of household
is the steady
state rate of change in the nominal wage (equal to gross price
inflation since steady state gross productivity growth is assumed
to be unity). Dynamic indexation of this form introduces some
element of structural persistence into the wage-setting process.
Each member of household ![]() chooses the value of
chooses the value of
![]() to maximize its utility functional
(16)
subject to these constraints.
to maximize its utility functional
(16)
subject to these constraints.
Finally, we consider the determination of consumption and labor
supply of the hand-to-mouth (HM) households. A typical member of a
HM household simply equates his nominal consumption spending,
![]() , to his
current after-tax disposable income, which consists of labor income
plus net lump-sum transfers from the government:
, to his
current after-tax disposable income, which consists of labor income
plus net lump-sum transfers from the government:
| (22) |
The HM households set their wage to be the average wage of the forward-looking households. Since HM households face the same labor demand schedule as the forward-looking households, each HM household works the same number of hours as the average for forward-looking households.
2.3 Monetary Policy
We assume that the central bank follows a Taylor rule for setting the policy rate of the currency union, subject to the zero bound constraint on nominal interest rates. Thus:
| (23) |
In this equation, ![]() is the quarterly nominal
interest rate expressed in deviation from its steady state value of
is the quarterly nominal
interest rate expressed in deviation from its steady state value of
![]() . Hence, imposing the zero lower bound then
implies that
. Hence, imposing the zero lower bound then
implies that ![]() cannot fall below
cannot fall below ![]() .
.
![]() is price inflation rate of
the currency union,
is price inflation rate of
the currency union, ![]() the inflation target, and
the inflation target, and
![]() is the output gap of the
currency union. The aggregate inflation and output gap measures are
defined as a GDP-weighted average of the inflation rates and output
gaps of the South and North. Finally, the output gap in each member
is here defined as the deviation of actual output from its
potential level, where potential is the level of output that would
prevail if wages and prices were completely flexible.
is the output gap of the
currency union. The aggregate inflation and output gap measures are
defined as a GDP-weighted average of the inflation rates and output
gaps of the South and North. Finally, the output gap in each member
is here defined as the deviation of actual output from its
potential level, where potential is the level of output that would
prevail if wages and prices were completely flexible.
2.4 Fiscal Policy
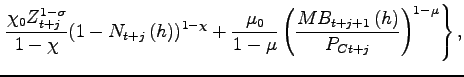
Government purchases have no direct effect on the utility of households, nor do they affect the production function of the private sector. To capture the possibility of implementation lags in spending, we assume that government spending follows an AR(2) process as in Uhlig (2009):
| (24) |
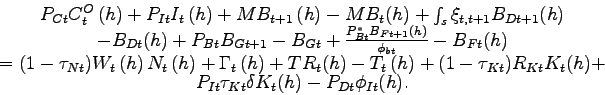
The government does not need to balance its budget each period, and issues nominal debt to finance its deficits according to:
| (25) |
Equation (25)
aggregates the capital stock, money and bond holdings, and
transfers and taxes over all households so that, for example,
![]() . The
capital tax
. The
capital tax ![]() is assumed to be fixed, and
the ratio of real transfers to (trend) GDP,
is assumed to be fixed, and
the ratio of real transfers to (trend) GDP,
![]() , is also fixed.
Given that the central bank uses the nominal interest rate as its
policy instrument, the level of seigniorage revenues are determined
by nominal money demand.
, is also fixed.
Given that the central bank uses the nominal interest rate as its
policy instrument, the level of seigniorage revenues are determined
by nominal money demand.
The distortionary tax on labor income ![]() adjusts in response to both the debt/GDP ratio,
adjusts in response to both the debt/GDP ratio, ![]() , and to the total government deficit,
, and to the total government deficit,
![]() :
:
| (26) |
where
![]() and
and
![]() is the government's target value for
the ratio of government debt to nominal (trend) output.
is the government's target value for
the ratio of government debt to nominal (trend) output.
2.5 Resource Constraint and Net Foreign Assets
The domestic economy's aggregate resource constraint can be written as:
| (27) |
where ![]() is the adjustment cost on
investment aggregated across all households. The final consumption
good is allocated between households and the government:
is the adjustment cost on
investment aggregated across all households. The final consumption
good is allocated between households and the government:
| (28) |
where ![]() is total private consumption of FL
(optimizing) and HM households:
is total private consumption of FL
(optimizing) and HM households:
| (29) |
Total exports may be allocated to either the consumption or the investment sector abroad:
| (30) |
Finally, at the level of the individual firm:
| (31) |
The evolution of net foreign assets can be expressed as:
 |
(32) |
This expression can be derived from the budget constraint of the FL
households after imposing the government budget constraint, the
consumption rule of the HM households, the definition of firm
profits, and the condition that domestic bonds (![]() ) are in zero net supply.
) are in zero net supply.
Finally, we assume that the structure of the foreign country (the North) is isomorphic to that of the home country (the South).
2.6 Production of capital services
We incorporate a financial accelerator mechanism into both
country blocks of our benchmark model following the basic approach
of Bernanke, Gertler and Gilchrist (1999). Thus,
the intermediate goods producers rent capital services from
entrepeneurs (at the price ![]() rather than
directly from households. Entrepeneurs purchase capital from
competitive capital goods producers, with the latter employing the
same technology to transform investment goods into finished capital
goods as described by equations 18) and 20). To finance the
acquisition of physical capital, each entrepreneur combines his net
worth with a loan from a bank, for which the entrepreneur must pay
an external finance premium (over the risk-free interest rate set
by the central bank) due to an agency problem. We follow
Christiano, Motto and Rostagno (2008) by assuming
that the debt contract between entrepreneurs and banks is written
in nominal terms (rather than real terms as in Bernanke, Gertler
and Gilchrist, 1999). Banks obtain funds to lend to
the entrepreneurs by issuing deposits to households at the interest
rate set by the central bank. By assuming perfect competition and
free entry among banks and that all bank portfolios are well
diversified (i.e., that each bank lends out to a continuum of
entrepreneurs, whose default risk is independently distributed), it
follows that banks make zero profits in each state of the economy
and that there is no credit risk to households associated with bank
deposits.5
rather than
directly from households. Entrepeneurs purchase capital from
competitive capital goods producers, with the latter employing the
same technology to transform investment goods into finished capital
goods as described by equations 18) and 20). To finance the
acquisition of physical capital, each entrepreneur combines his net
worth with a loan from a bank, for which the entrepreneur must pay
an external finance premium (over the risk-free interest rate set
by the central bank) due to an agency problem. We follow
Christiano, Motto and Rostagno (2008) by assuming
that the debt contract between entrepreneurs and banks is written
in nominal terms (rather than real terms as in Bernanke, Gertler
and Gilchrist, 1999). Banks obtain funds to lend to
the entrepreneurs by issuing deposits to households at the interest
rate set by the central bank. By assuming perfect competition and
free entry among banks and that all bank portfolios are well
diversified (i.e., that each bank lends out to a continuum of
entrepreneurs, whose default risk is independently distributed), it
follows that banks make zero profits in each state of the economy
and that there is no credit risk to households associated with bank
deposits.5
3. Solution Method and Calibration
To analyze the behavior of the model, we log-linearize the model's equations around the non-stochastic steady state. Nominal variables are rendered stationary by suitable transformations. To solve the unconstrained version of the model, we compute the reduced-form solution of the model for a given set of parameters using the numerical algorithm of Anderson and Moore (1985), which provides an efficient implementation of the solution method proposed by Blanchard and Kahn (1980). When we solve the model subject to the non-linear monetary policy rule (23), we use the techniques described in Hebden, Lindé and Svensson (2009). An important feature of the Hebden, Lindé and Svensson algorithm is that the duration of the liquidity trap is endogenous, and is affected by shocks hitting the model economy.
The model is calibrated at a quarterly frequency. Structural
parameters are set at identical values for each of the two country
blocks, except for the parameter ![]() determining
population size (as discussed below), and the parameters
determining trade shares. We assume that the discount factor
determining
population size (as discussed below), and the parameters
determining trade shares. We assume that the discount factor
![]() , consistent with a steady-state
annualized real interest rate
, consistent with a steady-state
annualized real interest rate ![]() of 2
percent. By assuming that gross inflation
of 2
percent. By assuming that gross inflation ![]() (i.e. a net inflation of 2 percent in annualized
terms), the implied steady state nominal interest rate
(i.e. a net inflation of 2 percent in annualized
terms), the implied steady state nominal interest rate ![]() equals 0.01 at a quarterly
rate, and 4 percent at an annualized rate.
equals 0.01 at a quarterly
rate, and 4 percent at an annualized rate.
The utility functional parameter ![]() is set
equal to 2, while the parameter determining the degree of habit
persistence in consumption =0.8. We set
is set
equal to 2, while the parameter determining the degree of habit
persistence in consumption =0.8. We set ![]() , implying a Frisch elasticity of labor supply of 1/2,
which is roughly consistent with the evidence reported by Domeij
and Flodén (2006). The utility parameter
, implying a Frisch elasticity of labor supply of 1/2,
which is roughly consistent with the evidence reported by Domeij
and Flodén (2006). The utility parameter ![]() is set so that employment comprises one-third of the
household's time endowment, while the parameter
is set so that employment comprises one-third of the
household's time endowment, while the parameter ![]() on the subutility function for real balances is set
at an arbitrarily low value (given the separable specification,
variation in real balances has no impact on other variables). We
choose
on the subutility function for real balances is set
at an arbitrarily low value (given the separable specification,
variation in real balances has no impact on other variables). We
choose
![]() so that 75 percent of
households are Ricardian FL agents. This share implies that
consumption of HM households equals about 10 percent
of total consumption in steady state. The lower share of total
consumption reflects that HM households consume less on average
than FL households as they are assumed not to save and accumulate
any capital.
so that 75 percent of
households are Ricardian FL agents. This share implies that
consumption of HM households equals about 10 percent
of total consumption in steady state. The lower share of total
consumption reflects that HM households consume less on average
than FL households as they are assumed not to save and accumulate
any capital.
The depreciation rate of capital ![]() is set
at 0.025. (consistent with an annual depreciation rate of 10
percent). The parameter
is set
at 0.025. (consistent with an annual depreciation rate of 10
percent). The parameter ![]() in the CES production
function of the intermediate goods producers is set to -2. This implies an elasticity of substitution between capital
and labor,
in the CES production
function of the intermediate goods producers is set to -2. This implies an elasticity of substitution between capital
and labor,
![]() , of 1/2, somewhat below the
unity elasticity implied by the Cobb-Douglas specification. The
quasi-capital share parameter
, of 1/2, somewhat below the
unity elasticity implied by the Cobb-Douglas specification. The
quasi-capital share parameter ![]() -
together with the price markup parameter of
-
together with the price markup parameter of
![]() is chosen to imply a steady
state investment to output ratio of 20 percent. We set the cost of
adjusting investment parameter
is chosen to imply a steady
state investment to output ratio of 20 percent. We set the cost of
adjusting investment parameter ![]() , slightly
below the value estimated by Christiano, Eichenbaum and Evans
(2005).
, slightly
below the value estimated by Christiano, Eichenbaum and Evans
(2005).
The calibration of the parameters determining the financial
accelerator follows Bernanke, Gertler and Gilchrist (1999), and is identical across country blocks. In particular,
the monitoring cost, ![]() , expressed as a
proportion of entrepreneurs' total gross revenue, is set to
0.12. The default rate of entrepeneurs is
3 percent per year, and the variance of the
idiosyncratic productivity shocks to entrepreneurs is 0.28.
, expressed as a
proportion of entrepreneurs' total gross revenue, is set to
0.12. The default rate of entrepeneurs is
3 percent per year, and the variance of the
idiosyncratic productivity shocks to entrepreneurs is 0.28.
We maintain the assumption of a relatively flat Phillips curve
by setting the price contract duration parameter ![]() . We allow for some intrinsic persistence by
setting the price indexation parameter
. We allow for some intrinsic persistence by
setting the price indexation parameter
![]() . It bears emphasizing that
our choice of
. It bears emphasizing that
our choice of ![]() does not necessarily imply an
average price contract duration of 10 quarters.
Altig et al. (2010) show that even a model with a low
slope of the Phillips curve can be consistent with frequent price
reoptimization. Our choice of
does not necessarily imply an
average price contract duration of 10 quarters.
Altig et al. (2010) show that even a model with a low
slope of the Phillips curve can be consistent with frequent price
reoptimization. Our choice of ![]() implies a
Phillips curve slope of about 0.007. This is
somewhat lower than the median estimates of literature, which
cluster in the range of about 0.009-.014, but well within standard
confidence intervals provided by empirical studies (see e.g.
Adolfson et al (2005), Altig et al. (2010), Galí and Gertler (1999),
Galí, Gertler, and Ló pez-Salido (2001), Lindé (2005), and Smets and
Wouters (2003, 2007). As argued in
Erceg and Lindé (2010), a low slope of the
Phillips curve is consistent with the development during the recent
crisis where inflation and inflation expectations have fallen very
moderately despite large contractions in output.
implies a
Phillips curve slope of about 0.007. This is
somewhat lower than the median estimates of literature, which
cluster in the range of about 0.009-.014, but well within standard
confidence intervals provided by empirical studies (see e.g.
Adolfson et al (2005), Altig et al. (2010), Galí and Gertler (1999),
Galí, Gertler, and Ló pez-Salido (2001), Lindé (2005), and Smets and
Wouters (2003, 2007). As argued in
Erceg and Lindé (2010), a low slope of the
Phillips curve is consistent with the development during the recent
crisis where inflation and inflation expectations have fallen very
moderately despite large contractions in output.
Given strategic complementarities in wage-setting across
households, the wage markup influences the slope of the wage
Phillips curve. Our choices of a wage markup of ![]() = 1/3 and a wage contract
duration parameter of
= 1/3 and a wage contract
duration parameter of
![]() along with a wage indexation
parameter of
along with a wage indexation
parameter of
![]() - imply that wage inflation
is about as responsive to the wage markup as price inflation is to
the price markup.
- imply that wage inflation
is about as responsive to the wage markup as price inflation is to
the price markup.
The parameters pertaining to fiscal policy are set as follows.
The share of government spending of total expenditure is set equal
to 20 percent. The government debt to GDP ratio,
![]() , is set to 0.75, about
equal to the average level of debt in euro area countries at
end-2008. The lump-sum tax revenue to GDP ratio is set to a small
value of 0.02. Given that the capital tax
, is set to 0.75, about
equal to the average level of debt in euro area countries at
end-2008. The lump-sum tax revenue to GDP ratio is set to a small
value of 0.02. Given that the capital tax ![]() is set to zero, the government's intertemporal budget constraint
implies that the labor income tax rate
is set to zero, the government's intertemporal budget constraint
implies that the labor income tax rate ![]() equals 0.27 in steady state.
equals 0.27 in steady state.
Using Eurostat data for 2008, the average share of imports of
the South countries (of Greece, Ireland, Portugal, Italy, and
Spain) from the remaining countries of the euro area comprised
about 14 percent of GDP in 2008. This pins down the trade share
parameters ![]() and
and ![]() for our large South calibration under the
additional assumption that the import intensity of consumption is
equal to 3/4 that of investment. These South countries comprise
about 1/3 of euro area GDP, or are half as large as the North
countries, so that
for our large South calibration under the
additional assumption that the import intensity of consumption is
equal to 3/4 that of investment. These South countries comprise
about 1/3 of euro area GDP, or are half as large as the North
countries, so that ![]() . Given that trade
is balanced in steady state, this parameterization implies an
export and import share of the North countries of 7 percent of
GDP.
. Given that trade
is balanced in steady state, this parameterization implies an
export and import share of the North countries of 7 percent of
GDP.
Our small South calibration is based on data for the Greek
economy. The import share of the Greek economy from the rest of the
euro area is also around 14 percent, so that the trade parameters
![]() and
and ![]() remain unchanged across these calibrations; however, since Greece
only comprises about 2 percent of euro area GDP, we adjust
remain unchanged across these calibrations; however, since Greece
only comprises about 2 percent of euro area GDP, we adjust
![]() so that its trade share of the North
block is only about 0.3 percent.
so that its trade share of the North
block is only about 0.3 percent.
We assume that
![]() , consistent with a
long-run price elasticity of demand for imported consumption and
investment goods of 1.5. While this is higher than most empirical
estimates using macro data, the presence of adjustment costs
reduces the near-term relative price sensitivity. In particular, we
set the adjustment cost parameters
, consistent with a
long-run price elasticity of demand for imported consumption and
investment goods of 1.5. While this is higher than most empirical
estimates using macro data, the presence of adjustment costs
reduces the near-term relative price sensitivity. In particular, we
set the adjustment cost parameters
![]() =
=
![]() = 3, implying a half-life of
adjustment of about half a year. We choose a small value (0.00001)
for the financial intermediation cost
= 3, implying a half-life of
adjustment of about half a year. We choose a small value (0.00001)
for the financial intermediation cost ![]() ,
which is sufficient to ensure the model has a unique steady
state.
,
which is sufficient to ensure the model has a unique steady
state.
We set the parameters of the monetary rule so that
![]() ,
,
![]() , and
, and
![]() . Relative to the standard
Taylor rule, this rule is more aggressive in responding to
inflation, and incorporates considerable interest rate inertia;
these features seem a relevant characterization of ECB monetary
policy. For the tax rate reaction function, we choose
. Relative to the standard
Taylor rule, this rule is more aggressive in responding to
inflation, and incorporates considerable interest rate inertia;
these features seem a relevant characterization of ECB monetary
policy. For the tax rate reaction function, we choose ![]() ,
, ![]() ,
, ![]() . This benchmark tax rule is not very aggressive,
and has similar implications to adjustment via lump-sum taxesin the
short to medium-run.
. This benchmark tax rule is not very aggressive,
and has similar implications to adjustment via lump-sum taxesin the
short to medium-run.
4. Results
Given the nonlinear zero bound constraint, the effects of shocks depend on the perceived depth and duration of the underlying liquidity trap. Accordingly, we begin by using our model to generate initial macroeconomic conditions that roughly capture some features of the recent recession in the euro area, including a large decline in output relative to trend, and extended period of near-zero policy rates.
The solid lines in Figure 1 depict a "Euro area recession
scenario" under the benchmark calibration of our model when the
zero lower bound is imposed on the policy rule. The underlying
shocks are identical negative consumption taste shocks (![]() and
and
![]() ) to each country block.
The taste shocks are assumed to follow an AR(1) with persistence of
0.9, and since the parameterization is completely symmetric and we
make the assumption of producer currency pricing, the effects on
both the South and the North is completely symmetric. For
comparison purposes, we also include results in Figure 1 when
policy is not constrained by the zero lower bound.
) to each country block.
The taste shocks are assumed to follow an AR(1) with persistence of
0.9, and since the parameterization is completely symmetric and we
make the assumption of producer currency pricing, the effects on
both the South and the North is completely symmetric. For
comparison purposes, we also include results in Figure 1 when
policy is not constrained by the zero lower bound.
The shocks induce a sharp contraction in aggregate GDP of about 6 percent below steady state at its peak, compared with a 4 percent decline that would occur if policy was unconstrained by the zero bound. In the constrained case, policy rates fall quickly to their lower bound of zero, and remain at zero for eight quarters (in this figure, nominal variables are shown in levels to highlight the zero bound constraint on interest rates). Thus, given perfect foresight, agents expect the liquidity trap would last eight quarters in the absence of additional shocks. Inflation falls from its steady state level of 2 percent to a trough of -1 percent, and remains below zero for a sustained period.
4.1 Fiscal Consolidation in the South
We begin by assessing the impact of a front-loaded contraction in government spending in the South under the Small South calibration, which approximates the effects on a small open economy. The government spending shock follows an AR(1) with a persistence of 0.99 and is scaled to equal one percent of steady state GDP. The impulse response functions shown in Figure 2 are computed as the difference between this scenario which includes both the consumption taste shocks and government spending shock, and the previous scenario with only the taste shocks to each country (shown in Figure 1).
Under normal conditions in which monetary policy can react (labeled "currency union: normal"), the nearly permanent contraction in government spending has a substantial and highly persistent effect on the South's GDP. The South's output falls about 1 percent initially, consistent with an impact multiplier of about unity, and remains below baseline for a very prolonged period. The protracted output decline reflects that the monetary policy essentially leaves nominal interest rates unchanged in response to the South's output decline given its tiny weight in aggregate GDP (the policy rate falls only 1 basis point). With inflation falling, real interest rates rise in the short-run in the South. Output gradually recovers as private consumption is boosted through a positive wealth effect, the real exchange rate gradually depreciates as prices fall, and the real interest rate declines (reflecting that prices overshoot, and eventually start rising again).
It is useful to contrast the protracted output decline under a currency union with the alternative in which the South had an independent monetary policy and flexible exchange rate, again assuming that monetary policy can react (labeled "flexible exchange rate: normal"). In this case, interest rates would drop immediately, and the real exchange rate would depreciate, substantially reducing the persistence of the GDP contraction in the South. For example, the South's GDP is only 0.3 percent below baseline after 2 years, compared with 0.7 percent in the currency union case. The faster output rebound also allows the spending reduction to translate into a much more rapid decline in the government debt/GDP ratio.
The contraction in the South under a currency union is invariant to whether monetary policy is constrained or unconstrained by the ZLB (as seen by comparing the two cases shown in Figure 2). As discussed below, this reflects that shocks to a small country have a tiny effect on the potential real interest rate in the currency union as a whole, and do not affect the duration of the liquidity trap in the union.
Figure 3 presents a parallel analysis for the case of the Large South calibration. Under "normal conditions" in which monetary policy is unconstrained, the output response under a currency union is much less persistent than for the Small South calibration analyzed in Figure 2. This reflects that the monetary authority reduces interest rates considerably in the case of a concerted fiscal contraction. The speed of the recovery in GDP still isn't as rapid as would occur if the Large South's exchange rate was flexible, reflecting that interest rates fall by somewhat less, and the real exchange rate depreciates gradually rather than immediately (comparing the "flexible exchange rate: normal" with the "currency union: normal" calibrations); nevertheless, the disparity is relatively modest. Thus, as familiar from a standard optimal currency area rationale, a small country such as Portugal would be better off if it cut spending at the same time as Italy and Belgium. Moreover, GDP in the North actually rises, as the stimulative effect of lower interest rates outweighs the contractionary impact of the fall in exports to the South; and the government debt/GDP ratio falls a bit.
We now turn to the case in which the currency union is constrained from reducing interest rates due to the zero lower bound on nominal interest rates ("currency union: ZLB" in Figure 3). In this case, the South's GDP shows a much more protracted contraction than under normal times, with output remaining close to 1 percent below baseline for six quarters. The prolonged output decline reflects that the sluggish reaction of policy rates causes real interest rate to rise for a period of about two years.
GDP in the North contracts by 0.3 percent at trough, in striking contrast to the case in which monetary policy adjusts. The GDP decline in the North reflects that the fall in the North's real net exports to the South is reinforced by a rise in the North's real interest rates. The highly persistent decline in the North's GDP induces the North's government debt/GDP ratio to rise by almost 0.7 percent of GDP after two years. Our finding that fiscal multipliers are enhanced in a liquidity trap relative to normal conditions is consistent with the empirical VAR panel evidence provided by Corsetti, Müller and Meier (2010), who argues that fiscal contractions have more negative effects on output in crisis periods.
Figure 4 considers the effects of a government spending contraction of progressively larger magnitude in the South, ranging from 1 percent of the South's GDP (as in Figure 3) to 3 percent. The response of both the South and North's GDP increases in a nonlinear fashion with the size of the spending cuts, implying an increasing marginal impact. Thus, cutting reducing South spending by 2 percent of GDP reduces South output by a little more than 2 percent, and North output by about 1 percent; by an additional spending cut of 1 percent of GDP has almost as large a depressing impact on both the South's and North's output.
The increasing marginal impact parallels the analysis of a fiscal expansion in the closed economy analysis of Erceg and Linde (2010), except with the reverse sign. In the Erceg and Linde analysis, a fiscal expansion has a diminished marginal impact on output as the size of the expansion grows larger. Because fiscal stimulus shrinks the duration of the liquidity trap, monetary policy responds relatively more quickly to any incremental stimulus. In the simulations shown in Figure 4, the 3 percent fiscal contraction in the South extends the duration of the currency union's liquidity trap by two quarters, compared with the eight quarter trap for a 1 percent of GDP consolidation. This increases the multiplier, in part because the expected inflation response is sensitive to the duration of the trap (falling more as the trap lengthens).
Given that the 3 percent of GDP output decline in the South translates into a 1 percent decline in government spending as a fraction of currency union output, the implied multiplier for the union as a whole is about 2 (as seen from the aggregate currency union output response in Figure 4). Because the North comprises 2/3 of currency union output, the contraction in the North actually accounts for almost half of the aggregate output decline in the currency union.
The more adverse impact on output means that it is difficult for a fiscal consolidation to achieve progress in reducing the government debt. Figure 4 shows that the South's government debt actually rises by more at horizons of up to 1-1/2 years as spending is cut by larger amounts. Government debt in the North countries rises by almost 3 percent of GDP. Progress in reducing government debt only becomes apparent once monetary policy has latitude to reduce interest rates.
There is clearly a high value in a discretionary fiscal expansion in the North to help offset fiscal contraction in the South. Even so, it is possible that fiscal policy in the North may be aimed at keeping the government debt stock from expanding through balanced budget rules that adjust spending or taxes very aggressively to keep debt near its target. In Figure 5, we proxy for such a rule by examining the impact of a spending cut in the North block that is similar in magnitude to that in the South. This policy turns out to be counterproductive by further reducing currency union output, and by extending the period over which government debt rises (due to the fiscal consolidation in North and South) to more than 2 years.
4.2 Financial Shock in the South
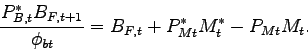
We next consider the effects of a financial shock in the South. In our log-linearized framework, the financial accelerator mechanism in our model implies that the corporate finance premium in each country depends on the degree of leverage of the non-financial corporate sector, plus an exogenous disturbance. Thus, for the South:
| (33) |
where
![]() is the spread of the
nominal corporate bond rate over the policy rate,
is the spread of the
nominal corporate bond rate over the policy rate, ![]() is the leverage ratio (the ratio of the value of the
capital stock to the net worth of entrepreneurs), and
is the leverage ratio (the ratio of the value of the
capital stock to the net worth of entrepreneurs), and
![]() is an exogenous financial
spread shock. A similar relation holds for the North.
is an exogenous financial
spread shock. A similar relation holds for the North.
To examine the implications of the zero bound constraint, we construct initial conditions for both the "Small South" and "Large South" calibrations that produce identical macroeconomic effects as those depicted in Figure 1. In particular, the same adverse taste shock in each country causes output to decline substantially, and generates a liquidity trap lasting 8 quarters.
Figure 6 shows the effects of a financial shock in the South that causes financial spreads to rise persistently (i.e., with a root of 0.99) by around 50 basis points under our "Small South" calibration. The spread shock reduces the South's output by boosting the cost of capital. Under normal conditions in which monetary policy is unconstrained, output falls more sharply under a currency union (dash-dotted red lines) than it would if the South had an independent monetary policy (solid black lines). In the context of a currency union, it makes little difference whether the ZLB binds monetary policy given the small size of the South.
Figure 7 shows the effects of the same-sized financial shock in the South under our "Large South" calibration. In a currency union unconstrained by the ZLB, the financial shock depresses the South's output much less sharply than in the small open economy case, reflecting a much larger induced decline in policy rates. The more accommodative policy stance causes output in the North to expand slightly.
Paralleling our previous analysis of the fiscal shock, the effects on the South are dramatically different when monetary policy is constrained by the ZLB (dashed green lines). The South's output contracts more persistently and by a greater degree, and the spillover effect to the North are sizeable. In particular, given that the North is twice the size of the South, almost half of the decline in currency union output is attributable to the fall in the North's output. The output declines result in a rise in government debt in North and South that is substantially larger than in normal times.
Figure 8 analyzes financial shocks to the Large South of varying size, ranging from the 50 basis point increase (from Figure 7) to 150 basis points. The effects on output in both the South and North increase in a nonlinear manner, again reflecting that large shocks extend the duration over which monetary policy is constrained to respond to the ZLB. The 150 basis point shock raises the South's government debt by 6 percentage points after two years, and by almost half as much in the North.
Finally, Figure 9 examines the case in which a 50 basis point rise in spreads in the Large South is amplified by fiscal consolidation in the South. Given the ZLB, the fiscal consolidation in the South - equal to 1 percent of GDP - results in a much more sizeable output decline in both South and North (the red dotted lines) than if fiscal policy simply followed the non-aggressive rule implied by our benchmark calibration (the solid black lines). Moreover, in addition to restraining aggregate currency union output, fiscal consolidation boosts government debt in both the South and North for roughly two years relative to the case of no (additional) fiscal response.
5. Sensitivity Analysis
In this section, we examine the robustness of the results for alternative parameterizations of the model. We begin by showing that the effects of a government spending cut on output in a liquidity trap can be mitigated considerably by an aggressive tax rule that rapidly reduces labor tax rates. Second, we show that government spending cuts have much smaller contractionary effects on output in a liquidity trap when they are implemented gradually, and that gradual cuts induce a faster improvement in the government debt/GDP ratio than a front-loaded spending reduction. While these simulations show how the contractionary effects of government spending cuts on output may be mitigated, we next explore conditions suggested by the literature on "expansionary fiscal consolidations" following Giavazzi and Pagano (1990) and Alesina and Perotti (1995, 1997). In particular, we show that a fiscal cut can expand output even in the near-term for a country facing unfavorable initial borrowing conditions provided that interest rate spreads are sufficiently responsive to lower future expected debt and deficits levels. Finally, we conclude by examining the sensitivity of our results to a key parameter determining the share of hand-to-mouth households.
5.1 Labor-income tax rule
Under our benchmark calibration, the labor-income tax rule is
largely unresponsive to the evolution to government debt and
deficits. We now assess the effects of a government spending cut
under a more aggressive tax rule with coefficients ![]() and
and ![]() that are ten times as
high in the benchmark calibration (i.e. we set
that are ten times as
high in the benchmark calibration (i.e. we set ![]() and
and ![]() in equation 26). A more
aggressive tax rule in normal times would cushion the output
effects of fiscal contraction, as the more rapid fall in taxes
eventually raises potential output by boosting labor supply and
capital spending. The results of Eggertsson (2009), however, suggest that such effects might not obtain
when the economy is constrained by the ZLB. In particular,
Eggertsson (2009) shows in the context of a stylized New Keynesian
model that a tax cut actually decreases output when the economy is
in a liquidity trap.
in equation 26). A more
aggressive tax rule in normal times would cushion the output
effects of fiscal contraction, as the more rapid fall in taxes
eventually raises potential output by boosting labor supply and
capital spending. The results of Eggertsson (2009), however, suggest that such effects might not obtain
when the economy is constrained by the ZLB. In particular,
Eggertsson (2009) shows in the context of a stylized New Keynesian
model that a tax cut actually decreases output when the economy is
in a liquidity trap.
Figure 10 compares the effects of a persistent cut in government consumption in the large South calibration of the model under both the benchmark ("unresponsive") and more aggressive labor income tax rule (under normal conditions and for an 8 quarter liquidity trap). As expected, the more aggressive tax rule damps the fall in the South's GDP under normal conditions. However, the disparity between the tax rules is much larger when the economy is in a liquidity trap, with the fall in the South's GDP only about half as large after 2-3 years under the aggressive rule as under our benchmark. The GDP response under the aggressive rule in a liquidity trap is in fact only a bit more negative than under normal conditions. This reflects that the promise of near-term tax cuts provides a strong impetus to domestic demand, and mitigates the sharp fall in the potential real rate that occurs in response to an immediate spending cut. As a result, monetary policy would not cut interest rates much even if unconstrained, so the ZLB constraint has a comparatively small impact. The smaller output effects on the South under the aggressive tax rule imply much smaller spillover effects to the North.
Clearly, aggressive tax adjustment implies less longer-term improvement in government debt, and thus may not be an appealing option to governments which aim to markedly reduce the longer-run debt stock. Even so, our analysis shows that policies which reduce government spending in a liquidity trap can have much more modest effects on output when combined with aggressive tax-cutting. The main difference between our results and Eggertsson's is that the latter considers the effects of a front-loaded temporary tax cut in an environment without saving or investment possiblities. Because the tax cut has a positive front-loaded effect on potential output, it raises desired saving, and hence reduces the potential real interest rate (in contrast to our aggressive tax rule, which offsets some of the fall in the potential real interest rate arising from the spending decline). Given that the economy is in a liquidity trap, the lower potential real interest rate causes output to decline in Eggertsson's model: the larger gap between the actual real interest rate (which rises due to a fall in expected inflation) and the potential real interest rate more than offsets the stimulative effect of the tax cut on potential output.
5.2 Aggressiveness of spending cut
Figure 11 compares the effects of a gradual reduction in
government spending to our benchmark case in which government
spending is cut immediately. In the former case, the maximum
decline in spending - of 1 percent of GDP - occurs after about 5
years (the "gradual cut" case in the figure). This gradual
decline in spending is achieved by adjusting ![]() .and
.and ![]() in equation 24) to ensure that
the undiscounted net present value of the spending cut, i.e.
in equation 24) to ensure that
the undiscounted net present value of the spending cut, i.e.
![]() , equals the
spending cut under the benchmark calibration. The path of
government spending is in all cases assumed to be fully credible
upon announcement of the consolidation. We also examine the effects
of a concerted spending cut in all members of the currency union -
both North and South - in order to emphasize the crucial role of
the path of spending when monetary policy is constrained by the
ZLB.
, equals the
spending cut under the benchmark calibration. The path of
government spending is in all cases assumed to be fully credible
upon announcement of the consolidation. We also examine the effects
of a concerted spending cut in all members of the currency union -
both North and South - in order to emphasize the crucial role of
the path of spending when monetary policy is constrained by the
ZLB.
From Figure 11, it is clear that a more gradual spending cut induces a much slower improvement in the government debt to GDP ratio than a front-loaded cut in normal times. By contrast, the government debt/GDP ratio actually improves much more rapidly in the case of the gradual spending cut when the economy is in a liquidity trap! This rather startling implication reflects that the more gradual spending cut tends to greatly reduce the fall in the potential real interest rate that occurs in response to fiscal consolidation compared with the case of an immediate cut. Intuitively, the expectation that government spending will be low in the future helps crowd in private demand even holding the interest rate constant. Thus, because the central bank would not adjust interest rates very much even if unconstrained (the "gradual cut: normal" case), the output response in a liquidity trap isn't much different than in normal times. This contrasts sharply to the large differences in normal times and times of a liquidity trap for a front-loaded cut.
Our analysis of how a gradual spending cut mitigates effects on output and induces a quicker improvement in the government debt is essentially the "mirror image" of the results of Erceg and Lindé (2010) and Woodford (2010). These authors show how lags in implementing fiscal stimulus plans in a liquidity trap can markedly dampen the multiplier.
5.3 Endogeneous Risk Premium
In the benchmark calibration of the model, we assumed that
interest rates faced by the government and banks in South and North
were equal to the currency area interest rate set by the central
bank (notwithstanding a tiny difference to imply stationary
dynamics). To examine conditions under which fiscal consolidation
may be expansionary, we amend our model and instead assume that the
interest rate faced by the government and banks in the South equals
the interest rate set by the central bank plus a risk-spread that
depends positively on the government deficit and debt level. If we
let ![]() denote the interest rate in South,
we thus have
denote the interest rate in South,
we thus have
| (34) |
where we recall that ![]() is the end-of-period
is the end-of-period
![]() government debt level and
government debt level and ![]() the interest rate set by the central bank. The
specification in
(34) is motivated by the spread equation estimated by Laubach
(2010) for the Euro area, and captures the
idea that countries with high government deficits and debt levels
face higher spreads due to a higher risk of default. There is a
substantial empirical literature that has examined the question of
whether higher deficits and debt lead to increasing interest rates,
but it has provided at best mixed evidence in favor of positive
values of
the interest rate set by the central bank. The
specification in
(34) is motivated by the spread equation estimated by Laubach
(2010) for the Euro area, and captures the
idea that countries with high government deficits and debt levels
face higher spreads due to a higher risk of default. There is a
substantial empirical literature that has examined the question of
whether higher deficits and debt lead to increasing interest rates,
but it has provided at best mixed evidence in favor of positive
values of ![]() and
and ![]() , see
e.g. Evans (1985, 1987). However, the papers in this literature
have typically used data from both crisis periods and non-crisis
periods, and as argued by Laubach (2010) based on cross-country
evidence, this is likely to bias downward the estimates, as the
parameters tend to be close to zero in non-crisis periods and
positive in crisis periods only. As we are examining the effects of
fiscal consolidations in crisis periods, we entertain the
assumption that
, see
e.g. Evans (1985, 1987). However, the papers in this literature
have typically used data from both crisis periods and non-crisis
periods, and as argued by Laubach (2010) based on cross-country
evidence, this is likely to bias downward the estimates, as the
parameters tend to be close to zero in non-crisis periods and
positive in crisis periods only. As we are examining the effects of
fiscal consolidations in crisis periods, we entertain the
assumption that ![]() and
and ![]() are both positive.
are both positive.
As a tentative calibration, we set
![]() and
and
![]() , implying that a one percent
decline in government debt decreases the spread by 5
basis points, and that a one percent decline in the budget deficit
decreases the spread with 10 basis points. While these elasticities
are somewhat on the upper side relative to the evidence reported by
Laubach (2010), they are nevertheless useful to help gauge the
potential implications of this channel.
, implying that a one percent
decline in government debt decreases the spread by 5
basis points, and that a one percent decline in the budget deficit
decreases the spread with 10 basis points. While these elasticities
are somewhat on the upper side relative to the evidence reported by
Laubach (2010), they are nevertheless useful to help gauge the
potential implications of this channel.
In Figure 12, we report the results of this experiment. The
model where interest rates spreads for South is given by
(34) is referred to as "Endo Spread" in the model, and the benchmark
model is referred to as the "No Endo Spread". From the figure,
it is clear that the existence of strong risk spreads has the
potential of generating much more favorable effects on output and
government debt, even when the economy is in a deep liquidity trap.
Under our calibration for the endogenous risk spread, we find that
output in South expands after only a little more than a year, which
stands in sharp contrast to the model without the endogenous risk
premium in
(34)
which output in the South contracts for more than 5-years in
response to the same spending cut. The stark difference in results
is driven by the large and persistent decline in the spread on
government bonds in South,
![]() , which is visualized in the
lower right panel in Figure 12. The spread declines by more than
200 basis points, and the key parameter behind the persistent
decline is the
, which is visualized in the
lower right panel in Figure 12. The spread declines by more than
200 basis points, and the key parameter behind the persistent
decline is the ![]() , as this parameter implies
that the government spread will be closely tied to the persistent
decline in the government debt level.
, as this parameter implies
that the government spread will be closely tied to the persistent
decline in the government debt level.
5.4 Share of HM households
In Figure 13, we examine the sensitivity of our results to the
share of hand-to-mouth (HM) agents, considering both a cut in
government spending in the South alone, and a coordinated cut in
both North and South. In our model, a higher value of ![]() is crucial for generating a initial decline in
private consumption after a contraction in government spending in
normal times. Under the benchmark calibration of the model, we used
is crucial for generating a initial decline in
private consumption after a contraction in government spending in
normal times. Under the benchmark calibration of the model, we used
![]() so that 75
percent of households are Ricardian agents. Although not shown, our
benchmark calibration of
so that 75
percent of households are Ricardian agents. Although not shown, our
benchmark calibration of ![]() implies that the
model generates an initial decline in private consumption following
a contraction in government spending. In Figure 13, we consider
varying
implies that the
model generates an initial decline in private consumption following
a contraction in government spending. In Figure 13, we consider
varying ![]() between 0 and
0.50.
between 0 and
0.50.
![]() implies that consumption of
HM households equals about 21 percent of total
consumption (recalling that our benchmark calibration of
implies that consumption of
HM households equals about 21 percent of total
consumption (recalling that our benchmark calibration of
![]() implies a share of 0.11). As
seen from Figure 13, the results for a non-coordinated cut are not
very sensitive to the share of HM households, but the results for a
coordinated cut in government expenditures are rather sensitive to
the share of HM households. This is due to the fact that a larger
share of HM households in the model implies a larger decline in the
potential real interest rate in response to a coordinated spending
cut, which extends the duration of the liquidity trap considerably.
In particular, the liquidity trap is extended from 8
to 11 quarters, and the marginal impact of an
extra decrease in spending is hence larger (as in Figure 4) when
implies a share of 0.11). As
seen from Figure 13, the results for a non-coordinated cut are not
very sensitive to the share of HM households, but the results for a
coordinated cut in government expenditures are rather sensitive to
the share of HM households. This is due to the fact that a larger
share of HM households in the model implies a larger decline in the
potential real interest rate in response to a coordinated spending
cut, which extends the duration of the liquidity trap considerably.
In particular, the liquidity trap is extended from 8
to 11 quarters, and the marginal impact of an
extra decrease in spending is hence larger (as in Figure 4) when
![]() is higher. Erceg and Lindé
(2010) also provide a detailed discussion of how the presence of HM
agents affects the fiscal multiplier through this channel.
is higher. Erceg and Lindé
(2010) also provide a detailed discussion of how the presence of HM
agents affects the fiscal multiplier through this channel.
6. Conclusions
Our analysis has shown that the usual optimal currency area argument suggesting that the effects of shocks are mitigated to the extent that they are common across member states is not valid in an environment with monetary and fiscal constraints. Coincident cuts in government spending across a large subset of member states can have an especially large contractionary effect if they occur when the monetary authority is likely to be constrained by the ZLB for a substantial period, with large adverse spillover effects to other member states. Accordingly, there appear to be substantial benefits of delaying the implementation of consolidation to a period when monetary policy is no longer constrained for countries that can already borrow on favorable terms.
In a liquidity trap, progress in reducing government debt is actually faster when spending cuts are implemented gradually, reflecting a less contractionary near-term impact on output. Even so, our analysis does provide some rationale for aggressive and preemptive consolidation for countries that stand to reduce borrowing spreads markedly through rapid action.
The framework adopted in this paper has the limitation that the currency union as a whole is modeled as a closed economy. Thus, it does not allow for the possibility that the effects of fiscal consolidation could be assuaged by currency depreciation. Clearly, it would be of interest to extend our analysis to a three country framework. In addition, we solve our model under the assumption of perfect foresight, and thus abstract from the effects of future shock uncertainty on private sector behavior. A useful extension would involve incorporating the effects of shock uncertainty into the analysis along the lines suggested by Adam and Billi (2008).
References
Adam, Klaus, and Roberto M. Billi (2008), "Monetary Conservatism and Fiscal Policy", Journal of Monetary Economics 55(8), 1376-88.
Adolfson, Malin, Stefan Laséen, Jesper Lindé and Mattias Villani (2005), "The Role of Sticky Prices in an Open Economy DSGE Model: A Bayesian Investigation", Journal of the European Economic Association Papers and Proceedings 3(2-3), 444-457.
Alesina, Alberto and Robero Perotti (1995), "Fiscal Expansions and Adjustments in OECD Economies", Economic Policy 21, 207-247.
Alesina, Alberto and Robero Perotti (1997), "Fiscal Adjustments In OECD Countries: Composition and Macroeconomic Effects", International Monetary Fund Staff Papers 44, 210-248.
Altig, David, Christiano, Lawrence J., Eichenbaum, Martin and Jesper Lind é (2010), "Firm-Specific Capital, Nominal Rigidities and the Business Cycle", Federal Reserve Board International Finance Discussion Paper No. 990, Review of Economic Dynamics, forthcoming.
Anderson, Gary and George Moore (1985), "A Linear Algebraic Procedure for Solving Linear Perfect Foresight Models", Economics Letters 17(3), 247-252.
Bernanke, Ben, Gertler, Mark and Simon Gilchrist (1999), "The Financial Accelerator in a Quantitative Business Cycle Framework", in John B. Taylor and Michael Woodford (Eds.), Handbook of Macroeconomics, North-Holland Elsevier Science, New York.
Betts, Caroline and Michael B. Devereux (1996), "The Exchange Rate in a Model of Pricing-to-Market", European Economic Review 40, 1007-1021.
Blanchard, Olivier and Charles Kahn (1980), "The Solution of Linear Difference Models under Rational Expectations", Econometrica 48, 1305-1311.
Bodenstein, Martin, Erceg, Christopher J. and Luca Guerrieri (2009), "The effects of foreign shocks when interest rates are at zero," International Finance Discussion Papers 983, Board of Governors of the Federal Reserve System.
Calvo, Guillermo (1983), "Staggered Prices in a Utility Maximizing Framework", Journal of Monetary Economics 12, 383-98.
Christiano, Lawrence, Martin Eichenbaum and Charles Evans (2005), "Nominal Rigidities and the Dynamic Effects of a Shock to Monetary Policy", Journal of Political Economy 113(1), 1-45.
Christiano, Lawrence, Martin Eichenbaum and Sergio Rebelo (2009), "When is the Government Spending Multiplier Large?" NBER Working Paper Series No. 15394.
Christiano, Lawrence, Motto, Roberto and Massimo Rostagno (2008), "Shocks, Structures or Monetary Policies? The Euro Area and the US After 2001", Journal of Economic Dynamics and Control 32(8), 2476-2506.
Christiano, Lawrence, Trabandt, Mathias and Karl Walentin (2007), "Introducing Financial Frictions and Unemployment into a Small Open Economy Model", Sveriges Riksbank Working Paper Series No. 214.
Cogan, John F., Cwik, Tobias, Taylor, John B. and Volker Wieland (2010), "New Keynesian versus Old Keynesian Government Spending Multipliers", Journal of Economic Dynamics and Control 34, 281-95.
Corsetti, Giancarlo, Müller, Gernot and Andre Meier, "When, Where and How Does Fiscal Stimulus Work?", mimeo, European University Institute, May 2010.
Davig, Troy and Eric M. Leeper (2009), "Monetary-Fiscal Interactions and Fiscal Stimulus" Manuscript, Indiana University.
Domeij, David and Martin Flodén (2006), "The Labor-Supply Elasticity and Borrowing Constraints: Why Estimates are Biased", Review of Economic Dynamics 9(1), 242-262.
Eggertsson, Gauti and Michael Woodford (2003), "The Zero Interest-Rate Bound and Optimal Monetary Policy", Brookings Papers on Economic Activity 1, 139-211.
Eggertsson, Gauti (2008), "Great Expectations and the End of the Depression", American Economic Review 98(4), 1476-1516.
Eggertsson, Gauti (2009), "What Fiscal Policy Is Effective at Zero Interest Rates?", Federal Reserve Bank of New York Staff Report No. 402.
Erceg, Christopher J., Guerrieri, Luca and Christopher Gust (2006), "SIGMA: A New Open Economy Model for Policy Analysis", Journal of International Central Banking 2(1), 1-50.
Erceg, Christopher J. and Jesper Lindé (2010), "Is There a Fiscal Free Lunch in a Liquidity Trap?," CEPR Discussion Paper Series No. 7624.
Evans, Paul (1985), "Do Large Deficits Produce High Interest Rates", American Economic Review 74, 68-87.
Evans, Paul (1987), "Interest Rates and Expected Future Budget Deficits in the United States", Journal of Political Economy 95, 34-58.
Galí, Jordi and Mark (1999), "Inflation Dynamics: A Structural Econometric Analysis", Journal of Monetary Economics 44, 195-220.
Galí, Jordi, Gertler, Mark and David López-Salido (2001), "European Inflation Dynamics", European Economic Review 45, 1237-70.
Galí, Jordi, López-Salido, David and Javier Vallés (2007), "Understanding the Effects of Government Spending on Consumption", Journal of the European Economic Association 5(1), 227-270.
Giavazzi, Francesco and Marco Pagano (1990), "Can Severe Fiscal Contractions Be Expansionary? Tales of Two Small European Countries", NBER Macroeconomics Annual 5, 75-122.
Hebden, James, Lindé, Jesper and Lars E.O. Svensson (2009), "Optimal Monetary Policy in the Hybrid New Keynesian Model under the Zero Lower Bound Constraint", mimeo, Federal Reserve Board and Sveriges Riksbank.
Laubach, Thomas (2010), "Fiscal Policy and Interest Rates: The Role of Sovereign Default Risk", paper prepared for the NBER's ISOM conference, Amsterdam, June 2010.
Lindé, Jesper (2005), "Estimating New Keynesian Phillips Curves: A Full Information Maximum Likelihood Approach", Journal of Monetary Economics 52(6), 1135-49.
Smets, Frank and Raf Wouters (2003), "An Estimated Stochastic Dynamic General Equilibrium Model of the Euro Area", Journal of the European Economic Association 1(5), 1123-1175.
Smets, Frank and Raf Wouters (2007), "Shocks and Frictions in US Business Cycles: A Bayesian DSGE Approach", American Economic Review 97(3), 586-606.
Turnovsky, Stephen J. (1985), "Domestic and Foreign Disturbances in an Optimizing Model of Exchange-Rate Determination", Journal of International Money and Finance 4(1), 151-71.
Woodford, Michael, 2003, Interest and Prices, Princeton: Princeton University Press.
Woodford, Michael, 2010, "Some Analytics of the Government Spending Multiplier", CEPR Discussion Paper No. 7704.
Yun, Tack (1996), "Nominal Price Rigidity, Money Supply Endogeneity, and Business Cycles", Journal of Monetary Economics 37, 345-370.
Figure 1. Baseline Scenario When Monetary Policy is Unconstrained and Subject to the Zero Lower Bound
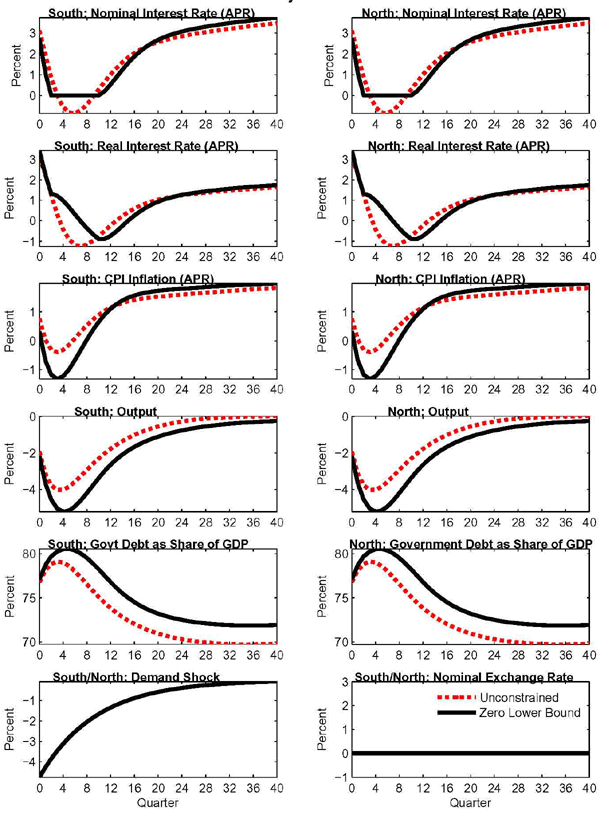
Data for Figure 1 - Unconstrained
| Quarter | South: Nominal Interest Rate (annualised, in percentage points) | South: Real Interest Rate (annualised, in percentage points) | South: CPI Inflation (annualised, in percentage points) | South: Output (percent) | South: Govt Debt (Share of GDP, in percentage points) | South: Demand Shock (percent) | North: Nominal Interest Rate (annualised, in percentage points) | North: Real Interest Rate (annualised, in percentage points) | North: CPI Inflation (annualised, in percentage points) | North: Output (percent) | North: Govt Debt (Share of GDP, in percentage points) | North: Nominal Exchange Rate (percent) |
|---|---|---|---|---|---|---|---|---|---|---|---|---|
| 0 | 3.12 | 3.08 | 0.77 | -1.92 | 76.80 | -4.75 | 3.12 | 3.08 | 0.77 | -1.92 | 76.80 | 0.00 |
| 1 | 1.97 | 2.27 | 0.04 | -3.12 | 78.10 | -4.28 | 1.97 | 2.27 | 0.04 | -3.12 | 78.10 | 0.00 |
| 2 | 0.87 | 1.26 | -0.30 | -3.77 | 78.86 | -3.85 | 0.87 | 1.26 | -0.30 | -3.77 | 78.86 | 0.00 |
| 3 | 0.00 | 0.31 | -0.39 | -4.03 | 79.13 | -3.46 | 0.00 | 0.31 | -0.39 | -4.03 | 79.13 | 0.00 |
| 4 | -0.56 | -0.43 | -0.31 | -4.02 | 79.01 | -3.12 | -0.56 | -0.43 | -0.31 | -4.02 | 79.01 | 0.00 |
| 5 | -0.83 | -0.92 | -0.13 | -3.85 | 78.61 | -2.80 | -0.83 | -0.92 | -0.13 | -3.85 | 78.61 | 0.00 |
| 6 | -0.86 | -1.18 | 0.09 | -3.58 | 78.01 | -2.52 | -0.86 | -1.18 | 0.09 | -3.58 | 78.01 | 0.00 |
| 7 | -0.71 | -1.24 | 0.32 | -3.26 | 77.31 | -2.27 | -0.71 | -1.24 | 0.32 | -3.26 | 77.31 | 0.00 |
| 8 | -0.43 | -1.16 | 0.54 | -2.93 | 76.56 | -2.04 | -0.43 | -1.16 | 0.54 | -2.93 | 76.56 | 0.00 |
| 9 | -0.08 | -0.98 | 0.73 | -2.60 | 75.81 | -1.84 | -0.08 | -0.98 | 0.73 | -2.60 | 75.81 | 0.00 |
| 10 | 0.29 | -0.75 | 0.90 | -2.30 | 75.10 | -1.66 | 0.29 | -0.75 | 0.90 | -2.30 | 75.10 | 0.00 |
| 11 | 0.66 | -0.49 | 1.04 | -2.02 | 74.44 | -1.49 | 0.66 | -0.49 | 1.04 | -2.02 | 74.44 | 0.00 |
| 12 | 1.01 | -0.23 | 1.15 | -1.76 | 73.84 | -1.34 | 1.01 | -0.23 | 1.15 | -1.76 | 73.84 | 0.00 |
| 13 | 1.33 | 0.01 | 1.24 | -1.54 | 73.30 | -1.21 | 1.33 | 0.01 | 1.24 | -1.54 | 73.30 | 0.00 |
| 14 | 1.60 | 0.24 | 1.31 | -1.34 | 72.82 | -1.09 | 1.60 | 0.24 | 1.31 | -1.34 | 72.82 | 0.00 |
| 15 | 1.84 | 0.43 | 1.37 | -1.16 | 72.40 | -0.98 | 1.84 | 0.43 | 1.37 | -1.16 | 72.40 | 0.00 |
| 16 | 2.04 | 0.60 | 1.41 | -1.00 | 72.03 | -0.88 | 2.04 | 0.60 | 1.41 | -1.00 | 72.03 | 0.00 |
| 17 | 2.21 | 0.74 | 1.45 | -0.86 | 71.71 | -0.79 | 2.21 | 0.74 | 1.45 | -0.86 | 71.71 | 0.00 |
| 18 | 2.35 | 0.85 | 1.48 | -0.74 | 71.43 | -0.71 | 2.35 | 0.85 | 1.48 | -0.74 | 71.43 | 0.00 |
| 19 | 2.47 | 0.95 | 1.50 | -0.63 | 71.18 | -0.64 | 2.47 | 0.95 | 1.50 | -0.63 | 71.18 | 0.00 |
| 20 | 2.57 | 1.03 | 1.52 | -0.54 | 70.96 | -0.58 | 2.57 | 1.03 | 1.52 | -0.54 | 70.96 | 0.00 |
| 21 | 2.66 | 1.10 | 1.54 | -0.45 | 70.77 | -0.52 | 2.66 | 1.10 | 1.54 | -0.45 | 70.77 | 0.00 |
| 22 | 2.73 | 1.15 | 1.56 | -0.38 | 70.60 | -0.47 | 2.73 | 1.15 | 1.56 | -0.38 | 70.60 | 0.00 |
| 23 | 2.80 | 1.20 | 1.58 | -0.31 | 70.45 | -0.42 | 2.80 | 1.20 | 1.58 | -0.31 | 70.45 | 0.00 |
| 24 | 2.85 | 1.24 | 1.60 | -0.26 | 70.32 | -0.38 | 2.85 | 1.24 | 1.60 | -0.26 | 70.32 | 0.00 |
| 25 | 2.91 | 1.28 | 1.61 | -0.21 | 70.20 | -0.34 | 2.91 | 1.28 | 1.61 | -0.21 | 70.20 | 0.00 |
| 26 | 2.96 | 1.31 | 1.63 | -0.17 | 70.10 | -0.31 | 2.96 | 1.31 | 1.63 | -0.17 | 70.10 | 0.00 |
| 27 | 3.00 | 1.34 | 1.65 | -0.13 | 70.02 | -0.28 | 3.00 | 1.34 | 1.65 | -0.13 | 70.02 | 0.00 |
| 28 | 3.05 | 1.37 | 1.66 | -0.10 | 69.94 | -0.25 | 3.05 | 1.37 | 1.66 | -0.10 | 69.94 | 0.00 |
| 29 | 3.09 | 1.40 | 1.68 | -0.08 | 69.88 | -0.22 | 3.09 | 1.40 | 1.68 | -0.08 | 69.88 | 0.00 |
| 30 | 3.13 | 1.42 | 1.69 | -0.06 | 69.83 | -0.20 | 3.13 | 1.42 | 1.69 | -0.06 | 69.83 | 0.00 |
| 31 | 3.17 | 1.45 | 1.71 | -0.04 | 69.79 | -0.18 | 3.17 | 1.45 | 1.71 | -0.04 | 69.79 | 0.00 |
| 32 | 3.21 | 1.47 | 1.72 | -0.02 | 69.76 | -0.16 | 3.21 | 1.47 | 1.72 | -0.02 | 69.76 | 0.00 |
| 33 | 3.24 | 1.49 | 1.74 | -0.01 | 69.74 | -0.15 | 3.24 | 1.49 | 1.74 | -0.01 | 69.74 | 0.00 |
| 34 | 3.28 | 1.52 | 1.75 | 0.00 | 69.73 | -0.13 | 3.28 | 1.52 | 1.75 | 0.00 | 69.73 | 0.00 |
| 35 | 3.32 | 1.54 | 1.77 | 0.01 | 69.72 | -0.12 | 3.32 | 1.54 | 1.77 | 0.01 | 69.72 | 0.00 |
| 36 | 3.35 | 1.56 | 1.78 | 0.02 | 69.73 | -0.11 | 3.35 | 1.56 | 1.78 | 0.02 | 69.73 | 0.00 |
| 37 | 3.38 | 1.58 | 1.79 | 0.02 | 69.74 | -0.10 | 3.38 | 1.58 | 1.79 | 0.02 | 69.74 | 0.00 |
| 38 | 3.42 | 1.60 | 1.81 | 0.03 | 69.75 | -0.09 | 3.42 | 1.60 | 1.81 | 0.03 | 69.75 | 0.00 |
| 39 | 3.45 | 1.62 | 1.82 | 0.03 | 69.77 | -0.08 | 3.45 | 1.62 | 1.82 | 0.03 | 69.77 | 0.00 |
| 40 | 3.48 | 1.64 | 1.83 | 0.04 | 69.80 | -0.07 | 3.48 | 1.64 | 1.83 | 0.04 | 69.80 | 0.00 |
Data for Figure 1 - Zero Lower Bound
| Quarter | South: Nominal Interest Rate (annualised, in percentage points) | South: Real Interest Rate (annualised, in percentage points) | South: CPI Inflation (annualised, in percentage points) | South: Output (percent) | South: Govt Debt (Share of GDP, in percentage points) | South: Demand Shock (percent) | North: Nominal Interest Rate (annualised, in percentage points) | North: Real Interest Rate (annualised, in percentage points) | North: CPI Inflation (annualised, in percentage points) | North: Output (percent) | North: Govt Debt (Share of GDP, in percentage points) | North: Nominal Exchange Rate (percent) |
|---|---|---|---|---|---|---|---|---|---|---|---|---|
| 0 | 2.76 | 3.43 | 0.33 | -2.16 | 77.08 | -4.75 | 2.76 | 3.43 | 0.33 | -2.16 | 77.08 | 0.00 |
| 1 | 1.10 | 2.26 | -0.67 | -3.65 | 78.70 | -4.28 | 1.10 | 2.26 | -0.67 | -3.65 | 78.70 | 0.00 |
| 2 | 0.00 | 1.31 | -1.17 | -4.57 | 79.71 | -3.85 | 0.00 | 1.31 | -1.17 | -4.57 | 79.71 | 0.00 |
| 3 | 0.00 | 1.22 | -1.31 | -5.06 | 80.25 | -3.46 | 0.00 | 1.22 | -1.31 | -5.06 | 80.25 | 0.00 |
| 4 | 0.00 | 0.98 | -1.22 | -5.23 | 80.52 | -3.12 | 0.00 | 0.98 | -1.22 | -5.23 | 80.52 | 0.00 |
| 5 | 0.00 | 0.66 | -0.98 | -5.17 | 80.55 | -2.80 | 0.00 | 0.66 | -0.98 | -5.17 | 80.55 | 0.00 |
| 6 | 0.00 | 0.31 | -0.66 | -4.94 | 80.38 | -2.52 | 0.00 | 0.31 | -0.66 | -4.94 | 80.38 | 0.00 |
| 7 | 0.00 | -0.04 | -0.31 | -4.60 | 80.02 | -2.27 | 0.00 | -0.04 | -0.31 | -4.60 | 80.02 | 0.00 |
| 8 | 0.00 | -0.37 | 0.04 | -4.20 | 79.52 | -2.04 | 0.00 | -0.37 | 0.04 | -4.20 | 79.52 | 0.00 |
| 9 | 0.00 | -0.66 | 0.37 | -3.78 | 78.91 | -1.84 | 0.00 | -0.66 | 0.37 | -3.78 | 78.91 | 0.00 |
| 10 | 0.00 | -0.90 | 0.66 | -3.37 | 78.23 | -1.66 | 0.00 | -0.90 | 0.66 | -3.37 | 78.23 | 0.00 |
| 11 | 0.21 | -0.89 | 0.90 | -2.99 | 77.50 | -1.49 | 0.21 | -0.89 | 0.90 | -2.99 | 77.50 | 0.00 |
| 12 | 0.53 | -0.74 | 1.10 | -2.64 | 76.78 | -1.34 | 0.53 | -0.74 | 1.10 | -2.64 | 76.78 | 0.00 |
| 13 | 0.89 | -0.51 | 1.27 | -2.34 | 76.12 | -1.21 | 0.89 | -0.51 | 1.27 | -2.34 | 76.12 | 0.00 |
| 14 | 1.24 | -0.25 | 1.39 | -2.08 | 75.51 | -1.09 | 1.24 | -0.25 | 1.39 | -2.08 | 75.51 | 0.00 |
| 15 | 1.58 | 0.01 | 1.49 | -1.85 | 74.98 | -0.98 | 1.58 | 0.01 | 1.49 | -1.85 | 74.98 | 0.00 |
| 16 | 1.87 | 0.25 | 1.57 | -1.66 | 74.51 | -0.88 | 1.87 | 0.25 | 1.57 | -1.66 | 74.51 | 0.00 |
| 17 | 2.13 | 0.47 | 1.62 | -1.49 | 74.11 | -0.79 | 2.13 | 0.47 | 1.62 | -1.49 | 74.11 | 0.00 |
| 18 | 2.35 | 0.65 | 1.67 | -1.34 | 73.77 | -0.71 | 2.35 | 0.65 | 1.67 | -1.34 | 73.77 | 0.00 |
| 19 | 2.53 | 0.80 | 1.70 | -1.21 | 73.47 | -0.64 | 2.53 | 0.80 | 1.70 | -1.21 | 73.47 | 0.00 |
| 20 | 2.68 | 0.93 | 1.73 | -1.10 | 73.22 | -0.58 | 2.68 | 0.93 | 1.73 | -1.10 | 73.22 | 0.00 |
| 21 | 2.80 | 1.04 | 1.75 | -0.99 | 73.00 | -0.52 | 2.80 | 1.04 | 1.75 | -0.99 | 73.00 | 0.00 |
| 22 | 2.91 | 1.12 | 1.77 | -0.90 | 72.81 | -0.47 | 2.91 | 1.12 | 1.77 | -0.90 | 72.81 | 0.00 |
| 23 | 3.00 | 1.20 | 1.78 | -0.82 | 72.64 | -0.42 | 3.00 | 1.20 | 1.78 | -0.82 | 72.64 | 0.00 |
| 24 | 3.07 | 1.26 | 1.80 | -0.75 | 72.50 | -0.38 | 3.07 | 1.26 | 1.80 | -0.75 | 72.50 | 0.00 |
| 25 | 3.14 | 1.31 | 1.81 | -0.69 | 72.38 | -0.34 | 3.14 | 1.31 | 1.81 | -0.69 | 72.38 | 0.00 |
| 26 | 3.20 | 1.36 | 1.83 | -0.63 | 72.27 | -0.31 | 3.20 | 1.36 | 1.83 | -0.63 | 72.27 | 0.00 |
| 27 | 3.26 | 1.40 | 1.84 | -0.58 | 72.18 | -0.28 | 3.26 | 1.40 | 1.84 | -0.58 | 72.18 | 0.00 |
| 28 | 3.31 | 1.44 | 1.86 | -0.53 | 72.11 | -0.25 | 3.31 | 1.44 | 1.86 | -0.53 | 72.11 | 0.00 |
| 29 | 3.36 | 1.47 | 1.87 | -0.49 | 72.04 | -0.22 | 3.36 | 1.47 | 1.87 | -0.49 | 72.04 | 0.00 |
| 30 | 3.40 | 1.51 | 1.88 | -0.45 | 71.99 | -0.20 | 3.40 | 1.51 | 1.88 | -0.45 | 71.99 | 0.00 |
| 31 | 3.44 | 1.54 | 1.89 | -0.42 | 71.95 | -0.18 | 3.44 | 1.54 | 1.89 | -0.42 | 71.95 | 0.00 |
| 32 | 3.48 | 1.56 | 1.91 | -0.39 | 71.92 | -0.16 | 3.48 | 1.56 | 1.91 | -0.39 | 71.92 | 0.00 |
| 33 | 3.52 | 1.59 | 1.92 | -0.36 | 71.89 | -0.15 | 3.52 | 1.59 | 1.92 | -0.36 | 71.89 | 0.00 |
| 34 | 3.56 | 1.62 | 1.93 | -0.34 | 71.88 | -0.13 | 3.56 | 1.62 | 1.93 | -0.34 | 71.88 | 0.00 |
| 35 | 3.59 | 1.64 | 1.94 | -0.31 | 71.87 | -0.12 | 3.59 | 1.64 | 1.94 | -0.31 | 71.87 | 0.00 |
| 36 | 3.62 | 1.67 | 1.95 | -0.29 | 71.87 | -0.11 | 3.62 | 1.67 | 1.95 | -0.29 | 71.87 | 0.00 |
| 37 | 3.65 | 1.69 | 1.96 | -0.27 | 71.88 | -0.10 | 3.65 | 1.69 | 1.96 | -0.27 | 71.88 | 0.00 |
| 38 | 3.68 | 1.71 | 1.97 | -0.26 | 71.89 | -0.09 | 3.68 | 1.71 | 1.97 | -0.26 | 71.89 | 0.00 |
| 39 | 3.71 | 1.73 | 1.97 | -0.24 | 71.91 | -0.08 | 3.71 | 1.73 | 1.97 | -0.24 | 71.91 | 0.00 |
| 40 | 3.74 | 1.75 | 1.98 | -0.23 | 71.93 | -0.07 | 3.74 | 1.75 | 1.98 | -0.23 | 71.93 | 0.00 |
Figure 2. Responses to a Front-Loaded Decrease in Government Spending in Small South Under Flexible Exchange Rate and in a Currency Union
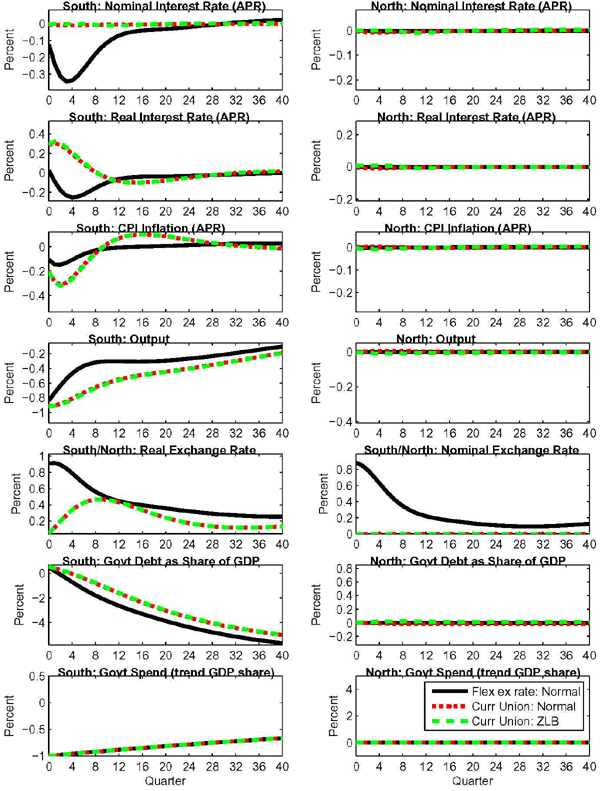
Data for Figure 2 - Flex Ex Rate Normal
| Quarter | South: Nominal Interest Rate (annualised, in percentage points) | South: Real Interest Rate (annualised, in percentage points) | South: CPI Inflation (annualised, in percentage points) | South: Output (percent) | South: Real Exchange Rate (percent) | South: Govt Debt (Share of GDP, in percentage points) | South: Govt Spend (trend GDP share) | North: Nominal Interest Rate (annualised, in percentage points) | North: Real Interest Rate (annualised, in percentage points) | North: CPI Inflation (annualised, in percentage points) | North: Output (percent) | North: Nominal Exchange Rate (percent) | North: Govt Debt (Share of GDP, in percentage points) | North: Govt Spend (trend GDP share) |
|---|---|---|---|---|---|---|---|---|---|---|---|---|---|---|
| 0.00 | -0.12 | 0.02 | -0.11 | -0.84 | 0.91 | 0.46 | -1.00 | 0.00 | 0.00 | 0.00 | 0.00 | 0.88 | 0.00 | 0.00 |
| 1.00 | -0.24 | -0.09 | -0.15 | -0.73 | 0.92 | 0.19 | -0.99 | 0.00 | 0.00 | 0.00 | 0.00 | 0.85 | 0.00 | 0.00 |
| 2.00 | -0.31 | -0.18 | -0.15 | -0.63 | 0.89 | -0.10 | -0.98 | 0.00 | 0.00 | 0.00 | 0.00 | 0.79 | 0.00 | 0.00 |
| 3.00 | -0.34 | -0.24 | -0.13 | -0.54 | 0.85 | -0.40 | -0.97 | 0.00 | 0.00 | 0.00 | 0.00 | 0.72 | 0.00 | 0.00 |
| 4.00 | -0.34 | -0.25 | -0.11 | -0.47 | 0.79 | -0.71 | -0.96 | 0.00 | 0.00 | 0.00 | 0.00 | 0.63 | 0.00 | 0.00 |
| 5.00 | -0.31 | -0.25 | -0.08 | -0.41 | 0.73 | -1.00 | -0.95 | 0.00 | 0.00 | 0.00 | 0.00 | 0.55 | 0.00 | 0.00 |
| 6.00 | -0.27 | -0.22 | -0.06 | -0.37 | 0.66 | -1.28 | -0.94 | 0.00 | 0.00 | 0.00 | 0.00 | 0.47 | 0.00 | 0.00 |
| 7.00 | -0.22 | -0.19 | -0.04 | -0.34 | 0.61 | -1.55 | -0.93 | 0.00 | 0.00 | 0.00 | 0.00 | 0.40 | 0.00 | 0.00 |
| 8.00 | -0.18 | -0.16 | -0.03 | -0.32 | 0.56 | -1.79 | -0.92 | 0.00 | 0.00 | 0.00 | 0.00 | 0.35 | 0.00 | 0.00 |
| 9.00 | -0.14 | -0.13 | -0.02 | -0.31 | 0.52 | -2.02 | -0.91 | 0.00 | 0.00 | 0.00 | 0.00 | 0.30 | 0.00 | 0.00 |
| 10.00 | -0.11 | -0.10 | -0.02 | -0.31 | 0.49 | -2.24 | -0.90 | 0.00 | 0.00 | 0.00 | 0.00 | 0.27 | 0.00 | 0.00 |
| 11.00 | -0.09 | -0.08 | -0.01 | -0.30 | 0.47 | -2.44 | -0.90 | 0.00 | 0.00 | 0.00 | 0.00 | 0.24 | 0.00 | 0.00 |
| 12.00 | -0.07 | -0.06 | -0.01 | -0.30 | 0.45 | -2.62 | -0.89 | 0.00 | 0.00 | 0.00 | 0.00 | 0.22 | 0.00 | 0.00 |
| 13.00 | -0.06 | -0.05 | -0.01 | -0.31 | 0.43 | -2.80 | -0.88 | 0.00 | 0.00 | 0.00 | 0.00 | 0.20 | 0.00 | 0.00 |
| 14.00 | -0.05 | -0.05 | 0.00 | -0.31 | 0.42 | -2.97 | -0.87 | 0.00 | 0.00 | 0.00 | 0.00 | 0.19 | 0.00 | 0.00 |
| 15.00 | -0.04 | -0.04 | 0.00 | -0.31 | 0.41 | -3.13 | -0.86 | 0.00 | 0.00 | 0.00 | 0.00 | 0.18 | 0.00 | 0.00 |
| 16.00 | -0.04 | -0.04 | 0.00 | -0.31 | 0.40 | -3.29 | -0.85 | 0.00 | 0.00 | 0.00 | 0.00 | 0.17 | 0.00 | 0.00 |
| 17.00 | -0.04 | -0.04 | 0.00 | -0.31 | 0.39 | -3.44 | -0.84 | 0.00 | 0.00 | 0.00 | 0.00 | 0.16 | 0.00 | 0.00 |
| 18.00 | -0.04 | -0.04 | 0.00 | -0.30 | 0.38 | -3.59 | -0.83 | 0.00 | 0.00 | 0.00 | 0.00 | 0.15 | 0.00 | 0.00 |
| 19.00 | -0.03 | -0.04 | 0.00 | -0.30 | 0.37 | -3.73 | -0.83 | 0.00 | 0.00 | 0.00 | 0.00 | 0.14 | 0.00 | 0.00 |
| 20.00 | -0.03 | -0.04 | 0.01 | -0.30 | 0.36 | -3.87 | -0.82 | 0.00 | 0.00 | 0.00 | 0.00 | 0.13 | 0.00 | 0.00 |
| 21.00 | -0.03 | -0.04 | 0.01 | -0.29 | 0.35 | -4.00 | -0.81 | 0.00 | 0.00 | 0.00 | 0.00 | 0.12 | 0.00 | 0.00 |
| 22.00 | -0.03 | -0.04 | 0.01 | -0.28 | 0.34 | -4.12 | -0.80 | 0.00 | 0.00 | 0.00 | 0.00 | 0.12 | 0.00 | 0.00 |
| 23.00 | -0.02 | -0.04 | 0.01 | -0.28 | 0.33 | -4.24 | -0.79 | 0.00 | 0.00 | 0.00 | 0.00 | 0.11 | 0.00 | 0.00 |
| 24.00 | -0.02 | -0.03 | 0.01 | -0.27 | 0.32 | -4.36 | -0.79 | 0.00 | 0.00 | 0.00 | 0.00 | 0.11 | 0.00 | 0.00 |
| 25.00 | -0.02 | -0.03 | 0.01 | -0.26 | 0.31 | -4.47 | -0.78 | 0.00 | 0.00 | 0.00 | 0.00 | 0.10 | 0.00 | 0.00 |
| 26.00 | -0.01 | -0.03 | 0.02 | -0.25 | 0.31 | -4.58 | -0.77 | 0.00 | 0.00 | 0.00 | 0.00 | 0.10 | 0.00 | 0.00 |
| 27.00 | -0.01 | -0.03 | 0.02 | -0.24 | 0.30 | -4.68 | -0.76 | 0.00 | 0.00 | 0.00 | 0.00 | 0.10 | 0.00 | 0.00 |
| 28.00 | -0.01 | -0.03 | 0.02 | -0.23 | 0.29 | -4.78 | -0.75 | 0.00 | 0.00 | 0.00 | 0.00 | 0.09 | 0.00 | 0.00 |
| 29.00 | 0.00 | -0.02 | 0.02 | -0.22 | 0.29 | -4.88 | -0.75 | 0.00 | 0.00 | 0.00 | 0.00 | 0.09 | 0.00 | 0.00 |
| 30.00 | 0.00 | -0.02 | 0.02 | -0.21 | 0.28 | -4.97 | -0.74 | 0.00 | 0.00 | 0.00 | 0.00 | 0.09 | 0.00 | 0.00 |
| 31.00 | 0.00 | -0.02 | 0.02 | -0.20 | 0.28 | -5.05 | -0.73 | 0.00 | 0.00 | 0.00 | 0.00 | 0.09 | 0.00 | 0.00 |
| 32.00 | 0.01 | -0.02 | 0.02 | -0.19 | 0.27 | -5.13 | -0.72 | 0.00 | 0.00 | 0.00 | 0.00 | 0.09 | 0.00 | 0.00 |
| 33.00 | 0.01 | -0.01 | 0.02 | -0.18 | 0.27 | -5.21 | -0.72 | 0.00 | 0.00 | 0.00 | 0.00 | 0.10 | 0.00 | 0.00 |
| 34.00 | 0.01 | -0.01 | 0.02 | -0.17 | 0.26 | -5.28 | -0.71 | 0.00 | 0.00 | 0.00 | 0.00 | 0.10 | 0.00 | 0.00 |
| 35.00 | 0.02 | -0.01 | 0.02 | -0.16 | 0.26 | -5.35 | -0.70 | 0.00 | 0.00 | 0.00 | 0.00 | 0.10 | 0.00 | 0.00 |
| 36.00 | 0.02 | -0.01 | 0.02 | -0.15 | 0.26 | -5.42 | -0.70 | 0.00 | 0.00 | 0.00 | 0.00 | 0.11 | 0.00 | 0.00 |
| 37.00 | 0.02 | -0.01 | 0.03 | -0.14 | 0.26 | -5.48 | -0.69 | 0.00 | 0.00 | 0.00 | 0.00 | 0.11 | 0.00 | 0.00 |
| 38.00 | 0.02 | 0.00 | 0.03 | -0.12 | 0.26 | -5.54 | -0.68 | 0.00 | 0.00 | 0.00 | 0.00 | 0.12 | 0.00 | 0.00 |
| 39.00 | 0.02 | 0.00 | 0.03 | -0.11 | 0.25 | -5.60 | -0.68 | 0.00 | 0.00 | 0.00 | 0.00 | 0.12 | 0.00 | 0.00 |
| 40.00 | 0.02 | 0.00 | 0.02 | -0.10 | 0.25 | -5.65 | -0.67 | 0.00 | 0.00 | 0.00 | 0.00 | 0.13 | 0.00 | 0.00 |
Data for Figure 2 - Curr Union Normal
| Quarter | South: Nominal Interest Rate (annualised, in percentage points) | South: Real Interest Rate (annualised, in percentage points) | South: CPI Inflation (annualised, in percentage points) | South: Output (percent) | South: Real Exchange Rate (percent) | South: Govt Debt (Share of GDP, in percentage points) | South: Govt Spend (trend GDP share) | North: Nominal Interest Rate (annualised, in percentage points) | North: Real Interest Rate (annualised, in percentage points) | North: CPI Inflation (annualised, in percentage points) | North: Output (percent) | North: Nominal Exchange Rate (percent) | North: Govt Debt (Share of GDP, in percentage points) | North: Govt Spend (trend GDP share) |
|---|---|---|---|---|---|---|---|---|---|---|---|---|---|---|
| 0.00 | 0.00 | 0.29 | -0.20 | -0.91 | 0.05 | 0.54 | -1.00 | 0.00 | 0.00 | 0.00 | 0.00 | 0.00 | 0.00 | 0.00 |
| 1.00 | -0.01 | 0.31 | -0.29 | -0.91 | 0.12 | 0.41 | -0.99 | -0.01 | -0.01 | 0.00 | 0.00 | 0.00 | 0.00 | 0.00 |
| 2.00 | -0.01 | 0.29 | -0.31 | -0.88 | 0.20 | 0.27 | -0.98 | -0.01 | -0.01 | 0.00 | 0.00 | 0.00 | -0.01 | 0.00 |
| 3.00 | -0.01 | 0.25 | -0.29 | -0.85 | 0.27 | 0.11 | -0.97 | -0.01 | -0.01 | 0.00 | 0.00 | 0.00 | -0.01 | 0.00 |
| 4.00 | -0.01 | 0.19 | -0.25 | -0.81 | 0.34 | -0.05 | -0.96 | -0.01 | -0.01 | 0.00 | 0.00 | 0.00 | -0.01 | 0.00 |
| 5.00 | -0.01 | 0.14 | -0.20 | -0.77 | 0.39 | -0.23 | -0.95 | -0.01 | -0.01 | 0.00 | 0.01 | 0.00 | -0.01 | 0.00 |
| 6.00 | -0.01 | 0.09 | -0.15 | -0.73 | 0.43 | -0.42 | -0.94 | -0.01 | -0.01 | 0.00 | 0.01 | 0.00 | -0.02 | 0.00 |
| 7.00 | -0.01 | 0.04 | -0.10 | -0.69 | 0.45 | -0.61 | -0.93 | -0.01 | -0.01 | 0.00 | 0.00 | 0.00 | -0.02 | 0.00 |
| 8.00 | -0.01 | 0.01 | -0.05 | -0.66 | 0.46 | -0.81 | -0.92 | -0.01 | -0.01 | 0.00 | 0.00 | 0.00 | -0.02 | 0.00 |
| 9.00 | 0.00 | -0.03 | -0.01 | -0.63 | 0.47 | -1.01 | -0.91 | 0.00 | 0.00 | 0.00 | 0.00 | 0.00 | -0.02 | 0.00 |
| 10.00 | 0.00 | -0.05 | 0.02 | -0.60 | 0.46 | -1.21 | -0.90 | 0.00 | 0.00 | 0.00 | 0.00 | 0.00 | -0.02 | 0.00 |
| 11.00 | 0.00 | -0.07 | 0.05 | -0.57 | 0.45 | -1.41 | -0.90 | 0.00 | 0.00 | 0.00 | 0.00 | 0.00 | -0.02 | 0.00 |
| 12.00 | 0.00 | -0.09 | 0.07 | -0.55 | 0.43 | -1.61 | -0.89 | 0.00 | 0.00 | 0.00 | 0.00 | 0.00 | -0.02 | 0.00 |
| 13.00 | 0.00 | -0.09 | 0.08 | -0.53 | 0.41 | -1.81 | -0.88 | 0.00 | 0.00 | 0.00 | 0.00 | 0.00 | -0.02 | 0.00 |
| 14.00 | 0.00 | -0.10 | 0.09 | -0.52 | 0.39 | -2.00 | -0.87 | 0.00 | 0.00 | 0.00 | 0.00 | 0.00 | -0.02 | 0.00 |
| 15.00 | 0.00 | -0.10 | 0.10 | -0.50 | 0.36 | -2.18 | -0.86 | 0.00 | 0.00 | 0.00 | 0.00 | 0.00 | -0.02 | 0.00 |
| 16.00 | 0.00 | -0.10 | 0.10 | -0.49 | 0.34 | -2.36 | -0.85 | 0.00 | 0.00 | 0.00 | 0.00 | 0.00 | -0.02 | 0.00 |
| 17.00 | 0.00 | -0.10 | 0.10 | -0.48 | 0.31 | -2.54 | -0.84 | 0.00 | 0.00 | 0.00 | 0.00 | 0.00 | -0.02 | 0.00 |
| 18.00 | 0.00 | -0.09 | 0.09 | -0.47 | 0.29 | -2.71 | -0.83 | 0.00 | 0.00 | 0.00 | 0.00 | 0.00 | -0.02 | 0.00 |
| 19.00 | 0.00 | -0.09 | 0.09 | -0.46 | 0.26 | -2.87 | -0.83 | 0.00 | 0.00 | 0.00 | 0.00 | 0.00 | -0.02 | 0.00 |
| 20.00 | 0.00 | -0.08 | 0.08 | -0.44 | 0.24 | -3.02 | -0.82 | 0.00 | 0.00 | 0.00 | 0.00 | 0.00 | -0.02 | 0.00 |
| 21.00 | 0.00 | -0.07 | 0.08 | -0.43 | 0.22 | -3.17 | -0.81 | 0.00 | 0.00 | 0.00 | 0.00 | 0.00 | -0.02 | 0.00 |
| 22.00 | 0.00 | -0.06 | 0.07 | -0.42 | 0.21 | -3.31 | -0.80 | 0.00 | 0.00 | 0.00 | 0.00 | 0.00 | -0.02 | 0.00 |
| 23.00 | 0.00 | -0.06 | 0.06 | -0.41 | 0.19 | -3.45 | -0.79 | 0.00 | 0.00 | 0.00 | 0.00 | 0.00 | -0.02 | 0.00 |
| 24.00 | 0.00 | -0.05 | 0.06 | -0.40 | 0.17 | -3.58 | -0.79 | 0.00 | 0.00 | 0.00 | 0.00 | 0.00 | -0.02 | 0.00 |
| 25.00 | 0.00 | -0.04 | 0.05 | -0.39 | 0.16 | -3.71 | -0.78 | 0.00 | 0.00 | 0.00 | 0.00 | 0.00 | -0.02 | 0.00 |
| 26.00 | 0.00 | -0.04 | 0.04 | -0.38 | 0.15 | -3.82 | -0.77 | 0.00 | 0.00 | 0.00 | 0.00 | 0.00 | -0.02 | 0.00 |
| 27.00 | 0.00 | -0.03 | 0.03 | -0.37 | 0.14 | -3.94 | -0.76 | 0.00 | 0.00 | 0.00 | 0.00 | 0.00 | -0.02 | 0.00 |
| 28.00 | 0.00 | -0.02 | 0.03 | -0.35 | 0.14 | -4.05 | -0.75 | 0.00 | 0.00 | 0.00 | 0.00 | 0.00 | -0.02 | 0.00 |
| 29.00 | 0.00 | -0.02 | 0.02 | -0.34 | 0.13 | -4.15 | -0.75 | 0.00 | 0.00 | 0.00 | 0.00 | 0.00 | -0.02 | 0.00 |
| 30.00 | 0.00 | -0.01 | 0.02 | -0.33 | 0.13 | -4.25 | -0.74 | 0.00 | 0.00 | 0.00 | 0.00 | 0.00 | -0.02 | 0.00 |
| 31.00 | 0.00 | -0.01 | 0.01 | -0.31 | 0.12 | -4.34 | -0.73 | 0.00 | 0.00 | 0.00 | 0.00 | 0.00 | -0.02 | 0.00 |
| 32.00 | 0.00 | 0.00 | 0.01 | -0.30 | 0.12 | -4.43 | -0.72 | 0.00 | 0.00 | 0.00 | 0.00 | 0.00 | -0.02 | 0.00 |
| 33.00 | 0.00 | 0.00 | 0.00 | -0.29 | 0.12 | -4.51 | -0.72 | 0.00 | 0.00 | 0.00 | 0.00 | 0.00 | -0.02 | 0.00 |
| 34.00 | 0.00 | 0.00 | 0.00 | -0.27 | 0.12 | -4.59 | -0.71 | 0.00 | 0.00 | 0.00 | 0.00 | 0.00 | -0.02 | 0.00 |
| 35.00 | 0.00 | 0.01 | 0.00 | -0.26 | 0.12 | -4.67 | -0.70 | 0.00 | 0.00 | 0.00 | 0.00 | 0.00 | -0.02 | 0.00 |
| 36.00 | 0.00 | 0.01 | -0.01 | -0.24 | 0.12 | -4.74 | -0.70 | 0.00 | 0.00 | 0.00 | 0.00 | 0.00 | -0.02 | 0.00 |
| 37.00 | 0.00 | 0.01 | -0.01 | -0.23 | 0.12 | -4.81 | -0.69 | 0.00 | 0.00 | 0.00 | 0.00 | 0.00 | -0.02 | 0.00 |
| 38.00 | 0.00 | 0.01 | -0.01 | -0.22 | 0.13 | -4.88 | -0.68 | 0.00 | 0.00 | 0.00 | 0.00 | 0.00 | -0.02 | 0.00 |
| 39.00 | 0.00 | 0.01 | -0.01 | -0.20 | 0.13 | -4.94 | -0.68 | 0.00 | 0.00 | 0.00 | 0.00 | 0.00 | -0.02 | 0.00 |
| 40.00 | 0.00 | 0.02 | -0.01 | -0.19 | 0.13 | -5.00 | -0.67 | 0.00 | 0.00 | 0.00 | 0.00 | 0.00 | -0.02 | 0.00 |
Data for Figure 2 - Curr Union ZLB
| Quarter | South: Nominal Interest Rate (annualised, in percentage points) | South: Real Interest Rate (annualised, in percentage points) | South: CPI Inflation (annualised, in percentage points) | South: Output (percent) | South: Real Exchange Rate (percent) | South: Govt Debt (Share of GDP, in percentage points) | South: Govt Spend (trend GDP share) | North: Nominal Interest Rate (annualised, in percentage points) | North: Real Interest Rate (annualised, in percentage points) | North: CPI Inflation (annualised, in percentage points) | North: Output (percent) | North: Nominal Exchange Rate (percent) | North: Govt Debt (Share of GDP, in percentage points) | North: Govt Spend (trend GDP share) |
|---|---|---|---|---|---|---|---|---|---|---|---|---|---|---|
| 0.00 | 0.00 | 0.30 | -0.20 | -0.92 | 0.05 | 0.54 | -1.00 | 0.00 | 0.01 | 0.00 | 0.00 | 0.00 | 0.00 | 0.00 |
| 1.00 | 0.00 | 0.32 | -0.30 | -0.91 | 0.12 | 0.42 | -0.99 | 0.00 | 0.01 | -0.01 | -0.01 | 0.00 | 0.01 | 0.00 |
| 2.00 | 0.00 | 0.30 | -0.32 | -0.89 | 0.20 | 0.28 | -0.98 | 0.00 | 0.01 | -0.01 | -0.01 | 0.00 | 0.01 | 0.00 |
| 3.00 | 0.00 | 0.26 | -0.30 | -0.86 | 0.27 | 0.13 | -0.97 | 0.00 | 0.01 | -0.01 | -0.01 | 0.00 | 0.01 | 0.00 |
| 4.00 | 0.00 | 0.21 | -0.26 | -0.83 | 0.34 | -0.03 | -0.96 | 0.00 | 0.01 | -0.01 | -0.01 | 0.00 | 0.02 | 0.00 |
| 5.00 | 0.00 | 0.16 | -0.21 | -0.79 | 0.39 | -0.20 | -0.95 | 0.00 | 0.01 | -0.01 | -0.01 | 0.00 | 0.02 | 0.00 |
| 6.00 | 0.00 | 0.10 | -0.16 | -0.75 | 0.43 | -0.38 | -0.94 | 0.00 | 0.01 | -0.01 | -0.01 | 0.00 | 0.02 | 0.00 |
| 7.00 | 0.00 | 0.06 | -0.10 | -0.71 | 0.45 | -0.57 | -0.93 | 0.00 | 0.00 | -0.01 | -0.01 | 0.00 | 0.02 | 0.00 |
| 8.00 | 0.00 | 0.01 | -0.06 | -0.67 | 0.46 | -0.77 | -0.92 | 0.00 | 0.00 | 0.00 | -0.01 | 0.00 | 0.02 | 0.00 |
| 9.00 | -0.01 | -0.03 | -0.01 | -0.64 | 0.47 | -0.97 | -0.91 | -0.01 | -0.01 | 0.00 | -0.01 | 0.00 | 0.02 | 0.00 |
| 10.00 | -0.01 | -0.06 | 0.02 | -0.61 | 0.46 | -1.17 | -0.90 | -0.01 | -0.01 | 0.00 | -0.01 | 0.00 | 0.02 | 0.00 |
| 11.00 | -0.01 | -0.08 | 0.05 | -0.58 | 0.45 | -1.37 | -0.90 | -0.01 | -0.01 | 0.00 | -0.01 | 0.00 | 0.02 | 0.00 |
| 12.00 | -0.01 | -0.09 | 0.07 | -0.56 | 0.43 | -1.57 | -0.89 | -0.01 | -0.01 | 0.00 | -0.01 | 0.00 | 0.02 | 0.00 |
| 13.00 | -0.01 | -0.10 | 0.08 | -0.54 | 0.41 | -1.77 | -0.88 | -0.01 | -0.01 | 0.00 | -0.01 | 0.00 | 0.02 | 0.00 |
| 14.00 | -0.01 | -0.11 | 0.09 | -0.53 | 0.39 | -1.96 | -0.87 | -0.01 | -0.01 | 0.00 | -0.01 | 0.00 | 0.01 | 0.00 |
| 15.00 | 0.00 | -0.11 | 0.10 | -0.51 | 0.36 | -2.15 | -0.86 | 0.00 | 0.00 | 0.00 | -0.01 | 0.00 | 0.01 | 0.00 |
| 16.00 | 0.00 | -0.10 | 0.10 | -0.50 | 0.34 | -2.33 | -0.85 | 0.00 | 0.00 | 0.00 | -0.01 | 0.00 | 0.01 | 0.00 |
| 17.00 | 0.00 | -0.10 | 0.10 | -0.49 | 0.31 | -2.51 | -0.84 | 0.00 | 0.00 | 0.00 | -0.01 | 0.00 | 0.01 | 0.00 |
| 18.00 | 0.00 | -0.09 | 0.10 | -0.47 | 0.29 | -2.68 | -0.83 | 0.00 | 0.00 | 0.00 | -0.01 | 0.00 | 0.01 | 0.00 |
| 19.00 | 0.00 | -0.09 | 0.09 | -0.46 | 0.26 | -2.84 | -0.83 | 0.00 | 0.00 | 0.00 | -0.01 | 0.00 | 0.01 | 0.00 |
| 20.00 | 0.00 | -0.08 | 0.09 | -0.45 | 0.24 | -2.99 | -0.82 | 0.00 | 0.00 | 0.00 | -0.01 | 0.00 | 0.01 | 0.00 |
| 21.00 | 0.00 | -0.07 | 0.08 | -0.44 | 0.22 | -3.14 | -0.81 | 0.00 | 0.00 | 0.00 | -0.01 | 0.00 | 0.01 | 0.00 |
| 22.00 | 0.00 | -0.07 | 0.07 | -0.43 | 0.21 | -3.29 | -0.80 | 0.00 | 0.00 | 0.00 | -0.01 | 0.00 | 0.01 | 0.00 |
| 23.00 | 0.00 | -0.06 | 0.07 | -0.42 | 0.19 | -3.42 | -0.79 | 0.00 | 0.00 | 0.00 | -0.01 | 0.00 | 0.01 | 0.00 |
| 24.00 | 0.00 | -0.05 | 0.06 | -0.41 | 0.17 | -3.55 | -0.79 | 0.00 | 0.00 | 0.00 | -0.01 | 0.00 | 0.01 | 0.00 |
| 25.00 | 0.00 | -0.04 | 0.05 | -0.40 | 0.16 | -3.68 | -0.78 | 0.00 | 0.00 | 0.00 | -0.01 | 0.00 | 0.01 | 0.00 |
| 26.00 | 0.00 | -0.04 | 0.04 | -0.38 | 0.15 | -3.80 | -0.77 | 0.00 | 0.00 | 0.00 | -0.01 | 0.00 | 0.01 | 0.00 |
| 27.00 | 0.00 | -0.03 | 0.04 | -0.37 | 0.14 | -3.91 | -0.76 | 0.00 | 0.00 | 0.00 | -0.01 | 0.00 | 0.01 | 0.00 |
| 28.00 | 0.00 | -0.02 | 0.03 | -0.36 | 0.14 | -4.02 | -0.75 | 0.00 | 0.00 | 0.00 | 0.00 | 0.00 | 0.01 | 0.00 |
| 29.00 | 0.00 | -0.02 | 0.03 | -0.35 | 0.13 | -4.12 | -0.75 | 0.00 | 0.00 | 0.00 | 0.00 | 0.00 | 0.01 | 0.00 |
| 30.00 | 0.00 | -0.01 | 0.02 | -0.33 | 0.13 | -4.22 | -0.74 | 0.00 | 0.00 | 0.00 | 0.00 | 0.00 | 0.01 | 0.00 |
| 31.00 | 0.00 | -0.01 | 0.01 | -0.32 | 0.12 | -4.31 | -0.73 | 0.00 | 0.00 | 0.00 | 0.00 | 0.00 | 0.01 | 0.00 |
| 32.00 | 0.00 | 0.00 | 0.01 | -0.30 | 0.12 | -4.40 | -0.72 | 0.00 | 0.00 | 0.00 | 0.00 | 0.00 | 0.01 | 0.00 |
| 33.00 | 0.00 | 0.00 | 0.01 | -0.29 | 0.12 | -4.49 | -0.72 | 0.00 | 0.00 | 0.00 | 0.00 | 0.00 | 0.01 | 0.00 |
| 34.00 | 0.00 | 0.00 | 0.00 | -0.28 | 0.12 | -4.57 | -0.71 | 0.00 | 0.00 | 0.00 | 0.00 | 0.00 | 0.01 | 0.00 |
| 35.00 | 0.00 | 0.01 | 0.00 | -0.26 | 0.12 | -4.64 | -0.70 | 0.00 | 0.00 | 0.00 | 0.00 | 0.00 | 0.01 | 0.00 |
| 36.00 | 0.00 | 0.01 | 0.00 | -0.25 | 0.12 | -4.72 | -0.70 | 0.00 | 0.00 | 0.00 | 0.00 | 0.00 | 0.01 | 0.00 |
| 37.00 | 0.00 | 0.01 | -0.01 | -0.23 | 0.12 | -4.79 | -0.69 | 0.00 | 0.00 | 0.00 | 0.00 | 0.00 | 0.01 | 0.00 |
| 38.00 | 0.00 | 0.01 | -0.01 | -0.22 | 0.13 | -4.85 | -0.68 | 0.00 | 0.00 | 0.00 | 0.00 | 0.00 | 0.01 | 0.00 |
| 39.00 | 0.00 | 0.02 | -0.01 | -0.21 | 0.13 | -4.91 | -0.68 | 0.00 | 0.00 | 0.00 | 0.00 | 0.00 | 0.01 | 0.00 |
| 40.00 | 0.00 | 0.02 | -0.01 | -0.19 | 0.13 | -4.97 | -0.67 | 0.00 | 0.00 | 0.00 | 0.00 | 0.00 | 0.01 | 0.00 |
Figure 3. Responses to a Front-Loaded Decrease in Government Spending in Large South Under Flexible Exchange Rate and in a Currency Union
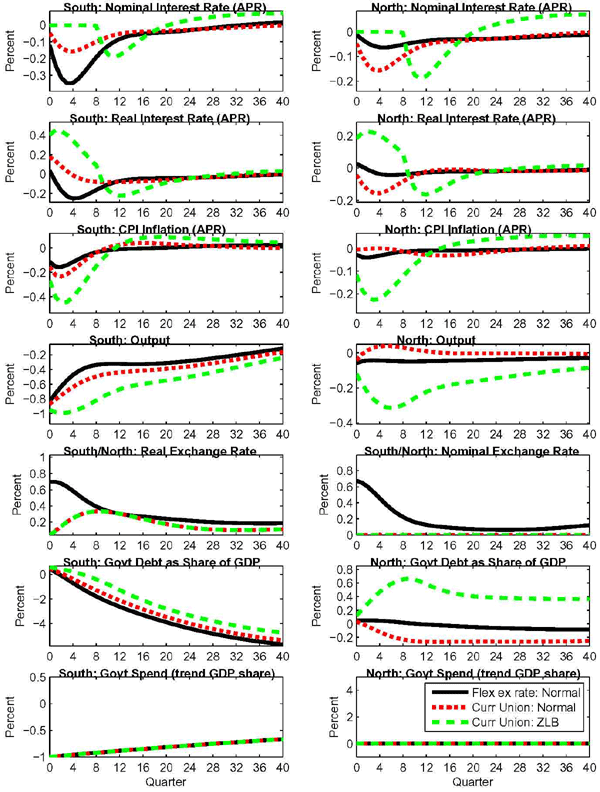
Data for Figure 3 - Flex Ex Rate Normal
| Quarter | South: Nominal Interest Rate (annualised, in percentage points) | South: Real Interest Rate (annualised, in percentage points) | South: CPI Inflation (annualised, in percentage points) | South: Output (percent) | South: Real Exchange Rate (percent) | South: Govt Debt (Share of GDP, in percentage points) | South: Govt Spend (trend GDP share) | North: Nominal Interest Rate (annualised, in percentage points) | North: Real Interest Rate (annualised, in percentage points) | North: CPI Inflation (annualised, in percentage points) | North: Output (percent) | North: Nominal Exchange Rate (percent) | North: Govt Debt (Share of GDP, in percentage points) | North: Govt Spend (trend GDP share) |
|---|---|---|---|---|---|---|---|---|---|---|---|---|---|---|
| 0.00 | -0.12 | 0.03 | -0.11 | -0.83 | 0.70 | 0.46 | -1.00 | -0.01 | 0.03 | -0.03 | -0.06 | 0.67 | 0.05 | 0.00 |
| 1.00 | -0.24 | -0.08 | -0.16 | -0.73 | 0.70 | 0.19 | -0.99 | -0.03 | 0.01 | -0.04 | -0.05 | 0.65 | 0.05 | 0.00 |
| 2.00 | -0.31 | -0.17 | -0.16 | -0.63 | 0.68 | -0.10 | -0.98 | -0.05 | -0.01 | -0.04 | -0.04 | 0.60 | 0.05 | 0.00 |
| 3.00 | -0.35 | -0.23 | -0.14 | -0.54 | 0.64 | -0.40 | -0.97 | -0.06 | -0.03 | -0.04 | -0.04 | 0.53 | 0.05 | 0.00 |
| 4.00 | -0.34 | -0.25 | -0.12 | -0.47 | 0.58 | -0.70 | -0.96 | -0.06 | -0.04 | -0.03 | -0.04 | 0.46 | 0.05 | 0.00 |
| 5.00 | -0.32 | -0.25 | -0.09 | -0.42 | 0.53 | -0.99 | -0.95 | -0.06 | -0.04 | -0.03 | -0.05 | 0.39 | 0.04 | 0.00 |
| 6.00 | -0.28 | -0.23 | -0.07 | -0.38 | 0.48 | -1.27 | -0.94 | -0.06 | -0.04 | -0.02 | -0.05 | 0.32 | 0.03 | 0.00 |
| 7.00 | -0.23 | -0.20 | -0.05 | -0.35 | 0.43 | -1.54 | -0.93 | -0.06 | -0.04 | -0.02 | -0.05 | 0.27 | 0.03 | 0.00 |
| 8.00 | -0.19 | -0.17 | -0.04 | -0.34 | 0.39 | -1.78 | -0.92 | -0.05 | -0.04 | -0.01 | -0.05 | 0.22 | 0.02 | 0.00 |
| 9.00 | -0.16 | -0.14 | -0.03 | -0.33 | 0.36 | -2.01 | -0.91 | -0.05 | -0.04 | -0.01 | -0.05 | 0.19 | 0.01 | 0.00 |
| 10.00 | -0.12 | -0.11 | -0.02 | -0.32 | 0.34 | -2.23 | -0.90 | -0.04 | -0.03 | -0.01 | -0.05 | 0.16 | 0.00 | 0.00 |
| 11.00 | -0.10 | -0.09 | -0.02 | -0.32 | 0.32 | -2.43 | -0.90 | -0.04 | -0.03 | -0.01 | -0.05 | 0.14 | 0.00 | 0.00 |
| 12.00 | -0.08 | -0.07 | -0.01 | -0.32 | 0.30 | -2.62 | -0.89 | -0.04 | -0.03 | -0.01 | -0.05 | 0.13 | -0.01 | 0.00 |
| 13.00 | -0.07 | -0.06 | -0.01 | -0.33 | 0.29 | -2.80 | -0.88 | -0.03 | -0.03 | -0.01 | -0.05 | 0.11 | -0.02 | 0.00 |
| 14.00 | -0.06 | -0.06 | -0.01 | -0.33 | 0.28 | -2.97 | -0.87 | -0.03 | -0.02 | -0.01 | -0.05 | 0.10 | -0.02 | 0.00 |
| 15.00 | -0.06 | -0.05 | -0.01 | -0.33 | 0.27 | -3.14 | -0.86 | -0.03 | -0.02 | -0.01 | -0.05 | 0.10 | -0.03 | 0.00 |
| 16.00 | -0.05 | -0.05 | 0.00 | -0.33 | 0.27 | -3.29 | -0.85 | -0.03 | -0.02 | -0.01 | -0.05 | 0.09 | -0.03 | 0.00 |
| 17.00 | -0.05 | -0.05 | 0.00 | -0.32 | 0.26 | -3.45 | -0.84 | -0.03 | -0.02 | -0.01 | -0.04 | 0.09 | -0.03 | 0.00 |
| 18.00 | -0.05 | -0.05 | 0.00 | -0.32 | 0.25 | -3.60 | -0.83 | -0.03 | -0.02 | -0.01 | -0.04 | 0.08 | -0.04 | 0.00 |
| 19.00 | -0.04 | -0.05 | 0.00 | -0.32 | 0.25 | -3.74 | -0.83 | -0.03 | -0.02 | -0.01 | -0.04 | 0.08 | -0.04 | 0.00 |
| 20.00 | -0.04 | -0.05 | 0.00 | -0.31 | 0.24 | -3.88 | -0.82 | -0.03 | -0.02 | -0.01 | -0.04 | 0.07 | -0.05 | 0.00 |
| 21.00 | -0.04 | -0.04 | 0.00 | -0.31 | 0.24 | -4.01 | -0.81 | -0.03 | -0.02 | -0.01 | -0.04 | 0.07 | -0.05 | 0.00 |
| 22.00 | -0.04 | -0.04 | 0.01 | -0.30 | 0.23 | -4.14 | -0.80 | -0.03 | -0.02 | -0.01 | -0.04 | 0.07 | -0.05 | 0.00 |
| 23.00 | -0.03 | -0.04 | 0.01 | -0.29 | 0.22 | -4.26 | -0.79 | -0.03 | -0.02 | -0.01 | -0.04 | 0.07 | -0.06 | 0.00 |
| 24.00 | -0.03 | -0.04 | 0.01 | -0.28 | 0.22 | -4.38 | -0.79 | -0.03 | -0.02 | -0.01 | -0.04 | 0.06 | -0.06 | 0.00 |
| 25.00 | -0.03 | -0.04 | 0.01 | -0.28 | 0.21 | -4.49 | -0.78 | -0.03 | -0.02 | -0.01 | -0.04 | 0.06 | -0.06 | 0.00 |
| 26.00 | -0.02 | -0.04 | 0.01 | -0.27 | 0.21 | -4.60 | -0.77 | -0.03 | -0.02 | -0.01 | -0.04 | 0.06 | -0.07 | 0.00 |
| 27.00 | -0.02 | -0.03 | 0.01 | -0.26 | 0.20 | -4.71 | -0.76 | -0.02 | -0.02 | -0.01 | -0.04 | 0.06 | -0.07 | 0.00 |
| 28.00 | -0.02 | -0.03 | 0.02 | -0.25 | 0.20 | -4.81 | -0.75 | -0.02 | -0.02 | -0.01 | -0.04 | 0.06 | -0.07 | 0.00 |
| 29.00 | -0.01 | -0.03 | 0.02 | -0.24 | 0.20 | -4.90 | -0.75 | -0.02 | -0.02 | -0.01 | -0.04 | 0.07 | -0.07 | 0.00 |
| 30.00 | -0.01 | -0.03 | 0.02 | -0.23 | 0.19 | -4.99 | -0.74 | -0.02 | -0.02 | 0.00 | -0.03 | 0.07 | -0.08 | 0.00 |
| 31.00 | -0.01 | -0.03 | 0.02 | -0.22 | 0.19 | -5.08 | -0.73 | -0.02 | -0.02 | 0.00 | -0.03 | 0.07 | -0.08 | 0.00 |
| 32.00 | 0.00 | -0.02 | 0.02 | -0.20 | 0.19 | -5.16 | -0.72 | -0.02 | -0.02 | 0.00 | -0.03 | 0.08 | -0.08 | 0.00 |
| 33.00 | 0.00 | -0.02 | 0.02 | -0.19 | 0.19 | -5.24 | -0.72 | -0.02 | -0.02 | 0.00 | -0.03 | 0.08 | -0.08 | 0.00 |
| 34.00 | 0.00 | -0.02 | 0.02 | -0.18 | 0.19 | -5.31 | -0.71 | -0.02 | -0.01 | 0.00 | -0.03 | 0.09 | -0.08 | 0.00 |
| 35.00 | 0.01 | -0.02 | 0.02 | -0.17 | 0.19 | -5.38 | -0.70 | -0.02 | -0.01 | 0.00 | -0.03 | 0.09 | -0.08 | 0.00 |
| 36.00 | 0.01 | -0.01 | 0.02 | -0.16 | 0.19 | -5.45 | -0.70 | -0.02 | -0.01 | 0.00 | -0.03 | 0.10 | -0.08 | 0.00 |
| 37.00 | 0.01 | -0.01 | 0.02 | -0.15 | 0.19 | -5.51 | -0.69 | -0.01 | -0.01 | 0.00 | -0.03 | 0.10 | -0.08 | 0.00 |
| 38.00 | 0.01 | -0.01 | 0.02 | -0.14 | 0.19 | -5.57 | -0.68 | -0.01 | -0.01 | 0.00 | -0.03 | 0.11 | -0.08 | 0.00 |
| 39.00 | 0.01 | -0.01 | 0.02 | -0.12 | 0.19 | -5.63 | -0.68 | -0.01 | -0.01 | 0.00 | -0.03 | 0.12 | -0.08 | 0.00 |
| 40.00 | 0.02 | -0.01 | 0.02 | -0.11 | 0.19 | -5.68 | -0.67 | -0.01 | -0.01 | 0.00 | -0.03 | 0.12 | -0.08 | 0.00 |
Data for Figure 3 - Curr Union Normal
| Quarter | South: Nominal Interest Rate (annualised, in percentage points) | South: Real Interest Rate (annualised, in percentage points) | South: CPI Inflation (annualised, in percentage points) | South: Output (percent) | South: Real Exchange Rate (percent) | South: Govt Debt (Share of GDP, in percentage points) | South: Govt Spend (trend GDP share) | North: Nominal Interest Rate (annualised, in percentage points) | North: Real Interest Rate (annualised, in percentage points) | North: CPI Inflation (annualised, in percentage points) | North: Output (percent) | North: Nominal Exchange Rate (percent) | North: Govt Debt (Share of GDP, in percentage points) | North: Govt Spend (trend GDP share) |
|---|---|---|---|---|---|---|---|---|---|---|---|---|---|---|
| 0.00 | -0.05 | 0.17 | -0.16 | -0.87 | 0.04 | 0.50 | -1.00 | -0.05 | -0.04 | -0.01 | -0.04 | 0.00 | 0.03 | 0.00 |
| 1.00 | -0.10 | 0.14 | -0.22 | -0.81 | 0.09 | 0.29 | -0.99 | -0.10 | -0.10 | 0.00 | -0.01 | 0.00 | 0.00 | 0.00 |
| 2.00 | -0.14 | 0.08 | -0.23 | -0.75 | 0.15 | 0.08 | -0.98 | -0.14 | -0.14 | 0.00 | 0.02 | 0.00 | -0.04 | 0.00 |
| 3.00 | -0.15 | 0.03 | -0.22 | -0.69 | 0.21 | -0.14 | -0.97 | -0.15 | -0.16 | 0.00 | 0.03 | 0.00 | -0.08 | 0.00 |
| 4.00 | -0.16 | -0.01 | -0.18 | -0.64 | 0.25 | -0.37 | -0.96 | -0.16 | -0.16 | 0.00 | 0.04 | 0.00 | -0.12 | 0.00 |
| 5.00 | -0.15 | -0.04 | -0.14 | -0.59 | 0.29 | -0.60 | -0.95 | -0.15 | -0.14 | 0.00 | 0.04 | 0.00 | -0.16 | 0.00 |
| 6.00 | -0.13 | -0.06 | -0.10 | -0.55 | 0.31 | -0.83 | -0.94 | -0.13 | -0.13 | 0.00 | 0.04 | 0.00 | -0.19 | 0.00 |
| 7.00 | -0.12 | -0.08 | -0.07 | -0.52 | 0.33 | -1.06 | -0.93 | -0.12 | -0.10 | -0.01 | 0.03 | 0.00 | -0.21 | 0.00 |
| 8.00 | -0.10 | -0.08 | -0.04 | -0.49 | 0.33 | -1.29 | -0.92 | -0.10 | -0.08 | -0.01 | 0.03 | 0.00 | -0.23 | 0.00 |
| 9.00 | -0.08 | -0.08 | -0.02 | -0.47 | 0.33 | -1.50 | -0.91 | -0.08 | -0.06 | -0.02 | 0.02 | 0.00 | -0.24 | 0.00 |
| 10.00 | -0.07 | -0.09 | 0.00 | -0.46 | 0.33 | -1.71 | -0.90 | -0.07 | -0.05 | -0.02 | 0.02 | 0.00 | -0.25 | 0.00 |
| 11.00 | -0.06 | -0.09 | 0.02 | -0.45 | 0.32 | -1.91 | -0.90 | -0.06 | -0.03 | -0.02 | 0.01 | 0.00 | -0.26 | 0.00 |
| 12.00 | -0.05 | -0.08 | 0.03 | -0.44 | 0.31 | -2.11 | -0.89 | -0.05 | -0.02 | -0.03 | 0.01 | 0.00 | -0.26 | 0.00 |
| 13.00 | -0.05 | -0.08 | 0.03 | -0.43 | 0.29 | -2.30 | -0.88 | -0.05 | -0.02 | -0.03 | 0.01 | 0.00 | -0.26 | 0.00 |
| 14.00 | -0.04 | -0.08 | 0.04 | -0.42 | 0.27 | -2.48 | -0.87 | -0.04 | -0.01 | -0.03 | 0.00 | 0.00 | -0.26 | 0.00 |
| 15.00 | -0.04 | -0.08 | 0.04 | -0.42 | 0.26 | -2.66 | -0.86 | -0.04 | -0.01 | -0.03 | 0.00 | 0.00 | -0.26 | 0.00 |
| 16.00 | -0.04 | -0.08 | 0.04 | -0.41 | 0.24 | -2.83 | -0.85 | -0.04 | -0.01 | -0.03 | 0.00 | 0.00 | -0.26 | 0.00 |
| 17.00 | -0.04 | -0.07 | 0.04 | -0.41 | 0.22 | -2.99 | -0.84 | -0.04 | -0.01 | -0.03 | 0.00 | 0.00 | -0.26 | 0.00 |
| 18.00 | -0.04 | -0.07 | 0.04 | -0.40 | 0.21 | -3.15 | -0.83 | -0.04 | -0.01 | -0.03 | 0.00 | 0.00 | -0.26 | 0.00 |
| 19.00 | -0.03 | -0.07 | 0.03 | -0.40 | 0.19 | -3.30 | -0.83 | -0.03 | -0.01 | -0.03 | 0.00 | 0.00 | -0.26 | 0.00 |
| 20.00 | -0.03 | -0.06 | 0.03 | -0.39 | 0.18 | -3.45 | -0.82 | -0.03 | -0.01 | -0.02 | 0.00 | 0.00 | -0.26 | 0.00 |
| 21.00 | -0.03 | -0.06 | 0.03 | -0.38 | 0.16 | -3.59 | -0.81 | -0.03 | -0.01 | -0.02 | 0.00 | 0.00 | -0.26 | 0.00 |
| 22.00 | -0.03 | -0.06 | 0.03 | -0.37 | 0.15 | -3.72 | -0.80 | -0.03 | -0.01 | -0.02 | 0.00 | 0.00 | -0.26 | 0.00 |
| 23.00 | -0.03 | -0.05 | 0.02 | -0.37 | 0.14 | -3.85 | -0.79 | -0.03 | -0.02 | -0.02 | 0.00 | 0.00 | -0.26 | 0.00 |
| 24.00 | -0.03 | -0.05 | 0.02 | -0.36 | 0.13 | -3.98 | -0.79 | -0.03 | -0.02 | -0.01 | 0.00 | 0.00 | -0.26 | 0.00 |
| 25.00 | -0.03 | -0.04 | 0.02 | -0.35 | 0.13 | -4.09 | -0.78 | -0.03 | -0.02 | -0.01 | 0.00 | 0.00 | -0.26 | 0.00 |
| 26.00 | -0.02 | -0.04 | 0.02 | -0.34 | 0.12 | -4.21 | -0.77 | -0.02 | -0.02 | -0.01 | 0.00 | 0.00 | -0.26 | 0.00 |
| 27.00 | -0.02 | -0.04 | 0.02 | -0.32 | 0.11 | -4.32 | -0.76 | -0.02 | -0.02 | -0.01 | 0.00 | 0.00 | -0.26 | 0.00 |
| 28.00 | -0.02 | -0.03 | 0.01 | -0.31 | 0.11 | -4.42 | -0.75 | -0.02 | -0.02 | 0.00 | 0.00 | 0.00 | -0.26 | 0.00 |
| 29.00 | -0.02 | -0.03 | 0.01 | -0.30 | 0.11 | -4.52 | -0.75 | -0.02 | -0.02 | 0.00 | 0.00 | 0.00 | -0.26 | 0.00 |
| 30.00 | -0.02 | -0.03 | 0.01 | -0.29 | 0.10 | -4.62 | -0.74 | -0.02 | -0.02 | 0.00 | 0.00 | 0.00 | -0.26 | 0.00 |
| 31.00 | -0.02 | -0.02 | 0.01 | -0.28 | 0.10 | -4.71 | -0.73 | -0.02 | -0.02 | 0.00 | 0.00 | 0.00 | -0.26 | 0.00 |
| 32.00 | -0.01 | -0.02 | 0.01 | -0.26 | 0.10 | -4.80 | -0.72 | -0.01 | -0.02 | 0.00 | 0.00 | 0.00 | -0.26 | 0.00 |
| 33.00 | -0.01 | -0.02 | 0.01 | -0.25 | 0.10 | -4.88 | -0.72 | -0.01 | -0.02 | 0.00 | 0.00 | 0.00 | -0.26 | 0.00 |
| 34.00 | -0.01 | -0.01 | 0.00 | -0.24 | 0.10 | -4.96 | -0.71 | -0.01 | -0.02 | 0.01 | 0.00 | 0.00 | -0.26 | 0.00 |
| 35.00 | -0.01 | -0.01 | 0.00 | -0.22 | 0.10 | -5.03 | -0.70 | -0.01 | -0.02 | 0.01 | -0.01 | 0.00 | -0.26 | 0.00 |
| 36.00 | -0.01 | -0.01 | 0.00 | -0.21 | 0.10 | -5.10 | -0.70 | -0.01 | -0.02 | 0.01 | -0.01 | 0.00 | -0.26 | 0.00 |
| 37.00 | -0.01 | -0.01 | 0.00 | -0.20 | 0.11 | -5.17 | -0.69 | -0.01 | -0.02 | 0.01 | -0.01 | 0.00 | -0.25 | 0.00 |
| 38.00 | 0.00 | 0.00 | 0.00 | -0.19 | 0.11 | -5.24 | -0.68 | 0.00 | -0.01 | 0.01 | -0.01 | 0.00 | -0.25 | 0.00 |
| 39.00 | 0.00 | 0.00 | 0.00 | -0.17 | 0.11 | -5.30 | -0.68 | 0.00 | -0.01 | 0.01 | -0.01 | 0.00 | -0.25 | 0.00 |
| 40.00 | 0.00 | 0.00 | 0.00 | -0.16 | 0.11 | -5.35 | -0.67 | 0.00 | -0.01 | 0.01 | -0.01 | 0.00 | -0.25 | 0.00 |
Data for Figure 3 - Curr Union ZLB
| Quarter | South: Nominal Interest Rate (annualised, in percentage points) | South: Real Interest Rate (annualised, in percentage points) | South: CPI Inflation (annualised, in percentage points) | South: Output (percent) | South: Real Exchange Rate (percent) | South: Govt Debt (Share of GDP, in percentage points) | South: Govt Spend (trend GDP share) | North: Nominal Interest Rate (annualised, in percentage points) | North: Real Interest Rate (annualised, in percentage points) | North: CPI Inflation (annualised, in percentage points) | North: Output (percent) | North: Nominal Exchange Rate (percent) | North: Govt Debt (Share of GDP, in percentage points) | North: Govt Spend (trend GDP share) |
|---|---|---|---|---|---|---|---|---|---|---|---|---|---|---|
| 0.00 | 0.00 | 0.40 | -0.27 | -0.95 | 0.04 | 0.58 | -1.00 | 0.00 | 0.18 | -0.12 | -0.12 | 0.00 | 0.12 | 0.00 |
| 1.00 | 0.00 | 0.45 | -0.40 | -0.98 | 0.09 | 0.51 | -0.99 | 0.00 | 0.22 | -0.18 | -0.18 | 0.00 | 0.21 | 0.00 |
| 2.00 | 0.00 | 0.44 | -0.45 | -0.99 | 0.15 | 0.43 | -0.98 | 0.00 | 0.23 | -0.22 | -0.23 | 0.00 | 0.30 | 0.00 |
| 3.00 | 0.00 | 0.40 | -0.44 | -0.99 | 0.21 | 0.33 | -0.97 | 0.00 | 0.22 | -0.23 | -0.27 | 0.00 | 0.39 | 0.00 |
| 4.00 | 0.00 | 0.34 | -0.40 | -0.97 | 0.25 | 0.22 | -0.96 | 0.00 | 0.20 | -0.22 | -0.29 | 0.00 | 0.47 | 0.00 |
| 5.00 | 0.00 | 0.28 | -0.34 | -0.94 | 0.29 | 0.09 | -0.95 | 0.00 | 0.18 | -0.20 | -0.31 | 0.00 | 0.54 | 0.00 |
| 6.00 | 0.00 | 0.21 | -0.28 | -0.91 | 0.31 | -0.06 | -0.94 | 0.00 | 0.15 | -0.18 | -0.32 | 0.00 | 0.59 | 0.00 |
| 7.00 | 0.00 | 0.15 | -0.21 | -0.87 | 0.33 | -0.22 | -0.93 | 0.00 | 0.12 | -0.15 | -0.31 | 0.00 | 0.63 | 0.00 |
| 8.00 | 0.00 | 0.09 | -0.15 | -0.82 | 0.33 | -0.40 | -0.92 | 0.00 | 0.09 | -0.12 | -0.30 | 0.00 | 0.66 | 0.00 |
| 9.00 | -0.12 | -0.07 | -0.09 | -0.78 | 0.33 | -0.59 | -0.91 | -0.12 | -0.05 | -0.10 | -0.28 | 0.00 | 0.67 | 0.00 |
| 10.00 | -0.18 | -0.17 | -0.05 | -0.74 | 0.33 | -0.81 | -0.90 | -0.18 | -0.13 | -0.07 | -0.26 | 0.00 | 0.65 | 0.00 |
| 11.00 | -0.19 | -0.21 | -0.01 | -0.70 | 0.32 | -1.03 | -0.90 | -0.19 | -0.16 | -0.05 | -0.24 | 0.00 | 0.62 | 0.00 |
| 12.00 | -0.18 | -0.23 | 0.02 | -0.67 | 0.31 | -1.26 | -0.89 | -0.18 | -0.16 | -0.03 | -0.22 | 0.00 | 0.58 | 0.00 |
| 13.00 | -0.16 | -0.22 | 0.05 | -0.65 | 0.29 | -1.49 | -0.88 | -0.16 | -0.15 | -0.02 | -0.21 | 0.00 | 0.55 | 0.00 |
| 14.00 | -0.13 | -0.20 | 0.06 | -0.63 | 0.27 | -1.70 | -0.87 | -0.13 | -0.14 | 0.00 | -0.20 | 0.00 | 0.51 | 0.00 |
| 15.00 | -0.10 | -0.18 | 0.08 | -0.61 | 0.26 | -1.91 | -0.86 | -0.10 | -0.12 | 0.01 | -0.19 | 0.00 | 0.49 | 0.00 |
| 16.00 | -0.08 | -0.16 | 0.08 | -0.60 | 0.24 | -2.10 | -0.85 | -0.08 | -0.10 | 0.01 | -0.18 | 0.00 | 0.46 | 0.00 |
| 17.00 | -0.05 | -0.14 | 0.09 | -0.58 | 0.22 | -2.28 | -0.84 | -0.05 | -0.08 | 0.02 | -0.18 | 0.00 | 0.44 | 0.00 |
| 18.00 | -0.03 | -0.12 | 0.09 | -0.57 | 0.21 | -2.46 | -0.83 | -0.03 | -0.06 | 0.02 | -0.17 | 0.00 | 0.43 | 0.00 |
| 19.00 | -0.02 | -0.10 | 0.09 | -0.56 | 0.19 | -2.62 | -0.83 | -0.02 | -0.05 | 0.03 | -0.17 | 0.00 | 0.42 | 0.00 |
| 20.00 | 0.00 | -0.09 | 0.09 | -0.55 | 0.18 | -2.78 | -0.82 | 0.00 | -0.04 | 0.03 | -0.16 | 0.00 | 0.41 | 0.00 |
| 21.00 | 0.01 | -0.08 | 0.09 | -0.54 | 0.16 | -2.93 | -0.81 | 0.01 | -0.03 | 0.04 | -0.16 | 0.00 | 0.40 | 0.00 |
| 22.00 | 0.02 | -0.06 | 0.08 | -0.53 | 0.15 | -3.07 | -0.80 | 0.02 | -0.02 | 0.04 | -0.15 | 0.00 | 0.39 | 0.00 |
| 23.00 | 0.02 | -0.05 | 0.08 | -0.51 | 0.14 | -3.20 | -0.79 | 0.02 | -0.02 | 0.04 | -0.15 | 0.00 | 0.39 | 0.00 |
| 24.00 | 0.03 | -0.05 | 0.08 | -0.50 | 0.13 | -3.33 | -0.79 | 0.03 | -0.01 | 0.04 | -0.15 | 0.00 | 0.38 | 0.00 |
| 25.00 | 0.04 | -0.04 | 0.08 | -0.48 | 0.13 | -3.45 | -0.78 | 0.04 | -0.01 | 0.05 | -0.14 | 0.00 | 0.38 | 0.00 |
| 26.00 | 0.04 | -0.03 | 0.07 | -0.47 | 0.12 | -3.57 | -0.77 | 0.04 | -0.01 | 0.05 | -0.14 | 0.00 | 0.38 | 0.00 |
| 27.00 | 0.05 | -0.02 | 0.07 | -0.45 | 0.11 | -3.68 | -0.76 | 0.05 | -0.01 | 0.05 | -0.13 | 0.00 | 0.38 | 0.00 |
| 28.00 | 0.05 | -0.02 | 0.07 | -0.44 | 0.11 | -3.79 | -0.75 | 0.05 | 0.00 | 0.05 | -0.13 | 0.00 | 0.37 | 0.00 |
| 29.00 | 0.05 | -0.01 | 0.07 | -0.42 | 0.11 | -3.89 | -0.75 | 0.05 | 0.00 | 0.05 | -0.12 | 0.00 | 0.37 | 0.00 |
| 30.00 | 0.06 | 0.00 | 0.06 | -0.41 | 0.10 | -3.99 | -0.74 | 0.06 | 0.00 | 0.05 | -0.12 | 0.00 | 0.37 | 0.00 |
| 31.00 | 0.06 | 0.00 | 0.06 | -0.39 | 0.10 | -4.08 | -0.73 | 0.06 | 0.00 | 0.05 | -0.12 | 0.00 | 0.37 | 0.00 |
| 32.00 | 0.06 | 0.00 | 0.06 | -0.37 | 0.10 | -4.17 | -0.72 | 0.06 | 0.01 | 0.05 | -0.11 | 0.00 | 0.37 | 0.00 |
| 33.00 | 0.06 | 0.01 | 0.06 | -0.35 | 0.10 | -4.25 | -0.72 | 0.06 | 0.01 | 0.06 | -0.11 | 0.00 | 0.37 | 0.00 |
| 34.00 | 0.07 | 0.01 | 0.05 | -0.34 | 0.10 | -4.33 | -0.71 | 0.07 | 0.01 | 0.06 | -0.10 | 0.00 | 0.37 | 0.00 |
| 35.00 | 0.07 | 0.02 | 0.05 | -0.32 | 0.10 | -4.41 | -0.70 | 0.07 | 0.01 | 0.06 | -0.10 | 0.00 | 0.37 | 0.00 |
| 36.00 | 0.07 | 0.02 | 0.05 | -0.30 | 0.10 | -4.48 | -0.70 | 0.07 | 0.01 | 0.06 | -0.10 | 0.00 | 0.37 | 0.00 |
| 37.00 | 0.07 | 0.02 | 0.05 | -0.29 | 0.11 | -4.55 | -0.69 | 0.07 | 0.01 | 0.06 | -0.09 | 0.00 | 0.37 | 0.00 |
| 38.00 | 0.07 | 0.03 | 0.05 | -0.27 | 0.11 | -4.62 | -0.68 | 0.07 | 0.01 | 0.06 | -0.09 | 0.00 | 0.37 | 0.00 |
| 39.00 | 0.07 | 0.03 | 0.04 | -0.25 | 0.11 | -4.68 | -0.68 | 0.07 | 0.02 | 0.06 | -0.09 | 0.00 | 0.37 | 0.00 |
| 40.00 | 0.07 | 0.03 | 0.04 | -0.24 | 0.11 | -4.74 | -0.67 | 0.07 | 0.02 | 0.05 | -0.09 | 0.00 | 0.37 | 0.00 |
Figure 4. Responses to Government Spending Cuts of Different Magnitudes for Large South Currency Union Member in a Liquidity Trap
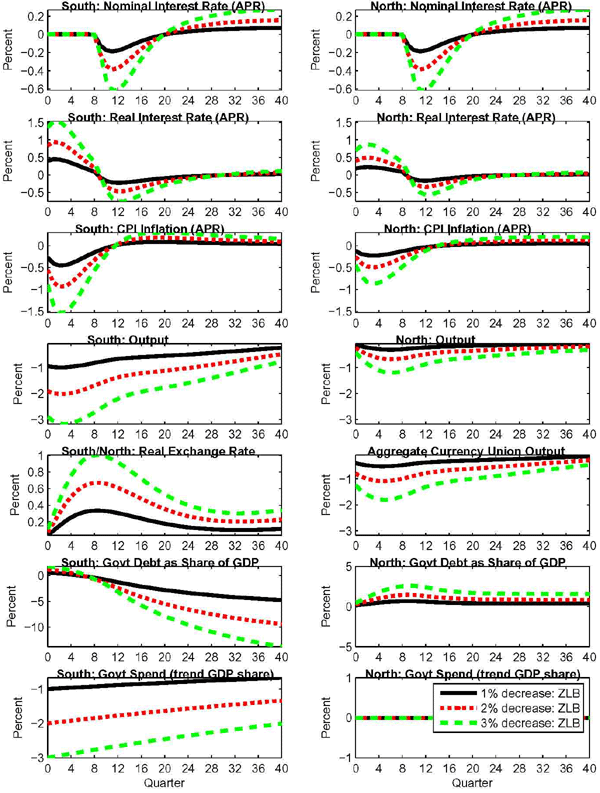
Data for Figure 4 - 1% Decrease ZLB
| Quarter | South: Nominal Interest Rate (annualised, in percentage points) | South: Real Interest Rate (annualised, in percentage points) | South: CPI Inflation (annualised, in percentage points) | South: Output (percent) | South: Real Exchange Rate (percent) | South: Govt Debt (Share of GDP, in percentage points) | South: Govt Spend (trend GDP share) | North: Nominal Interest Rate (annualised, in percentage points) | North: Real Interest Rate (annualised, in percentage points) | North: CPI Inflation (annualised, in percentage points) | North: Output (percent) | North: Aggregate Curr Union Output (percent) | North: Govt Debt (Share of GDP, in percentage points) | North: Govt Spend (trend GDP share) |
|---|---|---|---|---|---|---|---|---|---|---|---|---|---|---|
| 0.00 | 0.00 | 0.40 | -0.27 | -0.95 | 0.04 | 0.58 | -1.00 | 0.00 | 0.18 | -0.12 | -0.12 | -0.40 | 0.12 | 0.00 |
| 1.00 | 0.00 | 0.45 | -0.40 | -0.98 | 0.09 | 0.51 | -0.99 | 0.00 | 0.22 | -0.18 | -0.18 | -0.45 | 0.21 | 0.00 |
| 2.00 | 0.00 | 0.44 | -0.45 | -0.99 | 0.15 | 0.43 | -0.98 | 0.00 | 0.23 | -0.22 | -0.23 | -0.48 | 0.30 | 0.00 |
| 3.00 | 0.00 | 0.40 | -0.44 | -0.99 | 0.21 | 0.33 | -0.97 | 0.00 | 0.22 | -0.23 | -0.27 | -0.51 | 0.39 | 0.00 |
| 4.00 | 0.00 | 0.34 | -0.40 | -0.97 | 0.25 | 0.22 | -0.96 | 0.00 | 0.20 | -0.22 | -0.29 | -0.52 | 0.47 | 0.00 |
| 5.00 | 0.00 | 0.28 | -0.34 | -0.94 | 0.29 | 0.09 | -0.95 | 0.00 | 0.18 | -0.20 | -0.31 | -0.52 | 0.54 | 0.00 |
| 6.00 | 0.00 | 0.21 | -0.28 | -0.91 | 0.31 | -0.06 | -0.94 | 0.00 | 0.15 | -0.18 | -0.32 | -0.51 | 0.59 | 0.00 |
| 7.00 | 0.00 | 0.15 | -0.21 | -0.87 | 0.33 | -0.22 | -0.93 | 0.00 | 0.12 | -0.15 | -0.31 | -0.50 | 0.63 | 0.00 |
| 8.00 | 0.00 | 0.09 | -0.15 | -0.82 | 0.33 | -0.40 | -0.92 | 0.00 | 0.09 | -0.12 | -0.30 | -0.47 | 0.66 | 0.00 |
| 9.00 | -0.12 | -0.07 | -0.09 | -0.78 | 0.33 | -0.59 | -0.91 | -0.12 | -0.05 | -0.10 | -0.28 | -0.45 | 0.67 | 0.00 |
| 10.00 | -0.18 | -0.17 | -0.05 | -0.74 | 0.33 | -0.81 | -0.90 | -0.18 | -0.13 | -0.07 | -0.26 | -0.42 | 0.65 | 0.00 |
| 11.00 | -0.19 | -0.21 | -0.01 | -0.70 | 0.32 | -1.03 | -0.90 | -0.19 | -0.16 | -0.05 | -0.24 | -0.39 | 0.62 | 0.00 |
| 12.00 | -0.18 | -0.23 | 0.02 | -0.67 | 0.31 | -1.26 | -0.89 | -0.18 | -0.16 | -0.03 | -0.22 | -0.37 | 0.58 | 0.00 |
| 13.00 | -0.16 | -0.22 | 0.05 | -0.65 | 0.29 | -1.49 | -0.88 | -0.16 | -0.15 | -0.02 | -0.21 | -0.36 | 0.55 | 0.00 |
| 14.00 | -0.13 | -0.20 | 0.06 | -0.63 | 0.27 | -1.70 | -0.87 | -0.13 | -0.14 | 0.00 | -0.20 | -0.34 | 0.51 | 0.00 |
| 15.00 | -0.10 | -0.18 | 0.08 | -0.61 | 0.26 | -1.91 | -0.86 | -0.10 | -0.12 | 0.01 | -0.19 | -0.33 | 0.49 | 0.00 |
| 16.00 | -0.08 | -0.16 | 0.08 | -0.60 | 0.24 | -2.10 | -0.85 | -0.08 | -0.10 | 0.01 | -0.18 | -0.32 | 0.46 | 0.00 |
| 17.00 | -0.05 | -0.14 | 0.09 | -0.58 | 0.22 | -2.28 | -0.84 | -0.05 | -0.08 | 0.02 | -0.18 | -0.31 | 0.44 | 0.00 |
| 18.00 | -0.03 | -0.12 | 0.09 | -0.57 | 0.21 | -2.46 | -0.83 | -0.03 | -0.06 | 0.02 | -0.17 | -0.31 | 0.43 | 0.00 |
| 19.00 | -0.02 | -0.10 | 0.09 | -0.56 | 0.19 | -2.62 | -0.83 | -0.02 | -0.05 | 0.03 | -0.17 | -0.30 | 0.42 | 0.00 |
| 20.00 | 0.00 | -0.09 | 0.09 | -0.55 | 0.18 | -2.78 | -0.82 | 0.00 | -0.04 | 0.03 | -0.16 | -0.29 | 0.41 | 0.00 |
| 21.00 | 0.01 | -0.08 | 0.09 | -0.54 | 0.16 | -2.93 | -0.81 | 0.01 | -0.03 | 0.04 | -0.16 | -0.29 | 0.40 | 0.00 |
| 22.00 | 0.02 | -0.06 | 0.08 | -0.53 | 0.15 | -3.07 | -0.80 | 0.02 | -0.02 | 0.04 | -0.15 | -0.28 | 0.39 | 0.00 |
| 23.00 | 0.02 | -0.05 | 0.08 | -0.51 | 0.14 | -3.20 | -0.79 | 0.02 | -0.02 | 0.04 | -0.15 | -0.27 | 0.39 | 0.00 |
| 24.00 | 0.03 | -0.05 | 0.08 | -0.50 | 0.13 | -3.33 | -0.79 | 0.03 | -0.01 | 0.04 | -0.15 | -0.26 | 0.38 | 0.00 |
| 25.00 | 0.04 | -0.04 | 0.08 | -0.48 | 0.13 | -3.45 | -0.78 | 0.04 | -0.01 | 0.05 | -0.14 | -0.26 | 0.38 | 0.00 |
| 26.00 | 0.04 | -0.03 | 0.07 | -0.47 | 0.12 | -3.57 | -0.77 | 0.04 | -0.01 | 0.05 | -0.14 | -0.25 | 0.38 | 0.00 |
| 27.00 | 0.05 | -0.02 | 0.07 | -0.45 | 0.11 | -3.68 | -0.76 | 0.05 | -0.01 | 0.05 | -0.13 | -0.24 | 0.38 | 0.00 |
| 28.00 | 0.05 | -0.02 | 0.07 | -0.44 | 0.11 | -3.79 | -0.75 | 0.05 | 0.00 | 0.05 | -0.13 | -0.23 | 0.37 | 0.00 |
| 29.00 | 0.05 | -0.01 | 0.07 | -0.42 | 0.11 | -3.89 | -0.75 | 0.05 | 0.00 | 0.05 | -0.12 | -0.22 | 0.37 | 0.00 |
| 30.00 | 0.06 | 0.00 | 0.06 | -0.41 | 0.10 | -3.99 | -0.74 | 0.06 | 0.00 | 0.05 | -0.12 | -0.21 | 0.37 | 0.00 |
| 31.00 | 0.06 | 0.00 | 0.06 | -0.39 | 0.10 | -4.08 | -0.73 | 0.06 | 0.00 | 0.05 | -0.12 | -0.21 | 0.37 | 0.00 |
| 32.00 | 0.06 | 0.00 | 0.06 | -0.37 | 0.10 | -4.17 | -0.72 | 0.06 | 0.01 | 0.05 | -0.11 | -0.20 | 0.37 | 0.00 |
| 33.00 | 0.06 | 0.01 | 0.06 | -0.35 | 0.10 | -4.25 | -0.72 | 0.06 | 0.01 | 0.06 | -0.11 | -0.19 | 0.37 | 0.00 |
| 34.00 | 0.07 | 0.01 | 0.05 | -0.34 | 0.10 | -4.33 | -0.71 | 0.07 | 0.01 | 0.06 | -0.10 | -0.18 | 0.37 | 0.00 |
| 35.00 | 0.07 | 0.02 | 0.05 | -0.32 | 0.10 | -4.41 | -0.70 | 0.07 | 0.01 | 0.06 | -0.10 | -0.17 | 0.37 | 0.00 |
| 36.00 | 0.07 | 0.02 | 0.05 | -0.30 | 0.10 | -4.48 | -0.70 | 0.07 | 0.01 | 0.06 | -0.10 | -0.17 | 0.37 | 0.00 |
| 37.00 | 0.07 | 0.02 | 0.05 | -0.29 | 0.11 | -4.55 | -0.69 | 0.07 | 0.01 | 0.06 | -0.09 | -0.16 | 0.37 | 0.00 |
| 38.00 | 0.07 | 0.03 | 0.05 | -0.27 | 0.11 | -4.62 | -0.68 | 0.07 | 0.01 | 0.06 | -0.09 | -0.15 | 0.37 | 0.00 |
| 39.00 | 0.07 | 0.03 | 0.04 | -0.25 | 0.11 | -4.68 | -0.68 | 0.07 | 0.02 | 0.06 | -0.09 | -0.14 | 0.37 | 0.00 |
| 40.00 | 0.07 | 0.03 | 0.04 | -0.24 | 0.11 | -4.74 | -0.67 | 0.07 | 0.02 | 0.05 | -0.09 | -0.14 | 0.37 | 0.00 |
Data for Figure 4 - 2% Decrease ZLB
| Quarter | South: Nominal Interest Rate (annualised, in percentage points) | South: Real Interest Rate (annualised, in percentage points) | South: CPI Inflation (annualised, in percentage points) | South: Output (percent) | South: Real Exchange Rate (percent) | South: Govt Debt (Share of GDP, in percentage points) | South: Govt Spend (trend GDP share) | North: Nominal Interest Rate (annualised, in percentage points) | North: Real Interest Rate (annualised, in percentage points) | North: CPI Inflation (annualised, in percentage points) | North: Output (percent) | North: Aggregate Curr Union Output (percent) | North: Govt Debt (Share of GDP, in percentage points) | North: Govt Spend (trend GDP share) |
|---|---|---|---|---|---|---|---|---|---|---|---|---|---|---|
| 0.00 | 0.00 | 0.84 | -0.56 | -1.91 | 0.08 | 1.18 | -2.00 | 0.00 | 0.40 | -0.25 | -0.25 | -0.81 | 0.25 | 0.00 |
| 1.00 | 0.00 | 0.94 | -0.84 | -1.99 | 0.19 | 1.04 | -1.98 | 0.00 | 0.47 | -0.40 | -0.38 | -0.92 | 0.45 | 0.00 |
| 2.00 | 0.00 | 0.92 | -0.94 | -2.02 | 0.30 | 0.90 | -1.96 | 0.00 | 0.49 | -0.47 | -0.49 | -1.00 | 0.65 | 0.00 |
| 3.00 | 0.00 | 0.84 | -0.92 | -2.02 | 0.41 | 0.73 | -1.94 | 0.00 | 0.48 | -0.49 | -0.58 | -1.06 | 0.84 | 0.00 |
| 4.00 | 0.00 | 0.73 | -0.84 | -1.99 | 0.50 | 0.52 | -1.92 | 0.00 | 0.44 | -0.48 | -0.64 | -1.09 | 1.02 | 0.00 |
| 5.00 | 0.00 | 0.59 | -0.73 | -1.93 | 0.57 | 0.27 | -1.90 | 0.00 | 0.39 | -0.44 | -0.67 | -1.09 | 1.16 | 0.00 |
| 6.00 | 0.00 | 0.45 | -0.59 | -1.86 | 0.62 | -0.02 | -1.88 | 0.00 | 0.33 | -0.39 | -0.68 | -1.08 | 1.28 | 0.00 |
| 7.00 | 0.00 | 0.32 | -0.45 | -1.78 | 0.65 | -0.34 | -1.86 | 0.00 | 0.27 | -0.33 | -0.67 | -1.04 | 1.37 | 0.00 |
| 8.00 | -0.01 | 0.20 | -0.32 | -1.70 | 0.67 | -0.68 | -1.85 | 0.00 | 0.20 | -0.27 | -0.65 | -1.00 | 1.43 | 0.00 |
| 9.00 | -0.21 | -0.11 | -0.21 | -1.61 | 0.67 | -1.06 | -1.83 | -0.21 | -0.06 | -0.21 | -0.61 | -0.94 | 1.46 | 0.00 |
| 10.00 | -0.35 | -0.32 | -0.11 | -1.52 | 0.66 | -1.48 | -1.81 | -0.35 | -0.24 | -0.15 | -0.56 | -0.88 | 1.43 | 0.00 |
| 11.00 | -0.39 | -0.43 | -0.02 | -1.44 | 0.64 | -1.94 | -1.79 | -0.39 | -0.32 | -0.10 | -0.52 | -0.83 | 1.37 | 0.00 |
| 12.00 | -0.37 | -0.47 | 0.04 | -1.38 | 0.61 | -2.40 | -1.77 | -0.37 | -0.34 | -0.06 | -0.49 | -0.78 | 1.29 | 0.00 |
| 13.00 | -0.33 | -0.46 | 0.09 | -1.33 | 0.58 | -2.85 | -1.76 | -0.33 | -0.33 | -0.03 | -0.46 | -0.75 | 1.22 | 0.00 |
| 14.00 | -0.27 | -0.43 | 0.13 | -1.29 | 0.55 | -3.29 | -1.74 | -0.27 | -0.29 | 0.00 | -0.43 | -0.72 | 1.15 | 0.00 |
| 15.00 | -0.22 | -0.39 | 0.15 | -1.25 | 0.51 | -3.70 | -1.72 | -0.22 | -0.25 | 0.02 | -0.41 | -0.69 | 1.09 | 0.00 |
| 16.00 | -0.16 | -0.34 | 0.17 | -1.22 | 0.48 | -4.09 | -1.70 | -0.16 | -0.21 | 0.03 | -0.40 | -0.67 | 1.03 | 0.00 |
| 17.00 | -0.11 | -0.30 | 0.18 | -1.20 | 0.44 | -4.46 | -1.69 | -0.11 | -0.17 | 0.05 | -0.38 | -0.65 | 0.99 | 0.00 |
| 18.00 | -0.07 | -0.25 | 0.18 | -1.17 | 0.41 | -4.81 | -1.67 | -0.07 | -0.13 | 0.06 | -0.37 | -0.64 | 0.96 | 0.00 |
| 19.00 | -0.03 | -0.22 | 0.19 | -1.15 | 0.38 | -5.14 | -1.65 | -0.03 | -0.11 | 0.07 | -0.36 | -0.62 | 0.93 | 0.00 |
| 20.00 | 0.00 | -0.18 | 0.18 | -1.12 | 0.35 | -5.46 | -1.64 | 0.00 | -0.08 | 0.07 | -0.35 | -0.61 | 0.91 | 0.00 |
| 21.00 | 0.02 | -0.16 | 0.18 | -1.10 | 0.33 | -5.75 | -1.62 | 0.02 | -0.06 | 0.08 | -0.34 | -0.59 | 0.89 | 0.00 |
| 22.00 | 0.04 | -0.13 | 0.18 | -1.07 | 0.31 | -6.04 | -1.60 | 0.04 | -0.05 | 0.08 | -0.33 | -0.58 | 0.88 | 0.00 |
| 23.00 | 0.06 | -0.11 | 0.17 | -1.05 | 0.29 | -6.31 | -1.59 | 0.06 | -0.04 | 0.09 | -0.32 | -0.56 | 0.87 | 0.00 |
| 24.00 | 0.07 | -0.09 | 0.17 | -1.02 | 0.27 | -6.57 | -1.57 | 0.07 | -0.03 | 0.09 | -0.31 | -0.55 | 0.86 | 0.00 |
| 25.00 | 0.08 | -0.07 | 0.16 | -0.99 | 0.25 | -6.81 | -1.56 | 0.08 | -0.02 | 0.10 | -0.30 | -0.53 | 0.86 | 0.00 |
| 26.00 | 0.09 | -0.06 | 0.16 | -0.96 | 0.24 | -7.05 | -1.54 | 0.09 | -0.01 | 0.10 | -0.29 | -0.51 | 0.85 | 0.00 |
| 27.00 | 0.10 | -0.04 | 0.15 | -0.93 | 0.23 | -7.27 | -1.52 | 0.10 | -0.01 | 0.11 | -0.28 | -0.50 | 0.84 | 0.00 |
| 28.00 | 0.11 | -0.03 | 0.14 | -0.89 | 0.22 | -7.48 | -1.51 | 0.11 | 0.00 | 0.11 | -0.27 | -0.48 | 0.84 | 0.00 |
| 29.00 | 0.12 | -0.02 | 0.14 | -0.86 | 0.21 | -7.69 | -1.49 | 0.12 | 0.00 | 0.11 | -0.26 | -0.46 | 0.84 | 0.00 |
| 30.00 | 0.12 | -0.01 | 0.13 | -0.83 | 0.21 | -7.88 | -1.48 | 0.12 | 0.01 | 0.11 | -0.26 | -0.45 | 0.83 | 0.00 |
| 31.00 | 0.13 | 0.00 | 0.13 | -0.79 | 0.20 | -8.07 | -1.46 | 0.13 | 0.01 | 0.12 | -0.25 | -0.43 | 0.83 | 0.00 |
| 32.00 | 0.13 | 0.01 | 0.13 | -0.76 | 0.20 | -8.24 | -1.45 | 0.13 | 0.02 | 0.12 | -0.24 | -0.41 | 0.83 | 0.00 |
| 33.00 | 0.14 | 0.02 | 0.12 | -0.72 | 0.20 | -8.41 | -1.44 | 0.14 | 0.02 | 0.12 | -0.23 | -0.40 | 0.83 | 0.00 |
| 34.00 | 0.14 | 0.03 | 0.12 | -0.69 | 0.20 | -8.57 | -1.42 | 0.14 | 0.02 | 0.12 | -0.22 | -0.38 | 0.83 | 0.00 |
| 35.00 | 0.15 | 0.04 | 0.11 | -0.66 | 0.20 | -8.73 | -1.41 | 0.15 | 0.03 | 0.12 | -0.22 | -0.36 | 0.83 | 0.00 |
| 36.00 | 0.15 | 0.04 | 0.11 | -0.62 | 0.21 | -8.87 | -1.39 | 0.15 | 0.03 | 0.12 | -0.21 | -0.35 | 0.83 | 0.00 |
| 37.00 | 0.15 | 0.05 | 0.10 | -0.59 | 0.21 | -9.01 | -1.38 | 0.15 | 0.03 | 0.12 | -0.20 | -0.33 | 0.83 | 0.00 |
| 38.00 | 0.15 | 0.06 | 0.10 | -0.55 | 0.22 | -9.14 | -1.37 | 0.15 | 0.03 | 0.12 | -0.20 | -0.31 | 0.83 | 0.00 |
| 39.00 | 0.15 | 0.06 | 0.10 | -0.52 | 0.22 | -9.27 | -1.35 | 0.15 | 0.04 | 0.12 | -0.19 | -0.30 | 0.83 | 0.00 |
| 40 | 0.15 | 0.06 | 0.09 | -0.49 | 0.23 | -9.38 | -1.337943517 | 0.15 | 0.04 | 0.12 | -0.18 | -0.29 | 0.83 | 0 |
Data for Figure 4 - 3% Decrease ZLB
| Quarter | South: Nominal Interest Rate (annualised, in percentage points) | South: Real Interest Rate (annualised, in percentage points) | South: CPI Inflation (annualised, in percentage points) | South: Output (percent) | South: Real Exchange Rate (percent) | South: Govt Debt (Share of GDP, in percentage points) | South: Govt Spend (trend GDP share) | North: Nominal Interest Rate (annualised, in percentage points) | North: Real Interest Rate (annualised, in percentage points) | North: CPI Inflation (annualised, in percentage points) | North: Output (percent) | North: Aggregate Curr Union Output (percent) | North: Govt Debt (Share of GDP, in percentage points) | North: Govt Spend (trend GDP share) |
|---|---|---|---|---|---|---|---|---|---|---|---|---|---|---|
| 0.00 | 0.00 | 1.36 | -0.90 | -2.90 | 0.11 | 1.81 | -3.00 | 0.00 | 0.70 | -0.44 | -0.42 | -1.25 | 0.42 | 0.00 |
| 1.00 | 0.00 | 1.53 | -1.36 | -3.06 | 0.28 | 1.66 | -2.97 | 0.00 | 0.83 | -0.70 | -0.65 | -1.46 | 0.78 | 0.00 |
| 2.00 | 0.00 | 1.52 | -1.53 | -3.15 | 0.45 | 1.50 | -2.94 | 0.00 | 0.87 | -0.83 | -0.85 | -1.62 | 1.14 | 0.00 |
| 3.00 | 0.00 | 1.40 | -1.52 | -3.17 | 0.62 | 1.30 | -2.91 | 0.00 | 0.85 | -0.87 | -1.00 | -1.73 | 1.48 | 0.00 |
| 4.00 | 0.00 | 1.21 | -1.40 | -3.14 | 0.75 | 1.04 | -2.88 | 0.00 | 0.78 | -0.85 | -1.11 | -1.79 | 1.78 | 0.00 |
| 5.00 | 0.00 | 1.00 | -1.21 | -3.07 | 0.86 | 0.71 | -2.85 | 0.00 | 0.69 | -0.78 | -1.18 | -1.81 | 2.05 | 0.00 |
| 6.00 | 0.00 | 0.77 | -1.00 | -2.97 | 0.94 | 0.32 | -2.82 | 0.00 | 0.59 | -0.69 | -1.20 | -1.79 | 2.26 | 0.00 |
| 7.00 | 0.00 | 0.56 | -0.77 | -2.86 | 0.98 | -0.13 | -2.80 | 0.00 | 0.48 | -0.59 | -1.19 | -1.75 | 2.42 | 0.00 |
| 8.00 | -0.01 | 0.37 | -0.56 | -2.72 | 1.00 | -0.63 | -2.77 | 0.00 | 0.37 | -0.48 | -1.15 | -1.67 | 2.53 | 0.00 |
| 9.00 | -0.21 | -0.01 | -0.37 | -2.58 | 1.00 | -1.18 | -2.74 | -0.21 | 0.06 | -0.37 | -1.09 | -1.58 | 2.60 | 0.00 |
| 10.00 | -0.50 | -0.44 | -0.20 | -2.44 | 0.99 | -1.79 | -2.71 | -0.50 | -0.32 | -0.27 | -1.01 | -1.49 | 2.59 | 0.00 |
| 11.00 | -0.61 | -0.66 | -0.06 | -2.31 | 0.96 | -2.47 | -2.69 | -0.61 | -0.50 | -0.19 | -0.93 | -1.39 | 2.50 | 0.00 |
| 12.00 | -0.61 | -0.75 | 0.05 | -2.21 | 0.92 | -3.16 | -2.66 | -0.61 | -0.56 | -0.11 | -0.87 | -1.31 | 2.38 | 0.00 |
| 13.00 | -0.55 | -0.75 | 0.14 | -2.12 | 0.87 | -3.86 | -2.63 | -0.55 | -0.55 | -0.05 | -0.81 | -1.25 | 2.25 | 0.00 |
| 14.00 | -0.46 | -0.71 | 0.20 | -2.04 | 0.82 | -4.52 | -2.61 | -0.46 | -0.50 | 0.00 | -0.76 | -1.19 | 2.12 | 0.00 |
| 15.00 | -0.37 | -0.64 | 0.24 | -1.98 | 0.77 | -5.16 | -2.58 | -0.37 | -0.43 | 0.04 | -0.73 | -1.15 | 2.02 | 0.00 |
| 16.00 | -0.27 | -0.56 | 0.27 | -1.93 | 0.72 | -5.76 | -2.55 | -0.27 | -0.36 | 0.07 | -0.70 | -1.11 | 1.92 | 0.00 |
| 17.00 | -0.18 | -0.49 | 0.29 | -1.89 | 0.67 | -6.33 | -2.53 | -0.18 | -0.29 | 0.09 | -0.67 | -1.08 | 1.85 | 0.00 |
| 18.00 | -0.11 | -0.42 | 0.30 | -1.85 | 0.62 | -6.87 | -2.50 | -0.11 | -0.23 | 0.11 | -0.65 | -1.05 | 1.79 | 0.00 |
| 19.00 | -0.05 | -0.35 | 0.31 | -1.81 | 0.57 | -7.37 | -2.48 | -0.05 | -0.18 | 0.13 | -0.63 | -1.02 | 1.74 | 0.00 |
| 20.00 | 0.01 | -0.30 | 0.30 | -1.77 | 0.53 | -7.85 | -2.45 | 0.01 | -0.14 | 0.14 | -0.61 | -1.00 | 1.70 | 0.00 |
| 21.00 | 0.05 | -0.25 | 0.30 | -1.73 | 0.49 | -8.30 | -2.43 | 0.05 | -0.11 | 0.15 | -0.59 | -0.97 | 1.67 | 0.00 |
| 22.00 | 0.08 | -0.20 | 0.29 | -1.69 | 0.46 | -8.73 | -2.40 | 0.08 | -0.08 | 0.16 | -0.58 | -0.95 | 1.65 | 0.00 |
| 23.00 | 0.11 | -0.17 | 0.29 | -1.65 | 0.43 | -9.14 | -2.38 | 0.11 | -0.06 | 0.16 | -0.56 | -0.92 | 1.63 | 0.00 |
| 24.00 | 0.14 | -0.14 | 0.28 | -1.60 | 0.40 | -9.52 | -2.36 | 0.14 | -0.04 | 0.17 | -0.54 | -0.90 | 1.62 | 0.00 |
| 25.00 | 0.16 | -0.11 | 0.27 | -1.56 | 0.38 | -9.90 | -2.33 | 0.16 | -0.03 | 0.18 | -0.52 | -0.87 | 1.60 | 0.00 |
| 26.00 | 0.17 | -0.08 | 0.26 | -1.51 | 0.36 | -10.25 | -2.31 | 0.17 | -0.02 | 0.18 | -0.51 | -0.84 | 1.59 | 0.00 |
| 27.00 | 0.19 | -0.06 | 0.25 | -1.46 | 0.34 | -10.59 | -2.29 | 0.19 | 0.00 | 0.19 | -0.49 | -0.81 | 1.59 | 0.00 |
| 28.00 | 0.20 | -0.04 | 0.25 | -1.41 | 0.33 | -10.91 | -2.26 | 0.20 | 0.01 | 0.19 | -0.47 | -0.78 | 1.58 | 0.00 |
| 29.00 | 0.21 | -0.02 | 0.24 | -1.35 | 0.32 | -11.21 | -2.24 | 0.21 | 0.01 | 0.20 | -0.46 | -0.76 | 1.57 | 0.00 |
| 30.00 | 0.22 | 0.00 | 0.23 | -1.30 | 0.31 | -11.51 | -2.22 | 0.22 | 0.02 | 0.20 | -0.44 | -0.73 | 1.57 | 0.00 |
| 31.00 | 0.23 | 0.02 | 0.22 | -1.25 | 0.31 | -11.78 | -2.20 | 0.23 | 0.03 | 0.20 | -0.43 | -0.70 | 1.56 | 0.00 |
| 32.00 | 0.24 | 0.03 | 0.22 | -1.19 | 0.30 | -12.05 | -2.17 | 0.24 | 0.04 | 0.20 | -0.41 | -0.67 | 1.56 | 0.00 |
| 33.00 | 0.25 | 0.05 | 0.21 | -1.14 | 0.30 | -12.30 | -2.15 | 0.25 | 0.04 | 0.20 | -0.40 | -0.65 | 1.56 | 0.00 |
| 34.00 | 0.25 | 0.06 | 0.20 | -1.08 | 0.30 | -12.54 | -2.13 | 0.25 | 0.05 | 0.21 | -0.38 | -0.62 | 1.56 | 0.00 |
| 35.00 | 0.26 | 0.07 | 0.19 | -1.03 | 0.31 | -12.77 | -2.11 | 0.26 | 0.05 | 0.21 | -0.37 | -0.59 | 1.56 | 0.00 |
| 36.00 | 0.26 | 0.08 | 0.19 | -0.98 | 0.31 | -12.99 | -2.09 | 0.26 | 0.06 | 0.20 | -0.36 | -0.57 | 1.55 | 0.00 |
| 37.00 | 0.27 | 0.09 | 0.18 | -0.93 | 0.32 | -13.20 | -2.07 | 0.27 | 0.06 | 0.20 | -0.35 | -0.54 | 1.55 | 0.00 |
| 38.00 | 0.27 | 0.10 | 0.17 | -0.87 | 0.32 | -13.40 | -2.05 | 0.27 | 0.07 | 0.20 | -0.34 | -0.52 | 1.55 | 0.00 |
| 39.00 | 0.27 | 0.11 | 0.17 | -0.82 | 0.33 | -13.58 | -2.03 | 0.27 | 0.07 | 0.20 | -0.33 | -0.49 | 1.55 | 0.00 |
| 40.00 | 0.27 | 0.11 | 0.16 | -0.77 | 0.34 | -13.76 | -2.01 | 0.27 | 0.07 | 0.20 | -0.31 | -0.47 | 1.55 | 0.00 |
Figure 5. Responses to Government Spending Cut in Large South Currency Union Member With and Without North Spending Adjustment
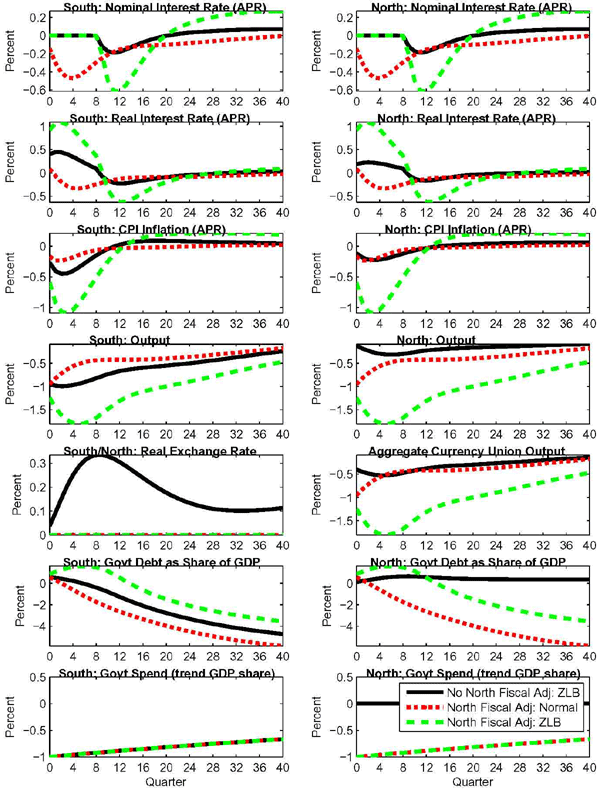
Data for Figure 5 - No North Fiscal Adj ZLB
| Quarter | South: Nominal Interest Rate (annualised, in percentage points) | South: Real Interest Rate (annualised, in percentage points) | South: CPI Inflation (annualised, in percentage points) | South: Output (percent) | South: Real Exchange Rate (percent) | South: Govt Debt (Share of GDP, in percentage points) | South: Govt Spend (trend GDP share) | North: Nominal Interest Rate (annualised, in percentage points) | North: Real Interest Rate (annualised, in percentage points) | North: CPI Inflation (annualised, in percentage points) | North: Output (percent) | North: Aggregate Curr Union Output (percent) | North: Govt Debt (Share of GDP, in percentage points) | North: Govt Spend (trend GDP share) |
|---|---|---|---|---|---|---|---|---|---|---|---|---|---|---|
| 0.00 | 0.00 | 0.40 | -0.27 | -0.95 | 0.04 | 0.58 | -1.00 | 0.00 | 0.18 | -0.12 | -0.12 | -0.40 | 0.12 | 0.00 |
| 1.00 | 0.00 | 0.45 | -0.40 | -0.98 | 0.09 | 0.51 | -0.99 | 0.00 | 0.22 | -0.18 | -0.18 | -0.45 | 0.21 | 0.00 |
| 2.00 | 0.00 | 0.44 | -0.45 | -0.99 | 0.15 | 0.43 | -0.98 | 0.00 | 0.23 | -0.22 | -0.23 | -0.48 | 0.30 | 0.00 |
| 3.00 | 0.00 | 0.40 | -0.44 | -0.99 | 0.21 | 0.33 | -0.97 | 0.00 | 0.22 | -0.23 | -0.27 | -0.51 | 0.39 | 0.00 |
| 4.00 | 0.00 | 0.34 | -0.40 | -0.97 | 0.25 | 0.22 | -0.96 | 0.00 | 0.20 | -0.22 | -0.29 | -0.52 | 0.47 | 0.00 |
| 5.00 | 0.00 | 0.28 | -0.34 | -0.94 | 0.29 | 0.09 | -0.95 | 0.00 | 0.18 | -0.20 | -0.31 | -0.52 | 0.54 | 0.00 |
| 6.00 | 0.00 | 0.21 | -0.28 | -0.91 | 0.31 | -0.06 | -0.94 | 0.00 | 0.15 | -0.18 | -0.32 | -0.51 | 0.59 | 0.00 |
| 7.00 | 0.00 | 0.15 | -0.21 | -0.87 | 0.33 | -0.22 | -0.93 | 0.00 | 0.12 | -0.15 | -0.31 | -0.50 | 0.63 | 0.00 |
| 8.00 | 0.00 | 0.09 | -0.15 | -0.82 | 0.33 | -0.40 | -0.92 | 0.00 | 0.09 | -0.12 | -0.30 | -0.47 | 0.66 | 0.00 |
| 9.00 | -0.12 | -0.07 | -0.09 | -0.78 | 0.33 | -0.59 | -0.91 | -0.12 | -0.05 | -0.10 | -0.28 | -0.45 | 0.67 | 0.00 |
| 10.00 | -0.18 | -0.17 | -0.05 | -0.74 | 0.33 | -0.81 | -0.90 | -0.18 | -0.13 | -0.07 | -0.26 | -0.42 | 0.65 | 0.00 |
| 11.00 | -0.19 | -0.21 | -0.01 | -0.70 | 0.32 | -1.03 | -0.90 | -0.19 | -0.16 | -0.05 | -0.24 | -0.39 | 0.62 | 0.00 |
| 12.00 | -0.18 | -0.23 | 0.02 | -0.67 | 0.31 | -1.26 | -0.89 | -0.18 | -0.16 | -0.03 | -0.22 | -0.37 | 0.58 | 0.00 |
| 13.00 | -0.16 | -0.22 | 0.05 | -0.65 | 0.29 | -1.49 | -0.88 | -0.16 | -0.15 | -0.02 | -0.21 | -0.36 | 0.55 | 0.00 |
| 14.00 | -0.13 | -0.20 | 0.06 | -0.63 | 0.27 | -1.70 | -0.87 | -0.13 | -0.14 | 0.00 | -0.20 | -0.34 | 0.51 | 0.00 |
| 15.00 | -0.10 | -0.18 | 0.08 | -0.61 | 0.26 | -1.91 | -0.86 | -0.10 | -0.12 | 0.01 | -0.19 | -0.33 | 0.49 | 0.00 |
| 16.00 | -0.08 | -0.16 | 0.08 | -0.60 | 0.24 | -2.10 | -0.85 | -0.08 | -0.10 | 0.01 | -0.18 | -0.32 | 0.46 | 0.00 |
| 17.00 | -0.05 | -0.14 | 0.09 | -0.58 | 0.22 | -2.28 | -0.84 | -0.05 | -0.08 | 0.02 | -0.18 | -0.31 | 0.44 | 0.00 |
| 18.00 | -0.03 | -0.12 | 0.09 | -0.57 | 0.21 | -2.46 | -0.83 | -0.03 | -0.06 | 0.02 | -0.17 | -0.31 | 0.43 | 0.00 |
| 19.00 | -0.02 | -0.10 | 0.09 | -0.56 | 0.19 | -2.62 | -0.83 | -0.02 | -0.05 | 0.03 | -0.17 | -0.30 | 0.42 | 0.00 |
| 20.00 | 0.00 | -0.09 | 0.09 | -0.55 | 0.18 | -2.78 | -0.82 | 0.00 | -0.04 | 0.03 | -0.16 | -0.29 | 0.41 | 0.00 |
| 21.00 | 0.01 | -0.08 | 0.09 | -0.54 | 0.16 | -2.93 | -0.81 | 0.01 | -0.03 | 0.04 | -0.16 | -0.29 | 0.40 | 0.00 |
| 22.00 | 0.02 | -0.06 | 0.08 | -0.53 | 0.15 | -3.07 | -0.80 | 0.02 | -0.02 | 0.04 | -0.15 | -0.28 | 0.39 | 0.00 |
| 23.00 | 0.02 | -0.05 | 0.08 | -0.51 | 0.14 | -3.20 | -0.79 | 0.02 | -0.02 | 0.04 | -0.15 | -0.27 | 0.39 | 0.00 |
| 24.00 | 0.03 | -0.05 | 0.08 | -0.50 | 0.13 | -3.33 | -0.79 | 0.03 | -0.01 | 0.04 | -0.15 | -0.26 | 0.38 | 0.00 |
| 25.00 | 0.04 | -0.04 | 0.08 | -0.48 | 0.13 | -3.45 | -0.78 | 0.04 | -0.01 | 0.05 | -0.14 | -0.26 | 0.38 | 0.00 |
| 26.00 | 0.04 | -0.03 | 0.07 | -0.47 | 0.12 | -3.57 | -0.77 | 0.04 | -0.01 | 0.05 | -0.14 | -0.25 | 0.38 | 0.00 |
| 27.00 | 0.05 | -0.02 | 0.07 | -0.45 | 0.11 | -3.68 | -0.76 | 0.05 | -0.01 | 0.05 | -0.13 | -0.24 | 0.38 | 0.00 |
| 28.00 | 0.05 | -0.02 | 0.07 | -0.44 | 0.11 | -3.79 | -0.75 | 0.05 | 0.00 | 0.05 | -0.13 | -0.23 | 0.37 | 0.00 |
| 29.00 | 0.05 | -0.01 | 0.07 | -0.42 | 0.11 | -3.89 | -0.75 | 0.05 | 0.00 | 0.05 | -0.12 | -0.22 | 0.37 | 0.00 |
| 30.00 | 0.06 | 0.00 | 0.06 | -0.41 | 0.10 | -3.99 | -0.74 | 0.06 | 0.00 | 0.05 | -0.12 | -0.21 | 0.37 | 0.00 |
| 31.00 | 0.06 | 0.00 | 0.06 | -0.39 | 0.10 | -4.08 | -0.73 | 0.06 | 0.00 | 0.05 | -0.12 | -0.21 | 0.37 | 0.00 |
| 32.00 | 0.06 | 0.00 | 0.06 | -0.37 | 0.10 | -4.17 | -0.72 | 0.06 | 0.01 | 0.05 | -0.11 | -0.20 | 0.37 | 0.00 |
| 33.00 | 0.06 | 0.01 | 0.06 | -0.35 | 0.10 | -4.25 | -0.72 | 0.06 | 0.01 | 0.06 | -0.11 | -0.19 | 0.37 | 0.00 |
| 34.00 | 0.07 | 0.01 | 0.05 | -0.34 | 0.10 | -4.33 | -0.71 | 0.07 | 0.01 | 0.06 | -0.10 | -0.18 | 0.37 | 0.00 |
| 35.00 | 0.07 | 0.02 | 0.05 | -0.32 | 0.10 | -4.41 | -0.70 | 0.07 | 0.01 | 0.06 | -0.10 | -0.17 | 0.37 | 0.00 |
| 36.00 | 0.07 | 0.02 | 0.05 | -0.30 | 0.10 | -4.48 | -0.70 | 0.07 | 0.01 | 0.06 | -0.10 | -0.17 | 0.37 | 0.00 |
| 37.00 | 0.07 | 0.02 | 0.05 | -0.29 | 0.11 | -4.55 | -0.69 | 0.07 | 0.01 | 0.06 | -0.09 | -0.16 | 0.37 | 0.00 |
| 38.00 | 0.07 | 0.03 | 0.05 | -0.27 | 0.11 | -4.62 | -0.68 | 0.07 | 0.01 | 0.06 | -0.09 | -0.15 | 0.37 | 0.00 |
| 39.00 | 0.07 | 0.03 | 0.04 | -0.25 | 0.11 | -4.68 | -0.68 | 0.07 | 0.02 | 0.06 | -0.09 | -0.14 | 0.37 | 0.00 |
| 40.00 | 0.07 | 0.03 | 0.04 | -0.24 | 0.11 | -4.74 | -0.67 | 0.07 | 0.02 | 0.05 | -0.09 | -0.14 | 0.37 | 0.00 |
Data for Figure 5 - North Fiscal Adj Normal
| Quarter | South: Nominal Interest Rate (annualised, in percentage points) | South: Real Interest Rate (annualised, in percentage points) | South: CPI Inflation (annualised, in percentage points) | South: Output (percent) | South: Real Exchange Rate (percent) | South: Govt Debt (Share of GDP, in percentage points) | South: Govt Spend (trend GDP share) | North: Nominal Interest Rate (annualised, in percentage points) | North: Real Interest Rate (annualised, in percentage points) | North: CPI Inflation (annualised, in percentage points) | North: Output (percent) | North: Aggregate Curr Union Output (percent) | North: Govt Debt (Share of GDP, in percentage points) | North: Govt Spend (trend GDP share) |
|---|---|---|---|---|---|---|---|---|---|---|---|---|---|---|
| 0.00 | -0.15 | 0.09 | -0.17 | -0.95 | 0.00 | 0.56 | -1.00 | -0.15 | 0.09 | -0.17 | -0.95 | -0.95 | 0.56 | -1.00 |
| 1.00 | -0.30 | -0.06 | -0.23 | -0.83 | 0.00 | 0.30 | -0.99 | -0.30 | -0.06 | -0.23 | -0.83 | -0.83 | 0.30 | -0.99 |
| 2.00 | -0.41 | -0.19 | -0.24 | -0.72 | 0.00 | 0.01 | -0.98 | -0.41 | -0.19 | -0.24 | -0.72 | -0.72 | 0.01 | -0.98 |
| 3.00 | -0.46 | -0.28 | -0.21 | -0.63 | 0.00 | -0.30 | -0.97 | -0.46 | -0.28 | -0.21 | -0.63 | -0.63 | -0.30 | -0.97 |
| 4.00 | -0.47 | -0.33 | -0.18 | -0.56 | 0.00 | -0.61 | -0.96 | -0.47 | -0.33 | -0.18 | -0.56 | -0.56 | -0.61 | -0.96 |
| 5.00 | -0.44 | -0.33 | -0.14 | -0.51 | 0.00 | -0.91 | -0.95 | -0.44 | -0.33 | -0.14 | -0.51 | -0.51 | -0.91 | -0.95 |
| 6.00 | -0.40 | -0.31 | -0.11 | -0.47 | 0.00 | -1.21 | -0.94 | -0.40 | -0.31 | -0.11 | -0.47 | -0.47 | -1.21 | -0.94 |
| 7.00 | -0.35 | -0.28 | -0.09 | -0.45 | 0.00 | -1.49 | -0.93 | -0.35 | -0.28 | -0.09 | -0.45 | -0.45 | -1.49 | -0.93 |
| 8.00 | -0.30 | -0.24 | -0.07 | -0.43 | 0.00 | -1.75 | -0.92 | -0.30 | -0.24 | -0.07 | -0.43 | -0.43 | -1.75 | -0.92 |
| 9.00 | -0.25 | -0.21 | -0.05 | -0.43 | 0.00 | -1.99 | -0.91 | -0.25 | -0.21 | -0.05 | -0.43 | -0.43 | -1.99 | -0.91 |
| 10.00 | -0.21 | -0.18 | -0.04 | -0.42 | 0.00 | -2.22 | -0.90 | -0.21 | -0.18 | -0.04 | -0.42 | -0.42 | -2.22 | -0.90 |
| 11.00 | -0.18 | -0.15 | -0.03 | -0.42 | 0.00 | -2.44 | -0.90 | -0.18 | -0.15 | -0.03 | -0.42 | -0.42 | -2.44 | -0.90 |
| 12.00 | -0.16 | -0.13 | -0.03 | -0.42 | 0.00 | -2.64 | -0.89 | -0.16 | -0.13 | -0.03 | -0.42 | -0.42 | -2.64 | -0.89 |
| 13.00 | -0.14 | -0.11 | -0.03 | -0.42 | 0.00 | -2.83 | -0.88 | -0.14 | -0.11 | -0.03 | -0.42 | -0.42 | -2.83 | -0.88 |
| 14.00 | -0.13 | -0.10 | -0.03 | -0.42 | 0.00 | -3.01 | -0.87 | -0.13 | -0.10 | -0.03 | -0.42 | -0.42 | -3.01 | -0.87 |
| 15.00 | -0.12 | -0.10 | -0.02 | -0.42 | 0.00 | -3.19 | -0.86 | -0.12 | -0.10 | -0.02 | -0.42 | -0.42 | -3.19 | -0.86 |
| 16.00 | -0.11 | -0.09 | -0.02 | -0.42 | 0.00 | -3.35 | -0.85 | -0.11 | -0.09 | -0.02 | -0.42 | -0.42 | -3.35 | -0.85 |
| 17.00 | -0.11 | -0.09 | -0.02 | -0.41 | 0.00 | -3.52 | -0.84 | -0.11 | -0.09 | -0.02 | -0.41 | -0.41 | -3.52 | -0.84 |
| 18.00 | -0.11 | -0.09 | -0.02 | -0.41 | 0.00 | -3.67 | -0.83 | -0.11 | -0.09 | -0.02 | -0.41 | -0.41 | -3.67 | -0.83 |
| 19.00 | -0.10 | -0.09 | -0.02 | -0.40 | 0.00 | -3.82 | -0.83 | -0.10 | -0.09 | -0.02 | -0.40 | -0.40 | -3.82 | -0.83 |
| 20.00 | -0.10 | -0.09 | -0.01 | -0.40 | 0.00 | -3.97 | -0.82 | -0.10 | -0.09 | -0.01 | -0.40 | -0.40 | -3.97 | -0.82 |
| 21.00 | -0.10 | -0.09 | -0.01 | -0.39 | 0.00 | -4.11 | -0.81 | -0.10 | -0.09 | -0.01 | -0.39 | -0.39 | -4.11 | -0.81 |
| 22.00 | -0.09 | -0.09 | -0.01 | -0.38 | 0.00 | -4.24 | -0.80 | -0.09 | -0.09 | -0.01 | -0.38 | -0.38 | -4.24 | -0.80 |
| 23.00 | -0.09 | -0.08 | -0.01 | -0.37 | 0.00 | -4.37 | -0.79 | -0.09 | -0.08 | -0.01 | -0.37 | -0.37 | -4.37 | -0.79 |
| 24.00 | -0.08 | -0.08 | 0.00 | -0.36 | 0.00 | -4.50 | -0.79 | -0.08 | -0.08 | 0.00 | -0.36 | -0.36 | -4.50 | -0.79 |
| 25.00 | -0.08 | -0.08 | 0.00 | -0.35 | 0.00 | -4.62 | -0.78 | -0.08 | -0.08 | 0.00 | -0.35 | -0.35 | -4.62 | -0.78 |
| 26.00 | -0.07 | -0.08 | 0.00 | -0.34 | 0.00 | -4.73 | -0.77 | -0.07 | -0.08 | 0.00 | -0.34 | -0.34 | -4.73 | -0.77 |
| 27.00 | -0.07 | -0.07 | 0.00 | -0.33 | 0.00 | -4.84 | -0.76 | -0.07 | -0.07 | 0.00 | -0.33 | -0.33 | -4.84 | -0.76 |
| 28.00 | -0.06 | -0.07 | 0.00 | -0.32 | 0.00 | -4.95 | -0.75 | -0.06 | -0.07 | 0.00 | -0.32 | -0.32 | -4.95 | -0.75 |
| 29.00 | -0.06 | -0.07 | 0.01 | -0.31 | 0.00 | -5.05 | -0.75 | -0.06 | -0.07 | 0.01 | -0.31 | -0.31 | -5.05 | -0.75 |
| 30.00 | -0.05 | -0.06 | 0.01 | -0.30 | 0.00 | -5.14 | -0.74 | -0.05 | -0.06 | 0.01 | -0.30 | -0.30 | -5.14 | -0.74 |
| 31.00 | -0.05 | -0.06 | 0.01 | -0.28 | 0.00 | -5.23 | -0.73 | -0.05 | -0.06 | 0.01 | -0.28 | -0.28 | -5.23 | -0.73 |
| 32.00 | -0.04 | -0.05 | 0.01 | -0.27 | 0.00 | -5.32 | -0.72 | -0.04 | -0.05 | 0.01 | -0.27 | -0.27 | -5.32 | -0.72 |
| 33.00 | -0.04 | -0.05 | 0.01 | -0.26 | 0.00 | -5.40 | -0.72 | -0.04 | -0.05 | 0.01 | -0.26 | -0.26 | -5.40 | -0.72 |
| 34.00 | -0.03 | -0.05 | 0.01 | -0.25 | 0.00 | -5.48 | -0.71 | -0.03 | -0.05 | 0.01 | -0.25 | -0.25 | -5.48 | -0.71 |
| 35.00 | -0.03 | -0.04 | 0.02 | -0.23 | 0.00 | -5.55 | -0.70 | -0.03 | -0.04 | 0.02 | -0.23 | -0.23 | -5.55 | -0.70 |
| 36.00 | -0.02 | -0.04 | 0.02 | -0.22 | 0.00 | -5.62 | -0.70 | -0.02 | -0.04 | 0.02 | -0.22 | -0.22 | -5.62 | -0.70 |
| 37.00 | -0.02 | -0.04 | 0.02 | -0.21 | 0.00 | -5.68 | -0.69 | -0.02 | -0.04 | 0.02 | -0.21 | -0.21 | -5.68 | -0.69 |
| 38.00 | -0.01 | -0.03 | 0.02 | -0.20 | 0.00 | -5.74 | -0.68 | -0.01 | -0.03 | 0.02 | -0.20 | -0.20 | -5.74 | -0.68 |
| 39.00 | -0.01 | -0.03 | 0.02 | -0.19 | 0.00 | -5.80 | -0.68 | -0.01 | -0.03 | 0.02 | -0.19 | -0.19 | -5.80 | -0.68 |
| 40 | -0.01 | -0.03 | 0.02 | -0.17 | 0.00 | -5.85 | -0.668971759 | -0.01 | -0.03 | 0.02 | -0.17 | -0.17 | -5.85 | -0.66897 |
Data for Figure 5 - North Fiscal Adj ZLB
| Quarter | South: Nominal Interest Rate (annualised, in percentage points) | South: Real Interest Rate (annualised, in percentage points) | South: CPI Inflation (annualised, in percentage points) | South: Output (percent) | South: Real Exchange Rate (percent) | South: Govt Debt (Share of GDP, in percentage points) | South: Govt Spend (trend GDP share) | North: Nominal Interest Rate (annualised, in percentage points) | North: Real Interest Rate (annualised, in percentage points) | North: CPI Inflation (annualised, in percentage points) | North: Output (percent) | North: Aggregate Curr Union Output (percent) | North: Govt Debt (Share of GDP, in percentage points) | North: Govt Spend (trend GDP share) |
|---|---|---|---|---|---|---|---|---|---|---|---|---|---|---|
| 0.00 | 0.00 | 0.92 | -0.59 | -1.25 | 0.00 | 0.89 | -1.00 | 0.00 | 0.92 | -0.59 | -1.25 | -1.25 | 0.89 | -1.00 |
| 1.00 | 0.00 | 1.06 | -0.92 | -1.46 | 0.00 | 1.07 | -0.99 | 0.00 | 1.06 | -0.92 | -1.46 | -1.46 | 1.07 | -0.99 |
| 2.00 | 0.00 | 1.09 | -1.06 | -1.62 | 0.00 | 1.26 | -0.98 | 0.00 | 1.09 | -1.06 | -1.62 | -1.62 | 1.26 | -0.98 |
| 3.00 | 0.00 | 1.03 | -1.09 | -1.73 | 0.00 | 1.42 | -0.97 | 0.00 | 1.03 | -1.09 | -1.73 | -1.73 | 1.42 | -0.97 |
| 4.00 | 0.00 | 0.93 | -1.03 | -1.79 | 0.00 | 1.54 | -0.96 | 0.00 | 0.93 | -1.03 | -1.79 | -1.79 | 1.54 | -0.96 |
| 5.00 | 0.00 | 0.79 | -0.93 | -1.81 | 0.00 | 1.60 | -0.95 | 0.00 | 0.79 | -0.93 | -1.81 | -1.81 | 1.60 | -0.95 |
| 6.00 | 0.00 | 0.65 | -0.79 | -1.79 | 0.00 | 1.61 | -0.94 | 0.00 | 0.65 | -0.79 | -1.79 | -1.79 | 1.61 | -0.94 |
| 7.00 | 0.00 | 0.51 | -0.65 | -1.75 | 0.00 | 1.57 | -0.93 | 0.00 | 0.51 | -0.65 | -1.75 | -1.75 | 1.57 | -0.93 |
| 8.00 | 0.00 | 0.37 | -0.51 | -1.68 | 0.00 | 1.48 | -0.92 | 0.00 | 0.37 | -0.51 | -1.68 | -1.68 | 1.48 | -0.92 |
| 9.00 | -0.21 | 0.04 | -0.37 | -1.58 | 0.00 | 1.34 | -0.91 | -0.21 | 0.04 | -0.37 | -1.58 | -1.58 | 1.34 | -0.91 |
| 10.00 | -0.50 | -0.36 | -0.25 | -1.49 | 0.00 | 1.13 | -0.90 | -0.50 | -0.36 | -0.25 | -1.49 | -1.49 | 1.13 | -0.90 |
| 11.00 | -0.61 | -0.55 | -0.14 | -1.39 | 0.00 | 0.84 | -0.90 | -0.61 | -0.55 | -0.14 | -1.39 | -1.39 | 0.84 | -0.90 |
| 12.00 | -0.61 | -0.62 | -0.06 | -1.31 | 0.00 | 0.53 | -0.89 | -0.61 | -0.62 | -0.06 | -1.31 | -1.31 | 0.53 | -0.89 |
| 13.00 | -0.55 | -0.62 | 0.01 | -1.25 | 0.00 | 0.21 | -0.88 | -0.55 | -0.62 | 0.01 | -1.25 | -1.25 | 0.21 | -0.88 |
| 14.00 | -0.46 | -0.57 | 0.07 | -1.19 | 0.00 | -0.09 | -0.87 | -0.46 | -0.57 | 0.07 | -1.19 | -1.19 | -0.09 | -0.87 |
| 15.00 | -0.37 | -0.50 | 0.11 | -1.15 | 0.00 | -0.38 | -0.86 | -0.37 | -0.50 | 0.11 | -1.15 | -1.15 | -0.38 | -0.86 |
| 16.00 | -0.27 | -0.43 | 0.14 | -1.11 | 0.00 | -0.64 | -0.85 | -0.27 | -0.43 | 0.14 | -1.11 | -1.11 | -0.64 | -0.85 |
| 17.00 | -0.18 | -0.36 | 0.16 | -1.08 | 0.00 | -0.88 | -0.84 | -0.18 | -0.36 | 0.16 | -1.08 | -1.08 | -0.88 | -0.84 |
| 18.00 | -0.11 | -0.30 | 0.17 | -1.05 | 0.00 | -1.10 | -0.83 | -0.11 | -0.30 | 0.17 | -1.05 | -1.05 | -1.10 | -0.83 |
| 19.00 | -0.05 | -0.24 | 0.19 | -1.02 | 0.00 | -1.30 | -0.83 | -0.05 | -0.24 | 0.19 | -1.02 | -1.02 | -1.30 | -0.83 |
| 20.00 | 0.01 | -0.19 | 0.19 | -1.00 | 0.00 | -1.48 | -0.82 | 0.01 | -0.19 | 0.19 | -1.00 | -1.00 | -1.48 | -0.82 |
| 21.00 | 0.05 | -0.15 | 0.20 | -0.97 | 0.00 | -1.65 | -0.81 | 0.05 | -0.15 | 0.20 | -0.97 | -0.97 | -1.65 | -0.81 |
| 22.00 | 0.08 | -0.12 | 0.20 | -0.95 | 0.00 | -1.81 | -0.80 | 0.08 | -0.12 | 0.20 | -0.95 | -0.95 | -1.81 | -0.80 |
| 23.00 | 0.11 | -0.10 | 0.21 | -0.92 | 0.00 | -1.96 | -0.79 | 0.11 | -0.10 | 0.21 | -0.92 | -0.92 | -1.96 | -0.79 |
| 24.00 | 0.14 | -0.07 | 0.21 | -0.90 | 0.00 | -2.10 | -0.79 | 0.14 | -0.07 | 0.21 | -0.90 | -0.90 | -2.10 | -0.79 |
| 25.00 | 0.16 | -0.05 | 0.21 | -0.87 | 0.00 | -2.23 | -0.78 | 0.16 | -0.05 | 0.21 | -0.87 | -0.87 | -2.23 | -0.78 |
| 26.00 | 0.17 | -0.04 | 0.21 | -0.84 | 0.00 | -2.35 | -0.77 | 0.17 | -0.04 | 0.21 | -0.84 | -0.84 | -2.35 | -0.77 |
| 27.00 | 0.19 | -0.02 | 0.21 | -0.81 | 0.00 | -2.47 | -0.76 | 0.19 | -0.02 | 0.21 | -0.81 | -0.81 | -2.47 | -0.76 |
| 28.00 | 0.20 | -0.01 | 0.21 | -0.78 | 0.00 | -2.58 | -0.75 | 0.20 | -0.01 | 0.21 | -0.78 | -0.78 | -2.58 | -0.75 |
| 29.00 | 0.21 | 0.00 | 0.21 | -0.76 | 0.00 | -2.69 | -0.75 | 0.21 | 0.00 | 0.21 | -0.76 | -0.76 | -2.69 | -0.75 |
| 30.00 | 0.22 | 0.02 | 0.21 | -0.73 | 0.00 | -2.79 | -0.74 | 0.22 | 0.02 | 0.21 | -0.73 | -0.73 | -2.79 | -0.74 |
| 31.00 | 0.23 | 0.03 | 0.21 | -0.70 | 0.00 | -2.89 | -0.73 | 0.23 | 0.03 | 0.21 | -0.70 | -0.70 | -2.89 | -0.73 |
| 32.00 | 0.24 | 0.04 | 0.21 | -0.67 | 0.00 | -2.98 | -0.72 | 0.24 | 0.04 | 0.21 | -0.67 | -0.67 | -2.98 | -0.72 |
| 33.00 | 0.25 | 0.04 | 0.21 | -0.65 | 0.00 | -3.06 | -0.72 | 0.25 | 0.04 | 0.21 | -0.65 | -0.65 | -3.06 | -0.72 |
| 34.00 | 0.25 | 0.05 | 0.20 | -0.62 | 0.00 | -3.14 | -0.71 | 0.25 | 0.05 | 0.20 | -0.62 | -0.62 | -3.14 | -0.71 |
| 35.00 | 0.26 | 0.06 | 0.20 | -0.59 | 0.00 | -3.22 | -0.70 | 0.26 | 0.06 | 0.20 | -0.59 | -0.59 | -3.22 | -0.70 |
| 36.00 | 0.26 | 0.07 | 0.20 | -0.57 | 0.00 | -3.29 | -0.70 | 0.26 | 0.07 | 0.20 | -0.57 | -0.57 | -3.29 | -0.70 |
| 37.00 | 0.27 | 0.07 | 0.20 | -0.54 | 0.00 | -3.36 | -0.69 | 0.27 | 0.07 | 0.20 | -0.54 | -0.54 | -3.36 | -0.69 |
| 38.00 | 0.27 | 0.08 | 0.19 | -0.52 | 0.00 | -3.43 | -0.68 | 0.27 | 0.08 | 0.19 | -0.52 | -0.52 | -3.43 | -0.68 |
| 39.00 | 0.27 | 0.08 | 0.19 | -0.49 | 0.00 | -3.49 | -0.68 | 0.27 | 0.08 | 0.19 | -0.49 | -0.49 | -3.49 | -0.68 |
| 40.00 | 0.27 | 0.09 | 0.19 | -0.47 | 0.00 | -3.55 | -0.67 | 0.27 | 0.09 | 0.19 | -0.47 | -0.47 | -3.55 | -0.67 |
Figure 6. Responses to a Financial Spread Increase in Small South Under Flexible Exchange Rate and in a Currency Union
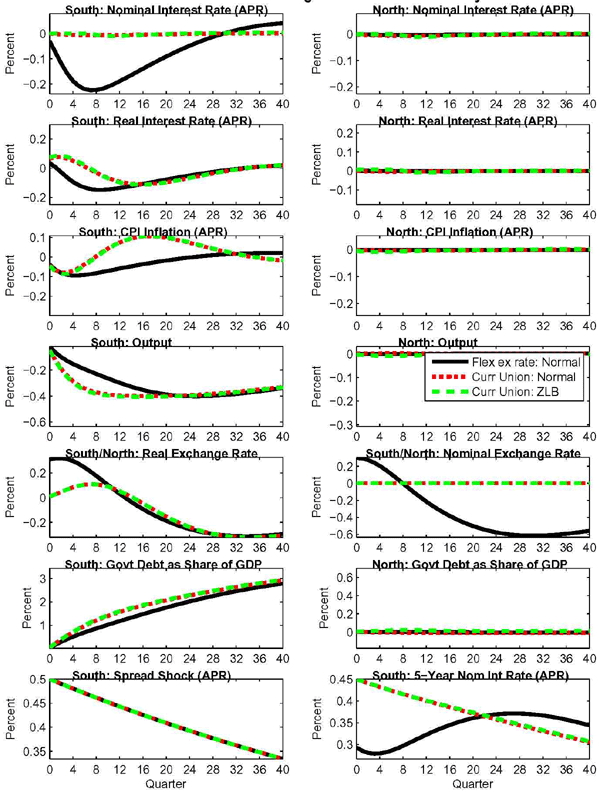
Data for Figure 6 - Flex Ex Rate Normal
| Quarter | South: Nominal Interest Rate (annualised, in percentage points) | South: Real Interest Rate (annualised, in percentage points) | South: CPI Inflation (annualised, in percentage points) | South: Output (percent) | South: Real Exchange Rate (percent) | South: Govt Debt (Share of GDP, in percentage points) | South: Spread Shock (annualised, in percentage points) | North: Nominal Interest Rate (annualised, in percentage points) | North: Real Interest Rate (annualised, in percentage points) | North: CPI Inflation (annualised, in percentage points) | North: Output (percent) | North: Nominal Exchange Rate (percent) | North: Govt Debt (Share of GDP, in percentage points) | North: South: 5-year Nom Int Rate (annualised, in percentage points) |
|---|---|---|---|---|---|---|---|---|---|---|---|---|---|---|
| 0.00 | -0.03 | 0.03 | -0.04 | -0.02 | 0.31 | 0.02 | 0.50 | 0.00 | 0.00 | 0.00 | 0.00 | 0.30 | 0.00 | 0.29 |
| 1.00 | -0.07 | 0.01 | -0.07 | -0.07 | 0.32 | 0.16 | 0.50 | 0.00 | 0.00 | 0.00 | 0.00 | 0.29 | 0.00 | 0.29 |
| 2.00 | -0.12 | -0.03 | -0.08 | -0.10 | 0.32 | 0.29 | 0.49 | 0.00 | 0.00 | 0.00 | 0.00 | 0.27 | 0.00 | 0.28 |
| 3.00 | -0.16 | -0.06 | -0.09 | -0.13 | 0.31 | 0.41 | 0.49 | 0.00 | 0.00 | 0.00 | 0.00 | 0.24 | 0.00 | 0.28 |
| 4.00 | -0.19 | -0.09 | -0.09 | -0.15 | 0.30 | 0.51 | 0.48 | 0.00 | 0.00 | 0.00 | 0.00 | 0.20 | 0.00 | 0.28 |
| 5.00 | -0.21 | -0.12 | -0.09 | -0.17 | 0.27 | 0.61 | 0.48 | 0.00 | 0.00 | 0.00 | 0.00 | 0.16 | 0.00 | 0.28 |
| 6.00 | -0.22 | -0.13 | -0.09 | -0.19 | 0.24 | 0.70 | 0.47 | 0.00 | 0.00 | 0.00 | 0.00 | 0.11 | 0.00 | 0.29 |
| 7.00 | -0.22 | -0.14 | -0.09 | -0.21 | 0.21 | 0.78 | 0.47 | 0.00 | 0.00 | 0.00 | 0.00 | 0.05 | 0.00 | 0.29 |
| 8.00 | -0.22 | -0.15 | -0.08 | -0.23 | 0.18 | 0.86 | 0.46 | 0.00 | 0.00 | 0.00 | 0.00 | 0.00 | 0.00 | 0.30 |
| 9.00 | -0.22 | -0.15 | -0.08 | -0.25 | 0.14 | 0.94 | 0.46 | 0.00 | 0.00 | 0.00 | 0.00 | -0.06 | 0.00 | 0.30 |
| 10.00 | -0.21 | -0.15 | -0.07 | -0.26 | 0.10 | 1.02 | 0.45 | 0.00 | 0.00 | 0.00 | 0.00 | -0.11 | 0.00 | 0.31 |
| 11.00 | -0.20 | -0.14 | -0.06 | -0.28 | 0.07 | 1.10 | 0.45 | 0.00 | 0.00 | 0.00 | 0.00 | -0.17 | 0.00 | 0.32 |
| 12.00 | -0.19 | -0.14 | -0.06 | -0.30 | 0.03 | 1.18 | 0.44 | 0.00 | 0.00 | 0.00 | 0.00 | -0.22 | 0.00 | 0.32 |
| 13.00 | -0.18 | -0.13 | -0.05 | -0.31 | 0.00 | 1.25 | 0.44 | 0.00 | 0.00 | 0.00 | 0.00 | -0.26 | 0.00 | 0.33 |
| 14.00 | -0.16 | -0.12 | -0.05 | -0.33 | -0.03 | 1.33 | 0.43 | 0.00 | 0.00 | 0.00 | 0.00 | -0.31 | 0.00 | 0.33 |
| 15.00 | -0.15 | -0.11 | -0.04 | -0.34 | -0.06 | 1.40 | 0.43 | 0.00 | 0.00 | 0.00 | 0.00 | -0.35 | 0.00 | 0.34 |
| 16.00 | -0.14 | -0.11 | -0.04 | -0.35 | -0.09 | 1.48 | 0.43 | 0.00 | 0.00 | 0.00 | 0.00 | -0.38 | 0.00 | 0.34 |
| 17.00 | -0.13 | -0.10 | -0.03 | -0.36 | -0.12 | 1.55 | 0.42 | 0.00 | 0.00 | 0.00 | 0.00 | -0.42 | 0.00 | 0.35 |
| 18.00 | -0.11 | -0.09 | -0.03 | -0.37 | -0.14 | 1.62 | 0.42 | 0.00 | 0.00 | 0.00 | 0.00 | -0.45 | 0.00 | 0.35 |
| 19.00 | -0.10 | -0.08 | -0.02 | -0.38 | -0.17 | 1.69 | 0.41 | 0.00 | 0.00 | 0.00 | 0.00 | -0.48 | 0.00 | 0.36 |
| 20.00 | -0.09 | -0.08 | -0.02 | -0.39 | -0.19 | 1.76 | 0.41 | 0.00 | 0.00 | 0.00 | 0.00 | -0.50 | 0.00 | 0.36 |
| 21.00 | -0.08 | -0.07 | -0.01 | -0.39 | -0.21 | 1.83 | 0.40 | 0.00 | 0.00 | 0.00 | 0.00 | -0.53 | 0.00 | 0.36 |
| 22.00 | -0.07 | -0.06 | -0.01 | -0.40 | -0.22 | 1.89 | 0.40 | 0.00 | 0.00 | 0.00 | 0.00 | -0.55 | 0.00 | 0.37 |
| 23.00 | -0.06 | -0.06 | -0.01 | -0.40 | -0.24 | 1.96 | 0.40 | 0.00 | 0.00 | 0.00 | 0.00 | -0.56 | 0.00 | 0.37 |
| 24.00 | -0.05 | -0.05 | 0.00 | -0.40 | -0.25 | 2.02 | 0.39 | 0.00 | 0.00 | 0.00 | 0.00 | -0.58 | 0.00 | 0.37 |
| 25.00 | -0.04 | -0.04 | 0.00 | -0.40 | -0.27 | 2.08 | 0.39 | 0.00 | 0.00 | 0.00 | 0.00 | -0.59 | 0.00 | 0.37 |
| 26.00 | -0.03 | -0.04 | 0.00 | -0.40 | -0.28 | 2.14 | 0.39 | 0.00 | 0.00 | 0.00 | 0.00 | -0.60 | -0.01 | 0.37 |
| 27.00 | -0.02 | -0.03 | 0.01 | -0.40 | -0.29 | 2.20 | 0.38 | 0.00 | 0.00 | 0.00 | 0.00 | -0.61 | -0.01 | 0.37 |
| 28.00 | -0.01 | -0.03 | 0.01 | -0.40 | -0.29 | 2.25 | 0.38 | 0.00 | 0.00 | 0.00 | 0.00 | -0.61 | -0.01 | 0.37 |
| 29.00 | -0.01 | -0.02 | 0.01 | -0.40 | -0.30 | 2.31 | 0.37 | 0.00 | 0.00 | 0.00 | 0.00 | -0.61 | -0.01 | 0.37 |
| 30.00 | 0.00 | -0.01 | 0.01 | -0.39 | -0.30 | 2.36 | 0.37 | 0.00 | 0.00 | 0.00 | 0.00 | -0.62 | -0.01 | 0.37 |
| 31.00 | 0.01 | -0.01 | 0.02 | -0.39 | -0.31 | 2.41 | 0.37 | 0.00 | 0.00 | 0.00 | 0.00 | -0.62 | -0.01 | 0.37 |
| 32.00 | 0.01 | 0.00 | 0.02 | -0.38 | -0.31 | 2.46 | 0.36 | 0.00 | 0.00 | 0.00 | 0.00 | -0.61 | -0.01 | 0.37 |
| 33.00 | 0.02 | 0.00 | 0.02 | -0.38 | -0.31 | 2.51 | 0.36 | 0.00 | 0.00 | 0.00 | 0.00 | -0.61 | -0.01 | 0.36 |
| 34.00 | 0.02 | 0.00 | 0.02 | -0.37 | -0.31 | 2.55 | 0.36 | 0.00 | 0.00 | 0.00 | 0.00 | -0.61 | -0.01 | 0.36 |
| 35.00 | 0.03 | 0.01 | 0.02 | -0.37 | -0.31 | 2.60 | 0.35 | 0.00 | 0.00 | 0.00 | 0.00 | -0.60 | -0.01 | 0.36 |
| 36.00 | 0.03 | 0.01 | 0.02 | -0.36 | -0.31 | 2.64 | 0.35 | 0.00 | 0.00 | 0.00 | 0.00 | -0.59 | -0.01 | 0.36 |
| 37.00 | 0.03 | 0.01 | 0.02 | -0.36 | -0.31 | 2.68 | 0.34 | 0.00 | 0.00 | 0.00 | 0.00 | -0.59 | -0.01 | 0.35 |
| 38.00 | 0.04 | 0.02 | 0.02 | -0.35 | -0.30 | 2.71 | 0.34 | 0.00 | 0.00 | 0.00 | 0.00 | -0.58 | -0.01 | 0.35 |
| 39.00 | 0.04 | 0.02 | 0.02 | -0.35 | -0.30 | 2.75 | 0.34 | 0.00 | 0.00 | 0.00 | 0.00 | -0.57 | -0.01 | 0.35 |
| 40.00 | 0.04 | 0.02 | 0.02 | -0.34 | -0.29 | 2.78 | 0.33 | 0.00 | 0.00 | 0.00 | 0.00 | -0.56 | -0.01 | 0.34 |
Data for Figure 6 - Curr Union Normal
| Quarter | South: Nominal Interest Rate (annualised, in percentage points) | South: Real Interest Rate (annualised, in percentage points) | South: CPI Inflation (annualised, in percentage points) | South: Output (percent) | South: Real Exchange Rate (percent) | South: Govt Debt (Share of GDP, in percentage points) | South: Spread Shock (annualised, in percentage points) | North: Nominal Interest Rate (annualised, in percentage points) | North: Real Interest Rate (annualised, in percentage points) | North: CPI Inflation (annualised, in percentage points) | North: Output (percent) | North: Nominal Exchange Rate (percent) | North: Govt Debt (Share of GDP, in percentage points) | North: South: 5-year Nom Int Rate (annualised, in percentage points) |
|---|---|---|---|---|---|---|---|---|---|---|---|---|---|---|
| 0.00 | 0.00 | 0.07 | -0.04 | -0.05 | 0.01 | 0.05 | 0.50 | 0.00 | 0.00 | 0.00 | 0.00 | 0.00 | 0.00 | 0.45 |
| 1.00 | 0.00 | 0.08 | -0.07 | -0.13 | 0.03 | 0.22 | 0.50 | 0.00 | 0.00 | 0.00 | 0.00 | 0.00 | 0.00 | 0.45 |
| 2.00 | 0.00 | 0.08 | -0.08 | -0.19 | 0.05 | 0.39 | 0.49 | 0.00 | 0.00 | 0.00 | 0.00 | 0.00 | 0.00 | 0.44 |
| 3.00 | 0.00 | 0.07 | -0.08 | -0.24 | 0.07 | 0.55 | 0.49 | 0.00 | 0.00 | 0.00 | 0.00 | 0.00 | 0.00 | 0.44 |
| 4.00 | -0.01 | 0.05 | -0.07 | -0.29 | 0.08 | 0.70 | 0.48 | -0.01 | 0.00 | 0.00 | 0.00 | 0.00 | 0.00 | 0.43 |
| 5.00 | -0.01 | 0.03 | -0.06 | -0.32 | 0.10 | 0.84 | 0.48 | -0.01 | 0.00 | 0.00 | 0.00 | 0.00 | 0.00 | 0.43 |
| 6.00 | -0.01 | 0.01 | -0.04 | -0.34 | 0.11 | 0.97 | 0.47 | -0.01 | 0.00 | 0.00 | 0.00 | 0.00 | -0.01 | 0.42 |
| 7.00 | -0.01 | -0.01 | -0.02 | -0.36 | 0.11 | 1.09 | 0.47 | -0.01 | 0.00 | 0.00 | 0.00 | 0.00 | -0.01 | 0.42 |
| 8.00 | -0.01 | -0.03 | 0.00 | -0.37 | 0.11 | 1.20 | 0.46 | -0.01 | 0.00 | 0.00 | 0.00 | 0.00 | -0.01 | 0.42 |
| 9.00 | -0.01 | -0.05 | 0.02 | -0.38 | 0.10 | 1.31 | 0.46 | -0.01 | 0.00 | 0.00 | 0.00 | 0.00 | -0.01 | 0.41 |
| 10.00 | -0.01 | -0.07 | 0.04 | -0.39 | 0.09 | 1.40 | 0.45 | -0.01 | 0.00 | 0.00 | 0.00 | 0.00 | -0.01 | 0.41 |
| 11.00 | -0.01 | -0.08 | 0.06 | -0.39 | 0.07 | 1.49 | 0.45 | -0.01 | 0.00 | 0.00 | 0.00 | 0.00 | -0.01 | 0.40 |
| 12.00 | -0.01 | -0.09 | 0.07 | -0.40 | 0.05 | 1.57 | 0.44 | -0.01 | 0.00 | 0.00 | 0.00 | 0.00 | -0.01 | 0.40 |
| 13.00 | -0.01 | -0.10 | 0.09 | -0.40 | 0.03 | 1.64 | 0.44 | -0.01 | 0.00 | 0.00 | 0.00 | 0.00 | -0.01 | 0.40 |
| 14.00 | -0.01 | -0.11 | 0.09 | -0.40 | 0.01 | 1.71 | 0.43 | -0.01 | 0.00 | 0.00 | 0.00 | 0.00 | -0.01 | 0.39 |
| 15.00 | 0.00 | -0.11 | 0.10 | -0.40 | -0.02 | 1.78 | 0.43 | 0.00 | 0.00 | 0.00 | 0.00 | 0.00 | -0.01 | 0.39 |
| 16.00 | 0.00 | -0.11 | 0.10 | -0.40 | -0.05 | 1.84 | 0.43 | 0.00 | 0.00 | 0.00 | 0.00 | 0.00 | -0.01 | 0.39 |
| 17.00 | 0.00 | -0.11 | 0.11 | -0.40 | -0.07 | 1.90 | 0.42 | 0.00 | 0.00 | 0.00 | 0.00 | 0.00 | -0.01 | 0.38 |
| 18.00 | 0.00 | -0.11 | 0.10 | -0.40 | -0.10 | 1.96 | 0.42 | 0.00 | 0.00 | 0.00 | 0.00 | 0.00 | -0.01 | 0.38 |
| 19.00 | 0.00 | -0.10 | 0.10 | -0.40 | -0.13 | 2.01 | 0.41 | 0.00 | 0.00 | 0.00 | 0.00 | 0.00 | -0.01 | 0.38 |
| 20.00 | 0.00 | -0.10 | 0.10 | -0.40 | -0.15 | 2.07 | 0.41 | 0.00 | 0.00 | 0.00 | 0.00 | 0.00 | -0.01 | 0.37 |
| 21.00 | 0.00 | -0.09 | 0.09 | -0.40 | -0.18 | 2.12 | 0.40 | 0.00 | 0.00 | 0.00 | 0.00 | 0.00 | -0.01 | 0.37 |
| 22.00 | 0.00 | -0.08 | 0.09 | -0.40 | -0.20 | 2.17 | 0.40 | 0.00 | 0.00 | 0.00 | 0.00 | 0.00 | -0.01 | 0.36 |
| 23.00 | 0.00 | -0.07 | 0.08 | -0.40 | -0.22 | 2.22 | 0.40 | 0.00 | 0.00 | 0.00 | 0.00 | 0.00 | -0.01 | 0.36 |
| 24.00 | 0.00 | -0.07 | 0.07 | -0.39 | -0.24 | 2.27 | 0.39 | 0.00 | 0.00 | 0.00 | 0.00 | 0.00 | -0.01 | 0.36 |
| 25.00 | 0.00 | -0.06 | 0.07 | -0.39 | -0.25 | 2.32 | 0.39 | 0.00 | 0.00 | 0.00 | 0.00 | 0.00 | -0.01 | 0.35 |
| 26.00 | 0.00 | -0.05 | 0.06 | -0.39 | -0.27 | 2.37 | 0.39 | 0.00 | 0.00 | 0.00 | 0.00 | 0.00 | -0.01 | 0.35 |
| 27.00 | 0.00 | -0.04 | 0.05 | -0.39 | -0.28 | 2.41 | 0.38 | 0.00 | 0.00 | 0.00 | 0.00 | 0.00 | -0.01 | 0.35 |
| 28.00 | 0.00 | -0.04 | 0.04 | -0.38 | -0.29 | 2.46 | 0.38 | 0.00 | 0.00 | 0.00 | 0.00 | 0.00 | -0.01 | 0.34 |
| 29.00 | 0.00 | -0.03 | 0.03 | -0.38 | -0.30 | 2.50 | 0.37 | 0.00 | 0.00 | 0.00 | 0.00 | 0.00 | -0.01 | 0.34 |
| 30.00 | 0.00 | -0.02 | 0.03 | -0.38 | -0.31 | 2.55 | 0.37 | 0.00 | 0.00 | 0.00 | 0.00 | 0.00 | -0.01 | 0.34 |
| 31.00 | 0.00 | -0.02 | 0.02 | -0.37 | -0.31 | 2.59 | 0.37 | 0.00 | 0.00 | 0.00 | 0.00 | 0.00 | -0.01 | 0.33 |
| 32.00 | 0.00 | -0.01 | 0.01 | -0.37 | -0.32 | 2.63 | 0.36 | 0.00 | 0.00 | 0.00 | 0.00 | 0.00 | -0.01 | 0.33 |
| 33.00 | 0.00 | 0.00 | 0.01 | -0.36 | -0.32 | 2.67 | 0.36 | 0.00 | 0.00 | 0.00 | 0.00 | 0.00 | -0.01 | 0.33 |
| 34.00 | 0.00 | 0.00 | 0.00 | -0.36 | -0.32 | 2.71 | 0.36 | 0.00 | 0.00 | 0.00 | 0.00 | 0.00 | -0.01 | 0.32 |
| 35.00 | 0.00 | 0.01 | 0.00 | -0.35 | -0.32 | 2.75 | 0.35 | 0.00 | 0.00 | 0.00 | 0.00 | 0.00 | -0.01 | 0.32 |
| 36.00 | 0.00 | 0.01 | -0.01 | -0.35 | -0.32 | 2.79 | 0.35 | 0.00 | 0.00 | 0.00 | 0.00 | 0.00 | -0.01 | 0.32 |
| 37.00 | 0.00 | 0.01 | -0.01 | -0.34 | -0.32 | 2.82 | 0.34 | 0.00 | 0.00 | 0.00 | 0.00 | 0.00 | -0.01 | 0.31 |
| 38.00 | 0.00 | 0.02 | -0.01 | -0.34 | -0.31 | 2.86 | 0.34 | 0.00 | 0.00 | 0.00 | 0.00 | 0.00 | -0.01 | 0.31 |
| 39.00 | 0.00 | 0.02 | -0.02 | -0.34 | -0.31 | 2.89 | 0.34 | 0.00 | 0.00 | 0.00 | 0.00 | 0.00 | -0.01 | 0.31 |
| 40.00 | 0.00 | 0.02 | -0.02 | -0.33 | -0.30 | 2.92 | 0.33 | 0.00 | 0.00 | 0.00 | 0.00 | 0.00 | -0.01 | 0.31 |
Data for Figure 6 - Curr Union ZLB
| Quarter | South: Nominal Interest Rate (annualised, in percentage points) | South: Real Interest Rate (annualised, in percentage points) | South: CPI Inflation (annualised, in percentage points) | South: Output (percent) | South: Real Exchange Rate (percent) | South: Govt Debt (Share of GDP, in percentage points) | South: Spread Shock (annualised, in percentage points) | North: Nominal Interest Rate (annualised, in percentage points) | North: Real Interest Rate (annualised, in percentage points) | North: CPI Inflation (annualised, in percentage points) | North: Output (percent) | North: Nominal Exchange Rate (percent) | North: Govt Debt (Share of GDP, in percentage points) | North: South: 5-year Nom Int Rate (annualised, in percentage points) |
|---|---|---|---|---|---|---|---|---|---|---|---|---|---|---|
| 0.00 | 0.00 | 0.07 | -0.05 | -0.05 | 0.01 | 0.05 | 0.50 | 0.00 | 0.01 | 0.00 | 0.00 | 0.00 | 0.00 | 0.45 |
| 1.00 | 0.00 | 0.09 | -0.07 | -0.13 | 0.03 | 0.23 | 0.50 | 0.00 | 0.01 | -0.01 | 0.00 | 0.00 | 0.01 | 0.45 |
| 2.00 | 0.00 | 0.09 | -0.09 | -0.20 | 0.05 | 0.40 | 0.49 | 0.00 | 0.01 | -0.01 | -0.01 | 0.00 | 0.01 | 0.44 |
| 3.00 | 0.00 | 0.08 | -0.09 | -0.25 | 0.07 | 0.57 | 0.49 | 0.00 | 0.01 | -0.01 | -0.01 | 0.00 | 0.01 | 0.44 |
| 4.00 | 0.00 | 0.06 | -0.08 | -0.30 | 0.08 | 0.72 | 0.48 | 0.00 | 0.01 | -0.01 | -0.01 | 0.00 | 0.02 | 0.43 |
| 5.00 | 0.00 | 0.04 | -0.06 | -0.33 | 0.10 | 0.87 | 0.48 | 0.00 | 0.01 | -0.01 | -0.01 | 0.00 | 0.02 | 0.43 |
| 6.00 | 0.00 | 0.02 | -0.04 | -0.35 | 0.11 | 1.00 | 0.47 | 0.00 | 0.01 | -0.01 | -0.01 | 0.00 | 0.02 | 0.42 |
| 7.00 | 0.00 | 0.00 | -0.02 | -0.37 | 0.11 | 1.12 | 0.47 | 0.00 | 0.01 | -0.01 | -0.01 | 0.00 | 0.02 | 0.42 |
| 8.00 | 0.00 | -0.03 | 0.00 | -0.38 | 0.11 | 1.23 | 0.46 | 0.00 | 0.00 | -0.01 | -0.01 | 0.00 | 0.02 | 0.42 |
| 9.00 | -0.01 | -0.05 | 0.02 | -0.39 | 0.10 | 1.34 | 0.46 | -0.01 | 0.00 | -0.01 | -0.01 | 0.00 | 0.02 | 0.41 |
| 10.00 | -0.01 | -0.07 | 0.04 | -0.40 | 0.09 | 1.43 | 0.45 | -0.01 | -0.01 | 0.00 | -0.01 | 0.00 | 0.02 | 0.41 |
| 11.00 | -0.01 | -0.09 | 0.06 | -0.40 | 0.07 | 1.51 | 0.45 | -0.01 | -0.01 | 0.00 | -0.01 | 0.00 | 0.02 | 0.40 |
| 12.00 | -0.01 | -0.10 | 0.07 | -0.40 | 0.05 | 1.59 | 0.44 | -0.01 | -0.01 | 0.00 | -0.01 | 0.00 | 0.02 | 0.40 |
| 13.00 | -0.01 | -0.10 | 0.09 | -0.40 | 0.03 | 1.67 | 0.44 | -0.01 | -0.01 | 0.00 | -0.01 | 0.00 | 0.02 | 0.40 |
| 14.00 | -0.01 | -0.11 | 0.10 | -0.41 | 0.01 | 1.74 | 0.43 | -0.01 | -0.01 | 0.00 | -0.01 | 0.00 | 0.02 | 0.39 |
| 15.00 | -0.01 | -0.11 | 0.10 | -0.41 | -0.02 | 1.80 | 0.43 | -0.01 | 0.00 | 0.00 | 0.00 | 0.00 | 0.01 | 0.39 |
| 16.00 | -0.01 | -0.11 | 0.11 | -0.41 | -0.05 | 1.86 | 0.43 | -0.01 | 0.00 | 0.00 | 0.00 | 0.00 | 0.01 | 0.39 |
| 17.00 | 0.00 | -0.11 | 0.11 | -0.41 | -0.07 | 1.92 | 0.42 | 0.00 | 0.00 | 0.00 | 0.00 | 0.00 | 0.01 | 0.38 |
| 18.00 | 0.00 | -0.11 | 0.11 | -0.41 | -0.10 | 1.98 | 0.42 | 0.00 | 0.00 | 0.00 | 0.00 | 0.00 | 0.01 | 0.38 |
| 19.00 | 0.00 | -0.10 | 0.10 | -0.40 | -0.13 | 2.03 | 0.41 | 0.00 | 0.00 | 0.00 | 0.00 | 0.00 | 0.01 | 0.38 |
| 20.00 | 0.00 | -0.10 | 0.10 | -0.40 | -0.15 | 2.09 | 0.41 | 0.00 | 0.00 | 0.00 | 0.00 | 0.00 | 0.01 | 0.37 |
| 21.00 | 0.00 | -0.09 | 0.09 | -0.40 | -0.18 | 2.14 | 0.40 | 0.00 | 0.00 | 0.00 | 0.00 | 0.00 | 0.01 | 0.37 |
| 22.00 | 0.00 | -0.08 | 0.09 | -0.40 | -0.20 | 2.19 | 0.40 | 0.00 | 0.00 | 0.00 | 0.00 | 0.00 | 0.01 | 0.37 |
| 23.00 | 0.00 | -0.07 | 0.08 | -0.40 | -0.22 | 2.24 | 0.40 | 0.00 | 0.00 | 0.00 | 0.00 | 0.00 | 0.01 | 0.36 |
| 24.00 | 0.00 | -0.07 | 0.07 | -0.40 | -0.24 | 2.29 | 0.39 | 0.00 | 0.00 | 0.00 | 0.00 | 0.00 | 0.01 | 0.36 |
| 25.00 | 0.00 | -0.06 | 0.07 | -0.40 | -0.25 | 2.34 | 0.39 | 0.00 | 0.00 | 0.00 | 0.00 | 0.00 | 0.01 | 0.36 |
| 26.00 | 0.00 | -0.05 | 0.06 | -0.39 | -0.27 | 2.39 | 0.39 | 0.00 | 0.00 | 0.00 | 0.00 | 0.00 | 0.01 | 0.35 |
| 27.00 | 0.00 | -0.04 | 0.05 | -0.39 | -0.28 | 2.43 | 0.38 | 0.00 | 0.00 | 0.00 | 0.00 | 0.00 | 0.01 | 0.35 |
| 28.00 | 0.00 | -0.04 | 0.04 | -0.39 | -0.29 | 2.48 | 0.38 | 0.00 | 0.00 | 0.00 | 0.00 | 0.00 | 0.01 | 0.35 |
| 29.00 | 0.00 | -0.03 | 0.04 | -0.38 | -0.30 | 2.53 | 0.37 | 0.00 | 0.00 | 0.00 | 0.00 | 0.00 | 0.01 | 0.34 |
| 30.00 | 0.00 | -0.02 | 0.03 | -0.38 | -0.31 | 2.57 | 0.37 | 0.00 | 0.00 | 0.00 | 0.00 | 0.00 | 0.01 | 0.34 |
| 31.00 | 0.00 | -0.01 | 0.02 | -0.38 | -0.31 | 2.61 | 0.37 | 0.00 | 0.00 | 0.00 | 0.00 | 0.00 | 0.01 | 0.34 |
| 32.00 | 0.00 | -0.01 | 0.02 | -0.37 | -0.32 | 2.65 | 0.36 | 0.00 | 0.00 | 0.00 | 0.00 | 0.00 | 0.01 | 0.33 |
| 33.00 | 0.00 | 0.00 | 0.01 | -0.37 | -0.32 | 2.69 | 0.36 | 0.00 | 0.00 | 0.00 | 0.00 | 0.00 | 0.01 | 0.33 |
| 34.00 | 0.00 | 0.00 | 0.01 | -0.36 | -0.32 | 2.73 | 0.36 | 0.00 | 0.00 | 0.00 | 0.00 | 0.00 | 0.01 | 0.33 |
| 35.00 | 0.00 | 0.01 | 0.00 | -0.36 | -0.32 | 2.77 | 0.35 | 0.00 | 0.00 | 0.00 | 0.00 | 0.00 | 0.01 | 0.32 |
| 36.00 | 0.00 | 0.01 | 0.00 | -0.35 | -0.32 | 2.81 | 0.35 | 0.00 | 0.00 | 0.00 | 0.00 | 0.00 | 0.01 | 0.32 |
| 37.00 | 0.00 | 0.01 | -0.01 | -0.35 | -0.32 | 2.84 | 0.34 | 0.00 | 0.00 | 0.00 | 0.00 | 0.00 | 0.01 | 0.32 |
| 38.00 | 0.00 | 0.02 | -0.01 | -0.34 | -0.31 | 2.88 | 0.34 | 0.00 | 0.00 | 0.00 | 0.00 | 0.00 | 0.01 | 0.31 |
| 39.00 | 0.00 | 0.02 | -0.01 | -0.34 | -0.31 | 2.91 | 0.34 | 0.00 | 0.00 | 0.00 | 0.00 | 0.00 | 0.01 | 0.31 |
| 40.00 | 0.00 | 0.02 | -0.02 | -0.33 | -0.30 | 2.94 | 0.33 | 0.00 | 0.00 | 0.00 | 0.00 | 0.00 | 0.01 | 0.31 |
Figure 7. Responses to a Financial Spread Increase in Large South Under Flexible Exchange Rate and in a Currency Union
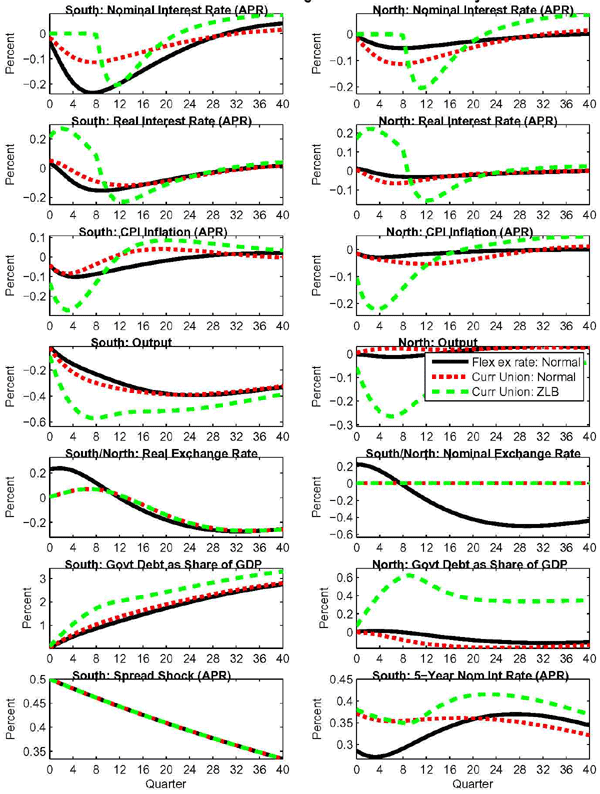
Data for Figure 7 - Flex Ex Rate Normal
| Quarter | South: Nominal Interest Rate (annualised, in percentage points) | South: Real Interest Rate (annualised, in percentage points) | South: CPI Inflation (annualised, in percentage points) | South: Output (percent) | South: Real Exchange Rate (percent) | South: Govt Debt (Share of GDP, in percentage points) | South: Spread Shock (annualised, in percentage points) | North: Nominal Interest Rate (annualised, in percentage points) | North: Real Interest Rate (annualised, in percentage points) | North: CPI Inflation (annualised, in percentage points) | North: Output (percent) | North: Nominal Exchange Rate (percent) | North: Govt Debt (Share of GDP, in percentage points) | North: South: 5-year Nom Int Rate (annualised, in percentage points) |
|---|---|---|---|---|---|---|---|---|---|---|---|---|---|---|
| 0.00 | -0.03 | 0.04 | -0.04 | -0.02 | 0.23 | 0.02 | 0.50 | -0.01 | 0.01 | -0.01 | 0.00 | 0.22 | 0.00 | 0.29 |
| 1.00 | -0.08 | 0.01 | -0.07 | -0.06 | 0.24 | 0.16 | 0.50 | -0.02 | 0.01 | -0.02 | 0.00 | 0.22 | 0.01 | 0.28 |
| 2.00 | -0.12 | -0.03 | -0.09 | -0.10 | 0.24 | 0.29 | 0.49 | -0.03 | 0.00 | -0.03 | -0.01 | 0.20 | 0.01 | 0.27 |
| 3.00 | -0.16 | -0.06 | -0.10 | -0.13 | 0.23 | 0.41 | 0.49 | -0.04 | -0.01 | -0.03 | -0.01 | 0.18 | 0.01 | 0.27 |
| 4.00 | -0.19 | -0.09 | -0.10 | -0.15 | 0.22 | 0.51 | 0.48 | -0.04 | -0.02 | -0.03 | -0.01 | 0.15 | 0.01 | 0.27 |
| 5.00 | -0.22 | -0.12 | -0.10 | -0.18 | 0.20 | 0.61 | 0.48 | -0.05 | -0.02 | -0.03 | -0.01 | 0.11 | 0.01 | 0.27 |
| 6.00 | -0.23 | -0.14 | -0.10 | -0.20 | 0.17 | 0.70 | 0.47 | -0.05 | -0.03 | -0.03 | -0.01 | 0.07 | 0.01 | 0.28 |
| 7.00 | -0.23 | -0.15 | -0.09 | -0.21 | 0.15 | 0.78 | 0.47 | -0.05 | -0.03 | -0.02 | -0.01 | 0.02 | 0.00 | 0.28 |
| 8.00 | -0.23 | -0.15 | -0.09 | -0.23 | 0.12 | 0.86 | 0.46 | -0.05 | -0.03 | -0.02 | -0.01 | -0.02 | 0.00 | 0.29 |
| 9.00 | -0.23 | -0.15 | -0.08 | -0.25 | 0.09 | 0.94 | 0.46 | -0.05 | -0.03 | -0.02 | -0.01 | -0.07 | -0.01 | 0.30 |
| 10.00 | -0.22 | -0.15 | -0.07 | -0.27 | 0.06 | 1.02 | 0.45 | -0.05 | -0.03 | -0.02 | -0.01 | -0.11 | -0.02 | 0.30 |
| 11.00 | -0.21 | -0.15 | -0.07 | -0.28 | 0.03 | 1.09 | 0.45 | -0.05 | -0.03 | -0.02 | -0.01 | -0.15 | -0.03 | 0.31 |
| 12.00 | -0.20 | -0.14 | -0.06 | -0.30 | 0.00 | 1.17 | 0.44 | -0.05 | -0.03 | -0.02 | 0.00 | -0.19 | -0.03 | 0.32 |
| 13.00 | -0.19 | -0.14 | -0.06 | -0.31 | -0.03 | 1.24 | 0.44 | -0.04 | -0.03 | -0.01 | 0.00 | -0.23 | -0.04 | 0.32 |
| 14.00 | -0.17 | -0.13 | -0.05 | -0.33 | -0.06 | 1.32 | 0.43 | -0.04 | -0.03 | -0.01 | 0.00 | -0.27 | -0.05 | 0.33 |
| 15.00 | -0.16 | -0.12 | -0.04 | -0.34 | -0.08 | 1.39 | 0.43 | -0.04 | -0.03 | -0.01 | 0.00 | -0.30 | -0.06 | 0.34 |
| 16.00 | -0.15 | -0.11 | -0.04 | -0.35 | -0.10 | 1.46 | 0.43 | -0.04 | -0.03 | -0.01 | 0.01 | -0.33 | -0.06 | 0.34 |
| 17.00 | -0.13 | -0.11 | -0.03 | -0.36 | -0.12 | 1.53 | 0.42 | -0.03 | -0.03 | -0.01 | 0.01 | -0.36 | -0.07 | 0.35 |
| 18.00 | -0.12 | -0.10 | -0.03 | -0.37 | -0.14 | 1.60 | 0.42 | -0.03 | -0.02 | -0.01 | 0.01 | -0.38 | -0.08 | 0.35 |
| 19.00 | -0.11 | -0.09 | -0.02 | -0.38 | -0.16 | 1.67 | 0.41 | -0.03 | -0.02 | -0.01 | 0.01 | -0.40 | -0.08 | 0.35 |
| 20.00 | -0.10 | -0.08 | -0.02 | -0.38 | -0.18 | 1.74 | 0.41 | -0.03 | -0.02 | -0.01 | 0.02 | -0.42 | -0.09 | 0.36 |
| 21.00 | -0.08 | -0.07 | -0.01 | -0.39 | -0.19 | 1.80 | 0.40 | -0.02 | -0.02 | -0.01 | 0.02 | -0.44 | -0.09 | 0.36 |
| 22.00 | -0.07 | -0.07 | -0.01 | -0.39 | -0.21 | 1.87 | 0.40 | -0.02 | -0.02 | -0.01 | 0.02 | -0.46 | -0.10 | 0.36 |
| 23.00 | -0.06 | -0.06 | -0.01 | -0.39 | -0.22 | 1.93 | 0.40 | -0.02 | -0.02 | 0.00 | 0.02 | -0.47 | -0.10 | 0.37 |
| 24.00 | -0.05 | -0.05 | 0.00 | -0.39 | -0.23 | 1.99 | 0.39 | -0.02 | -0.02 | 0.00 | 0.02 | -0.48 | -0.11 | 0.37 |
| 25.00 | -0.04 | -0.05 | 0.00 | -0.39 | -0.24 | 2.05 | 0.39 | -0.02 | -0.01 | 0.00 | 0.03 | -0.49 | -0.11 | 0.37 |
| 26.00 | -0.03 | -0.04 | 0.00 | -0.39 | -0.25 | 2.11 | 0.39 | -0.01 | -0.01 | 0.00 | 0.03 | -0.49 | -0.11 | 0.37 |
| 27.00 | -0.02 | -0.03 | 0.01 | -0.39 | -0.26 | 2.17 | 0.38 | -0.01 | -0.01 | 0.00 | 0.03 | -0.50 | -0.11 | 0.37 |
| 28.00 | -0.02 | -0.03 | 0.01 | -0.39 | -0.26 | 2.22 | 0.38 | -0.01 | -0.01 | 0.00 | 0.03 | -0.50 | -0.12 | 0.37 |
| 29.00 | -0.01 | -0.02 | 0.01 | -0.39 | -0.27 | 2.27 | 0.37 | -0.01 | -0.01 | 0.00 | 0.03 | -0.50 | -0.12 | 0.37 |
| 30.00 | 0.00 | -0.02 | 0.01 | -0.38 | -0.27 | 2.33 | 0.37 | -0.01 | -0.01 | 0.00 | 0.03 | -0.50 | -0.12 | 0.37 |
| 31.00 | 0.00 | -0.01 | 0.01 | -0.38 | -0.27 | 2.38 | 0.37 | -0.01 | -0.01 | 0.00 | 0.03 | -0.50 | -0.12 | 0.37 |
| 32.00 | 0.01 | -0.01 | 0.02 | -0.38 | -0.27 | 2.43 | 0.36 | -0.01 | -0.01 | 0.00 | 0.03 | -0.50 | -0.12 | 0.37 |
| 33.00 | 0.02 | 0.00 | 0.02 | -0.37 | -0.27 | 2.47 | 0.36 | 0.00 | -0.01 | 0.00 | 0.03 | -0.49 | -0.12 | 0.36 |
| 34.00 | 0.02 | 0.00 | 0.02 | -0.37 | -0.27 | 2.52 | 0.36 | 0.00 | 0.00 | 0.00 | 0.03 | -0.49 | -0.12 | 0.36 |
| 35.00 | 0.03 | 0.01 | 0.02 | -0.36 | -0.27 | 2.56 | 0.35 | 0.00 | 0.00 | 0.00 | 0.03 | -0.48 | -0.12 | 0.36 |
| 36.00 | 0.03 | 0.01 | 0.02 | -0.35 | -0.27 | 2.60 | 0.35 | 0.00 | 0.00 | 0.00 | 0.03 | -0.47 | -0.12 | 0.36 |
| 37.00 | 0.03 | 0.01 | 0.02 | -0.35 | -0.26 | 2.64 | 0.34 | 0.00 | 0.00 | 0.00 | 0.03 | -0.47 | -0.12 | 0.35 |
| 38.00 | 0.04 | 0.01 | 0.02 | -0.34 | -0.26 | 2.68 | 0.34 | 0.00 | 0.00 | 0.00 | 0.03 | -0.46 | -0.12 | 0.35 |
| 39.00 | 0.04 | 0.02 | 0.02 | -0.34 | -0.26 | 2.72 | 0.34 | 0.00 | 0.00 | 0.00 | 0.03 | -0.45 | -0.11 | 0.35 |
| 40.00 | 0.04 | 0.02 | 0.02 | -0.33 | -0.25 | 2.75 | 0.33 | 0.00 | 0.00 | 0.00 | 0.03 | -0.44 | -0.11 | 0.34 |
Data for Figure 7 - Curr Union Normal
| Quarter | South: Nominal Interest Rate (annualised, in percentage points) | South: Real Interest Rate (annualised, in percentage points) | South: CPI Inflation (annualised, in percentage points) | South: Output (percent) | South: Real Exchange Rate (percent) | South: Govt Debt (Share of GDP, in percentage points) | South: Spread Shock (annualised, in percentage points) | North: Nominal Interest Rate (annualised, in percentage points) | North: Real Interest Rate (annualised, in percentage points) | North: CPI Inflation (annualised, in percentage points) | North: Output (percent) | North: Nominal Exchange Rate (percent) | North: Govt Debt (Share of GDP, in percentage points) | North: South: 5-year Nom Int Rate (annualised, in percentage points) |
|---|---|---|---|---|---|---|---|---|---|---|---|---|---|---|
| 0.00 | -0.02 | 0.05 | -0.04 | -0.03 | 0.01 | 0.03 | 0.50 | -0.02 | 0.01 | -0.01 | 0.00 | 0.00 | 0.00 | 0.37 |
| 1.00 | -0.04 | 0.04 | -0.07 | -0.09 | 0.02 | 0.19 | 0.50 | -0.04 | -0.01 | -0.02 | 0.01 | 0.00 | -0.01 | 0.37 |
| 2.00 | -0.06 | 0.03 | -0.08 | -0.14 | 0.03 | 0.34 | 0.49 | -0.06 | -0.03 | -0.03 | 0.01 | 0.00 | -0.01 | 0.36 |
| 3.00 | -0.08 | 0.00 | -0.09 | -0.18 | 0.04 | 0.48 | 0.49 | -0.08 | -0.04 | -0.03 | 0.02 | 0.00 | -0.02 | 0.36 |
| 4.00 | -0.09 | -0.02 | -0.08 | -0.22 | 0.06 | 0.60 | 0.48 | -0.09 | -0.05 | -0.04 | 0.02 | 0.00 | -0.03 | 0.36 |
| 5.00 | -0.10 | -0.04 | -0.07 | -0.25 | 0.06 | 0.72 | 0.48 | -0.10 | -0.06 | -0.04 | 0.02 | 0.00 | -0.05 | 0.35 |
| 6.00 | -0.11 | -0.06 | -0.06 | -0.27 | 0.07 | 0.83 | 0.47 | -0.11 | -0.06 | -0.04 | 0.02 | 0.00 | -0.06 | 0.35 |
| 7.00 | -0.11 | -0.08 | -0.05 | -0.29 | 0.07 | 0.94 | 0.47 | -0.11 | -0.06 | -0.05 | 0.02 | 0.00 | -0.07 | 0.35 |
| 8.00 | -0.11 | -0.09 | -0.04 | -0.30 | 0.07 | 1.03 | 0.46 | -0.11 | -0.06 | -0.05 | 0.02 | 0.00 | -0.09 | 0.35 |
| 9.00 | -0.11 | -0.10 | -0.02 | -0.31 | 0.06 | 1.12 | 0.46 | -0.11 | -0.06 | -0.05 | 0.02 | 0.00 | -0.10 | 0.36 |
| 10.00 | -0.11 | -0.11 | -0.01 | -0.33 | 0.05 | 1.21 | 0.45 | -0.11 | -0.06 | -0.05 | 0.02 | 0.00 | -0.11 | 0.36 |
| 11.00 | -0.10 | -0.11 | 0.00 | -0.34 | 0.04 | 1.29 | 0.45 | -0.10 | -0.05 | -0.05 | 0.02 | 0.00 | -0.12 | 0.36 |
| 12.00 | -0.10 | -0.12 | 0.01 | -0.34 | 0.02 | 1.36 | 0.44 | -0.10 | -0.05 | -0.05 | 0.02 | 0.00 | -0.13 | 0.36 |
| 13.00 | -0.09 | -0.12 | 0.02 | -0.35 | 0.00 | 1.44 | 0.44 | -0.09 | -0.04 | -0.05 | 0.02 | 0.00 | -0.14 | 0.36 |
| 14.00 | -0.09 | -0.12 | 0.03 | -0.36 | -0.02 | 1.51 | 0.43 | -0.09 | -0.04 | -0.05 | 0.02 | 0.00 | -0.14 | 0.36 |
| 15.00 | -0.08 | -0.12 | 0.03 | -0.37 | -0.04 | 1.58 | 0.43 | -0.08 | -0.03 | -0.05 | 0.02 | 0.00 | -0.15 | 0.36 |
| 16.00 | -0.07 | -0.11 | 0.04 | -0.37 | -0.06 | 1.64 | 0.43 | -0.07 | -0.03 | -0.05 | 0.02 | 0.00 | -0.16 | 0.36 |
| 17.00 | -0.07 | -0.11 | 0.04 | -0.38 | -0.08 | 1.71 | 0.42 | -0.07 | -0.02 | -0.05 | 0.02 | 0.00 | -0.16 | 0.36 |
| 18.00 | -0.06 | -0.10 | 0.04 | -0.38 | -0.10 | 1.77 | 0.42 | -0.06 | -0.02 | -0.04 | 0.02 | 0.00 | -0.16 | 0.36 |
| 19.00 | -0.06 | -0.10 | 0.04 | -0.38 | -0.12 | 1.83 | 0.41 | -0.06 | -0.02 | -0.04 | 0.02 | 0.00 | -0.16 | 0.36 |
| 20.00 | -0.05 | -0.09 | 0.04 | -0.39 | -0.14 | 1.89 | 0.41 | -0.05 | -0.02 | -0.04 | 0.02 | 0.00 | -0.17 | 0.36 |
| 21.00 | -0.04 | -0.08 | 0.04 | -0.39 | -0.16 | 1.95 | 0.40 | -0.04 | -0.02 | -0.03 | 0.02 | 0.00 | -0.17 | 0.36 |
| 22.00 | -0.04 | -0.08 | 0.04 | -0.39 | -0.17 | 2.01 | 0.40 | -0.04 | -0.01 | -0.03 | 0.02 | 0.00 | -0.17 | 0.36 |
| 23.00 | -0.03 | -0.07 | 0.04 | -0.39 | -0.19 | 2.06 | 0.40 | -0.03 | -0.01 | -0.03 | 0.02 | 0.00 | -0.17 | 0.36 |
| 24.00 | -0.03 | -0.06 | 0.03 | -0.39 | -0.20 | 2.12 | 0.39 | -0.03 | -0.01 | -0.02 | 0.02 | 0.00 | -0.17 | 0.36 |
| 25.00 | -0.03 | -0.05 | 0.03 | -0.39 | -0.22 | 2.17 | 0.39 | -0.03 | -0.01 | -0.02 | 0.02 | 0.00 | -0.17 | 0.36 |
| 26.00 | -0.02 | -0.05 | 0.03 | -0.39 | -0.23 | 2.23 | 0.39 | -0.02 | -0.01 | -0.02 | 0.02 | 0.00 | -0.17 | 0.35 |
| 27.00 | -0.02 | -0.04 | 0.03 | -0.38 | -0.24 | 2.28 | 0.38 | -0.02 | -0.01 | -0.01 | 0.02 | 0.00 | -0.17 | 0.35 |
| 28.00 | -0.01 | -0.03 | 0.02 | -0.38 | -0.25 | 2.33 | 0.38 | -0.01 | -0.01 | -0.01 | 0.03 | 0.00 | -0.17 | 0.35 |
| 29.00 | -0.01 | -0.03 | 0.02 | -0.38 | -0.25 | 2.37 | 0.37 | -0.01 | -0.01 | -0.01 | 0.03 | 0.00 | -0.17 | 0.35 |
| 30.00 | -0.01 | -0.02 | 0.02 | -0.37 | -0.26 | 2.42 | 0.37 | -0.01 | -0.01 | 0.00 | 0.03 | 0.00 | -0.17 | 0.35 |
| 31.00 | 0.00 | -0.02 | 0.02 | -0.37 | -0.26 | 2.47 | 0.37 | 0.00 | 0.00 | 0.00 | 0.03 | 0.00 | -0.16 | 0.35 |
| 32.00 | 0.00 | -0.01 | 0.01 | -0.37 | -0.27 | 2.51 | 0.36 | 0.00 | 0.00 | 0.00 | 0.03 | 0.00 | -0.16 | 0.34 |
| 33.00 | 0.00 | -0.01 | 0.01 | -0.36 | -0.27 | 2.56 | 0.36 | 0.00 | 0.00 | 0.00 | 0.03 | 0.00 | -0.16 | 0.34 |
| 34.00 | 0.00 | 0.00 | 0.01 | -0.36 | -0.27 | 2.60 | 0.36 | 0.00 | 0.00 | 0.01 | 0.03 | 0.00 | -0.16 | 0.34 |
| 35.00 | 0.01 | 0.00 | 0.01 | -0.35 | -0.27 | 2.64 | 0.35 | 0.01 | 0.00 | 0.01 | 0.03 | 0.00 | -0.16 | 0.34 |
| 36.00 | 0.01 | 0.01 | 0.00 | -0.35 | -0.27 | 2.67 | 0.35 | 0.01 | 0.00 | 0.01 | 0.03 | 0.00 | -0.15 | 0.33 |
| 37.00 | 0.01 | 0.01 | 0.00 | -0.34 | -0.26 | 2.71 | 0.34 | 0.01 | 0.00 | 0.01 | 0.03 | 0.00 | -0.15 | 0.33 |
| 38.00 | 0.01 | 0.01 | 0.00 | -0.34 | -0.26 | 2.75 | 0.34 | 0.01 | 0.00 | 0.01 | 0.03 | 0.00 | -0.15 | 0.33 |
| 39.00 | 0.01 | 0.02 | 0.00 | -0.33 | -0.26 | 2.78 | 0.34 | 0.01 | 0.00 | 0.01 | 0.03 | 0.00 | -0.15 | 0.32 |
| 40.00 | 0.01 | 0.02 | 0.00 | -0.32 | -0.26 | 2.81 | 0.33 | 0.01 | 0.00 | 0.01 | 0.03 | 0.00 | -0.14 | 0.32 |
Data for Figure 7 - Curr Union ZLB
| Quarter | South: Nominal Interest Rate (annualised, in percentage points) | South: Real Interest Rate (annualised, in percentage points) | South: CPI Inflation (annualised, in percentage points) | South: Output (percent) | South: Real Exchange Rate (percent) | South: Govt Debt (Share of GDP, in percentage points) | South: Spread Shock (annualised, in percentage points) | North: Nominal Interest Rate (annualised, in percentage points) | North: Real Interest Rate (annualised, in percentage points) | North: CPI Inflation (annualised, in percentage points) | North: Output (percent) | North: Nominal Exchange Rate (percent) | North: Govt Debt (Share of GDP, in percentage points) | North: South: 5-year Nom Int Rate (annualised, in percentage points) |
|---|---|---|---|---|---|---|---|---|---|---|---|---|---|---|
| 0.00 | 0.00 | 0.22 | -0.13 | -0.09 | 0.01 | 0.10 | 0.50 | 0.00 | 0.17 | -0.10 | -0.06 | 0.00 | 0.07 | 0.38 |
| 1.00 | 0.00 | 0.26 | -0.22 | -0.23 | 0.02 | 0.35 | 0.50 | 0.00 | 0.21 | -0.17 | -0.12 | 0.00 | 0.16 | 0.38 |
| 2.00 | 0.00 | 0.27 | -0.26 | -0.33 | 0.03 | 0.60 | 0.49 | 0.00 | 0.22 | -0.21 | -0.18 | 0.00 | 0.25 | 0.37 |
| 3.00 | 0.00 | 0.27 | -0.27 | -0.42 | 0.04 | 0.83 | 0.49 | 0.00 | 0.22 | -0.22 | -0.22 | 0.00 | 0.33 | 0.37 |
| 4.00 | 0.00 | 0.24 | -0.27 | -0.48 | 0.06 | 1.05 | 0.48 | 0.00 | 0.21 | -0.22 | -0.24 | 0.00 | 0.41 | 0.36 |
| 5.00 | 0.00 | 0.21 | -0.24 | -0.53 | 0.06 | 1.25 | 0.48 | 0.00 | 0.19 | -0.21 | -0.26 | 0.00 | 0.48 | 0.36 |
| 6.00 | 0.00 | 0.17 | -0.21 | -0.55 | 0.07 | 1.43 | 0.47 | 0.00 | 0.17 | -0.19 | -0.27 | 0.00 | 0.53 | 0.35 |
| 7.00 | 0.00 | 0.13 | -0.17 | -0.57 | 0.07 | 1.59 | 0.47 | 0.00 | 0.14 | -0.17 | -0.26 | 0.00 | 0.58 | 0.35 |
| 8.00 | 0.00 | 0.09 | -0.13 | -0.57 | 0.07 | 1.73 | 0.46 | 0.00 | 0.11 | -0.14 | -0.25 | 0.00 | 0.61 | 0.35 |
| 9.00 | -0.12 | -0.07 | -0.09 | -0.56 | 0.06 | 1.85 | 0.46 | -0.12 | -0.03 | -0.12 | -0.23 | 0.00 | 0.62 | 0.35 |
| 10.00 | -0.18 | -0.16 | -0.05 | -0.55 | 0.05 | 1.93 | 0.45 | -0.18 | -0.11 | -0.10 | -0.21 | 0.00 | 0.61 | 0.35 |
| 11.00 | -0.20 | -0.21 | -0.02 | -0.54 | 0.04 | 1.99 | 0.45 | -0.20 | -0.15 | -0.08 | -0.19 | 0.00 | 0.58 | 0.36 |
| 12.00 | -0.20 | -0.23 | 0.01 | -0.53 | 0.02 | 2.04 | 0.44 | -0.20 | -0.16 | -0.06 | -0.17 | 0.00 | 0.55 | 0.37 |
| 13.00 | -0.18 | -0.23 | 0.03 | -0.53 | 0.00 | 2.09 | 0.44 | -0.18 | -0.15 | -0.04 | -0.16 | 0.00 | 0.51 | 0.38 |
| 14.00 | -0.16 | -0.22 | 0.05 | -0.52 | -0.02 | 2.13 | 0.43 | -0.16 | -0.14 | -0.03 | -0.15 | 0.00 | 0.48 | 0.39 |
| 15.00 | -0.13 | -0.20 | 0.06 | -0.52 | -0.04 | 2.18 | 0.43 | -0.13 | -0.12 | -0.02 | -0.14 | 0.00 | 0.45 | 0.39 |
| 16.00 | -0.11 | -0.18 | 0.07 | -0.52 | -0.06 | 2.22 | 0.43 | -0.11 | -0.10 | -0.01 | -0.13 | 0.00 | 0.42 | 0.40 |
| 17.00 | -0.08 | -0.16 | 0.08 | -0.52 | -0.08 | 2.27 | 0.42 | -0.08 | -0.08 | -0.01 | -0.12 | 0.00 | 0.40 | 0.41 |
| 18.00 | -0.06 | -0.15 | 0.08 | -0.52 | -0.10 | 2.32 | 0.42 | -0.06 | -0.06 | 0.00 | -0.12 | 0.00 | 0.39 | 0.41 |
| 19.00 | -0.04 | -0.13 | 0.08 | -0.52 | -0.12 | 2.37 | 0.41 | -0.04 | -0.05 | 0.00 | -0.11 | 0.00 | 0.37 | 0.41 |
| 20.00 | -0.03 | -0.11 | 0.09 | -0.51 | -0.14 | 2.42 | 0.41 | -0.03 | -0.04 | 0.01 | -0.11 | 0.00 | 0.36 | 0.41 |
| 21.00 | -0.01 | -0.10 | 0.09 | -0.51 | -0.16 | 2.48 | 0.40 | -0.01 | -0.03 | 0.01 | -0.10 | 0.00 | 0.36 | 0.41 |
| 22.00 | 0.00 | -0.08 | 0.08 | -0.51 | -0.17 | 2.53 | 0.40 | 0.00 | -0.02 | 0.02 | -0.10 | 0.00 | 0.35 | 0.42 |
| 23.00 | 0.01 | -0.07 | 0.08 | -0.51 | -0.19 | 2.58 | 0.40 | 0.01 | -0.01 | 0.02 | -0.10 | 0.00 | 0.34 | 0.42 |
| 24.00 | 0.02 | -0.06 | 0.08 | -0.50 | -0.20 | 2.63 | 0.39 | 0.02 | -0.01 | 0.02 | -0.09 | 0.00 | 0.34 | 0.42 |
| 25.00 | 0.03 | -0.05 | 0.08 | -0.50 | -0.22 | 2.68 | 0.39 | 0.03 | 0.00 | 0.03 | -0.09 | 0.00 | 0.34 | 0.41 |
| 26.00 | 0.03 | -0.04 | 0.07 | -0.49 | -0.23 | 2.73 | 0.39 | 0.03 | 0.00 | 0.03 | -0.08 | 0.00 | 0.34 | 0.41 |
| 27.00 | 0.04 | -0.03 | 0.07 | -0.49 | -0.24 | 2.78 | 0.38 | 0.04 | 0.00 | 0.03 | -0.08 | 0.00 | 0.34 | 0.41 |
| 28.00 | 0.04 | -0.02 | 0.07 | -0.48 | -0.25 | 2.83 | 0.38 | 0.04 | 0.01 | 0.03 | -0.07 | 0.00 | 0.34 | 0.41 |
| 29.00 | 0.05 | -0.01 | 0.06 | -0.47 | -0.25 | 2.88 | 0.37 | 0.05 | 0.01 | 0.04 | -0.07 | 0.00 | 0.34 | 0.41 |
| 30.00 | 0.05 | -0.01 | 0.06 | -0.47 | -0.26 | 2.92 | 0.37 | 0.05 | 0.01 | 0.04 | -0.07 | 0.00 | 0.34 | 0.40 |
| 31.00 | 0.06 | 0.00 | 0.06 | -0.46 | -0.26 | 2.97 | 0.37 | 0.06 | 0.01 | 0.04 | -0.06 | 0.00 | 0.34 | 0.40 |
| 32.00 | 0.06 | 0.01 | 0.05 | -0.45 | -0.27 | 3.01 | 0.36 | 0.06 | 0.02 | 0.04 | -0.06 | 0.00 | 0.34 | 0.40 |
| 33.00 | 0.06 | 0.01 | 0.05 | -0.44 | -0.27 | 3.05 | 0.36 | 0.06 | 0.02 | 0.04 | -0.06 | 0.00 | 0.34 | 0.40 |
| 34.00 | 0.07 | 0.02 | 0.05 | -0.44 | -0.27 | 3.09 | 0.36 | 0.07 | 0.02 | 0.05 | -0.05 | 0.00 | 0.34 | 0.39 |
| 35.00 | 0.07 | 0.02 | 0.05 | -0.43 | -0.27 | 3.13 | 0.35 | 0.07 | 0.02 | 0.05 | -0.05 | 0.00 | 0.34 | 0.39 |
| 36.00 | 0.07 | 0.03 | 0.04 | -0.42 | -0.27 | 3.17 | 0.35 | 0.07 | 0.02 | 0.05 | -0.05 | 0.00 | 0.34 | 0.39 |
| 37.00 | 0.07 | 0.03 | 0.04 | -0.41 | -0.26 | 3.21 | 0.34 | 0.07 | 0.02 | 0.05 | -0.04 | 0.00 | 0.34 | 0.38 |
| 38.00 | 0.07 | 0.04 | 0.04 | -0.40 | -0.26 | 3.24 | 0.34 | 0.07 | 0.02 | 0.05 | -0.04 | 0.00 | 0.35 | 0.38 |
| 39.00 | 0.07 | 0.04 | 0.04 | -0.39 | -0.26 | 3.27 | 0.34 | 0.07 | 0.02 | 0.05 | -0.04 | 0.00 | 0.35 | 0.37 |
| 40.00 | 0.07 | 0.04 | 0.03 | -0.39 | -0.26 | 3.30 | 0.33 | 0.07 | 0.02 | 0.05 | -0.04 | 0.00 | 0.35 | 0.37 |
Figure 8. Responses to a Financial Spread Increases of Different Sizes in Large South in a Currency Union in a Liquidity Trap
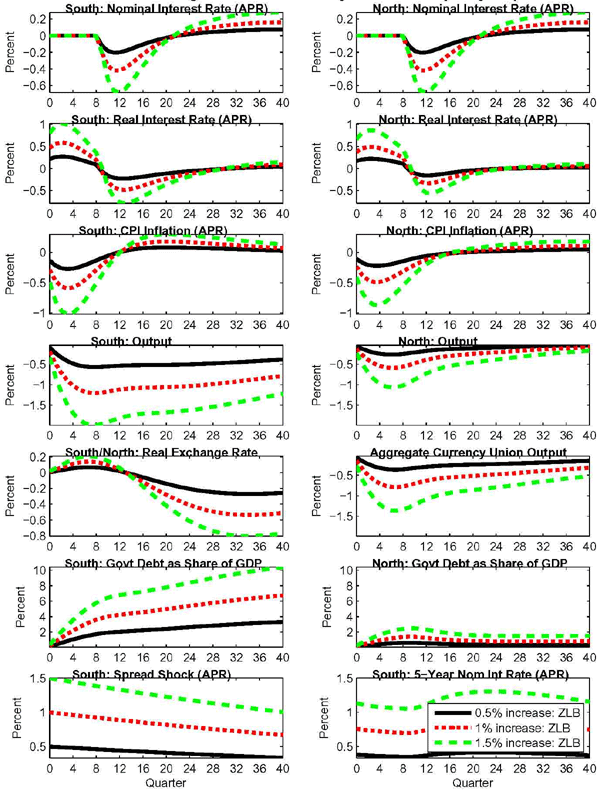
Data for Figure 8 - 0.5% Increase ZLB
| Quarter | South: Nominal Interest Rate (annualised, in percentage points) | South: Real Interest Rate (annualised, in percentage points) | South: CPI Inflation (annualised, in percentage points) | South: Output (percent) | South: Real Exchange Rate (percent) | South: Govt Debt (Share of GDP, in percentage points) | South: Spread Shock (annualised, in percentage points) | North: Nominal Interest Rate (annualised, in percentage points) | North: Real Interest Rate (annualised, in percentage points) | North: CPI Inflation (annualised, in percentage points) | North: Output (percent) | North: Agg Curr Union Output (percent) | North: Govt Debt (Share of GDP, in percentage points) | North: South: 5-year Nom Int Rate (annualised, in percentage points) |
|---|---|---|---|---|---|---|---|---|---|---|---|---|---|---|
| 0.00 | 0.00 | 0.22 | -0.13 | -0.09 | 0.01 | 0.10 | 0.50 | 0.00 | 0.17 | -0.10 | -0.06 | -0.07 | 0.07 | 0.38 |
| 1.00 | 0.00 | 0.26 | -0.22 | -0.23 | 0.02 | 0.35 | 0.50 | 0.00 | 0.21 | -0.17 | -0.12 | -0.16 | 0.16 | 0.38 |
| 2.00 | 0.00 | 0.27 | -0.26 | -0.33 | 0.03 | 0.60 | 0.49 | 0.00 | 0.22 | -0.21 | -0.18 | -0.23 | 0.25 | 0.37 |
| 3.00 | 0.00 | 0.27 | -0.27 | -0.42 | 0.04 | 0.83 | 0.49 | 0.00 | 0.22 | -0.22 | -0.22 | -0.28 | 0.33 | 0.37 |
| 4.00 | 0.00 | 0.24 | -0.27 | -0.48 | 0.06 | 1.05 | 0.48 | 0.00 | 0.21 | -0.22 | -0.24 | -0.32 | 0.41 | 0.36 |
| 5.00 | 0.00 | 0.21 | -0.24 | -0.53 | 0.06 | 1.25 | 0.48 | 0.00 | 0.19 | -0.21 | -0.26 | -0.35 | 0.48 | 0.36 |
| 6.00 | 0.00 | 0.17 | -0.21 | -0.55 | 0.07 | 1.43 | 0.47 | 0.00 | 0.17 | -0.19 | -0.27 | -0.36 | 0.53 | 0.35 |
| 7.00 | 0.00 | 0.13 | -0.17 | -0.57 | 0.07 | 1.59 | 0.47 | 0.00 | 0.14 | -0.17 | -0.26 | -0.36 | 0.58 | 0.35 |
| 8.00 | 0.00 | 0.09 | -0.13 | -0.57 | 0.07 | 1.73 | 0.46 | 0.00 | 0.11 | -0.14 | -0.25 | -0.36 | 0.61 | 0.35 |
| 9.00 | -0.12 | -0.07 | -0.09 | -0.56 | 0.06 | 1.85 | 0.46 | -0.12 | -0.03 | -0.12 | -0.23 | -0.34 | 0.62 | 0.35 |
| 10.00 | -0.18 | -0.16 | -0.05 | -0.55 | 0.05 | 1.93 | 0.45 | -0.18 | -0.11 | -0.10 | -0.21 | -0.32 | 0.61 | 0.35 |
| 11.00 | -0.20 | -0.21 | -0.02 | -0.54 | 0.04 | 1.99 | 0.45 | -0.20 | -0.15 | -0.08 | -0.19 | -0.31 | 0.58 | 0.36 |
| 12.00 | -0.20 | -0.23 | 0.01 | -0.53 | 0.02 | 2.04 | 0.44 | -0.20 | -0.16 | -0.06 | -0.17 | -0.29 | 0.55 | 0.37 |
| 13.00 | -0.18 | -0.23 | 0.03 | -0.53 | 0.00 | 2.09 | 0.44 | -0.18 | -0.15 | -0.04 | -0.16 | -0.28 | 0.51 | 0.38 |
| 14.00 | -0.16 | -0.22 | 0.05 | -0.52 | -0.02 | 2.13 | 0.43 | -0.16 | -0.14 | -0.03 | -0.15 | -0.27 | 0.48 | 0.39 |
| 15.00 | -0.13 | -0.20 | 0.06 | -0.52 | -0.04 | 2.18 | 0.43 | -0.13 | -0.12 | -0.02 | -0.14 | -0.27 | 0.45 | 0.39 |
| 16.00 | -0.11 | -0.18 | 0.07 | -0.52 | -0.06 | 2.22 | 0.43 | -0.11 | -0.10 | -0.01 | -0.13 | -0.26 | 0.42 | 0.40 |
| 17.00 | -0.08 | -0.16 | 0.08 | -0.52 | -0.08 | 2.27 | 0.42 | -0.08 | -0.08 | -0.01 | -0.12 | -0.26 | 0.40 | 0.41 |
| 18.00 | -0.06 | -0.15 | 0.08 | -0.52 | -0.10 | 2.32 | 0.42 | -0.06 | -0.06 | 0.00 | -0.12 | -0.25 | 0.39 | 0.41 |
| 19.00 | -0.04 | -0.13 | 0.08 | -0.52 | -0.12 | 2.37 | 0.41 | -0.04 | -0.05 | 0.00 | -0.11 | -0.25 | 0.37 | 0.41 |
| 20.00 | -0.03 | -0.11 | 0.09 | -0.51 | -0.14 | 2.42 | 0.41 | -0.03 | -0.04 | 0.01 | -0.11 | -0.24 | 0.36 | 0.41 |
| 21.00 | -0.01 | -0.10 | 0.09 | -0.51 | -0.16 | 2.48 | 0.40 | -0.01 | -0.03 | 0.01 | -0.10 | -0.24 | 0.36 | 0.41 |
| 22.00 | 0.00 | -0.08 | 0.08 | -0.51 | -0.17 | 2.53 | 0.40 | 0.00 | -0.02 | 0.02 | -0.10 | -0.24 | 0.35 | 0.42 |
| 23.00 | 0.01 | -0.07 | 0.08 | -0.51 | -0.19 | 2.58 | 0.40 | 0.01 | -0.01 | 0.02 | -0.10 | -0.23 | 0.34 | 0.42 |
| 24.00 | 0.02 | -0.06 | 0.08 | -0.50 | -0.20 | 2.63 | 0.39 | 0.02 | -0.01 | 0.02 | -0.09 | -0.23 | 0.34 | 0.42 |
| 25.00 | 0.03 | -0.05 | 0.08 | -0.50 | -0.22 | 2.68 | 0.39 | 0.03 | 0.00 | 0.03 | -0.09 | -0.22 | 0.34 | 0.41 |
| 26.00 | 0.03 | -0.04 | 0.07 | -0.49 | -0.23 | 2.73 | 0.39 | 0.03 | 0.00 | 0.03 | -0.08 | -0.22 | 0.34 | 0.41 |
| 27.00 | 0.04 | -0.03 | 0.07 | -0.49 | -0.24 | 2.78 | 0.38 | 0.04 | 0.00 | 0.03 | -0.08 | -0.21 | 0.34 | 0.41 |
| 28.00 | 0.04 | -0.02 | 0.07 | -0.48 | -0.25 | 2.83 | 0.38 | 0.04 | 0.01 | 0.03 | -0.07 | -0.21 | 0.34 | 0.41 |
| 29.00 | 0.05 | -0.01 | 0.06 | -0.47 | -0.25 | 2.88 | 0.37 | 0.05 | 0.01 | 0.04 | -0.07 | -0.20 | 0.34 | 0.41 |
| 30.00 | 0.05 | -0.01 | 0.06 | -0.47 | -0.26 | 2.92 | 0.37 | 0.05 | 0.01 | 0.04 | -0.07 | -0.20 | 0.34 | 0.40 |
| 31.00 | 0.06 | 0.00 | 0.06 | -0.46 | -0.26 | 2.97 | 0.37 | 0.06 | 0.01 | 0.04 | -0.06 | -0.19 | 0.34 | 0.40 |
| 32.00 | 0.06 | 0.01 | 0.05 | -0.45 | -0.27 | 3.01 | 0.36 | 0.06 | 0.02 | 0.04 | -0.06 | -0.19 | 0.34 | 0.40 |
| 33.00 | 0.06 | 0.01 | 0.05 | -0.44 | -0.27 | 3.05 | 0.36 | 0.06 | 0.02 | 0.04 | -0.06 | -0.18 | 0.34 | 0.40 |
| 34.00 | 0.07 | 0.02 | 0.05 | -0.44 | -0.27 | 3.09 | 0.36 | 0.07 | 0.02 | 0.05 | -0.05 | -0.18 | 0.34 | 0.39 |
| 35.00 | 0.07 | 0.02 | 0.05 | -0.43 | -0.27 | 3.13 | 0.35 | 0.07 | 0.02 | 0.05 | -0.05 | -0.18 | 0.34 | 0.39 |
| 36.00 | 0.07 | 0.03 | 0.04 | -0.42 | -0.27 | 3.17 | 0.35 | 0.07 | 0.02 | 0.05 | -0.05 | -0.17 | 0.34 | 0.39 |
| 37.00 | 0.07 | 0.03 | 0.04 | -0.41 | -0.26 | 3.21 | 0.34 | 0.07 | 0.02 | 0.05 | -0.04 | -0.17 | 0.34 | 0.38 |
| 38.00 | 0.07 | 0.04 | 0.04 | -0.40 | -0.26 | 3.24 | 0.34 | 0.07 | 0.02 | 0.05 | -0.04 | -0.16 | 0.35 | 0.38 |
| 39.00 | 0.07 | 0.04 | 0.04 | -0.39 | -0.26 | 3.27 | 0.34 | 0.07 | 0.02 | 0.05 | -0.04 | -0.16 | 0.35 | 0.37 |
| 40.00 | 0.07 | 0.04 | 0.03 | -0.39 | -0.26 | 3.30 | 0.33 | 0.07 | 0.02 | 0.05 | -0.04 | -0.15 | 0.35 | 0.37 |
Data for Figure 8 - 1% Increase ZLB
| Quarter | South: Nominal Interest Rate (annualised, in percentage points) | South: Real Interest Rate (annualised, in percentage points) | South: CPI Inflation (annualised, in percentage points) | South: Output (percent) | South: Real Exchange Rate (percent) | South: Govt Debt (Share of GDP, in percentage points) | South: Spread Shock (annualised, in percentage points) | North: Nominal Interest Rate (annualised, in percentage points) | North: Real Interest Rate (annualised, in percentage points) | North: CPI Inflation (annualised, in percentage points) | North: Output (percent) | North: Agg Curr Union Output (percent) | North: Govt Debt (Share of GDP, in percentage points) | North: South: 5-year Nom Int Rate (annualised, in percentage points) |
|---|---|---|---|---|---|---|---|---|---|---|---|---|---|---|
| 0.00 | 0.00 | 0.47 | -0.29 | -0.20 | 0.01 | 0.22 | 1.00 | 0.00 | 0.38 | -0.23 | -0.13 | -0.15 | 0.15 | 0.76 |
| 1.00 | 0.00 | 0.56 | -0.47 | -0.48 | 0.04 | 0.74 | 0.99 | 0.00 | 0.46 | -0.38 | -0.27 | -0.34 | 0.35 | 0.75 |
| 2.00 | 0.00 | 0.59 | -0.56 | -0.71 | 0.06 | 1.25 | 0.98 | 0.00 | 0.49 | -0.46 | -0.39 | -0.50 | 0.55 | 0.74 |
| 3.00 | 0.00 | 0.58 | -0.59 | -0.89 | 0.09 | 1.74 | 0.97 | 0.00 | 0.49 | -0.49 | -0.48 | -0.62 | 0.74 | 0.73 |
| 4.00 | 0.00 | 0.53 | -0.58 | -1.02 | 0.11 | 2.19 | 0.96 | 0.00 | 0.46 | -0.49 | -0.54 | -0.70 | 0.91 | 0.72 |
| 5.00 | 0.00 | 0.46 | -0.53 | -1.11 | 0.13 | 2.60 | 0.95 | 0.00 | 0.42 | -0.46 | -0.58 | -0.76 | 1.06 | 0.71 |
| 6.00 | 0.00 | 0.38 | -0.46 | -1.17 | 0.14 | 2.97 | 0.94 | 0.00 | 0.37 | -0.42 | -0.59 | -0.78 | 1.18 | 0.71 |
| 7.00 | 0.00 | 0.29 | -0.38 | -1.20 | 0.14 | 3.30 | 0.93 | 0.00 | 0.31 | -0.37 | -0.58 | -0.79 | 1.28 | 0.70 |
| 8.00 | 0.00 | 0.20 | -0.29 | -1.20 | 0.13 | 3.59 | 0.92 | 0.00 | 0.25 | -0.31 | -0.56 | -0.77 | 1.35 | 0.70 |
| 9.00 | -0.21 | -0.09 | -0.20 | -1.19 | 0.12 | 3.83 | 0.91 | -0.21 | -0.01 | -0.26 | -0.52 | -0.74 | 1.39 | 0.70 |
| 10.00 | -0.36 | -0.31 | -0.12 | -1.16 | 0.10 | 4.01 | 0.90 | -0.36 | -0.20 | -0.21 | -0.47 | -0.70 | 1.37 | 0.71 |
| 11.00 | -0.42 | -0.43 | -0.05 | -1.14 | 0.07 | 4.13 | 0.90 | -0.42 | -0.30 | -0.16 | -0.43 | -0.67 | 1.32 | 0.72 |
| 12.00 | -0.42 | -0.48 | 0.01 | -1.12 | 0.04 | 4.23 | 0.89 | -0.42 | -0.33 | -0.12 | -0.39 | -0.63 | 1.24 | 0.74 |
| 13.00 | -0.39 | -0.48 | 0.06 | -1.10 | 0.01 | 4.32 | 0.88 | -0.39 | -0.33 | -0.09 | -0.36 | -0.61 | 1.17 | 0.76 |
| 14.00 | -0.34 | -0.46 | 0.10 | -1.09 | -0.03 | 4.40 | 0.87 | -0.34 | -0.30 | -0.06 | -0.33 | -0.58 | 1.09 | 0.78 |
| 15.00 | -0.28 | -0.43 | 0.13 | -1.08 | -0.07 | 4.48 | 0.86 | -0.28 | -0.26 | -0.04 | -0.31 | -0.57 | 1.03 | 0.79 |
| 16.00 | -0.22 | -0.39 | 0.15 | -1.07 | -0.12 | 4.57 | 0.85 | -0.22 | -0.22 | -0.02 | -0.29 | -0.55 | 0.97 | 0.81 |
| 17.00 | -0.17 | -0.34 | 0.16 | -1.07 | -0.16 | 4.66 | 0.84 | -0.17 | -0.18 | -0.01 | -0.28 | -0.54 | 0.93 | 0.82 |
| 18.00 | -0.12 | -0.30 | 0.17 | -1.06 | -0.20 | 4.76 | 0.83 | -0.12 | -0.14 | 0.01 | -0.27 | -0.53 | 0.89 | 0.83 |
| 19.00 | -0.08 | -0.26 | 0.18 | -1.06 | -0.24 | 4.86 | 0.83 | -0.08 | -0.11 | 0.02 | -0.26 | -0.53 | 0.86 | 0.83 |
| 20.00 | -0.05 | -0.23 | 0.18 | -1.06 | -0.28 | 4.96 | 0.82 | -0.05 | -0.08 | 0.03 | -0.25 | -0.52 | 0.84 | 0.84 |
| 21.00 | -0.02 | -0.20 | 0.18 | -1.05 | -0.32 | 5.06 | 0.81 | -0.02 | -0.06 | 0.03 | -0.24 | -0.51 | 0.82 | 0.84 |
| 22.00 | 0.01 | -0.17 | 0.18 | -1.05 | -0.35 | 5.17 | 0.80 | 0.01 | -0.04 | 0.04 | -0.23 | -0.50 | 0.81 | 0.84 |
| 23.00 | 0.03 | -0.14 | 0.17 | -1.04 | -0.38 | 5.27 | 0.79 | 0.03 | -0.03 | 0.05 | -0.22 | -0.49 | 0.80 | 0.84 |
| 24.00 | 0.05 | -0.12 | 0.17 | -1.03 | -0.41 | 5.37 | 0.79 | 0.05 | -0.02 | 0.06 | -0.21 | -0.48 | 0.79 | 0.84 |
| 25.00 | 0.06 | -0.10 | 0.16 | -1.02 | -0.43 | 5.48 | 0.78 | 0.06 | -0.01 | 0.06 | -0.20 | -0.47 | 0.79 | 0.84 |
| 26.00 | 0.08 | -0.08 | 0.16 | -1.01 | -0.46 | 5.58 | 0.77 | 0.08 | 0.00 | 0.07 | -0.19 | -0.46 | 0.78 | 0.84 |
| 27.00 | 0.09 | -0.06 | 0.15 | -1.00 | -0.48 | 5.67 | 0.76 | 0.09 | 0.01 | 0.07 | -0.18 | -0.45 | 0.78 | 0.84 |
| 28.00 | 0.10 | -0.04 | 0.15 | -0.98 | -0.49 | 5.77 | 0.75 | 0.10 | 0.02 | 0.08 | -0.17 | -0.44 | 0.78 | 0.83 |
| 29.00 | 0.11 | -0.02 | 0.14 | -0.97 | -0.51 | 5.87 | 0.75 | 0.11 | 0.02 | 0.08 | -0.16 | -0.43 | 0.78 | 0.83 |
| 30.00 | 0.12 | -0.01 | 0.13 | -0.95 | -0.52 | 5.96 | 0.74 | 0.12 | 0.03 | 0.09 | -0.15 | -0.42 | 0.78 | 0.82 |
| 31.00 | 0.13 | 0.01 | 0.13 | -0.94 | -0.53 | 6.05 | 0.73 | 0.13 | 0.03 | 0.09 | -0.14 | -0.41 | 0.78 | 0.82 |
| 32.00 | 0.13 | 0.02 | 0.12 | -0.92 | -0.53 | 6.13 | 0.72 | 0.13 | 0.04 | 0.10 | -0.14 | -0.40 | 0.78 | 0.81 |
| 33.00 | 0.14 | 0.03 | 0.11 | -0.90 | -0.54 | 6.22 | 0.72 | 0.14 | 0.04 | 0.10 | -0.13 | -0.39 | 0.78 | 0.80 |
| 34.00 | 0.15 | 0.04 | 0.11 | -0.89 | -0.54 | 6.30 | 0.71 | 0.15 | 0.04 | 0.10 | -0.12 | -0.38 | 0.79 | 0.80 |
| 35.00 | 0.15 | 0.05 | 0.10 | -0.87 | -0.54 | 6.38 | 0.70 | 0.15 | 0.05 | 0.10 | -0.11 | -0.37 | 0.79 | 0.79 |
| 36.00 | 0.15 | 0.06 | 0.09 | -0.85 | -0.53 | 6.45 | 0.70 | 0.15 | 0.05 | 0.10 | -0.11 | -0.36 | 0.79 | 0.78 |
| 37.00 | 0.16 | 0.07 | 0.09 | -0.84 | -0.53 | 6.52 | 0.69 | 0.16 | 0.05 | 0.11 | -0.10 | -0.35 | 0.80 | 0.77 |
| 38.00 | 0.16 | 0.08 | 0.08 | -0.82 | -0.52 | 6.59 | 0.68 | 0.16 | 0.05 | 0.11 | -0.10 | -0.34 | 0.80 | 0.77 |
| 39.00 | 0.16 | 0.08 | 0.08 | -0.80 | -0.52 | 6.65 | 0.68 | 0.16 | 0.05 | 0.11 | -0.09 | -0.33 | 0.80 | 0.76 |
| 40.00 | 0.16 | 0.09 | 0.07 | -0.79 | -0.51 | 6.72 | 0.67 | 0.16 | 0.06 | 0.11 | -0.09 | -0.32 | 0.81 | 0.75 |
Data for Figure 8 - 1.5% Increase ZLB
| Quarter | South: Nominal Interest Rate (annualised, in percentage points) | South: Real Interest Rate (annualised, in percentage points) | South: CPI Inflation (annualised, in percentage points) | South: Output (percent) | South: Real Exchange Rate (percent) | South: Govt Debt (Share of GDP, in percentage points) | South: Spread Shock (annualised, in percentage points) | North: Nominal Interest Rate (annualised, in percentage points) | North: Real Interest Rate (annualised, in percentage points) | North: CPI Inflation (annualised, in percentage points) | North: Output (percent) | North: Agg Curr Union Output (percent) | North: Govt Debt (Share of GDP, in percentage points) | North: South: 5-year Nom Int Rate (annualised, in percentage points) |
|---|---|---|---|---|---|---|---|---|---|---|---|---|---|---|
| 0.00 | 0.00 | 0.80 | -0.50 | -0.33 | 0.02 | 0.37 | 1.50 | 0.00 | 0.67 | -0.41 | -0.23 | -0.27 | 0.27 | 1.13 |
| 1.00 | 0.00 | 0.97 | -0.80 | -0.80 | 0.06 | 1.21 | 1.49 | 0.00 | 0.81 | -0.67 | -0.49 | -0.59 | 0.62 | 1.11 |
| 2.00 | 0.00 | 1.02 | -0.97 | -1.18 | 0.10 | 2.03 | 1.47 | 0.00 | 0.87 | -0.81 | -0.70 | -0.86 | 0.98 | 1.10 |
| 3.00 | 0.00 | 1.00 | -1.02 | -1.47 | 0.13 | 2.81 | 1.46 | 0.00 | 0.86 | -0.87 | -0.86 | -1.06 | 1.32 | 1.09 |
| 4.00 | 0.00 | 0.92 | -1.00 | -1.69 | 0.17 | 3.54 | 1.44 | 0.00 | 0.82 | -0.86 | -0.97 | -1.21 | 1.63 | 1.08 |
| 5.00 | 0.00 | 0.80 | -0.92 | -1.84 | 0.19 | 4.21 | 1.43 | 0.00 | 0.74 | -0.82 | -1.04 | -1.31 | 1.90 | 1.07 |
| 6.00 | 0.00 | 0.66 | -0.80 | -1.93 | 0.21 | 4.80 | 1.41 | 0.00 | 0.65 | -0.74 | -1.07 | -1.35 | 2.12 | 1.06 |
| 7.00 | 0.00 | 0.51 | -0.66 | -1.98 | 0.21 | 5.32 | 1.40 | 0.00 | 0.55 | -0.65 | -1.06 | -1.36 | 2.29 | 1.06 |
| 8.00 | 0.00 | 0.36 | -0.51 | -1.98 | 0.20 | 5.77 | 1.38 | 0.00 | 0.44 | -0.55 | -1.02 | -1.34 | 2.42 | 1.05 |
| 9.00 | -0.21 | 0.01 | -0.36 | -1.95 | 0.18 | 6.16 | 1.37 | -0.21 | 0.14 | -0.45 | -0.95 | -1.28 | 2.49 | 1.05 |
| 10.00 | -0.53 | -0.42 | -0.23 | -1.91 | 0.15 | 6.45 | 1.36 | -0.53 | -0.26 | -0.35 | -0.87 | -1.22 | 2.50 | 1.06 |
| 11.00 | -0.66 | -0.66 | -0.11 | -1.85 | 0.11 | 6.64 | 1.34 | -0.66 | -0.47 | -0.27 | -0.79 | -1.15 | 2.42 | 1.08 |
| 12.00 | -0.68 | -0.77 | 0.00 | -1.81 | 0.06 | 6.78 | 1.33 | -0.68 | -0.55 | -0.19 | -0.72 | -1.08 | 2.30 | 1.12 |
| 13.00 | -0.64 | -0.79 | 0.08 | -1.77 | 0.01 | 6.90 | 1.32 | -0.64 | -0.55 | -0.13 | -0.66 | -1.03 | 2.17 | 1.15 |
| 14.00 | -0.56 | -0.76 | 0.15 | -1.74 | -0.05 | 7.00 | 1.30 | -0.56 | -0.51 | -0.08 | -0.61 | -0.99 | 2.05 | 1.18 |
| 15.00 | -0.46 | -0.70 | 0.20 | -1.72 | -0.11 | 7.11 | 1.29 | -0.46 | -0.45 | -0.04 | -0.57 | -0.96 | 1.93 | 1.21 |
| 16.00 | -0.37 | -0.63 | 0.24 | -1.71 | -0.17 | 7.23 | 1.28 | -0.37 | -0.38 | -0.01 | -0.54 | -0.93 | 1.83 | 1.24 |
| 17.00 | -0.27 | -0.56 | 0.27 | -1.70 | -0.24 | 7.36 | 1.26 | -0.27 | -0.31 | 0.02 | -0.52 | -0.91 | 1.75 | 1.26 |
| 18.00 | -0.19 | -0.49 | 0.29 | -1.69 | -0.30 | 7.49 | 1.25 | -0.19 | -0.25 | 0.04 | -0.49 | -0.89 | 1.69 | 1.27 |
| 19.00 | -0.12 | -0.42 | 0.30 | -1.68 | -0.36 | 7.63 | 1.24 | -0.12 | -0.19 | 0.05 | -0.47 | -0.87 | 1.64 | 1.28 |
| 20.00 | -0.06 | -0.36 | 0.30 | -1.67 | -0.42 | 7.78 | 1.23 | -0.06 | -0.14 | 0.07 | -0.45 | -0.86 | 1.60 | 1.29 |
| 21.00 | -0.01 | -0.31 | 0.30 | -1.66 | -0.47 | 7.93 | 1.21 | -0.01 | -0.10 | 0.08 | -0.44 | -0.84 | 1.57 | 1.30 |
| 22.00 | 0.03 | -0.26 | 0.30 | -1.65 | -0.52 | 8.08 | 1.20 | 0.03 | -0.07 | 0.09 | -0.42 | -0.83 | 1.54 | 1.30 |
| 23.00 | 0.07 | -0.22 | 0.29 | -1.64 | -0.57 | 8.23 | 1.19 | 0.07 | -0.05 | 0.10 | -0.40 | -0.81 | 1.53 | 1.30 |
| 24.00 | 0.10 | -0.18 | 0.28 | -1.62 | -0.61 | 8.38 | 1.18 | 0.10 | -0.02 | 0.11 | -0.38 | -0.80 | 1.51 | 1.30 |
| 25.00 | 0.13 | -0.14 | 0.28 | -1.60 | -0.65 | 8.54 | 1.17 | 0.13 | -0.01 | 0.12 | -0.37 | -0.78 | 1.50 | 1.30 |
| 26.00 | 0.15 | -0.11 | 0.27 | -1.58 | -0.69 | 8.68 | 1.16 | 0.15 | 0.01 | 0.13 | -0.35 | -0.76 | 1.50 | 1.30 |
| 27.00 | 0.17 | -0.08 | 0.26 | -1.56 | -0.71 | 8.83 | 1.14 | 0.17 | 0.02 | 0.14 | -0.33 | -0.74 | 1.49 | 1.29 |
| 28.00 | 0.19 | -0.05 | 0.25 | -1.54 | -0.74 | 8.98 | 1.13 | 0.19 | 0.03 | 0.15 | -0.32 | -0.72 | 1.49 | 1.29 |
| 29.00 | 0.20 | -0.02 | 0.24 | -1.51 | -0.76 | 9.12 | 1.12 | 0.20 | 0.04 | 0.16 | -0.30 | -0.71 | 1.49 | 1.28 |
| 30.00 | 0.22 | 0.00 | 0.23 | -1.49 | -0.78 | 9.25 | 1.11 | 0.22 | 0.05 | 0.16 | -0.29 | -0.69 | 1.49 | 1.27 |
| 31.00 | 0.23 | 0.02 | 0.22 | -1.46 | -0.79 | 9.39 | 1.10 | 0.23 | 0.06 | 0.17 | -0.27 | -0.67 | 1.49 | 1.26 |
| 32.00 | 0.24 | 0.05 | 0.21 | -1.44 | -0.80 | 9.52 | 1.09 | 0.24 | 0.07 | 0.17 | -0.26 | -0.65 | 1.49 | 1.25 |
| 33.00 | 0.25 | 0.06 | 0.20 | -1.41 | -0.80 | 9.64 | 1.08 | 0.25 | 0.07 | 0.17 | -0.25 | -0.63 | 1.49 | 1.24 |
| 34.00 | 0.26 | 0.08 | 0.19 | -1.38 | -0.80 | 9.76 | 1.07 | 0.26 | 0.08 | 0.18 | -0.23 | -0.62 | 1.50 | 1.23 |
| 35.00 | 0.26 | 0.10 | 0.18 | -1.35 | -0.80 | 9.88 | 1.06 | 0.26 | 0.08 | 0.18 | -0.22 | -0.60 | 1.50 | 1.22 |
| 36.00 | 0.27 | 0.11 | 0.17 | -1.33 | -0.80 | 9.99 | 1.04 | 0.27 | 0.09 | 0.18 | -0.21 | -0.58 | 1.50 | 1.21 |
| 37.00 | 0.27 | 0.12 | 0.16 | -1.30 | -0.79 | 10.10 | 1.03 | 0.27 | 0.09 | 0.18 | -0.20 | -0.57 | 1.51 | 1.19 |
| 38.00 | 0.28 | 0.13 | 0.15 | -1.27 | -0.79 | 10.20 | 1.02 | 0.28 | 0.09 | 0.18 | -0.19 | -0.55 | 1.51 | 1.18 |
| 39.00 | 0.28 | 0.14 | 0.14 | -1.25 | -0.78 | 10.29 | 1.01 | 0.28 | 0.10 | 0.18 | -0.18 | -0.53 | 1.52 | 1.17 |
| 40.00 | 0.28 | 0.15 | 0.13 | -1.22 | -0.77 | 10.39 | 1.00 | 0.28 | 0.10 | 0.18 | -0.17 | -0.52 | 1.52 | 1.15 |
Figure 9. Responses to a Financial Spread Increase in Large South Currency Union Member With and Without Spending Adjustment
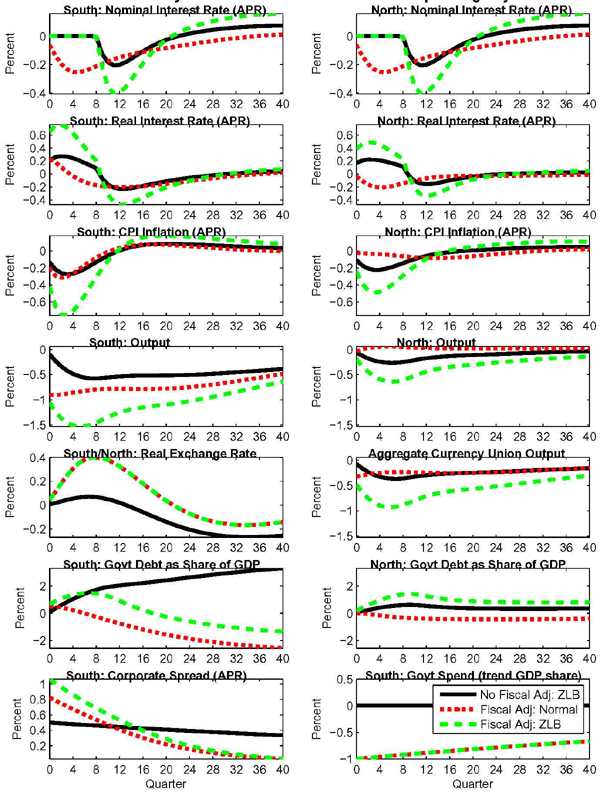
Data for Figure 9 - No Fiscal Adj ZLB
| Quarter | South: Nominal Interest Rate (annualised, in percentage points) | South: Real Interest Rate (annualised, in percentage points) | South: CPI Inflation (annualised, in percentage points) | South: Output (percent) | South: Real Exchange Rate (percent) | South: Govt Debt (Share of GDP, in percentage points) | South: Corporate Spread (annualised, in percentage points) | North: Nominal Interest Rate (annualised, in percentage points) | North: Real Interest Rate (annualised, in percentage points) | North: CPI Inflation (annualised, in percentage points) | North: Output (percent) | North: Agg Curr Union Output (percent) | North: Govt Debt (Share of GDP, in percentage points) | North: South: Govt Spend (trend GDP share) |
|---|---|---|---|---|---|---|---|---|---|---|---|---|---|---|
| 0.00 | 0.00 | 0.22 | -0.13 | -0.09 | 0.01 | 0.10 | 0.50 | 0.00 | 0.17 | -0.10 | -0.06 | -0.07 | 0.07 | 0.00 |
| 1.00 | 0.00 | 0.26 | -0.22 | -0.23 | 0.02 | 0.35 | 0.50 | 0.00 | 0.21 | -0.17 | -0.12 | -0.16 | 0.16 | 0.00 |
| 2.00 | 0.00 | 0.27 | -0.26 | -0.33 | 0.03 | 0.60 | 0.49 | 0.00 | 0.22 | -0.21 | -0.18 | -0.23 | 0.25 | 0.00 |
| 3.00 | 0.00 | 0.27 | -0.27 | -0.42 | 0.04 | 0.83 | 0.49 | 0.00 | 0.22 | -0.22 | -0.22 | -0.28 | 0.33 | 0.00 |
| 4.00 | 0.00 | 0.24 | -0.27 | -0.48 | 0.06 | 1.05 | 0.48 | 0.00 | 0.21 | -0.22 | -0.24 | -0.32 | 0.41 | 0.00 |
| 5.00 | 0.00 | 0.21 | -0.24 | -0.53 | 0.06 | 1.25 | 0.48 | 0.00 | 0.19 | -0.21 | -0.26 | -0.35 | 0.48 | 0.00 |
| 6.00 | 0.00 | 0.17 | -0.21 | -0.55 | 0.07 | 1.43 | 0.47 | 0.00 | 0.17 | -0.19 | -0.27 | -0.36 | 0.53 | 0.00 |
| 7.00 | 0.00 | 0.13 | -0.17 | -0.57 | 0.07 | 1.59 | 0.47 | 0.00 | 0.14 | -0.17 | -0.26 | -0.36 | 0.58 | 0.00 |
| 8.00 | 0.00 | 0.09 | -0.13 | -0.57 | 0.07 | 1.73 | 0.46 | 0.00 | 0.11 | -0.14 | -0.25 | -0.36 | 0.61 | 0.00 |
| 9.00 | -0.12 | -0.07 | -0.09 | -0.56 | 0.06 | 1.85 | 0.46 | -0.12 | -0.03 | -0.12 | -0.23 | -0.34 | 0.62 | 0.00 |
| 10.00 | -0.18 | -0.16 | -0.05 | -0.55 | 0.05 | 1.93 | 0.45 | -0.18 | -0.11 | -0.10 | -0.21 | -0.32 | 0.61 | 0.00 |
| 11.00 | -0.20 | -0.21 | -0.02 | -0.54 | 0.04 | 1.99 | 0.45 | -0.20 | -0.15 | -0.08 | -0.19 | -0.31 | 0.58 | 0.00 |
| 12.00 | -0.20 | -0.23 | 0.01 | -0.53 | 0.02 | 2.04 | 0.44 | -0.20 | -0.16 | -0.06 | -0.17 | -0.29 | 0.55 | 0.00 |
| 13.00 | -0.18 | -0.23 | 0.03 | -0.53 | 0.00 | 2.09 | 0.44 | -0.18 | -0.15 | -0.04 | -0.16 | -0.28 | 0.51 | 0.00 |
| 14.00 | -0.16 | -0.22 | 0.05 | -0.52 | -0.02 | 2.13 | 0.43 | -0.16 | -0.14 | -0.03 | -0.15 | -0.27 | 0.48 | 0.00 |
| 15.00 | -0.13 | -0.20 | 0.06 | -0.52 | -0.04 | 2.18 | 0.43 | -0.13 | -0.12 | -0.02 | -0.14 | -0.27 | 0.45 | 0.00 |
| 16.00 | -0.11 | -0.18 | 0.07 | -0.52 | -0.06 | 2.22 | 0.43 | -0.11 | -0.10 | -0.01 | -0.13 | -0.26 | 0.42 | 0.00 |
| 17.00 | -0.08 | -0.16 | 0.08 | -0.52 | -0.08 | 2.27 | 0.42 | -0.08 | -0.08 | -0.01 | -0.12 | -0.26 | 0.40 | 0.00 |
| 18.00 | -0.06 | -0.15 | 0.08 | -0.52 | -0.10 | 2.32 | 0.42 | -0.06 | -0.06 | 0.00 | -0.12 | -0.25 | 0.39 | 0.00 |
| 19.00 | -0.04 | -0.13 | 0.08 | -0.52 | -0.12 | 2.37 | 0.41 | -0.04 | -0.05 | 0.00 | -0.11 | -0.25 | 0.37 | 0.00 |
| 20.00 | -0.03 | -0.11 | 0.09 | -0.51 | -0.14 | 2.42 | 0.41 | -0.03 | -0.04 | 0.01 | -0.11 | -0.24 | 0.36 | 0.00 |
| 21.00 | -0.01 | -0.10 | 0.09 | -0.51 | -0.16 | 2.48 | 0.40 | -0.01 | -0.03 | 0.01 | -0.10 | -0.24 | 0.36 | 0.00 |
| 22.00 | 0.00 | -0.08 | 0.08 | -0.51 | -0.17 | 2.53 | 0.40 | 0.00 | -0.02 | 0.02 | -0.10 | -0.24 | 0.35 | 0.00 |
| 23.00 | 0.01 | -0.07 | 0.08 | -0.51 | -0.19 | 2.58 | 0.40 | 0.01 | -0.01 | 0.02 | -0.10 | -0.23 | 0.34 | 0.00 |
| 24.00 | 0.02 | -0.06 | 0.08 | -0.50 | -0.20 | 2.63 | 0.39 | 0.02 | -0.01 | 0.02 | -0.09 | -0.23 | 0.34 | 0.00 |
| 25.00 | 0.03 | -0.05 | 0.08 | -0.50 | -0.22 | 2.68 | 0.39 | 0.03 | 0.00 | 0.03 | -0.09 | -0.22 | 0.34 | 0.00 |
| 26.00 | 0.03 | -0.04 | 0.07 | -0.49 | -0.23 | 2.73 | 0.39 | 0.03 | 0.00 | 0.03 | -0.08 | -0.22 | 0.34 | 0.00 |
| 27.00 | 0.04 | -0.03 | 0.07 | -0.49 | -0.24 | 2.78 | 0.38 | 0.04 | 0.00 | 0.03 | -0.08 | -0.21 | 0.34 | 0.00 |
| 28.00 | 0.04 | -0.02 | 0.07 | -0.48 | -0.25 | 2.83 | 0.38 | 0.04 | 0.01 | 0.03 | -0.07 | -0.21 | 0.34 | 0.00 |
| 29.00 | 0.05 | -0.01 | 0.06 | -0.47 | -0.25 | 2.88 | 0.37 | 0.05 | 0.01 | 0.04 | -0.07 | -0.20 | 0.34 | 0.00 |
| 30.00 | 0.05 | -0.01 | 0.06 | -0.47 | -0.26 | 2.92 | 0.37 | 0.05 | 0.01 | 0.04 | -0.07 | -0.20 | 0.34 | 0.00 |
| 31.00 | 0.06 | 0.00 | 0.06 | -0.46 | -0.26 | 2.97 | 0.37 | 0.06 | 0.01 | 0.04 | -0.06 | -0.19 | 0.34 | 0.00 |
| 32.00 | 0.06 | 0.01 | 0.05 | -0.45 | -0.27 | 3.01 | 0.36 | 0.06 | 0.02 | 0.04 | -0.06 | -0.19 | 0.34 | 0.00 |
| 33.00 | 0.06 | 0.01 | 0.05 | -0.44 | -0.27 | 3.05 | 0.36 | 0.06 | 0.02 | 0.04 | -0.06 | -0.18 | 0.34 | 0.00 |
| 34.00 | 0.07 | 0.02 | 0.05 | -0.44 | -0.27 | 3.09 | 0.36 | 0.07 | 0.02 | 0.05 | -0.05 | -0.18 | 0.34 | 0.00 |
| 35.00 | 0.07 | 0.02 | 0.05 | -0.43 | -0.27 | 3.13 | 0.35 | 0.07 | 0.02 | 0.05 | -0.05 | -0.18 | 0.34 | 0.00 |
| 36.00 | 0.07 | 0.03 | 0.04 | -0.42 | -0.27 | 3.17 | 0.35 | 0.07 | 0.02 | 0.05 | -0.05 | -0.17 | 0.34 | 0.00 |
| 37.00 | 0.07 | 0.03 | 0.04 | -0.41 | -0.26 | 3.21 | 0.34 | 0.07 | 0.02 | 0.05 | -0.04 | -0.17 | 0.34 | 0.00 |
| 38.00 | 0.07 | 0.04 | 0.04 | -0.40 | -0.26 | 3.24 | 0.34 | 0.07 | 0.02 | 0.05 | -0.04 | -0.16 | 0.35 | 0.00 |
| 39.00 | 0.07 | 0.04 | 0.04 | -0.39 | -0.26 | 3.27 | 0.34 | 0.07 | 0.02 | 0.05 | -0.04 | -0.16 | 0.35 | 0.00 |
| 40.00 | 0.07 | 0.04 | 0.03 | -0.39 | -0.26 | 3.30 | 0.33 | 0.07 | 0.02 | 0.05 | -0.04 | -0.15 | 0.35 | 0.00 |
Data for Figure 9 - Fiscal Adj Normal
| Quarter | South: Nominal Interest Rate (annualised, in percentage points) | South: Real Interest Rate (annualised, in percentage points) | South: CPI Inflation (annualised, in percentage points) | South: Output (percent) | South: Real Exchange Rate (percent) | South: Govt Debt (Share of GDP, in percentage points) | South: Corporate Spread (annualised, in percentage points) | North: Nominal Interest Rate (annualised, in percentage points) | North: Real Interest Rate (annualised, in percentage points) | North: CPI Inflation (annualised, in percentage points) | North: Output (percent) | North: Agg Curr Union Output (percent) | North: Govt Debt (Share of GDP, in percentage points) | North: South: Govt Spend (trend GDP share) |
|---|---|---|---|---|---|---|---|---|---|---|---|---|---|---|
| 0.00 | -0.06 | 0.23 | -0.20 | -0.90 | 0.05 | 0.53 | 0.50 | -0.06 | -0.04 | -0.02 | -0.04 | -0.32 | 0.03 | -1.00 |
| 1.00 | -0.14 | 0.18 | -0.29 | -0.90 | 0.11 | 0.48 | 0.50 | -0.14 | -0.11 | -0.03 | 0.00 | -0.30 | -0.01 | -0.99 |
| 2.00 | -0.20 | 0.11 | -0.32 | -0.89 | 0.18 | 0.42 | 0.49 | -0.20 | -0.16 | -0.03 | 0.03 | -0.28 | -0.05 | -0.98 |
| 3.00 | -0.23 | 0.03 | -0.30 | -0.88 | 0.25 | 0.34 | 0.49 | -0.23 | -0.20 | -0.03 | 0.05 | -0.26 | -0.10 | -0.97 |
| 4.00 | -0.25 | -0.03 | -0.26 | -0.86 | 0.31 | 0.24 | 0.48 | -0.25 | -0.21 | -0.04 | 0.06 | -0.25 | -0.15 | -0.96 |
| 5.00 | -0.25 | -0.08 | -0.22 | -0.84 | 0.35 | 0.12 | 0.48 | -0.25 | -0.21 | -0.04 | 0.06 | -0.24 | -0.20 | -0.95 |
| 6.00 | -0.24 | -0.12 | -0.17 | -0.82 | 0.38 | 0.00 | 0.47 | -0.24 | -0.19 | -0.05 | 0.06 | -0.23 | -0.25 | -0.94 |
| 7.00 | -0.23 | -0.15 | -0.12 | -0.80 | 0.40 | -0.13 | 0.47 | -0.23 | -0.17 | -0.05 | 0.06 | -0.23 | -0.29 | -0.93 |
| 8.00 | -0.21 | -0.17 | -0.08 | -0.79 | 0.40 | -0.25 | 0.46 | -0.21 | -0.14 | -0.06 | 0.05 | -0.23 | -0.32 | -0.92 |
| 9.00 | -0.19 | -0.19 | -0.04 | -0.79 | 0.39 | -0.38 | 0.46 | -0.19 | -0.12 | -0.07 | 0.04 | -0.23 | -0.34 | -0.91 |
| 10.00 | -0.18 | -0.19 | -0.01 | -0.78 | 0.38 | -0.51 | 0.45 | -0.18 | -0.10 | -0.07 | 0.04 | -0.24 | -0.37 | -0.90 |
| 11.00 | -0.16 | -0.20 | 0.02 | -0.78 | 0.36 | -0.63 | 0.45 | -0.16 | -0.08 | -0.08 | 0.03 | -0.24 | -0.38 | -0.90 |
| 12.00 | -0.15 | -0.20 | 0.04 | -0.78 | 0.33 | -0.75 | 0.44 | -0.15 | -0.07 | -0.08 | 0.03 | -0.24 | -0.39 | -0.89 |
| 13.00 | -0.14 | -0.20 | 0.05 | -0.78 | 0.29 | -0.86 | 0.44 | -0.14 | -0.06 | -0.08 | 0.02 | -0.25 | -0.40 | -0.88 |
| 14.00 | -0.13 | -0.20 | 0.06 | -0.78 | 0.26 | -0.97 | 0.43 | -0.13 | -0.05 | -0.08 | 0.02 | -0.25 | -0.41 | -0.87 |
| 15.00 | -0.12 | -0.19 | 0.07 | -0.78 | 0.22 | -1.08 | 0.43 | -0.12 | -0.04 | -0.08 | 0.02 | -0.25 | -0.41 | -0.86 |
| 16.00 | -0.11 | -0.19 | 0.07 | -0.79 | 0.18 | -1.18 | 0.43 | -0.11 | -0.04 | -0.08 | 0.02 | -0.25 | -0.42 | -0.85 |
| 17.00 | -0.10 | -0.18 | 0.08 | -0.78 | 0.14 | -1.28 | 0.42 | -0.10 | -0.03 | -0.07 | 0.01 | -0.25 | -0.42 | -0.84 |
| 18.00 | -0.10 | -0.17 | 0.08 | -0.78 | 0.11 | -1.38 | 0.42 | -0.10 | -0.03 | -0.07 | 0.01 | -0.25 | -0.42 | -0.83 |
| 19.00 | -0.09 | -0.16 | 0.08 | -0.78 | 0.07 | -1.47 | 0.41 | -0.09 | -0.03 | -0.07 | 0.02 | -0.25 | -0.43 | -0.83 |
| 20.00 | -0.08 | -0.15 | 0.07 | -0.78 | 0.04 | -1.55 | 0.41 | -0.08 | -0.03 | -0.06 | 0.02 | -0.25 | -0.43 | -0.82 |
| 21.00 | -0.08 | -0.14 | 0.07 | -0.77 | 0.01 | -1.63 | 0.40 | -0.08 | -0.03 | -0.05 | 0.02 | -0.25 | -0.43 | -0.81 |
| 22.00 | -0.07 | -0.13 | 0.07 | -0.76 | -0.02 | -1.71 | 0.40 | -0.07 | -0.03 | -0.05 | 0.02 | -0.24 | -0.43 | -0.80 |
| 23.00 | -0.06 | -0.12 | 0.06 | -0.75 | -0.05 | -1.79 | 0.40 | -0.06 | -0.03 | -0.04 | 0.02 | -0.24 | -0.43 | -0.79 |
| 24.00 | -0.06 | -0.11 | 0.06 | -0.75 | -0.07 | -1.86 | 0.39 | -0.06 | -0.03 | -0.04 | 0.02 | -0.24 | -0.43 | -0.79 |
| 25.00 | -0.05 | -0.10 | 0.05 | -0.73 | -0.09 | -1.92 | 0.39 | -0.05 | -0.03 | -0.03 | 0.02 | -0.23 | -0.43 | -0.78 |
| 26.00 | -0.05 | -0.09 | 0.05 | -0.72 | -0.11 | -1.98 | 0.39 | -0.05 | -0.03 | -0.02 | 0.02 | -0.23 | -0.43 | -0.77 |
| 27.00 | -0.04 | -0.08 | 0.04 | -0.71 | -0.12 | -2.04 | 0.38 | -0.04 | -0.03 | -0.02 | 0.02 | -0.22 | -0.43 | -0.76 |
| 28.00 | -0.03 | -0.07 | 0.04 | -0.69 | -0.14 | -2.10 | 0.38 | -0.03 | -0.03 | -0.01 | 0.02 | -0.22 | -0.43 | -0.75 |
| 29.00 | -0.03 | -0.06 | 0.03 | -0.68 | -0.15 | -2.15 | 0.37 | -0.03 | -0.02 | -0.01 | 0.02 | -0.21 | -0.43 | -0.75 |
| 30.00 | -0.02 | -0.05 | 0.03 | -0.66 | -0.15 | -2.20 | 0.37 | -0.02 | -0.02 | 0.00 | 0.02 | -0.21 | -0.43 | -0.74 |
| 31.00 | -0.02 | -0.04 | 0.02 | -0.65 | -0.16 | -2.24 | 0.37 | -0.02 | -0.02 | 0.00 | 0.02 | -0.20 | -0.43 | -0.73 |
| 32.00 | -0.01 | -0.03 | 0.02 | -0.63 | -0.16 | -2.29 | 0.36 | -0.01 | -0.02 | 0.00 | 0.02 | -0.19 | -0.42 | -0.72 |
| 33.00 | -0.01 | -0.02 | 0.02 | -0.61 | -0.17 | -2.33 | 0.36 | -0.01 | -0.02 | 0.01 | 0.02 | -0.19 | -0.42 | -0.72 |
| 34.00 | -0.01 | -0.01 | 0.01 | -0.59 | -0.17 | -2.36 | 0.36 | -0.01 | -0.02 | 0.01 | 0.02 | -0.18 | -0.42 | -0.71 |
| 35.00 | 0.00 | -0.01 | 0.01 | -0.58 | -0.17 | -2.40 | 0.35 | 0.00 | -0.02 | 0.01 | 0.02 | -0.18 | -0.41 | -0.70 |
| 36.00 | 0.00 | 0.00 | 0.01 | -0.56 | -0.16 | -2.43 | 0.35 | 0.00 | -0.02 | 0.02 | 0.02 | -0.17 | -0.41 | -0.70 |
| 37.00 | 0.00 | 0.00 | 0.00 | -0.54 | -0.16 | -2.46 | 0.34 | 0.00 | -0.02 | 0.02 | 0.02 | -0.17 | -0.41 | -0.69 |
| 38.00 | 0.01 | 0.01 | 0.00 | -0.52 | -0.15 | -2.49 | 0.34 | 0.01 | -0.02 | 0.02 | 0.02 | -0.16 | -0.40 | -0.68 |
| 39.00 | 0.01 | 0.01 | 0.00 | -0.50 | -0.15 | -2.52 | 0.34 | 0.01 | -0.01 | 0.02 | 0.02 | -0.15 | -0.40 | -0.68 |
| 40.00 | 0.01 | 0.02 | 0.00 | -0.48 | -0.14 | -2.54 | 0.33 | 0.01 | -0.01 | 0.02 | 0.02 | -0.15 | -0.39 | -0.67 |
Data for Figure 9 - Fiscal Adj ZLB
| Quarter | South: Nominal Interest Rate (annualised, in percentage points) | South: Real Interest Rate (annualised, in percentage points) | South: CPI Inflation (annualised, in percentage points) | South: Output (percent) | South: Real Exchange Rate (percent) | South: Govt Debt (Share of GDP, in percentage points) | South: Corporate Spread (annualised, in percentage points) | North: Nominal Interest Rate (annualised, in percentage points) | North: Real Interest Rate (annualised, in percentage points) | North: CPI Inflation (annualised, in percentage points) | North: Output (percent) | North: Agg Curr Union Output (percent) | North: Govt Debt (Share of GDP, in percentage points) | North: South: Govt Spend (trend GDP share) |
|---|---|---|---|---|---|---|---|---|---|---|---|---|---|---|
| 0.00 | 0.00 | 0.65 | -0.42 | -1.05 | 0.05 | 0.70 | 0.50 | 0.00 | 0.39 | -0.24 | -0.19 | -0.48 | 0.20 | -1.00 |
| 1.00 | 0.00 | 0.75 | -0.65 | -1.23 | 0.11 | 0.89 | 0.50 | 0.00 | 0.46 | -0.39 | -0.33 | -0.63 | 0.40 | -0.99 |
| 2.00 | 0.00 | 0.76 | -0.75 | -1.37 | 0.18 | 1.07 | 0.49 | 0.00 | 0.49 | -0.46 | -0.44 | -0.75 | 0.60 | -0.98 |
| 3.00 | 0.00 | 0.71 | -0.76 | -1.45 | 0.25 | 1.23 | 0.49 | 0.00 | 0.48 | -0.49 | -0.53 | -0.84 | 0.79 | -0.97 |
| 4.00 | 0.00 | 0.63 | -0.71 | -1.50 | 0.31 | 1.35 | 0.48 | 0.00 | 0.45 | -0.48 | -0.59 | -0.89 | 0.96 | -0.96 |
| 5.00 | 0.00 | 0.52 | -0.63 | -1.52 | 0.35 | 1.44 | 0.48 | 0.00 | 0.40 | -0.45 | -0.62 | -0.92 | 1.11 | -0.95 |
| 6.00 | 0.00 | 0.41 | -0.52 | -1.52 | 0.38 | 1.48 | 0.47 | 0.00 | 0.35 | -0.40 | -0.64 | -0.93 | 1.23 | -0.94 |
| 7.00 | 0.00 | 0.31 | -0.41 | -1.49 | 0.40 | 1.48 | 0.47 | 0.00 | 0.29 | -0.35 | -0.63 | -0.92 | 1.32 | -0.93 |
| 8.00 | 0.00 | 0.20 | -0.31 | -1.45 | 0.40 | 1.45 | 0.46 | 0.00 | 0.23 | -0.29 | -0.60 | -0.89 | 1.39 | -0.92 |
| 9.00 | -0.21 | -0.10 | -0.20 | -1.40 | 0.39 | 1.39 | 0.46 | -0.21 | -0.03 | -0.23 | -0.56 | -0.84 | 1.42 | -0.91 |
| 10.00 | -0.35 | -0.32 | -0.11 | -1.34 | 0.38 | 1.26 | 0.45 | -0.35 | -0.22 | -0.18 | -0.52 | -0.79 | 1.40 | -0.90 |
| 11.00 | -0.40 | -0.43 | -0.04 | -1.29 | 0.36 | 1.10 | 0.45 | -0.40 | -0.31 | -0.13 | -0.48 | -0.75 | 1.34 | -0.90 |
| 12.00 | -0.40 | -0.47 | 0.02 | -1.25 | 0.33 | 0.92 | 0.44 | -0.40 | -0.34 | -0.09 | -0.44 | -0.71 | 1.27 | -0.89 |
| 13.00 | -0.36 | -0.47 | 0.07 | -1.21 | 0.29 | 0.73 | 0.44 | -0.36 | -0.33 | -0.06 | -0.41 | -0.68 | 1.19 | -0.88 |
| 14.00 | -0.31 | -0.45 | 0.11 | -1.19 | 0.26 | 0.56 | 0.43 | -0.31 | -0.29 | -0.03 | -0.38 | -0.65 | 1.12 | -0.87 |
| 15.00 | -0.25 | -0.41 | 0.14 | -1.16 | 0.22 | 0.39 | 0.43 | -0.25 | -0.25 | -0.01 | -0.36 | -0.63 | 1.06 | -0.86 |
| 16.00 | -0.19 | -0.36 | 0.16 | -1.15 | 0.18 | 0.24 | 0.43 | -0.19 | -0.21 | 0.01 | -0.35 | -0.61 | 1.00 | -0.85 |
| 17.00 | -0.14 | -0.32 | 0.17 | -1.13 | 0.14 | 0.10 | 0.42 | -0.14 | -0.17 | 0.02 | -0.33 | -0.60 | 0.96 | -0.84 |
| 18.00 | -0.10 | -0.28 | 0.18 | -1.12 | 0.11 | -0.03 | 0.42 | -0.10 | -0.14 | 0.03 | -0.32 | -0.59 | 0.93 | -0.83 |
| 19.00 | -0.06 | -0.24 | 0.18 | -1.10 | 0.07 | -0.14 | 0.41 | -0.06 | -0.11 | 0.04 | -0.31 | -0.57 | 0.90 | -0.83 |
| 20.00 | -0.03 | -0.21 | 0.18 | -1.09 | 0.04 | -0.25 | 0.41 | -0.03 | -0.08 | 0.05 | -0.30 | -0.56 | 0.88 | -0.82 |
| 21.00 | 0.00 | -0.18 | 0.18 | -1.08 | 0.01 | -0.35 | 0.40 | 0.00 | -0.06 | 0.06 | -0.29 | -0.55 | 0.86 | -0.81 |
| 22.00 | 0.02 | -0.15 | 0.18 | -1.06 | -0.02 | -0.44 | 0.40 | 0.02 | -0.05 | 0.06 | -0.28 | -0.54 | 0.85 | -0.80 |
| 23.00 | 0.04 | -0.13 | 0.17 | -1.04 | -0.05 | -0.52 | 0.40 | 0.04 | -0.03 | 0.07 | -0.27 | -0.53 | 0.84 | -0.79 |
| 24.00 | 0.06 | -0.10 | 0.17 | -1.02 | -0.07 | -0.60 | 0.39 | 0.06 | -0.02 | 0.08 | -0.26 | -0.51 | 0.83 | -0.79 |
| 25.00 | 0.07 | -0.08 | 0.16 | -1.01 | -0.09 | -0.67 | 0.39 | 0.07 | -0.01 | 0.08 | -0.25 | -0.50 | 0.82 | -0.78 |
| 26.00 | 0.08 | -0.07 | 0.16 | -0.98 | -0.11 | -0.73 | 0.39 | 0.08 | -0.01 | 0.09 | -0.24 | -0.49 | 0.82 | -0.77 |
| 27.00 | 0.10 | -0.05 | 0.15 | -0.96 | -0.12 | -0.80 | 0.38 | 0.10 | 0.00 | 0.09 | -0.23 | -0.47 | 0.81 | -0.76 |
| 28.00 | 0.11 | -0.03 | 0.15 | -0.94 | -0.14 | -0.86 | 0.38 | 0.11 | 0.01 | 0.09 | -0.22 | -0.46 | 0.81 | -0.75 |
| 29.00 | 0.11 | -0.02 | 0.14 | -0.91 | -0.15 | -0.91 | 0.37 | 0.11 | 0.01 | 0.10 | -0.21 | -0.45 | 0.81 | -0.75 |
| 30.00 | 0.12 | -0.01 | 0.13 | -0.89 | -0.15 | -0.96 | 0.37 | 0.12 | 0.02 | 0.10 | -0.20 | -0.43 | 0.81 | -0.74 |
| 31.00 | 0.13 | 0.01 | 0.13 | -0.87 | -0.16 | -1.01 | 0.37 | 0.13 | 0.02 | 0.10 | -0.20 | -0.42 | 0.81 | -0.73 |
| 32.00 | 0.13 | 0.02 | 0.12 | -0.84 | -0.16 | -1.06 | 0.36 | 0.13 | 0.03 | 0.11 | -0.19 | -0.40 | 0.81 | -0.72 |
| 33.00 | 0.14 | 0.03 | 0.12 | -0.81 | -0.17 | -1.10 | 0.36 | 0.14 | 0.03 | 0.11 | -0.18 | -0.39 | 0.81 | -0.72 |
| 34.00 | 0.14 | 0.04 | 0.11 | -0.79 | -0.17 | -1.14 | 0.36 | 0.14 | 0.03 | 0.11 | -0.17 | -0.38 | 0.81 | -0.71 |
| 35.00 | 0.15 | 0.05 | 0.11 | -0.76 | -0.17 | -1.18 | 0.35 | 0.15 | 0.04 | 0.11 | -0.17 | -0.36 | 0.81 | -0.70 |
| 36.00 | 0.15 | 0.05 | 0.10 | -0.74 | -0.16 | -1.21 | 0.35 | 0.15 | 0.04 | 0.11 | -0.16 | -0.35 | 0.81 | -0.70 |
| 37.00 | 0.15 | 0.06 | 0.10 | -0.71 | -0.16 | -1.24 | 0.34 | 0.15 | 0.04 | 0.11 | -0.15 | -0.34 | 0.81 | -0.69 |
| 38.00 | 0.15 | 0.07 | 0.09 | -0.69 | -0.15 | -1.28 | 0.34 | 0.15 | 0.04 | 0.11 | -0.15 | -0.33 | 0.81 | -0.68 |
| 39.00 | 0.16 | 0.07 | 0.09 | -0.66 | -0.15 | -1.31 | 0.34 | 0.16 | 0.05 | 0.11 | -0.14 | -0.31 | 0.81 | -0.68 |
| 40.00 | 0.16 | 0.08 | 0.08 | -0.64 | -0.14 | -1.33 | 0.33 | 0.16 | 0.05 | 0.11 | -0.14 | -0.30 | 0.82 | -0.67 |
Figure 10. Responses to Government Spending Cut in Large South For Alternative Labor-Income Tax Rules
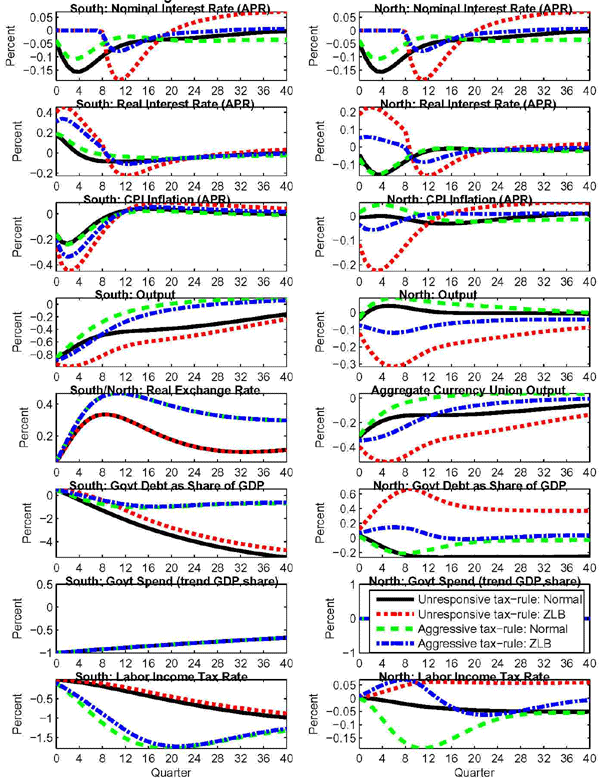
Data for Figure 10 - Unresponsive Tax-Rule Normal
| Quarter | South: Nominal Interest Rate (annualised, in percentage points) | South: Real Interest Rate (annualised, in percentage points) | South: CPI Inflation (annualised, in percentage points) | South: Output (percent) | South: Real Exchange Rate (percent) | South: Govt Debt (Share of GDP, in percentage points) | South: Govt Spend (trend GDP share) | South: Labor Income Tax Rate (percentage points) | North: Nominal Interest Rate (annualised, in percentage points) | North: Real Interest Rate (annualised, in percentage points) | North: CPI Inflation (annualised, in percentage points) | North: Output (percent) | North: Agg Curr Union Output (percent) | North: Govt Debt (Share of GDP, in percentage points) | North: Govt Spend (trend GDP share) | North: Labor Income Tax Rate (percentage points) |
|---|---|---|---|---|---|---|---|---|---|---|---|---|---|---|---|---|
| 0.00 | -0.05 | 0.17 | -0.16 | -0.87 | 0.04 | 0.50 | -1.00 | -0.01 | -0.05 | -0.04 | -0.01 | -0.04 | -0.32 | 0.03 | 0.00 | 0.00 |
| 1.00 | -0.10 | 0.14 | -0.22 | -0.81 | 0.09 | 0.29 | -0.99 | -0.02 | -0.10 | -0.10 | 0.00 | -0.01 | -0.28 | 0.00 | 0.00 | 0.00 |
| 2.00 | -0.14 | 0.08 | -0.23 | -0.75 | 0.15 | 0.08 | -0.98 | -0.04 | -0.14 | -0.14 | 0.00 | 0.02 | -0.24 | -0.04 | 0.00 | 0.00 |
| 3.00 | -0.15 | 0.03 | -0.22 | -0.69 | 0.21 | -0.14 | -0.97 | -0.06 | -0.15 | -0.16 | 0.00 | 0.03 | -0.21 | -0.08 | 0.00 | 0.00 |
| 4.00 | -0.16 | -0.01 | -0.18 | -0.64 | 0.25 | -0.37 | -0.96 | -0.08 | -0.16 | -0.16 | 0.00 | 0.04 | -0.19 | -0.12 | 0.00 | -0.01 |
| 5.00 | -0.15 | -0.04 | -0.14 | -0.59 | 0.29 | -0.60 | -0.95 | -0.10 | -0.15 | -0.14 | 0.00 | 0.04 | -0.17 | -0.16 | 0.00 | -0.01 |
| 6.00 | -0.13 | -0.06 | -0.10 | -0.55 | 0.31 | -0.83 | -0.94 | -0.13 | -0.13 | -0.13 | 0.00 | 0.04 | -0.16 | -0.19 | 0.00 | -0.01 |
| 7.00 | -0.12 | -0.08 | -0.07 | -0.52 | 0.33 | -1.06 | -0.93 | -0.15 | -0.12 | -0.10 | -0.01 | 0.03 | -0.15 | -0.21 | 0.00 | -0.02 |
| 8.00 | -0.10 | -0.08 | -0.04 | -0.49 | 0.33 | -1.29 | -0.92 | -0.18 | -0.10 | -0.08 | -0.01 | 0.03 | -0.14 | -0.23 | 0.00 | -0.02 |
| 9.00 | -0.08 | -0.08 | -0.02 | -0.47 | 0.33 | -1.50 | -0.91 | -0.21 | -0.08 | -0.06 | -0.02 | 0.02 | -0.14 | -0.24 | 0.00 | -0.03 |
| 10.00 | -0.07 | -0.09 | 0.00 | -0.46 | 0.33 | -1.71 | -0.90 | -0.24 | -0.07 | -0.05 | -0.02 | 0.02 | -0.14 | -0.25 | 0.00 | -0.03 |
| 11.00 | -0.06 | -0.09 | 0.02 | -0.45 | 0.32 | -1.91 | -0.90 | -0.27 | -0.06 | -0.03 | -0.02 | 0.01 | -0.14 | -0.26 | 0.00 | -0.03 |
| 12.00 | -0.05 | -0.08 | 0.03 | -0.44 | 0.31 | -2.11 | -0.89 | -0.30 | -0.05 | -0.02 | -0.03 | 0.01 | -0.14 | -0.26 | 0.00 | -0.03 |
| 13.00 | -0.05 | -0.08 | 0.03 | -0.43 | 0.29 | -2.30 | -0.88 | -0.33 | -0.05 | -0.02 | -0.03 | 0.01 | -0.14 | -0.26 | 0.00 | -0.04 |
| 14.00 | -0.04 | -0.08 | 0.04 | -0.42 | 0.27 | -2.48 | -0.87 | -0.36 | -0.04 | -0.01 | -0.03 | 0.00 | -0.14 | -0.26 | 0.00 | -0.04 |
| 15.00 | -0.04 | -0.08 | 0.04 | -0.42 | 0.26 | -2.66 | -0.86 | -0.40 | -0.04 | -0.01 | -0.03 | 0.00 | -0.14 | -0.26 | 0.00 | -0.04 |
| 16.00 | -0.04 | -0.08 | 0.04 | -0.41 | 0.24 | -2.83 | -0.85 | -0.43 | -0.04 | -0.01 | -0.03 | 0.00 | -0.14 | -0.26 | 0.00 | -0.04 |
| 17.00 | -0.04 | -0.07 | 0.04 | -0.41 | 0.22 | -2.99 | -0.84 | -0.46 | -0.04 | -0.01 | -0.03 | 0.00 | -0.14 | -0.26 | 0.00 | -0.04 |
| 18.00 | -0.04 | -0.07 | 0.04 | -0.40 | 0.21 | -3.15 | -0.83 | -0.49 | -0.04 | -0.01 | -0.03 | 0.00 | -0.14 | -0.26 | 0.00 | -0.04 |
| 19.00 | -0.03 | -0.07 | 0.03 | -0.40 | 0.19 | -3.30 | -0.83 | -0.52 | -0.03 | -0.01 | -0.03 | 0.00 | -0.13 | -0.26 | 0.00 | -0.04 |
| 20.00 | -0.03 | -0.06 | 0.03 | -0.39 | 0.18 | -3.45 | -0.82 | -0.55 | -0.03 | -0.01 | -0.02 | 0.00 | -0.13 | -0.26 | 0.00 | -0.04 |
| 21.00 | -0.03 | -0.06 | 0.03 | -0.38 | 0.16 | -3.59 | -0.81 | -0.58 | -0.03 | -0.01 | -0.02 | 0.00 | -0.13 | -0.26 | 0.00 | -0.05 |
| 22.00 | -0.03 | -0.06 | 0.03 | -0.37 | 0.15 | -3.72 | -0.80 | -0.61 | -0.03 | -0.01 | -0.02 | 0.00 | -0.13 | -0.26 | 0.00 | -0.05 |
| 23.00 | -0.03 | -0.05 | 0.02 | -0.37 | 0.14 | -3.85 | -0.79 | -0.64 | -0.03 | -0.02 | -0.02 | 0.00 | -0.12 | -0.26 | 0.00 | -0.05 |
| 24.00 | -0.03 | -0.05 | 0.02 | -0.36 | 0.13 | -3.98 | -0.79 | -0.66 | -0.03 | -0.02 | -0.01 | 0.00 | -0.12 | -0.26 | 0.00 | -0.05 |
| 25.00 | -0.03 | -0.04 | 0.02 | -0.35 | 0.13 | -4.09 | -0.78 | -0.69 | -0.03 | -0.02 | -0.01 | 0.00 | -0.12 | -0.26 | 0.00 | -0.05 |
| 26.00 | -0.02 | -0.04 | 0.02 | -0.34 | 0.12 | -4.21 | -0.77 | -0.71 | -0.02 | -0.02 | -0.01 | 0.00 | -0.11 | -0.26 | 0.00 | -0.05 |
| 27.00 | -0.02 | -0.04 | 0.02 | -0.32 | 0.11 | -4.32 | -0.76 | -0.74 | -0.02 | -0.02 | -0.01 | 0.00 | -0.11 | -0.26 | 0.00 | -0.05 |
| 28.00 | -0.02 | -0.03 | 0.01 | -0.31 | 0.11 | -4.42 | -0.75 | -0.76 | -0.02 | -0.02 | 0.00 | 0.00 | -0.11 | -0.26 | 0.00 | -0.05 |
| 29.00 | -0.02 | -0.03 | 0.01 | -0.30 | 0.11 | -4.52 | -0.75 | -0.79 | -0.02 | -0.02 | 0.00 | 0.00 | -0.10 | -0.26 | 0.00 | -0.05 |
| 30.00 | -0.02 | -0.03 | 0.01 | -0.29 | 0.10 | -4.62 | -0.74 | -0.81 | -0.02 | -0.02 | 0.00 | 0.00 | -0.10 | -0.26 | 0.00 | -0.05 |
| 31.00 | -0.02 | -0.02 | 0.01 | -0.28 | 0.10 | -4.71 | -0.73 | -0.83 | -0.02 | -0.02 | 0.00 | 0.00 | -0.09 | -0.26 | 0.00 | -0.05 |
| 32.00 | -0.01 | -0.02 | 0.01 | -0.26 | 0.10 | -4.80 | -0.72 | -0.85 | -0.01 | -0.02 | 0.00 | 0.00 | -0.09 | -0.26 | 0.00 | -0.05 |
| 33.00 | -0.01 | -0.02 | 0.01 | -0.25 | 0.10 | -4.88 | -0.72 | -0.87 | -0.01 | -0.02 | 0.00 | 0.00 | -0.09 | -0.26 | 0.00 | -0.05 |
| 34.00 | -0.01 | -0.01 | 0.00 | -0.24 | 0.10 | -4.96 | -0.71 | -0.89 | -0.01 | -0.02 | 0.01 | 0.00 | -0.08 | -0.26 | 0.00 | -0.05 |
| 35.00 | -0.01 | -0.01 | 0.00 | -0.22 | 0.10 | -5.03 | -0.70 | -0.91 | -0.01 | -0.02 | 0.01 | -0.01 | -0.08 | -0.26 | 0.00 | -0.05 |
| 36.00 | -0.01 | -0.01 | 0.00 | -0.21 | 0.10 | -5.10 | -0.70 | -0.93 | -0.01 | -0.02 | 0.01 | -0.01 | -0.07 | -0.26 | 0.00 | -0.05 |
| 37.00 | -0.01 | -0.01 | 0.00 | -0.20 | 0.11 | -5.17 | -0.69 | -0.94 | -0.01 | -0.02 | 0.01 | -0.01 | -0.07 | -0.25 | 0.00 | -0.05 |
| 38.00 | 0.00 | 0.00 | 0.00 | -0.19 | 0.11 | -5.24 | -0.68 | -0.96 | 0.00 | -0.01 | 0.01 | -0.01 | -0.07 | -0.25 | 0.00 | -0.05 |
| 39.00 | 0.00 | 0.00 | 0.00 | -0.17 | 0.11 | -5.30 | -0.68 | -0.97 | 0.00 | -0.01 | 0.01 | -0.01 | -0.06 | -0.25 | 0.00 | -0.05 |
| 40.00 | 0.00 | 0.00 | 0.00 | -0.16 | 0.11 | -5.35 | -0.67 | -0.99 | 0.00 | -0.01 | 0.01 | -0.01 | -0.06 | -0.25 | 0.00 | -0.05 |
Data for Figure 10 - Unresponsive Tax-Rule ZLB
| Quarter | South: Nominal Interest Rate (annualised, in percentage points) | South: Real Interest Rate (annualised, in percentage points) | South: CPI Inflation (annualised, in percentage points) | South: Output (percent) | South: Real Exchange Rate (percent) | South: Govt Debt (Share of GDP, in percentage points) | South: Govt Spend (trend GDP share) | South: Labor Income Tax Rate (percentage points) | North: Nominal Interest Rate (annualised, in percentage points) | North: Real Interest Rate (annualised, in percentage points) | North: CPI Inflation (annualised, in percentage points) | North: Output (percent) | North: Agg Curr Union Output (percent) | North: Govt Debt (Share of GDP, in percentage points) | North: Govt Spend (trend GDP share) | North: Labor Income Tax Rate (percentage points) |
|---|---|---|---|---|---|---|---|---|---|---|---|---|---|---|---|---|
| 0.00 | 0.00 | 0.40 | -0.27 | -0.95 | 0.04 | 0.58 | -1.00 | -0.01 | 0.00 | 0.18 | -0.12 | -0.12 | -0.40 | 0.12 | 0.00 | 0.00 |
| 1.00 | 0.00 | 0.45 | -0.40 | -0.98 | 0.09 | 0.51 | -0.99 | -0.02 | 0.00 | 0.22 | -0.18 | -0.18 | -0.45 | 0.21 | 0.00 | 0.01 |
| 2.00 | 0.00 | 0.44 | -0.45 | -0.99 | 0.15 | 0.43 | -0.98 | -0.03 | 0.00 | 0.23 | -0.22 | -0.23 | -0.48 | 0.30 | 0.00 | 0.01 |
| 3.00 | 0.00 | 0.40 | -0.44 | -0.99 | 0.21 | 0.33 | -0.97 | -0.04 | 0.00 | 0.22 | -0.23 | -0.27 | -0.51 | 0.39 | 0.00 | 0.02 |
| 4.00 | 0.00 | 0.34 | -0.40 | -0.97 | 0.25 | 0.22 | -0.96 | -0.05 | 0.00 | 0.20 | -0.22 | -0.29 | -0.52 | 0.47 | 0.00 | 0.02 |
| 5.00 | 0.00 | 0.28 | -0.34 | -0.94 | 0.29 | 0.09 | -0.95 | -0.06 | 0.00 | 0.18 | -0.20 | -0.31 | -0.52 | 0.54 | 0.00 | 0.03 |
| 6.00 | 0.00 | 0.21 | -0.28 | -0.91 | 0.31 | -0.06 | -0.94 | -0.08 | 0.00 | 0.15 | -0.18 | -0.32 | -0.51 | 0.59 | 0.00 | 0.04 |
| 7.00 | 0.00 | 0.15 | -0.21 | -0.87 | 0.33 | -0.22 | -0.93 | -0.09 | 0.00 | 0.12 | -0.15 | -0.31 | -0.50 | 0.63 | 0.00 | 0.04 |
| 8.00 | 0.00 | 0.09 | -0.15 | -0.82 | 0.33 | -0.40 | -0.92 | -0.11 | 0.00 | 0.09 | -0.12 | -0.30 | -0.47 | 0.66 | 0.00 | 0.05 |
| 9.00 | -0.12 | -0.07 | -0.09 | -0.78 | 0.33 | -0.59 | -0.91 | -0.13 | -0.12 | -0.05 | -0.10 | -0.28 | -0.45 | 0.67 | 0.00 | 0.05 |
| 10.00 | -0.18 | -0.17 | -0.05 | -0.74 | 0.33 | -0.81 | -0.90 | -0.15 | -0.18 | -0.13 | -0.07 | -0.26 | -0.42 | 0.65 | 0.00 | 0.06 |
| 11.00 | -0.19 | -0.21 | -0.01 | -0.70 | 0.32 | -1.03 | -0.90 | -0.18 | -0.19 | -0.16 | -0.05 | -0.24 | -0.39 | 0.62 | 0.00 | 0.06 |
| 12.00 | -0.18 | -0.23 | 0.02 | -0.67 | 0.31 | -1.26 | -0.89 | -0.21 | -0.18 | -0.16 | -0.03 | -0.22 | -0.37 | 0.58 | 0.00 | 0.06 |
| 13.00 | -0.16 | -0.22 | 0.05 | -0.65 | 0.29 | -1.49 | -0.88 | -0.24 | -0.16 | -0.15 | -0.02 | -0.21 | -0.36 | 0.55 | 0.00 | 0.06 |
| 14.00 | -0.13 | -0.20 | 0.06 | -0.63 | 0.27 | -1.70 | -0.87 | -0.27 | -0.13 | -0.14 | 0.00 | -0.20 | -0.34 | 0.51 | 0.00 | 0.06 |
| 15.00 | -0.10 | -0.18 | 0.08 | -0.61 | 0.26 | -1.91 | -0.86 | -0.30 | -0.10 | -0.12 | 0.01 | -0.19 | -0.33 | 0.49 | 0.00 | 0.06 |
| 16.00 | -0.08 | -0.16 | 0.08 | -0.60 | 0.24 | -2.10 | -0.85 | -0.33 | -0.08 | -0.10 | 0.01 | -0.18 | -0.32 | 0.46 | 0.00 | 0.06 |
| 17.00 | -0.05 | -0.14 | 0.09 | -0.58 | 0.22 | -2.28 | -0.84 | -0.36 | -0.05 | -0.08 | 0.02 | -0.18 | -0.31 | 0.44 | 0.00 | 0.06 |
| 18.00 | -0.03 | -0.12 | 0.09 | -0.57 | 0.21 | -2.46 | -0.83 | -0.39 | -0.03 | -0.06 | 0.02 | -0.17 | -0.31 | 0.43 | 0.00 | 0.06 |
| 19.00 | -0.02 | -0.10 | 0.09 | -0.56 | 0.19 | -2.62 | -0.83 | -0.42 | -0.02 | -0.05 | 0.03 | -0.17 | -0.30 | 0.42 | 0.00 | 0.06 |
| 20.00 | 0.00 | -0.09 | 0.09 | -0.55 | 0.18 | -2.78 | -0.82 | -0.45 | 0.00 | -0.04 | 0.03 | -0.16 | -0.29 | 0.41 | 0.00 | 0.06 |
| 21.00 | 0.01 | -0.08 | 0.09 | -0.54 | 0.16 | -2.93 | -0.81 | -0.48 | 0.01 | -0.03 | 0.04 | -0.16 | -0.29 | 0.40 | 0.00 | 0.06 |
| 22.00 | 0.02 | -0.06 | 0.08 | -0.53 | 0.15 | -3.07 | -0.80 | -0.50 | 0.02 | -0.02 | 0.04 | -0.15 | -0.28 | 0.39 | 0.00 | 0.06 |
| 23.00 | 0.02 | -0.05 | 0.08 | -0.51 | 0.14 | -3.20 | -0.79 | -0.53 | 0.02 | -0.02 | 0.04 | -0.15 | -0.27 | 0.39 | 0.00 | 0.06 |
| 24.00 | 0.03 | -0.05 | 0.08 | -0.50 | 0.13 | -3.33 | -0.79 | -0.56 | 0.03 | -0.01 | 0.04 | -0.15 | -0.26 | 0.38 | 0.00 | 0.06 |
| 25.00 | 0.04 | -0.04 | 0.08 | -0.48 | 0.13 | -3.45 | -0.78 | -0.58 | 0.04 | -0.01 | 0.05 | -0.14 | -0.26 | 0.38 | 0.00 | 0.06 |
| 26.00 | 0.04 | -0.03 | 0.07 | -0.47 | 0.12 | -3.57 | -0.77 | -0.61 | 0.04 | -0.01 | 0.05 | -0.14 | -0.25 | 0.38 | 0.00 | 0.06 |
| 27.00 | 0.05 | -0.02 | 0.07 | -0.45 | 0.11 | -3.68 | -0.76 | -0.63 | 0.05 | -0.01 | 0.05 | -0.13 | -0.24 | 0.38 | 0.00 | 0.06 |
| 28.00 | 0.05 | -0.02 | 0.07 | -0.44 | 0.11 | -3.79 | -0.75 | -0.66 | 0.05 | 0.00 | 0.05 | -0.13 | -0.23 | 0.37 | 0.00 | 0.06 |
| 29.00 | 0.05 | -0.01 | 0.07 | -0.42 | 0.11 | -3.89 | -0.75 | -0.68 | 0.05 | 0.00 | 0.05 | -0.12 | -0.22 | 0.37 | 0.00 | 0.06 |
| 30.00 | 0.06 | 0.00 | 0.06 | -0.41 | 0.10 | -3.99 | -0.74 | -0.70 | 0.06 | 0.00 | 0.05 | -0.12 | -0.21 | 0.37 | 0.00 | 0.06 |
| 31.00 | 0.06 | 0.00 | 0.06 | -0.39 | 0.10 | -4.08 | -0.73 | -0.72 | 0.06 | 0.00 | 0.05 | -0.12 | -0.21 | 0.37 | 0.00 | 0.06 |
| 32.00 | 0.06 | 0.00 | 0.06 | -0.37 | 0.10 | -4.17 | -0.72 | -0.74 | 0.06 | 0.01 | 0.05 | -0.11 | -0.20 | 0.37 | 0.00 | 0.06 |
| 33.00 | 0.06 | 0.01 | 0.06 | -0.35 | 0.10 | -4.25 | -0.72 | -0.76 | 0.06 | 0.01 | 0.06 | -0.11 | -0.19 | 0.37 | 0.00 | 0.06 |
| 34.00 | 0.07 | 0.01 | 0.05 | -0.34 | 0.10 | -4.33 | -0.71 | -0.78 | 0.07 | 0.01 | 0.06 | -0.10 | -0.18 | 0.37 | 0.00 | 0.06 |
| 35.00 | 0.07 | 0.02 | 0.05 | -0.32 | 0.10 | -4.41 | -0.70 | -0.80 | 0.07 | 0.01 | 0.06 | -0.10 | -0.17 | 0.37 | 0.00 | 0.06 |
| 36.00 | 0.07 | 0.02 | 0.05 | -0.30 | 0.10 | -4.48 | -0.70 | -0.82 | 0.07 | 0.01 | 0.06 | -0.10 | -0.17 | 0.37 | 0.00 | 0.06 |
| 37.00 | 0.07 | 0.02 | 0.05 | -0.29 | 0.11 | -4.55 | -0.69 | -0.83 | 0.07 | 0.01 | 0.06 | -0.09 | -0.16 | 0.37 | 0.00 | 0.06 |
| 38.00 | 0.07 | 0.03 | 0.05 | -0.27 | 0.11 | -4.62 | -0.68 | -0.85 | 0.07 | 0.01 | 0.06 | -0.09 | -0.15 | 0.37 | 0.00 | 0.06 |
| 39.00 | 0.07 | 0.03 | 0.04 | -0.25 | 0.11 | -4.68 | -0.68 | -0.86 | 0.07 | 0.02 | 0.06 | -0.09 | -0.14 | 0.37 | 0.00 | 0.06 |
| 40.00 | 0.07 | 0.03 | 0.04 | -0.24 | 0.11 | -4.74 | -0.67 | -0.88 | 0.07 | 0.02 | 0.05 | -0.09 | -0.14 | 0.37 | 0.00 | 0.06 |
Data for Figure 10 - Aggressive Tax-Rule Normal
| Quarter | South: Nominal Interest Rate (annualised, in percentage points) | South: Real Interest Rate (annualised, in percentage points) | South: CPI Inflation (annualised, in percentage points) | South: Output (percent) | South: Real Exchange Rate (percent) | South: Govt Debt (Share of GDP, in percentage points) | South: Govt Spend (trend GDP share) | South: Labor Income Tax Rate (percentage points) | North: Nominal Interest Rate (annualised, in percentage points) | North: Real Interest Rate (annualised, in percentage points) | North: CPI Inflation (annualised, in percentage points) | North: Output (percent) | North: Agg Curr Union Output (percent) | North: Govt Debt (Share of GDP, in percentage points) | North: Govt Spend (trend GDP share) | North: Labor Income Tax Rate (percentage points) |
|---|---|---|---|---|---|---|---|---|---|---|---|---|---|---|---|---|
| 0.00 | -0.04 | 0.19 | -0.16 | -0.85 | 0.04 | 0.49 | -1.00 | -0.10 | -0.04 | -0.07 | 0.02 | -0.03 | -0.30 | 0.02 | 0.00 | 0.00 |
| 1.00 | -0.08 | 0.17 | -0.23 | -0.77 | 0.11 | 0.30 | -0.99 | -0.21 | -0.08 | -0.11 | 0.03 | 0.01 | -0.25 | -0.02 | 0.00 | -0.01 |
| 2.00 | -0.10 | 0.13 | -0.24 | -0.69 | 0.18 | 0.12 | -0.98 | -0.33 | -0.10 | -0.14 | 0.04 | 0.04 | -0.20 | -0.07 | 0.00 | -0.03 |
| 3.00 | -0.11 | 0.08 | -0.22 | -0.61 | 0.25 | -0.06 | -0.97 | -0.46 | -0.11 | -0.16 | 0.05 | 0.06 | -0.16 | -0.11 | 0.00 | -0.05 |
| 4.00 | -0.11 | 0.05 | -0.19 | -0.53 | 0.31 | -0.23 | -0.96 | -0.59 | -0.11 | -0.15 | 0.05 | 0.08 | -0.12 | -0.15 | 0.00 | -0.08 |
| 5.00 | -0.09 | 0.02 | -0.16 | -0.46 | 0.36 | -0.39 | -0.95 | -0.73 | -0.09 | -0.13 | 0.04 | 0.08 | -0.10 | -0.18 | 0.00 | -0.11 |
| 6.00 | -0.08 | 0.01 | -0.12 | -0.39 | 0.40 | -0.53 | -0.94 | -0.87 | -0.08 | -0.11 | 0.04 | 0.09 | -0.07 | -0.20 | 0.00 | -0.13 |
| 7.00 | -0.06 | -0.01 | -0.09 | -0.33 | 0.43 | -0.65 | -0.93 | -1.00 | -0.06 | -0.09 | 0.03 | 0.08 | -0.05 | -0.21 | 0.00 | -0.15 |
| 8.00 | -0.05 | -0.02 | -0.06 | -0.28 | 0.45 | -0.75 | -0.92 | -1.12 | -0.05 | -0.07 | 0.03 | 0.08 | -0.04 | -0.21 | 0.00 | -0.17 |
| 9.00 | -0.04 | -0.02 | -0.03 | -0.24 | 0.46 | -0.84 | -0.91 | -1.24 | -0.04 | -0.05 | 0.02 | 0.08 | -0.03 | -0.20 | 0.00 | -0.18 |
| 10.00 | -0.03 | -0.03 | -0.02 | -0.20 | 0.47 | -0.90 | -0.90 | -1.35 | -0.03 | -0.03 | 0.01 | 0.07 | -0.02 | -0.19 | 0.00 | -0.19 |
| 11.00 | -0.03 | -0.03 | 0.00 | -0.16 | 0.47 | -0.95 | -0.90 | -1.44 | -0.03 | -0.02 | 0.00 | 0.07 | -0.01 | -0.18 | 0.00 | -0.19 |
| 12.00 | -0.02 | -0.04 | 0.01 | -0.13 | 0.46 | -0.99 | -0.89 | -1.52 | -0.02 | -0.01 | 0.00 | 0.06 | 0.00 | -0.16 | 0.00 | -0.19 |
| 13.00 | -0.02 | -0.04 | 0.01 | -0.11 | 0.46 | -1.02 | -0.88 | -1.59 | -0.02 | -0.01 | -0.01 | 0.06 | 0.00 | -0.15 | 0.00 | -0.18 |
| 14.00 | -0.02 | -0.04 | 0.02 | -0.09 | 0.45 | -1.03 | -0.87 | -1.65 | -0.02 | -0.01 | -0.01 | 0.06 | 0.01 | -0.13 | 0.00 | -0.17 |
| 15.00 | -0.03 | -0.05 | 0.02 | -0.07 | 0.44 | -1.03 | -0.86 | -1.69 | -0.03 | -0.01 | -0.02 | 0.05 | 0.01 | -0.11 | 0.00 | -0.16 |
| 16.00 | -0.03 | -0.05 | 0.02 | -0.05 | 0.43 | -1.03 | -0.85 | -1.73 | -0.03 | -0.01 | -0.02 | 0.05 | 0.02 | -0.10 | 0.00 | -0.15 |
| 17.00 | -0.03 | -0.05 | 0.02 | -0.03 | 0.42 | -1.02 | -0.84 | -1.75 | -0.03 | -0.01 | -0.02 | 0.05 | 0.02 | -0.09 | 0.00 | -0.14 |
| 18.00 | -0.03 | -0.05 | 0.02 | -0.02 | 0.41 | -1.00 | -0.83 | -1.77 | -0.03 | -0.01 | -0.02 | 0.05 | 0.02 | -0.08 | 0.00 | -0.13 |
| 19.00 | -0.03 | -0.05 | 0.02 | 0.00 | 0.40 | -0.99 | -0.83 | -1.78 | -0.03 | -0.01 | -0.02 | 0.04 | 0.03 | -0.07 | 0.00 | -0.12 |
| 20.00 | -0.04 | -0.05 | 0.02 | 0.01 | 0.39 | -0.96 | -0.82 | -1.78 | -0.04 | -0.01 | -0.02 | 0.04 | 0.03 | -0.06 | 0.00 | -0.11 |
| 21.00 | -0.04 | -0.05 | 0.02 | 0.02 | 0.38 | -0.94 | -0.81 | -1.77 | -0.04 | -0.02 | -0.02 | 0.04 | 0.03 | -0.05 | 0.00 | -0.10 |
| 22.00 | -0.04 | -0.05 | 0.01 | 0.03 | 0.37 | -0.92 | -0.80 | -1.76 | -0.04 | -0.02 | -0.02 | 0.04 | 0.03 | -0.05 | 0.00 | -0.09 |
| 23.00 | -0.04 | -0.05 | 0.01 | 0.04 | 0.36 | -0.89 | -0.79 | -1.74 | -0.04 | -0.02 | -0.02 | 0.03 | 0.03 | -0.04 | 0.00 | -0.09 |
| 24.00 | -0.04 | -0.05 | 0.01 | 0.04 | 0.35 | -0.87 | -0.79 | -1.72 | -0.04 | -0.02 | -0.02 | 0.03 | 0.04 | -0.04 | 0.00 | -0.08 |
| 25.00 | -0.04 | -0.05 | 0.01 | 0.05 | 0.35 | -0.85 | -0.78 | -1.69 | -0.04 | -0.02 | -0.02 | 0.03 | 0.04 | -0.04 | 0.00 | -0.07 |
| 26.00 | -0.04 | -0.04 | 0.01 | 0.06 | 0.34 | -0.82 | -0.77 | -1.67 | -0.04 | -0.02 | -0.02 | 0.03 | 0.04 | -0.03 | 0.00 | -0.07 |
| 27.00 | -0.04 | -0.04 | 0.01 | 0.06 | 0.33 | -0.80 | -0.76 | -1.64 | -0.04 | -0.02 | -0.02 | 0.03 | 0.04 | -0.03 | 0.00 | -0.07 |
| 28.00 | -0.04 | -0.04 | 0.00 | 0.07 | 0.33 | -0.78 | -0.75 | -1.61 | -0.04 | -0.02 | -0.02 | 0.02 | 0.04 | -0.03 | 0.00 | -0.06 |
| 29.00 | -0.04 | -0.04 | 0.00 | 0.07 | 0.32 | -0.77 | -0.75 | -1.58 | -0.04 | -0.02 | -0.02 | 0.02 | 0.04 | -0.03 | 0.00 | -0.06 |
| 30.00 | -0.04 | -0.04 | 0.00 | 0.07 | 0.32 | -0.75 | -0.74 | -1.55 | -0.04 | -0.02 | -0.02 | 0.02 | 0.04 | -0.03 | 0.00 | -0.06 |
| 31.00 | -0.04 | -0.03 | 0.00 | 0.08 | 0.32 | -0.74 | -0.73 | -1.53 | -0.04 | -0.02 | -0.02 | 0.02 | 0.04 | -0.03 | 0.00 | -0.06 |
| 32.00 | -0.04 | -0.03 | 0.00 | 0.08 | 0.31 | -0.72 | -0.72 | -1.50 | -0.04 | -0.02 | -0.02 | 0.01 | 0.04 | -0.03 | 0.00 | -0.06 |
| 33.00 | -0.04 | -0.03 | 0.00 | 0.08 | 0.31 | -0.71 | -0.72 | -1.47 | -0.04 | -0.02 | -0.02 | 0.01 | 0.04 | -0.03 | 0.00 | -0.05 |
| 34.00 | -0.04 | -0.03 | 0.00 | 0.09 | 0.31 | -0.70 | -0.71 | -1.45 | -0.04 | -0.02 | -0.01 | 0.01 | 0.04 | -0.03 | 0.00 | -0.05 |
| 35.00 | -0.04 | -0.03 | -0.01 | 0.09 | 0.30 | -0.69 | -0.70 | -1.42 | -0.04 | -0.02 | -0.01 | 0.01 | 0.03 | -0.03 | 0.00 | -0.05 |
| 36.00 | -0.04 | -0.03 | -0.01 | 0.09 | 0.30 | -0.69 | -0.70 | -1.40 | -0.04 | -0.02 | -0.01 | 0.01 | 0.03 | -0.03 | 0.00 | -0.05 |
| 37.00 | -0.04 | -0.03 | -0.01 | 0.09 | 0.30 | -0.68 | -0.69 | -1.38 | -0.04 | -0.02 | -0.01 | 0.00 | 0.03 | -0.03 | 0.00 | -0.05 |
| 38.00 | -0.04 | -0.03 | -0.01 | 0.09 | 0.30 | -0.68 | -0.68 | -1.36 | -0.04 | -0.02 | -0.01 | 0.00 | 0.03 | -0.03 | 0.00 | -0.05 |
| 39.00 | -0.04 | -0.03 | -0.01 | 0.10 | 0.30 | -0.67 | -0.68 | -1.34 | -0.04 | -0.02 | -0.01 | 0.00 | 0.03 | -0.03 | 0.00 | -0.05 |
| 40.00 | -0.04 | -0.03 | -0.01 | 0.10 | 0.30 | -0.67 | -0.67 | -1.32 | -0.04 | -0.02 | -0.01 | 0.00 | 0.03 | -0.03 | 0.00 | -0.06 |
Data for Figure 10 - Aggressive Tax-Rule ZLB
| Quarter | South: Nominal Interest Rate (annualised, in percentage points) | South: Real Interest Rate (annualised, in percentage points) | South: CPI Inflation (annualised, in percentage points) | South: Output (percent) | South: Real Exchange Rate (percent) | South: Govt Debt (Share of GDP, in percentage points) | South: Govt Spend (trend GDP share) | South: Labor Income Tax Rate (percentage points) | North: Nominal Interest Rate (annualised, in percentage points) | North: Real Interest Rate (annualised, in percentage points) | North: CPI Inflation (annualised, in percentage points) | North: Output (percent) | North: Agg Curr Union Output (percent) | North: Govt Debt (Share of GDP, in percentage points) | North: Govt Spend (trend GDP share) | North: Labor Income Tax Rate (percentage points) |
|---|---|---|---|---|---|---|---|---|---|---|---|---|---|---|---|---|
| 0.00 | 0.00 | 0.31 | -0.21 | -0.89 | 0.04 | 0.54 | -1.00 | -0.09 | 0.00 | 0.05 | -0.04 | -0.07 | -0.35 | 0.07 | 0.00 | 0.01 |
| 1.00 | 0.00 | 0.34 | -0.31 | -0.87 | 0.11 | 0.41 | -0.99 | -0.18 | 0.00 | 0.06 | -0.05 | -0.08 | -0.34 | 0.08 | 0.00 | 0.02 |
| 2.00 | 0.00 | 0.33 | -0.34 | -0.82 | 0.18 | 0.29 | -0.98 | -0.27 | 0.00 | 0.06 | -0.06 | -0.09 | -0.34 | 0.10 | 0.00 | 0.03 |
| 3.00 | 0.00 | 0.29 | -0.33 | -0.77 | 0.25 | 0.18 | -0.97 | -0.37 | 0.00 | 0.05 | -0.06 | -0.10 | -0.33 | 0.12 | 0.00 | 0.04 |
| 4.00 | 0.00 | 0.24 | -0.29 | -0.72 | 0.31 | 0.06 | -0.96 | -0.46 | 0.00 | 0.04 | -0.05 | -0.11 | -0.31 | 0.14 | 0.00 | 0.05 |
| 5.00 | 0.00 | 0.19 | -0.24 | -0.66 | 0.36 | -0.06 | -0.95 | -0.57 | 0.00 | 0.03 | -0.04 | -0.12 | -0.30 | 0.14 | 0.00 | 0.06 |
| 6.00 | 0.00 | 0.14 | -0.19 | -0.59 | 0.40 | -0.18 | -0.94 | -0.67 | 0.00 | 0.02 | -0.03 | -0.12 | -0.28 | 0.15 | 0.00 | 0.06 |
| 7.00 | 0.00 | 0.10 | -0.14 | -0.53 | 0.43 | -0.30 | -0.93 | -0.78 | 0.00 | 0.01 | -0.02 | -0.12 | -0.26 | 0.14 | 0.00 | 0.07 |
| 8.00 | -0.01 | 0.05 | -0.10 | -0.48 | 0.45 | -0.41 | -0.92 | -0.89 | -0.01 | -0.01 | -0.01 | -0.11 | -0.23 | 0.14 | 0.00 | 0.07 |
| 9.00 | -0.06 | -0.03 | -0.06 | -0.42 | 0.46 | -0.51 | -0.91 | -0.99 | -0.06 | -0.06 | -0.01 | -0.10 | -0.21 | 0.12 | 0.00 | 0.07 |
| 10.00 | -0.08 | -0.08 | -0.03 | -0.37 | 0.47 | -0.61 | -0.90 | -1.10 | -0.08 | -0.08 | 0.00 | -0.10 | -0.19 | 0.10 | 0.00 | 0.06 |
| 11.00 | -0.08 | -0.10 | 0.00 | -0.32 | 0.47 | -0.70 | -0.90 | -1.21 | -0.08 | -0.09 | 0.01 | -0.09 | -0.17 | 0.07 | 0.00 | 0.04 |
| 12.00 | -0.07 | -0.11 | 0.02 | -0.28 | 0.46 | -0.78 | -0.89 | -1.31 | -0.07 | -0.08 | 0.01 | -0.08 | -0.15 | 0.05 | 0.00 | 0.03 |
| 13.00 | -0.06 | -0.11 | 0.03 | -0.25 | 0.46 | -0.84 | -0.88 | -1.40 | -0.06 | -0.07 | 0.01 | -0.08 | -0.13 | 0.03 | 0.00 | 0.01 |
| 14.00 | -0.05 | -0.10 | 0.04 | -0.21 | 0.45 | -0.89 | -0.87 | -1.48 | -0.05 | -0.06 | 0.01 | -0.07 | -0.12 | 0.01 | 0.00 | -0.01 |
| 15.00 | -0.04 | -0.09 | 0.05 | -0.19 | 0.44 | -0.92 | -0.86 | -1.55 | -0.04 | -0.05 | 0.01 | -0.07 | -0.11 | 0.00 | 0.00 | -0.02 |
| 16.00 | -0.03 | -0.09 | 0.05 | -0.16 | 0.43 | -0.94 | -0.85 | -1.61 | -0.03 | -0.04 | 0.01 | -0.06 | -0.10 | -0.01 | 0.00 | -0.03 |
| 17.00 | -0.03 | -0.08 | 0.05 | -0.14 | 0.42 | -0.95 | -0.84 | -1.65 | -0.03 | -0.04 | 0.01 | -0.06 | -0.09 | -0.02 | 0.00 | -0.04 |
| 18.00 | -0.02 | -0.07 | 0.05 | -0.12 | 0.41 | -0.95 | -0.83 | -1.69 | -0.02 | -0.03 | 0.01 | -0.06 | -0.08 | -0.02 | 0.00 | -0.05 |
| 19.00 | -0.02 | -0.07 | 0.05 | -0.10 | 0.40 | -0.94 | -0.83 | -1.71 | -0.02 | -0.03 | 0.01 | -0.05 | -0.07 | -0.02 | 0.00 | -0.06 |
| 20.00 | -0.01 | -0.06 | 0.05 | -0.09 | 0.39 | -0.92 | -0.82 | -1.72 | -0.01 | -0.02 | 0.01 | -0.05 | -0.06 | -0.02 | 0.00 | -0.06 |
| 21.00 | -0.01 | -0.06 | 0.05 | -0.07 | 0.38 | -0.90 | -0.81 | -1.73 | -0.01 | -0.02 | 0.01 | -0.05 | -0.06 | -0.01 | 0.00 | -0.06 |
| 22.00 | -0.01 | -0.05 | 0.05 | -0.06 | 0.37 | -0.88 | -0.80 | -1.73 | -0.01 | -0.02 | 0.01 | -0.05 | -0.05 | -0.01 | 0.00 | -0.06 |
| 23.00 | -0.01 | -0.05 | 0.04 | -0.05 | 0.36 | -0.86 | -0.79 | -1.71 | -0.01 | -0.02 | 0.01 | -0.05 | -0.05 | -0.01 | 0.00 | -0.06 |
| 24.00 | -0.01 | -0.04 | 0.04 | -0.04 | 0.35 | -0.83 | -0.79 | -1.70 | -0.01 | -0.02 | 0.01 | -0.05 | -0.04 | 0.00 | 0.00 | -0.06 |
| 25.00 | -0.01 | -0.04 | 0.04 | -0.03 | 0.35 | -0.81 | -0.78 | -1.68 | -0.01 | -0.02 | 0.01 | -0.04 | -0.04 | 0.00 | 0.00 | -0.06 |
| 26.00 | 0.00 | -0.04 | 0.04 | -0.02 | 0.34 | -0.78 | -0.77 | -1.65 | 0.00 | -0.01 | 0.01 | -0.04 | -0.03 | 0.01 | 0.00 | -0.05 |
| 27.00 | 0.00 | -0.03 | 0.03 | -0.01 | 0.33 | -0.76 | -0.76 | -1.63 | 0.00 | -0.01 | 0.01 | -0.04 | -0.03 | 0.01 | 0.00 | -0.05 |
| 28.00 | 0.00 | -0.03 | 0.03 | 0.00 | 0.33 | -0.74 | -0.75 | -1.60 | 0.00 | -0.01 | 0.01 | -0.04 | -0.03 | 0.01 | 0.00 | -0.05 |
| 29.00 | 0.00 | -0.03 | 0.03 | 0.01 | 0.32 | -0.72 | -0.75 | -1.57 | 0.00 | -0.01 | 0.01 | -0.04 | -0.02 | 0.02 | 0.00 | -0.04 |
| 30.00 | 0.00 | -0.03 | 0.03 | 0.01 | 0.32 | -0.70 | -0.74 | -1.54 | 0.00 | -0.01 | 0.01 | -0.04 | -0.02 | 0.02 | 0.00 | -0.04 |
| 31.00 | 0.00 | -0.02 | 0.03 | 0.02 | 0.32 | -0.68 | -0.73 | -1.50 | 0.00 | -0.01 | 0.01 | -0.04 | -0.02 | 0.02 | 0.00 | -0.03 |
| 32.00 | 0.00 | -0.02 | 0.02 | 0.03 | 0.31 | -0.67 | -0.72 | -1.47 | 0.00 | -0.01 | 0.01 | -0.04 | -0.02 | 0.03 | 0.00 | -0.03 |
| 33.00 | 0.00 | -0.02 | 0.02 | 0.03 | 0.31 | -0.65 | -0.72 | -1.44 | 0.00 | -0.01 | 0.01 | -0.04 | -0.02 | 0.03 | 0.00 | -0.03 |
| 34.00 | 0.00 | -0.02 | 0.02 | 0.04 | 0.31 | -0.64 | -0.71 | -1.42 | 0.00 | -0.01 | 0.01 | -0.04 | -0.01 | 0.03 | 0.00 | -0.02 |
| 35.00 | 0.01 | -0.01 | 0.02 | 0.04 | 0.30 | -0.63 | -0.70 | -1.39 | 0.01 | -0.01 | 0.01 | -0.04 | -0.01 | 0.03 | 0.00 | -0.02 |
| 36.00 | 0.01 | -0.01 | 0.02 | 0.04 | 0.30 | -0.62 | -0.70 | -1.36 | 0.01 | -0.01 | 0.01 | -0.04 | -0.01 | 0.03 | 0.00 | -0.02 |
| 37.00 | 0.01 | -0.01 | 0.02 | 0.05 | 0.30 | -0.62 | -0.69 | -1.34 | 0.01 | -0.01 | 0.01 | -0.04 | -0.01 | 0.03 | 0.00 | -0.01 |
| 38.00 | 0.01 | -0.01 | 0.02 | 0.05 | 0.30 | -0.61 | -0.68 | -1.31 | 0.01 | -0.01 | 0.01 | -0.04 | -0.01 | 0.03 | 0.00 | -0.01 |
| 39.00 | 0.01 | -0.01 | 0.02 | 0.06 | 0.30 | -0.61 | -0.68 | -1.29 | 0.01 | 0.00 | 0.01 | -0.04 | -0.01 | 0.04 | 0.00 | -0.01 |
| 40.00 | 0.01 | -0.01 | 0.01 | 0.06 | 0.30 | -0.61 | -0.67 | -1.27 | 0.01 | 0.00 | 0.01 | -0.04 | -0.01 | 0.04 | 0.00 | -0.01 |
Figure 11. Responses to Coordinated Front-Loaded and Gradual Government Spending Cuts in Currency Union in Normal Times and in a Liquidity Trap
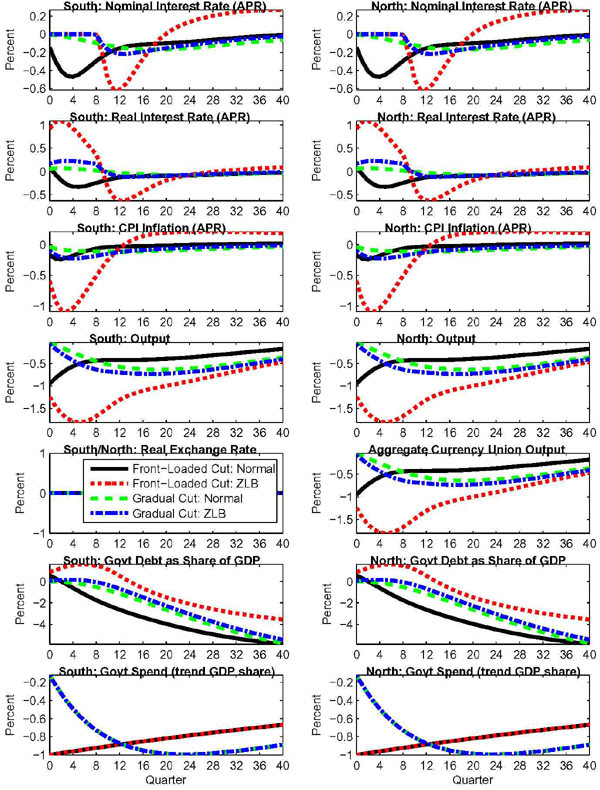
Data for Figure 11 - Front-Loaded Cut Normal
| Quarter | South: Nominal Interest Rate (annualised, in percentage points) | South: Real Interest Rate (annualised, in percentage points) | South: CPI Inflation (annualised, in percentage points) | South: Output (percent) | South: Real Exchange Rate (percent) | South: Govt Debt (Share of GDP, in percentage points) | South: Govt Spend (trend GDP share) | North: Nominal Interest Rate (annualised, in percentage points) | North: Real Interest Rate (annualised, in percentage points) | North: CPI Inflation (annualised, in percentage points) | North: Output (percent) | North: Aggregate Curr Union Output (percent) | North: Govt Debt (Share of GDP, in percentage points) | North: Govt Spend (trend GDP share) |
|---|---|---|---|---|---|---|---|---|---|---|---|---|---|---|
| 0.00 | -0.15 | 0.09 | -0.17 | -0.95 | 0.00 | 0.56 | -1.00 | -0.15 | 0.09 | -0.17 | -0.95 | -0.95 | 0.56 | -1.00 |
| 1.00 | -0.30 | -0.06 | -0.23 | -0.83 | 0.00 | 0.30 | -0.99 | -0.30 | -0.06 | -0.23 | -0.83 | -0.83 | 0.30 | -0.99 |
| 2.00 | -0.41 | -0.19 | -0.24 | -0.72 | 0.00 | 0.01 | -0.98 | -0.41 | -0.19 | -0.24 | -0.72 | -0.72 | 0.01 | -0.98 |
| 3.00 | -0.46 | -0.28 | -0.21 | -0.63 | 0.00 | -0.30 | -0.97 | -0.46 | -0.28 | -0.21 | -0.63 | -0.63 | -0.30 | -0.97 |
| 4.00 | -0.47 | -0.33 | -0.18 | -0.56 | 0.00 | -0.61 | -0.96 | -0.47 | -0.33 | -0.18 | -0.56 | -0.56 | -0.61 | -0.96 |
| 5.00 | -0.44 | -0.33 | -0.14 | -0.51 | 0.00 | -0.91 | -0.95 | -0.44 | -0.33 | -0.14 | -0.51 | -0.51 | -0.91 | -0.95 |
| 6.00 | -0.40 | -0.31 | -0.11 | -0.47 | 0.00 | -1.21 | -0.94 | -0.40 | -0.31 | -0.11 | -0.47 | -0.47 | -1.21 | -0.94 |
| 7.00 | -0.35 | -0.28 | -0.09 | -0.45 | 0.00 | -1.49 | -0.93 | -0.35 | -0.28 | -0.09 | -0.45 | -0.45 | -1.49 | -0.93 |
| 8.00 | -0.30 | -0.24 | -0.07 | -0.43 | 0.00 | -1.75 | -0.92 | -0.30 | -0.24 | -0.07 | -0.43 | -0.43 | -1.75 | -0.92 |
| 9.00 | -0.25 | -0.21 | -0.05 | -0.43 | 0.00 | -1.99 | -0.91 | -0.25 | -0.21 | -0.05 | -0.43 | -0.43 | -1.99 | -0.91 |
| 10.00 | -0.21 | -0.18 | -0.04 | -0.42 | 0.00 | -2.22 | -0.90 | -0.21 | -0.18 | -0.04 | -0.42 | -0.42 | -2.22 | -0.90 |
| 11.00 | -0.18 | -0.15 | -0.03 | -0.42 | 0.00 | -2.44 | -0.90 | -0.18 | -0.15 | -0.03 | -0.42 | -0.42 | -2.44 | -0.90 |
| 12.00 | -0.16 | -0.13 | -0.03 | -0.42 | 0.00 | -2.64 | -0.89 | -0.16 | -0.13 | -0.03 | -0.42 | -0.42 | -2.64 | -0.89 |
| 13.00 | -0.14 | -0.11 | -0.03 | -0.42 | 0.00 | -2.83 | -0.88 | -0.14 | -0.11 | -0.03 | -0.42 | -0.42 | -2.83 | -0.88 |
| 14.00 | -0.13 | -0.10 | -0.03 | -0.42 | 0.00 | -3.01 | -0.87 | -0.13 | -0.10 | -0.03 | -0.42 | -0.42 | -3.01 | -0.87 |
| 15.00 | -0.12 | -0.10 | -0.02 | -0.42 | 0.00 | -3.19 | -0.86 | -0.12 | -0.10 | -0.02 | -0.42 | -0.42 | -3.19 | -0.86 |
| 16.00 | -0.11 | -0.09 | -0.02 | -0.42 | 0.00 | -3.35 | -0.85 | -0.11 | -0.09 | -0.02 | -0.42 | -0.42 | -3.35 | -0.85 |
| 17.00 | -0.11 | -0.09 | -0.02 | -0.41 | 0.00 | -3.52 | -0.84 | -0.11 | -0.09 | -0.02 | -0.41 | -0.41 | -3.52 | -0.84 |
| 18.00 | -0.11 | -0.09 | -0.02 | -0.41 | 0.00 | -3.67 | -0.83 | -0.11 | -0.09 | -0.02 | -0.41 | -0.41 | -3.67 | -0.83 |
| 19.00 | -0.10 | -0.09 | -0.02 | -0.40 | 0.00 | -3.82 | -0.83 | -0.10 | -0.09 | -0.02 | -0.40 | -0.40 | -3.82 | -0.83 |
| 20.00 | -0.10 | -0.09 | -0.01 | -0.40 | 0.00 | -3.97 | -0.82 | -0.10 | -0.09 | -0.01 | -0.40 | -0.40 | -3.97 | -0.82 |
| 21.00 | -0.10 | -0.09 | -0.01 | -0.39 | 0.00 | -4.11 | -0.81 | -0.10 | -0.09 | -0.01 | -0.39 | -0.39 | -4.11 | -0.81 |
| 22.00 | -0.09 | -0.09 | -0.01 | -0.38 | 0.00 | -4.24 | -0.80 | -0.09 | -0.09 | -0.01 | -0.38 | -0.38 | -4.24 | -0.80 |
| 23.00 | -0.09 | -0.08 | -0.01 | -0.37 | 0.00 | -4.37 | -0.79 | -0.09 | -0.08 | -0.01 | -0.37 | -0.37 | -4.37 | -0.79 |
| 24.00 | -0.08 | -0.08 | 0.00 | -0.36 | 0.00 | -4.50 | -0.79 | -0.08 | -0.08 | 0.00 | -0.36 | -0.36 | -4.50 | -0.79 |
| 25.00 | -0.08 | -0.08 | 0.00 | -0.35 | 0.00 | -4.62 | -0.78 | -0.08 | -0.08 | 0.00 | -0.35 | -0.35 | -4.62 | -0.78 |
| 26.00 | -0.07 | -0.08 | 0.00 | -0.34 | 0.00 | -4.73 | -0.77 | -0.07 | -0.08 | 0.00 | -0.34 | -0.34 | -4.73 | -0.77 |
| 27.00 | -0.07 | -0.07 | 0.00 | -0.33 | 0.00 | -4.84 | -0.76 | -0.07 | -0.07 | 0.00 | -0.33 | -0.33 | -4.84 | -0.76 |
| 28.00 | -0.06 | -0.07 | 0.00 | -0.32 | 0.00 | -4.95 | -0.75 | -0.06 | -0.07 | 0.00 | -0.32 | -0.32 | -4.95 | -0.75 |
| 29.00 | -0.06 | -0.07 | 0.01 | -0.31 | 0.00 | -5.05 | -0.75 | -0.06 | -0.07 | 0.01 | -0.31 | -0.31 | -5.05 | -0.75 |
| 30.00 | -0.05 | -0.06 | 0.01 | -0.30 | 0.00 | -5.14 | -0.74 | -0.05 | -0.06 | 0.01 | -0.30 | -0.30 | -5.14 | -0.74 |
| 31.00 | -0.05 | -0.06 | 0.01 | -0.28 | 0.00 | -5.23 | -0.73 | -0.05 | -0.06 | 0.01 | -0.28 | -0.28 | -5.23 | -0.73 |
| 32.00 | -0.04 | -0.05 | 0.01 | -0.27 | 0.00 | -5.32 | -0.72 | -0.04 | -0.05 | 0.01 | -0.27 | -0.27 | -5.32 | -0.72 |
| 33.00 | -0.04 | -0.05 | 0.01 | -0.26 | 0.00 | -5.40 | -0.72 | -0.04 | -0.05 | 0.01 | -0.26 | -0.26 | -5.40 | -0.72 |
| 34.00 | -0.03 | -0.05 | 0.01 | -0.25 | 0.00 | -5.48 | -0.71 | -0.03 | -0.05 | 0.01 | -0.25 | -0.25 | -5.48 | -0.71 |
| 35.00 | -0.03 | -0.04 | 0.02 | -0.23 | 0.00 | -5.55 | -0.70 | -0.03 | -0.04 | 0.02 | -0.23 | -0.23 | -5.55 | -0.70 |
| 36.00 | -0.02 | -0.04 | 0.02 | -0.22 | 0.00 | -5.62 | -0.70 | -0.02 | -0.04 | 0.02 | -0.22 | -0.22 | -5.62 | -0.70 |
| 37.00 | -0.02 | -0.04 | 0.02 | -0.21 | 0.00 | -5.68 | -0.69 | -0.02 | -0.04 | 0.02 | -0.21 | -0.21 | -5.68 | -0.69 |
| 38.00 | -0.01 | -0.03 | 0.02 | -0.20 | 0.00 | -5.74 | -0.68 | -0.01 | -0.03 | 0.02 | -0.20 | -0.20 | -5.74 | -0.68 |
| 39.00 | -0.01 | -0.03 | 0.02 | -0.19 | 0.00 | -5.80 | -0.68 | -0.01 | -0.03 | 0.02 | -0.19 | -0.19 | -5.80 | -0.68 |
| 40.00 | -0.01 | -0.03 | 0.02 | -0.17 | 0.00 | -5.85 | -0.67 | -0.01 | -0.03 | 0.02 | -0.17 | -0.17 | -5.85 | -0.67 |
Data for Figure 11 - Front-Loaded Cut ZLB
| Quarter | South: Nominal Interest Rate (annualised, in percentage points) | South: Real Interest Rate (annualised, in percentage points) | South: CPI Inflation (annualised, in percentage points) | South: Output (percent) | South: Real Exchange Rate (percent) | South: Govt Debt (Share of GDP, in percentage points) | South: Govt Spend (trend GDP share) | North: Nominal Interest Rate (annualised, in percentage points) | North: Real Interest Rate (annualised, in percentage points) | North: CPI Inflation (annualised, in percentage points) | North: Output (percent) | North: Aggregate Curr Union Output (percent) | North: Govt Debt (Share of GDP, in percentage points) | North: Govt Spend (trend GDP share) |
|---|---|---|---|---|---|---|---|---|---|---|---|---|---|---|
| 0.00 | 0.00 | 0.92 | -0.59 | -1.25 | 0.00 | 0.89 | -1.00 | 0.00 | 0.92 | -0.59 | -1.25 | -1.25 | 0.89 | -1.00 |
| 1.00 | 0.00 | 1.06 | -0.92 | -1.46 | 0.00 | 1.07 | -0.99 | 0.00 | 1.06 | -0.92 | -1.46 | -1.46 | 1.07 | -0.99 |
| 2.00 | 0.00 | 1.09 | -1.06 | -1.62 | 0.00 | 1.26 | -0.98 | 0.00 | 1.09 | -1.06 | -1.62 | -1.62 | 1.26 | -0.98 |
| 3.00 | 0.00 | 1.03 | -1.09 | -1.73 | 0.00 | 1.42 | -0.97 | 0.00 | 1.03 | -1.09 | -1.73 | -1.73 | 1.42 | -0.97 |
| 4.00 | 0.00 | 0.93 | -1.03 | -1.79 | 0.00 | 1.54 | -0.96 | 0.00 | 0.93 | -1.03 | -1.79 | -1.79 | 1.54 | -0.96 |
| 5.00 | 0.00 | 0.79 | -0.93 | -1.81 | 0.00 | 1.60 | -0.95 | 0.00 | 0.79 | -0.93 | -1.81 | -1.81 | 1.60 | -0.95 |
| 6.00 | 0.00 | 0.65 | -0.79 | -1.79 | 0.00 | 1.61 | -0.94 | 0.00 | 0.65 | -0.79 | -1.79 | -1.79 | 1.61 | -0.94 |
| 7.00 | 0.00 | 0.51 | -0.65 | -1.75 | 0.00 | 1.57 | -0.93 | 0.00 | 0.51 | -0.65 | -1.75 | -1.75 | 1.57 | -0.93 |
| 8.00 | 0.00 | 0.37 | -0.51 | -1.68 | 0.00 | 1.48 | -0.92 | 0.00 | 0.37 | -0.51 | -1.68 | -1.68 | 1.48 | -0.92 |
| 9.00 | -0.21 | 0.04 | -0.37 | -1.58 | 0.00 | 1.34 | -0.91 | -0.21 | 0.04 | -0.37 | -1.58 | -1.58 | 1.34 | -0.91 |
| 10.00 | -0.50 | -0.36 | -0.25 | -1.49 | 0.00 | 1.13 | -0.90 | -0.50 | -0.36 | -0.25 | -1.49 | -1.49 | 1.13 | -0.90 |
| 11.00 | -0.61 | -0.55 | -0.14 | -1.39 | 0.00 | 0.84 | -0.90 | -0.61 | -0.55 | -0.14 | -1.39 | -1.39 | 0.84 | -0.90 |
| 12.00 | -0.61 | -0.62 | -0.06 | -1.31 | 0.00 | 0.53 | -0.89 | -0.61 | -0.62 | -0.06 | -1.31 | -1.31 | 0.53 | -0.89 |
| 13.00 | -0.55 | -0.62 | 0.01 | -1.25 | 0.00 | 0.21 | -0.88 | -0.55 | -0.62 | 0.01 | -1.25 | -1.25 | 0.21 | -0.88 |
| 14.00 | -0.46 | -0.57 | 0.07 | -1.19 | 0.00 | -0.09 | -0.87 | -0.46 | -0.57 | 0.07 | -1.19 | -1.19 | -0.09 | -0.87 |
| 15.00 | -0.37 | -0.50 | 0.11 | -1.15 | 0.00 | -0.38 | -0.86 | -0.37 | -0.50 | 0.11 | -1.15 | -1.15 | -0.38 | -0.86 |
| 16.00 | -0.27 | -0.43 | 0.14 | -1.11 | 0.00 | -0.64 | -0.85 | -0.27 | -0.43 | 0.14 | -1.11 | -1.11 | -0.64 | -0.85 |
| 17.00 | -0.18 | -0.36 | 0.16 | -1.08 | 0.00 | -0.88 | -0.84 | -0.18 | -0.36 | 0.16 | -1.08 | -1.08 | -0.88 | -0.84 |
| 18.00 | -0.11 | -0.30 | 0.17 | -1.05 | 0.00 | -1.10 | -0.83 | -0.11 | -0.30 | 0.17 | -1.05 | -1.05 | -1.10 | -0.83 |
| 19.00 | -0.05 | -0.24 | 0.19 | -1.02 | 0.00 | -1.30 | -0.83 | -0.05 | -0.24 | 0.19 | -1.02 | -1.02 | -1.30 | -0.83 |
| 20.00 | 0.01 | -0.19 | 0.19 | -1.00 | 0.00 | -1.48 | -0.82 | 0.01 | -0.19 | 0.19 | -1.00 | -1.00 | -1.48 | -0.82 |
| 21.00 | 0.05 | -0.15 | 0.20 | -0.97 | 0.00 | -1.65 | -0.81 | 0.05 | -0.15 | 0.20 | -0.97 | -0.97 | -1.65 | -0.81 |
| 22.00 | 0.08 | -0.12 | 0.20 | -0.95 | 0.00 | -1.81 | -0.80 | 0.08 | -0.12 | 0.20 | -0.95 | -0.95 | -1.81 | -0.80 |
| 23.00 | 0.11 | -0.10 | 0.21 | -0.92 | 0.00 | -1.96 | -0.79 | 0.11 | -0.10 | 0.21 | -0.92 | -0.92 | -1.96 | -0.79 |
| 24.00 | 0.14 | -0.07 | 0.21 | -0.90 | 0.00 | -2.10 | -0.79 | 0.14 | -0.07 | 0.21 | -0.90 | -0.90 | -2.10 | -0.79 |
| 25.00 | 0.16 | -0.05 | 0.21 | -0.87 | 0.00 | -2.23 | -0.78 | 0.16 | -0.05 | 0.21 | -0.87 | -0.87 | -2.23 | -0.78 |
| 26.00 | 0.17 | -0.04 | 0.21 | -0.84 | 0.00 | -2.35 | -0.77 | 0.17 | -0.04 | 0.21 | -0.84 | -0.84 | -2.35 | -0.77 |
| 27.00 | 0.19 | -0.02 | 0.21 | -0.81 | 0.00 | -2.47 | -0.76 | 0.19 | -0.02 | 0.21 | -0.81 | -0.81 | -2.47 | -0.76 |
| 28.00 | 0.20 | -0.01 | 0.21 | -0.78 | 0.00 | -2.58 | -0.75 | 0.20 | -0.01 | 0.21 | -0.78 | -0.78 | -2.58 | -0.75 |
| 29.00 | 0.21 | 0.00 | 0.21 | -0.76 | 0.00 | -2.69 | -0.75 | 0.21 | 0.00 | 0.21 | -0.76 | -0.76 | -2.69 | -0.75 |
| 30.00 | 0.22 | 0.02 | 0.21 | -0.73 | 0.00 | -2.79 | -0.74 | 0.22 | 0.02 | 0.21 | -0.73 | -0.73 | -2.79 | -0.74 |
| 31.00 | 0.23 | 0.03 | 0.21 | -0.70 | 0.00 | -2.89 | -0.73 | 0.23 | 0.03 | 0.21 | -0.70 | -0.70 | -2.89 | -0.73 |
| 32.00 | 0.24 | 0.04 | 0.21 | -0.67 | 0.00 | -2.98 | -0.72 | 0.24 | 0.04 | 0.21 | -0.67 | -0.67 | -2.98 | -0.72 |
| 33.00 | 0.25 | 0.04 | 0.21 | -0.65 | 0.00 | -3.06 | -0.72 | 0.25 | 0.04 | 0.21 | -0.65 | -0.65 | -3.06 | -0.72 |
| 34.00 | 0.25 | 0.05 | 0.20 | -0.62 | 0.00 | -3.14 | -0.71 | 0.25 | 0.05 | 0.20 | -0.62 | -0.62 | -3.14 | -0.71 |
| 35.00 | 0.26 | 0.06 | 0.20 | -0.59 | 0.00 | -3.22 | -0.70 | 0.26 | 0.06 | 0.20 | -0.59 | -0.59 | -3.22 | -0.70 |
| 36.00 | 0.26 | 0.07 | 0.20 | -0.57 | 0.00 | -3.29 | -0.70 | 0.26 | 0.07 | 0.20 | -0.57 | -0.57 | -3.29 | -0.70 |
| 37.00 | 0.27 | 0.07 | 0.20 | -0.54 | 0.00 | -3.36 | -0.69 | 0.27 | 0.07 | 0.20 | -0.54 | -0.54 | -3.36 | -0.69 |
| 38.00 | 0.27 | 0.08 | 0.19 | -0.52 | 0.00 | -3.43 | -0.68 | 0.27 | 0.08 | 0.19 | -0.52 | -0.52 | -3.43 | -0.68 |
| 39.00 | 0.27 | 0.08 | 0.19 | -0.49 | 0.00 | -3.49 | -0.68 | 0.27 | 0.08 | 0.19 | -0.49 | -0.49 | -3.49 | -0.68 |
| 40.00 | 0.27 | 0.09 | 0.19 | -0.47 | 0.00 | -3.55 | -0.67 | 0.27 | 0.09 | 0.19 | -0.47 | -0.47 | -3.55 | -0.67 |
Data for Figure 11 - Gradual Cut Normal
| Quarter | South: Nominal Interest Rate (annualised, in percentage points) | South: Real Interest Rate (annualised, in percentage points) | South: CPI Inflation (annualised, in percentage points) | South: Output (percent) | South: Real Exchange Rate (percent) | South: Govt Debt (Share of GDP, in percentage points) | South: Govt Spend (trend GDP share) | North: Nominal Interest Rate (annualised, in percentage points) | North: Real Interest Rate (annualised, in percentage points) | North: CPI Inflation (annualised, in percentage points) | North: Output (percent) | North: Aggregate Curr Union Output (percent) | North: Govt Debt (Share of GDP, in percentage points) | North: Govt Spend (trend GDP share) |
|---|---|---|---|---|---|---|---|---|---|---|---|---|---|---|
| 0.00 | -0.01 | 0.06 | -0.04 | -0.03 | 0.00 | 0.00 | -0.12 | -0.01 | 0.06 | -0.04 | -0.03 | -0.03 | 0.00 | -0.12 |
| 1.00 | -0.01 | 0.07 | -0.06 | -0.09 | 0.00 | 0.00 | -0.23 | -0.01 | 0.07 | -0.06 | -0.09 | -0.09 | 0.00 | -0.23 |
| 2.00 | -0.02 | 0.07 | -0.08 | -0.14 | 0.00 | -0.02 | -0.33 | -0.02 | 0.07 | -0.08 | -0.14 | -0.14 | -0.02 | -0.33 |
| 3.00 | -0.03 | 0.07 | -0.09 | -0.20 | 0.00 | -0.06 | -0.41 | -0.03 | 0.07 | -0.09 | -0.20 | -0.20 | -0.06 | -0.41 |
| 4.00 | -0.04 | 0.06 | -0.10 | -0.26 | 0.00 | -0.12 | -0.49 | -0.04 | 0.06 | -0.10 | -0.26 | -0.26 | -0.12 | -0.49 |
| 5.00 | -0.06 | 0.05 | -0.10 | -0.31 | 0.00 | -0.20 | -0.56 | -0.06 | 0.05 | -0.10 | -0.31 | -0.31 | -0.20 | -0.56 |
| 6.00 | -0.07 | 0.04 | -0.11 | -0.36 | 0.00 | -0.29 | -0.62 | -0.07 | 0.04 | -0.11 | -0.36 | -0.36 | -0.29 | -0.62 |
| 7.00 | -0.08 | 0.03 | -0.11 | -0.41 | 0.00 | -0.40 | -0.68 | -0.08 | 0.03 | -0.11 | -0.41 | -0.41 | -0.40 | -0.68 |
| 8.00 | -0.10 | 0.02 | -0.11 | -0.45 | 0.00 | -0.53 | -0.73 | -0.10 | 0.02 | -0.11 | -0.45 | -0.45 | -0.53 | -0.73 |
| 9.00 | -0.11 | 0.01 | -0.12 | -0.49 | 0.00 | -0.66 | -0.77 | -0.11 | 0.01 | -0.12 | -0.49 | -0.49 | -0.66 | -0.77 |
| 10.00 | -0.12 | -0.01 | -0.12 | -0.52 | 0.00 | -0.81 | -0.81 | -0.12 | -0.01 | -0.12 | -0.52 | -0.52 | -0.81 | -0.81 |
| 11.00 | -0.14 | -0.02 | -0.12 | -0.55 | 0.00 | -0.97 | -0.84 | -0.14 | -0.02 | -0.12 | -0.55 | -0.55 | -0.97 | -0.84 |
| 12.00 | -0.15 | -0.03 | -0.12 | -0.57 | 0.00 | -1.14 | -0.87 | -0.15 | -0.03 | -0.12 | -0.57 | -0.57 | -1.14 | -0.87 |
| 13.00 | -0.15 | -0.04 | -0.12 | -0.59 | 0.00 | -1.31 | -0.90 | -0.15 | -0.04 | -0.12 | -0.59 | -0.59 | -1.31 | -0.90 |
| 14.00 | -0.16 | -0.05 | -0.11 | -0.61 | 0.00 | -1.49 | -0.92 | -0.16 | -0.05 | -0.11 | -0.61 | -0.61 | -1.49 | -0.92 |
| 15.00 | -0.17 | -0.06 | -0.11 | -0.62 | 0.00 | -1.68 | -0.94 | -0.17 | -0.06 | -0.11 | -0.62 | -0.62 | -1.68 | -0.94 |
| 16.00 | -0.17 | -0.06 | -0.11 | -0.63 | 0.00 | -1.87 | -0.95 | -0.17 | -0.06 | -0.11 | -0.63 | -0.63 | -1.87 | -0.95 |
| 17.00 | -0.17 | -0.07 | -0.11 | -0.63 | 0.00 | -2.06 | -0.96 | -0.17 | -0.07 | -0.11 | -0.63 | -0.63 | -2.06 | -0.96 |
| 18.00 | -0.17 | -0.07 | -0.10 | -0.64 | 0.00 | -2.25 | -0.97 | -0.17 | -0.07 | -0.10 | -0.64 | -0.64 | -2.25 | -0.97 |
| 19.00 | -0.17 | -0.07 | -0.10 | -0.64 | 0.00 | -2.45 | -0.98 | -0.17 | -0.07 | -0.10 | -0.64 | -0.64 | -2.45 | -0.98 |
| 20.00 | -0.17 | -0.07 | -0.10 | -0.64 | 0.00 | -2.64 | -0.99 | -0.17 | -0.07 | -0.10 | -0.64 | -0.64 | -2.64 | -0.99 |
| 21.00 | -0.17 | -0.08 | -0.09 | -0.63 | 0.00 | -2.83 | -0.99 | -0.17 | -0.08 | -0.09 | -0.63 | -0.63 | -2.83 | -0.99 |
| 22.00 | -0.16 | -0.08 | -0.09 | -0.63 | 0.00 | -3.02 | -0.99 | -0.16 | -0.08 | -0.09 | -0.63 | -0.63 | -3.02 | -0.99 |
| 23.00 | -0.16 | -0.08 | -0.09 | -0.62 | 0.00 | -3.21 | -0.99 | -0.16 | -0.08 | -0.09 | -0.62 | -0.62 | -3.21 | -0.99 |
| 24.00 | -0.15 | -0.07 | -0.08 | -0.61 | 0.00 | -3.40 | -0.99 | -0.15 | -0.07 | -0.08 | -0.61 | -0.61 | -3.40 | -0.99 |
| 25.00 | -0.15 | -0.07 | -0.08 | -0.60 | 0.00 | -3.58 | -0.99 | -0.15 | -0.07 | -0.08 | -0.60 | -0.60 | -3.58 | -0.99 |
| 26.00 | -0.14 | -0.07 | -0.08 | -0.59 | 0.00 | -3.76 | -0.99 | -0.14 | -0.07 | -0.08 | -0.59 | -0.59 | -3.76 | -0.99 |
| 27.00 | -0.14 | -0.07 | -0.07 | -0.58 | 0.00 | -3.93 | -0.99 | -0.14 | -0.07 | -0.07 | -0.58 | -0.58 | -3.93 | -0.99 |
| 28.00 | -0.13 | -0.07 | -0.07 | -0.56 | 0.00 | -4.10 | -0.98 | -0.13 | -0.07 | -0.07 | -0.56 | -0.56 | -4.10 | -0.98 |
| 29.00 | -0.12 | -0.06 | -0.06 | -0.55 | 0.00 | -4.27 | -0.98 | -0.12 | -0.06 | -0.06 | -0.55 | -0.55 | -4.27 | -0.98 |
| 30.00 | -0.12 | -0.06 | -0.06 | -0.54 | 0.00 | -4.43 | -0.97 | -0.12 | -0.06 | -0.06 | -0.54 | -0.54 | -4.43 | -0.97 |
| 31.00 | -0.11 | -0.06 | -0.06 | -0.52 | 0.00 | -4.59 | -0.96 | -0.11 | -0.06 | -0.06 | -0.52 | -0.52 | -4.59 | -0.96 |
| 32.00 | -0.11 | -0.05 | -0.06 | -0.50 | 0.00 | -4.74 | -0.96 | -0.11 | -0.05 | -0.06 | -0.50 | -0.50 | -4.74 | -0.96 |
| 33.00 | -0.10 | -0.05 | -0.05 | -0.49 | 0.00 | -4.89 | -0.95 | -0.10 | -0.05 | -0.05 | -0.49 | -0.49 | -4.89 | -0.95 |
| 34.00 | -0.09 | -0.05 | -0.05 | -0.47 | 0.00 | -5.03 | -0.94 | -0.09 | -0.05 | -0.05 | -0.47 | -0.47 | -5.03 | -0.94 |
| 35.00 | -0.09 | -0.04 | -0.05 | -0.45 | 0.00 | -5.16 | -0.93 | -0.09 | -0.04 | -0.05 | -0.45 | -0.45 | -5.16 | -0.93 |
| 36.00 | -0.08 | -0.04 | -0.04 | -0.43 | 0.00 | -5.30 | -0.93 | -0.08 | -0.04 | -0.04 | -0.43 | -0.43 | -5.30 | -0.93 |
| 37.00 | -0.08 | -0.04 | -0.04 | -0.42 | 0.00 | -5.42 | -0.92 | -0.08 | -0.04 | -0.04 | -0.42 | -0.42 | -5.42 | -0.92 |
| 38.00 | -0.07 | -0.03 | -0.04 | -0.40 | 0.00 | -5.54 | -0.91 | -0.07 | -0.03 | -0.04 | -0.40 | -0.40 | -5.54 | -0.91 |
| 39.00 | -0.07 | -0.03 | -0.04 | -0.38 | 0.00 | -5.66 | -0.90 | -0.07 | -0.03 | -0.04 | -0.38 | -0.38 | -5.66 | -0.90 |
| 40.00 | -0.06 | -0.03 | -0.04 | -0.36 | 0.00 | -5.77 | -0.89 | -0.06 | -0.03 | -0.04 | -0.36 | -0.36 | -5.77 | -0.89 |
Data for Figure 11 - Gradual Cut ZLB
| Quarter | South: Nominal Interest Rate (annualised, in percentage points) | South: Real Interest Rate (annualised, in percentage points) | South: CPI Inflation (annualised, in percentage points) | South: Output (percent) | South: Real Exchange Rate (percent) | South: Govt Debt (Share of GDP, in percentage points) | South: Govt Spend (trend GDP share) | North: Nominal Interest Rate (annualised, in percentage points) | North: Real Interest Rate (annualised, in percentage points) | North: CPI Inflation (annualised, in percentage points) | North: Output (percent) | North: Aggregate Curr Union Output (percent) | North: Govt Debt (Share of GDP, in percentage points) | North: Govt Spend (trend GDP share) |
|---|---|---|---|---|---|---|---|---|---|---|---|---|---|---|
| 0.00 | 0.00 | 0.17 | -0.10 | -0.07 | 0.00 | 0.05 | -0.12 | 0.00 | 0.17 | -0.10 | -0.07 | -0.07 | 0.05 | -0.12 |
| 1.00 | 0.00 | 0.20 | -0.17 | -0.17 | 0.00 | 0.11 | -0.23 | 0.00 | 0.20 | -0.17 | -0.17 | -0.17 | 0.11 | -0.23 |
| 2.00 | 0.00 | 0.22 | -0.20 | -0.27 | 0.00 | 0.15 | -0.33 | 0.00 | 0.22 | -0.20 | -0.27 | -0.27 | 0.15 | -0.33 |
| 3.00 | 0.00 | 0.23 | -0.22 | -0.36 | 0.00 | 0.17 | -0.41 | 0.00 | 0.23 | -0.22 | -0.36 | -0.36 | 0.17 | -0.41 |
| 4.00 | 0.00 | 0.22 | -0.23 | -0.43 | 0.00 | 0.17 | -0.49 | 0.00 | 0.22 | -0.23 | -0.43 | -0.43 | 0.17 | -0.49 |
| 5.00 | 0.00 | 0.21 | -0.22 | -0.50 | 0.00 | 0.14 | -0.56 | 0.00 | 0.21 | -0.22 | -0.50 | -0.50 | 0.14 | -0.56 |
| 6.00 | 0.00 | 0.20 | -0.21 | -0.56 | 0.00 | 0.10 | -0.62 | 0.00 | 0.20 | -0.21 | -0.56 | -0.56 | 0.10 | -0.62 |
| 7.00 | 0.00 | 0.18 | -0.20 | -0.60 | 0.00 | 0.03 | -0.68 | 0.00 | 0.18 | -0.20 | -0.60 | -0.60 | 0.03 | -0.68 |
| 8.00 | 0.00 | 0.16 | -0.18 | -0.64 | 0.00 | -0.06 | -0.73 | 0.00 | 0.16 | -0.18 | -0.64 | -0.64 | -0.06 | -0.73 |
| 9.00 | -0.11 | 0.04 | -0.17 | -0.66 | 0.00 | -0.18 | -0.77 | -0.11 | 0.04 | -0.17 | -0.66 | -0.66 | -0.18 | -0.77 |
| 10.00 | -0.17 | -0.04 | -0.15 | -0.68 | 0.00 | -0.32 | -0.81 | -0.17 | -0.04 | -0.15 | -0.68 | -0.68 | -0.32 | -0.81 |
| 11.00 | -0.20 | -0.08 | -0.13 | -0.69 | 0.00 | -0.49 | -0.84 | -0.20 | -0.08 | -0.13 | -0.69 | -0.69 | -0.49 | -0.84 |
| 12.00 | -0.22 | -0.11 | -0.12 | -0.70 | 0.00 | -0.68 | -0.87 | -0.22 | -0.11 | -0.12 | -0.70 | -0.70 | -0.68 | -0.87 |
| 13.00 | -0.22 | -0.12 | -0.11 | -0.71 | 0.00 | -0.87 | -0.90 | -0.22 | -0.12 | -0.11 | -0.71 | -0.71 | -0.87 | -0.90 |
| 14.00 | -0.21 | -0.12 | -0.10 | -0.72 | 0.00 | -1.07 | -0.92 | -0.21 | -0.12 | -0.10 | -0.72 | -0.72 | -1.07 | -0.92 |
| 15.00 | -0.20 | -0.12 | -0.09 | -0.73 | 0.00 | -1.27 | -0.94 | -0.20 | -0.12 | -0.09 | -0.73 | -0.73 | -1.27 | -0.94 |
| 16.00 | -0.19 | -0.11 | -0.09 | -0.73 | 0.00 | -1.47 | -0.95 | -0.19 | -0.11 | -0.09 | -0.73 | -0.73 | -1.47 | -0.95 |
| 17.00 | -0.18 | -0.11 | -0.08 | -0.73 | 0.00 | -1.68 | -0.96 | -0.18 | -0.11 | -0.08 | -0.73 | -0.73 | -1.68 | -0.96 |
| 18.00 | -0.17 | -0.10 | -0.08 | -0.73 | 0.00 | -1.88 | -0.97 | -0.17 | -0.10 | -0.08 | -0.73 | -0.73 | -1.88 | -0.97 |
| 19.00 | -0.16 | -0.10 | -0.07 | -0.73 | 0.00 | -2.08 | -0.98 | -0.16 | -0.10 | -0.07 | -0.73 | -0.73 | -2.08 | -0.98 |
| 20.00 | -0.15 | -0.09 | -0.07 | -0.72 | 0.00 | -2.28 | -0.99 | -0.15 | -0.09 | -0.07 | -0.72 | -0.72 | -2.28 | -0.99 |
| 21.00 | -0.14 | -0.09 | -0.06 | -0.72 | 0.00 | -2.48 | -0.99 | -0.14 | -0.09 | -0.06 | -0.72 | -0.72 | -2.48 | -0.99 |
| 22.00 | -0.14 | -0.08 | -0.06 | -0.71 | 0.00 | -2.67 | -0.99 | -0.14 | -0.08 | -0.06 | -0.71 | -0.71 | -2.67 | -0.99 |
| 23.00 | -0.13 | -0.08 | -0.06 | -0.70 | 0.00 | -2.86 | -0.99 | -0.13 | -0.08 | -0.06 | -0.70 | -0.70 | -2.86 | -0.99 |
| 24.00 | -0.12 | -0.07 | -0.05 | -0.69 | 0.00 | -3.05 | -0.99 | -0.12 | -0.07 | -0.05 | -0.69 | -0.69 | -3.05 | -0.99 |
| 25.00 | -0.11 | -0.07 | -0.05 | -0.68 | 0.00 | -3.23 | -0.99 | -0.11 | -0.07 | -0.05 | -0.68 | -0.68 | -3.23 | -0.99 |
| 26.00 | -0.11 | -0.06 | -0.04 | -0.66 | 0.00 | -3.41 | -0.99 | -0.11 | -0.06 | -0.04 | -0.66 | -0.66 | -3.41 | -0.99 |
| 27.00 | -0.10 | -0.06 | -0.04 | -0.65 | 0.00 | -3.59 | -0.99 | -0.10 | -0.06 | -0.04 | -0.65 | -0.65 | -3.59 | -0.99 |
| 28.00 | -0.09 | -0.06 | -0.04 | -0.63 | 0.00 | -3.76 | -0.98 | -0.09 | -0.06 | -0.04 | -0.63 | -0.63 | -3.76 | -0.98 |
| 29.00 | -0.08 | -0.05 | -0.03 | -0.62 | 0.00 | -3.93 | -0.98 | -0.08 | -0.05 | -0.03 | -0.62 | -0.62 | -3.93 | -0.98 |
| 30.00 | -0.08 | -0.05 | -0.03 | -0.60 | 0.00 | -4.09 | -0.97 | -0.08 | -0.05 | -0.03 | -0.60 | -0.60 | -4.09 | -0.97 |
| 31.00 | -0.07 | -0.04 | -0.03 | -0.58 | 0.00 | -4.25 | -0.96 | -0.07 | -0.04 | -0.03 | -0.58 | -0.58 | -4.25 | -0.96 |
| 32.00 | -0.06 | -0.04 | -0.03 | -0.56 | 0.00 | -4.40 | -0.96 | -0.06 | -0.04 | -0.03 | -0.56 | -0.56 | -4.40 | -0.96 |
| 33.00 | -0.06 | -0.04 | -0.02 | -0.54 | 0.00 | -4.55 | -0.95 | -0.06 | -0.04 | -0.02 | -0.54 | -0.54 | -4.55 | -0.95 |
| 34.00 | -0.05 | -0.03 | -0.02 | -0.52 | 0.00 | -4.69 | -0.94 | -0.05 | -0.03 | -0.02 | -0.52 | -0.52 | -4.69 | -0.94 |
| 35.00 | -0.05 | -0.03 | -0.02 | -0.50 | 0.00 | -4.83 | -0.93 | -0.05 | -0.03 | -0.02 | -0.50 | -0.50 | -4.83 | -0.93 |
| 36.00 | -0.04 | -0.02 | -0.02 | -0.48 | 0.00 | -4.96 | -0.93 | -0.04 | -0.02 | -0.02 | -0.48 | -0.48 | -4.96 | -0.93 |
| 37.00 | -0.04 | -0.02 | -0.02 | -0.46 | 0.00 | -5.09 | -0.92 | -0.04 | -0.02 | -0.02 | -0.46 | -0.46 | -5.09 | -0.92 |
| 38.00 | -0.03 | -0.02 | -0.01 | -0.44 | 0.00 | -5.21 | -0.91 | -0.03 | -0.02 | -0.01 | -0.44 | -0.44 | -5.21 | -0.91 |
| 39.00 | -0.03 | -0.02 | -0.01 | -0.42 | 0.00 | -5.33 | -0.90 | -0.03 | -0.02 | -0.01 | -0.42 | -0.42 | -5.33 | -0.90 |
| 40.00 | -0.02 | -0.01 | -0.01 | -0.40 | 0.00 | -5.44 | -0.89 | -0.02 | -0.01 | -0.01 | -0.40 | -0.40 | -5.44 | -0.89 |
Figure 12. Responses to Government Spending Cut in Large South Currency Union Member With and Without Endogenous Risk-Spread
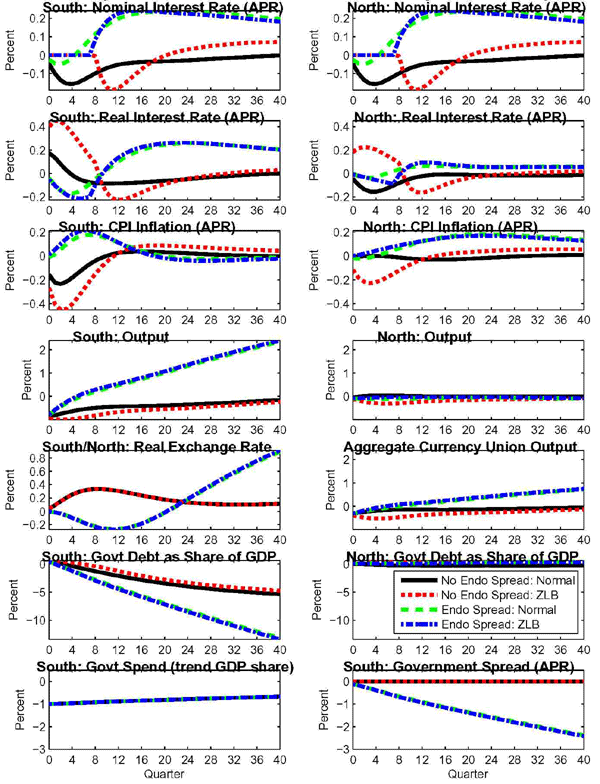
Data for Figure 12 - No Endo Spread Normal
| Quarter | South: Nominal Interest Rate (annualised, in percentage points) | South: Real Interest Rate (annualised, in percentage points) | South: CPI Inflation (annualised, in percentage points) | South: Output (percent) | South: Real Exchange Rate (percent) | South: Govt Debt (Share of GDP, in percentage points) | South: Govt Spend (trend GDP share) | North: Nominal Interest Rate (annualised, in percentage points) | North: Real Interest Rate (annualised, in percentage points) | North: CPI Inflation (annualised, in percentage points) | North: Output (percent) | North: Aggregate Curr Union Output (percent) | North: Govt Debt (Share of GDP, in percentage points) | North: South: Government Spread (annualised, in percentage points) |
|---|---|---|---|---|---|---|---|---|---|---|---|---|---|---|
| 0.00 | -0.05 | 0.17 | -0.16 | -0.87 | 0.04 | 0.50 | -1.00 | -0.05 | -0.04 | -0.01 | -0.04 | -0.32 | 0.03 | 0.00 |
| 1.00 | -0.10 | 0.14 | -0.22 | -0.81 | 0.09 | 0.29 | -0.99 | -0.10 | -0.10 | 0.00 | -0.01 | -0.28 | 0.00 | 0.00 |
| 2.00 | -0.14 | 0.08 | -0.23 | -0.75 | 0.15 | 0.08 | -0.98 | -0.14 | -0.14 | 0.00 | 0.02 | -0.24 | -0.04 | 0.00 |
| 3.00 | -0.15 | 0.03 | -0.22 | -0.69 | 0.21 | -0.14 | -0.97 | -0.15 | -0.16 | 0.00 | 0.03 | -0.21 | -0.08 | 0.00 |
| 4.00 | -0.16 | -0.01 | -0.18 | -0.64 | 0.25 | -0.37 | -0.96 | -0.16 | -0.16 | 0.00 | 0.04 | -0.19 | -0.12 | 0.00 |
| 5.00 | -0.15 | -0.04 | -0.14 | -0.59 | 0.29 | -0.60 | -0.95 | -0.15 | -0.14 | 0.00 | 0.04 | -0.17 | -0.16 | 0.00 |
| 6.00 | -0.13 | -0.06 | -0.10 | -0.55 | 0.31 | -0.83 | -0.94 | -0.13 | -0.13 | 0.00 | 0.04 | -0.16 | -0.19 | 0.00 |
| 7.00 | -0.12 | -0.08 | -0.07 | -0.52 | 0.33 | -1.06 | -0.93 | -0.12 | -0.10 | -0.01 | 0.03 | -0.15 | -0.21 | 0.00 |
| 8.00 | -0.10 | -0.08 | -0.04 | -0.49 | 0.33 | -1.29 | -0.92 | -0.10 | -0.08 | -0.01 | 0.03 | -0.14 | -0.23 | 0.00 |
| 9.00 | -0.08 | -0.08 | -0.02 | -0.47 | 0.33 | -1.50 | -0.91 | -0.08 | -0.06 | -0.02 | 0.02 | -0.14 | -0.24 | 0.00 |
| 10.00 | -0.07 | -0.09 | 0.00 | -0.46 | 0.33 | -1.71 | -0.90 | -0.07 | -0.05 | -0.02 | 0.02 | -0.14 | -0.25 | 0.00 |
| 11.00 | -0.06 | -0.09 | 0.02 | -0.45 | 0.32 | -1.91 | -0.90 | -0.06 | -0.03 | -0.02 | 0.01 | -0.14 | -0.26 | 0.00 |
| 12.00 | -0.05 | -0.08 | 0.03 | -0.44 | 0.31 | -2.11 | -0.89 | -0.05 | -0.02 | -0.03 | 0.01 | -0.14 | -0.26 | 0.00 |
| 13.00 | -0.05 | -0.08 | 0.03 | -0.43 | 0.29 | -2.30 | -0.88 | -0.05 | -0.02 | -0.03 | 0.01 | -0.14 | -0.26 | 0.00 |
| 14.00 | -0.04 | -0.08 | 0.04 | -0.42 | 0.27 | -2.48 | -0.87 | -0.04 | -0.01 | -0.03 | 0.00 | -0.14 | -0.26 | 0.00 |
| 15.00 | -0.04 | -0.08 | 0.04 | -0.42 | 0.26 | -2.66 | -0.86 | -0.04 | -0.01 | -0.03 | 0.00 | -0.14 | -0.26 | 0.00 |
| 16.00 | -0.04 | -0.08 | 0.04 | -0.41 | 0.24 | -2.83 | -0.85 | -0.04 | -0.01 | -0.03 | 0.00 | -0.14 | -0.26 | 0.00 |
| 17.00 | -0.04 | -0.07 | 0.04 | -0.41 | 0.22 | -2.99 | -0.84 | -0.04 | -0.01 | -0.03 | 0.00 | -0.14 | -0.26 | 0.00 |
| 18.00 | -0.04 | -0.07 | 0.04 | -0.40 | 0.21 | -3.15 | -0.83 | -0.04 | -0.01 | -0.03 | 0.00 | -0.14 | -0.26 | 0.00 |
| 19.00 | -0.03 | -0.07 | 0.03 | -0.40 | 0.19 | -3.30 | -0.83 | -0.03 | -0.01 | -0.03 | 0.00 | -0.13 | -0.26 | 0.00 |
| 20.00 | -0.03 | -0.06 | 0.03 | -0.39 | 0.18 | -3.45 | -0.82 | -0.03 | -0.01 | -0.02 | 0.00 | -0.13 | -0.26 | 0.00 |
| 21.00 | -0.03 | -0.06 | 0.03 | -0.38 | 0.16 | -3.59 | -0.81 | -0.03 | -0.01 | -0.02 | 0.00 | -0.13 | -0.26 | 0.00 |
| 22.00 | -0.03 | -0.06 | 0.03 | -0.37 | 0.15 | -3.72 | -0.80 | -0.03 | -0.01 | -0.02 | 0.00 | -0.13 | -0.26 | 0.00 |
| 23.00 | -0.03 | -0.05 | 0.02 | -0.37 | 0.14 | -3.85 | -0.79 | -0.03 | -0.02 | -0.02 | 0.00 | -0.12 | -0.26 | 0.00 |
| 24.00 | -0.03 | -0.05 | 0.02 | -0.36 | 0.13 | -3.98 | -0.79 | -0.03 | -0.02 | -0.01 | 0.00 | -0.12 | -0.26 | 0.00 |
| 25.00 | -0.03 | -0.04 | 0.02 | -0.35 | 0.13 | -4.09 | -0.78 | -0.03 | -0.02 | -0.01 | 0.00 | -0.12 | -0.26 | 0.00 |
| 26.00 | -0.02 | -0.04 | 0.02 | -0.34 | 0.12 | -4.21 | -0.77 | -0.02 | -0.02 | -0.01 | 0.00 | -0.11 | -0.26 | 0.00 |
| 27.00 | -0.02 | -0.04 | 0.02 | -0.32 | 0.11 | -4.32 | -0.76 | -0.02 | -0.02 | -0.01 | 0.00 | -0.11 | -0.26 | 0.00 |
| 28.00 | -0.02 | -0.03 | 0.01 | -0.31 | 0.11 | -4.42 | -0.75 | -0.02 | -0.02 | 0.00 | 0.00 | -0.11 | -0.26 | 0.00 |
| 29.00 | -0.02 | -0.03 | 0.01 | -0.30 | 0.11 | -4.52 | -0.75 | -0.02 | -0.02 | 0.00 | 0.00 | -0.10 | -0.26 | 0.00 |
| 30.00 | -0.02 | -0.03 | 0.01 | -0.29 | 0.10 | -4.62 | -0.74 | -0.02 | -0.02 | 0.00 | 0.00 | -0.10 | -0.26 | 0.00 |
| 31.00 | -0.02 | -0.02 | 0.01 | -0.28 | 0.10 | -4.71 | -0.73 | -0.02 | -0.02 | 0.00 | 0.00 | -0.09 | -0.26 | 0.00 |
| 32.00 | -0.01 | -0.02 | 0.01 | -0.26 | 0.10 | -4.80 | -0.72 | -0.01 | -0.02 | 0.00 | 0.00 | -0.09 | -0.26 | 0.00 |
| 33.00 | -0.01 | -0.02 | 0.01 | -0.25 | 0.10 | -4.88 | -0.72 | -0.01 | -0.02 | 0.00 | 0.00 | -0.09 | -0.26 | 0.00 |
| 34.00 | -0.01 | -0.01 | 0.00 | -0.24 | 0.10 | -4.96 | -0.71 | -0.01 | -0.02 | 0.01 | 0.00 | -0.08 | -0.26 | 0.00 |
| 35.00 | -0.01 | -0.01 | 0.00 | -0.22 | 0.10 | -5.03 | -0.70 | -0.01 | -0.02 | 0.01 | -0.01 | -0.08 | -0.26 | 0.00 |
| 36.00 | -0.01 | -0.01 | 0.00 | -0.21 | 0.10 | -5.10 | -0.70 | -0.01 | -0.02 | 0.01 | -0.01 | -0.07 | -0.26 | 0.00 |
| 37.00 | -0.01 | -0.01 | 0.00 | -0.20 | 0.11 | -5.17 | -0.69 | -0.01 | -0.02 | 0.01 | -0.01 | -0.07 | -0.25 | 0.00 |
| 38.00 | 0.00 | 0.00 | 0.00 | -0.19 | 0.11 | -5.24 | -0.68 | 0.00 | -0.01 | 0.01 | -0.01 | -0.07 | -0.25 | 0.00 |
| 39.00 | 0.00 | 0.00 | 0.00 | -0.17 | 0.11 | -5.30 | -0.68 | 0.00 | -0.01 | 0.01 | -0.01 | -0.06 | -0.25 | 0.00 |
| 40.00 | 0.00 | 0.00 | 0.00 | -0.16 | 0.11 | -5.35 | -0.67 | 0.00 | -0.01 | 0.01 | -0.01 | -0.06 | -0.25 | 0.00 |
Data for Figure 12 - No Endo Spread ZLB
| Quarter | South: Nominal Interest Rate (annualised, in percentage points) | South: Real Interest Rate (annualised, in percentage points) | South: CPI Inflation (annualised, in percentage points) | South: Output (percent) | South: Real Exchange Rate (percent) | South: Govt Debt (Share of GDP, in percentage points) | South: Govt Spend (trend GDP share) | North: Nominal Interest Rate (annualised, in percentage points) | North: Real Interest Rate (annualised, in percentage points) | North: CPI Inflation (annualised, in percentage points) | North: Output (percent) | North: Aggregate Curr Union Output (percent) | North: Govt Debt (Share of GDP, in percentage points) | North: South: Government Spread (annualised, in percentage points) |
|---|---|---|---|---|---|---|---|---|---|---|---|---|---|---|
| 0.00 | 0.00 | 0.40 | -0.27 | -0.95 | 0.04 | 0.58 | -1.00 | 0.00 | 0.18 | -0.12 | -0.12 | -0.40 | 0.12 | 0.00 |
| 1.00 | 0.00 | 0.45 | -0.40 | -0.98 | 0.09 | 0.51 | -0.99 | 0.00 | 0.22 | -0.18 | -0.18 | -0.45 | 0.21 | 0.00 |
| 2.00 | 0.00 | 0.44 | -0.45 | -0.99 | 0.15 | 0.43 | -0.98 | 0.00 | 0.23 | -0.22 | -0.23 | -0.48 | 0.30 | 0.00 |
| 3.00 | 0.00 | 0.40 | -0.44 | -0.99 | 0.21 | 0.33 | -0.97 | 0.00 | 0.22 | -0.23 | -0.27 | -0.51 | 0.39 | 0.00 |
| 4.00 | 0.00 | 0.34 | -0.40 | -0.97 | 0.25 | 0.22 | -0.96 | 0.00 | 0.20 | -0.22 | -0.29 | -0.52 | 0.47 | 0.00 |
| 5.00 | 0.00 | 0.28 | -0.34 | -0.94 | 0.29 | 0.09 | -0.95 | 0.00 | 0.18 | -0.20 | -0.31 | -0.52 | 0.54 | 0.00 |
| 6.00 | 0.00 | 0.21 | -0.28 | -0.91 | 0.31 | -0.06 | -0.94 | 0.00 | 0.15 | -0.18 | -0.32 | -0.51 | 0.59 | 0.00 |
| 7.00 | 0.00 | 0.15 | -0.21 | -0.87 | 0.33 | -0.22 | -0.93 | 0.00 | 0.12 | -0.15 | -0.31 | -0.50 | 0.63 | 0.00 |
| 8.00 | 0.00 | 0.09 | -0.15 | -0.82 | 0.33 | -0.40 | -0.92 | 0.00 | 0.09 | -0.12 | -0.30 | -0.47 | 0.66 | 0.00 |
| 9.00 | -0.12 | -0.07 | -0.09 | -0.78 | 0.33 | -0.59 | -0.91 | -0.12 | -0.05 | -0.10 | -0.28 | -0.45 | 0.67 | 0.00 |
| 10.00 | -0.18 | -0.17 | -0.05 | -0.74 | 0.33 | -0.81 | -0.90 | -0.18 | -0.13 | -0.07 | -0.26 | -0.42 | 0.65 | 0.00 |
| 11.00 | -0.19 | -0.21 | -0.01 | -0.70 | 0.32 | -1.03 | -0.90 | -0.19 | -0.16 | -0.05 | -0.24 | -0.39 | 0.62 | 0.00 |
| 12.00 | -0.18 | -0.23 | 0.02 | -0.67 | 0.31 | -1.26 | -0.89 | -0.18 | -0.16 | -0.03 | -0.22 | -0.37 | 0.58 | 0.00 |
| 13.00 | -0.16 | -0.22 | 0.05 | -0.65 | 0.29 | -1.49 | -0.88 | -0.16 | -0.15 | -0.02 | -0.21 | -0.36 | 0.55 | 0.00 |
| 14.00 | -0.13 | -0.20 | 0.06 | -0.63 | 0.27 | -1.70 | -0.87 | -0.13 | -0.14 | 0.00 | -0.20 | -0.34 | 0.51 | 0.00 |
| 15.00 | -0.10 | -0.18 | 0.08 | -0.61 | 0.26 | -1.91 | -0.86 | -0.10 | -0.12 | 0.01 | -0.19 | -0.33 | 0.49 | 0.00 |
| 16.00 | -0.08 | -0.16 | 0.08 | -0.60 | 0.24 | -2.10 | -0.85 | -0.08 | -0.10 | 0.01 | -0.18 | -0.32 | 0.46 | 0.00 |
| 17.00 | -0.05 | -0.14 | 0.09 | -0.58 | 0.22 | -2.28 | -0.84 | -0.05 | -0.08 | 0.02 | -0.18 | -0.31 | 0.44 | 0.00 |
| 18.00 | -0.03 | -0.12 | 0.09 | -0.57 | 0.21 | -2.46 | -0.83 | -0.03 | -0.06 | 0.02 | -0.17 | -0.31 | 0.43 | 0.00 |
| 19.00 | -0.02 | -0.10 | 0.09 | -0.56 | 0.19 | -2.62 | -0.83 | -0.02 | -0.05 | 0.03 | -0.17 | -0.30 | 0.42 | 0.00 |
| 20.00 | 0.00 | -0.09 | 0.09 | -0.55 | 0.18 | -2.78 | -0.82 | 0.00 | -0.04 | 0.03 | -0.16 | -0.29 | 0.41 | 0.00 |
| 21.00 | 0.01 | -0.08 | 0.09 | -0.54 | 0.16 | -2.93 | -0.81 | 0.01 | -0.03 | 0.04 | -0.16 | -0.29 | 0.40 | 0.00 |
| 22.00 | 0.02 | -0.06 | 0.08 | -0.53 | 0.15 | -3.07 | -0.80 | 0.02 | -0.02 | 0.04 | -0.15 | -0.28 | 0.39 | 0.00 |
| 23.00 | 0.02 | -0.05 | 0.08 | -0.51 | 0.14 | -3.20 | -0.79 | 0.02 | -0.02 | 0.04 | -0.15 | -0.27 | 0.39 | 0.00 |
| 24.00 | 0.03 | -0.05 | 0.08 | -0.50 | 0.13 | -3.33 | -0.79 | 0.03 | -0.01 | 0.04 | -0.15 | -0.26 | 0.38 | 0.00 |
| 25.00 | 0.04 | -0.04 | 0.08 | -0.48 | 0.13 | -3.45 | -0.78 | 0.04 | -0.01 | 0.05 | -0.14 | -0.26 | 0.38 | 0.00 |
| 26.00 | 0.04 | -0.03 | 0.07 | -0.47 | 0.12 | -3.57 | -0.77 | 0.04 | -0.01 | 0.05 | -0.14 | -0.25 | 0.38 | 0.00 |
| 27.00 | 0.05 | -0.02 | 0.07 | -0.45 | 0.11 | -3.68 | -0.76 | 0.05 | -0.01 | 0.05 | -0.13 | -0.24 | 0.38 | 0.00 |
| 28.00 | 0.05 | -0.02 | 0.07 | -0.44 | 0.11 | -3.79 | -0.75 | 0.05 | 0.00 | 0.05 | -0.13 | -0.23 | 0.37 | 0.00 |
| 29.00 | 0.05 | -0.01 | 0.07 | -0.42 | 0.11 | -3.89 | -0.75 | 0.05 | 0.00 | 0.05 | -0.12 | -0.22 | 0.37 | 0.00 |
| 30.00 | 0.06 | 0.00 | 0.06 | -0.41 | 0.10 | -3.99 | -0.74 | 0.06 | 0.00 | 0.05 | -0.12 | -0.21 | 0.37 | 0.00 |
| 31.00 | 0.06 | 0.00 | 0.06 | -0.39 | 0.10 | -4.08 | -0.73 | 0.06 | 0.00 | 0.05 | -0.12 | -0.21 | 0.37 | 0.00 |
| 32.00 | 0.06 | 0.00 | 0.06 | -0.37 | 0.10 | -4.17 | -0.72 | 0.06 | 0.01 | 0.05 | -0.11 | -0.20 | 0.37 | 0.00 |
| 33.00 | 0.06 | 0.01 | 0.06 | -0.35 | 0.10 | -4.25 | -0.72 | 0.06 | 0.01 | 0.06 | -0.11 | -0.19 | 0.37 | 0.00 |
| 34.00 | 0.07 | 0.01 | 0.05 | -0.34 | 0.10 | -4.33 | -0.71 | 0.07 | 0.01 | 0.06 | -0.10 | -0.18 | 0.37 | 0.00 |
| 35.00 | 0.07 | 0.02 | 0.05 | -0.32 | 0.10 | -4.41 | -0.70 | 0.07 | 0.01 | 0.06 | -0.10 | -0.17 | 0.37 | 0.00 |
| 36.00 | 0.07 | 0.02 | 0.05 | -0.30 | 0.10 | -4.48 | -0.70 | 0.07 | 0.01 | 0.06 | -0.10 | -0.17 | 0.37 | 0.00 |
| 37.00 | 0.07 | 0.02 | 0.05 | -0.29 | 0.11 | -4.55 | -0.69 | 0.07 | 0.01 | 0.06 | -0.09 | -0.16 | 0.37 | 0.00 |
| 38.00 | 0.07 | 0.03 | 0.05 | -0.27 | 0.11 | -4.62 | -0.68 | 0.07 | 0.01 | 0.06 | -0.09 | -0.15 | 0.37 | 0.00 |
| 39.00 | 0.07 | 0.03 | 0.04 | -0.25 | 0.11 | -4.68 | -0.68 | 0.07 | 0.02 | 0.06 | -0.09 | -0.14 | 0.37 | 0.00 |
| 40.00 | 0.07 | 0.03 | 0.04 | -0.24 | 0.11 | -4.74 | -0.67 | 0.07 | 0.02 | 0.05 | -0.09 | -0.14 | 0.37 | 0.00 |
Data for Figure 12 - Endo Spread Normal
| Quarter | South: Nominal Interest Rate (annualised, in percentage points) | South: Real Interest Rate (annualised, in percentage points) | South: CPI Inflation (annualised, in percentage points) | South: Output (percent) | South: Real Exchange Rate (percent) | South: Govt Debt (Share of GDP, in percentage points) | South: Govt Spend (trend GDP share) | North: Nominal Interest Rate (annualised, in percentage points) | North: Real Interest Rate (annualised, in percentage points) | North: CPI Inflation (annualised, in percentage points) | North: Output (percent) | North: Aggregate Curr Union Output (percent) | North: Govt Debt (Share of GDP, in percentage points) | North: South: Government Spread (annualised, in percentage points) |
|---|---|---|---|---|---|---|---|---|---|---|---|---|---|---|
| 0.00 | -0.02 | -0.04 | -0.01 | -0.79 | 0.00 | 0.40 | -1.00 | -0.02 | 0.00 | -0.02 | -0.09 | -0.32 | 0.08 | -0.11 |
| 1.00 | -0.04 | -0.10 | 0.02 | -0.61 | -0.01 | 0.03 | -0.99 | -0.04 | -0.02 | -0.02 | -0.10 | -0.27 | 0.09 | -0.18 |
| 2.00 | -0.05 | -0.15 | 0.06 | -0.44 | -0.03 | -0.36 | -0.98 | -0.05 | -0.04 | -0.02 | -0.10 | -0.22 | 0.10 | -0.24 |
| 3.00 | -0.04 | -0.17 | 0.10 | -0.29 | -0.06 | -0.76 | -0.97 | -0.04 | -0.04 | -0.01 | -0.11 | -0.17 | 0.10 | -0.31 |
| 4.00 | -0.01 | -0.17 | 0.13 | -0.17 | -0.09 | -1.16 | -0.96 | -0.01 | -0.03 | 0.00 | -0.11 | -0.13 | 0.11 | -0.38 |
| 5.00 | 0.02 | -0.16 | 0.16 | -0.05 | -0.13 | -1.57 | -0.95 | 0.02 | -0.01 | 0.02 | -0.11 | -0.09 | 0.11 | -0.45 |
| 6.00 | 0.05 | -0.13 | 0.17 | 0.04 | -0.16 | -1.98 | -0.94 | 0.05 | 0.00 | 0.03 | -0.10 | -0.05 | 0.11 | -0.52 |
| 7.00 | 0.08 | -0.09 | 0.18 | 0.13 | -0.20 | -2.37 | -0.93 | 0.08 | 0.02 | 0.05 | -0.10 | -0.02 | 0.12 | -0.59 |
| 8.00 | 0.11 | -0.05 | 0.17 | 0.21 | -0.22 | -2.77 | -0.92 | 0.11 | 0.03 | 0.06 | -0.10 | 0.01 | 0.13 | -0.66 |
| 9.00 | 0.14 | -0.01 | 0.16 | 0.28 | -0.24 | -3.15 | -0.91 | 0.14 | 0.05 | 0.08 | -0.09 | 0.03 | 0.14 | -0.72 |
| 10.00 | 0.16 | 0.03 | 0.15 | 0.35 | -0.26 | -3.53 | -0.90 | 0.16 | 0.06 | 0.09 | -0.09 | 0.06 | 0.16 | -0.78 |
| 11.00 | 0.18 | 0.07 | 0.13 | 0.41 | -0.26 | -3.90 | -0.90 | 0.18 | 0.06 | 0.11 | -0.08 | 0.08 | 0.17 | -0.85 |
| 12.00 | 0.20 | 0.10 | 0.11 | 0.48 | -0.26 | -4.26 | -0.89 | 0.20 | 0.06 | 0.12 | -0.08 | 0.11 | 0.19 | -0.91 |
| 13.00 | 0.21 | 0.13 | 0.09 | 0.54 | -0.25 | -4.62 | -0.88 | 0.21 | 0.07 | 0.13 | -0.07 | 0.13 | 0.20 | -0.97 |
| 14.00 | 0.22 | 0.16 | 0.08 | 0.60 | -0.24 | -4.97 | -0.87 | 0.22 | 0.07 | 0.14 | -0.07 | 0.16 | 0.21 | -1.02 |
| 15.00 | 0.22 | 0.18 | 0.06 | 0.67 | -0.21 | -5.32 | -0.86 | 0.22 | 0.06 | 0.15 | -0.06 | 0.18 | 0.23 | -1.08 |
| 16.00 | 0.23 | 0.20 | 0.04 | 0.74 | -0.18 | -5.66 | -0.85 | 0.23 | 0.06 | 0.16 | -0.06 | 0.20 | 0.24 | -1.14 |
| 17.00 | 0.23 | 0.22 | 0.03 | 0.80 | -0.15 | -6.00 | -0.84 | 0.23 | 0.06 | 0.17 | -0.06 | 0.23 | 0.25 | -1.19 |
| 18.00 | 0.24 | 0.23 | 0.02 | 0.87 | -0.11 | -6.33 | -0.83 | 0.23 | 0.06 | 0.17 | -0.06 | 0.25 | 0.26 | -1.25 |
| 19.00 | 0.24 | 0.24 | 0.01 | 0.94 | -0.07 | -6.66 | -0.83 | 0.24 | 0.06 | 0.18 | -0.06 | 0.28 | 0.27 | -1.30 |
| 20.00 | 0.24 | 0.25 | 0.00 | 1.01 | -0.02 | -6.99 | -0.82 | 0.24 | 0.06 | 0.18 | -0.06 | 0.30 | 0.28 | -1.36 |
| 21.00 | 0.24 | 0.25 | -0.01 | 1.08 | 0.03 | -7.32 | -0.81 | 0.24 | 0.06 | 0.18 | -0.06 | 0.32 | 0.29 | -1.41 |
| 22.00 | 0.24 | 0.26 | -0.01 | 1.15 | 0.07 | -7.64 | -0.80 | 0.24 | 0.06 | 0.18 | -0.06 | 0.35 | 0.30 | -1.46 |
| 23.00 | 0.24 | 0.26 | -0.02 | 1.22 | 0.12 | -7.97 | -0.79 | 0.24 | 0.05 | 0.18 | -0.06 | 0.37 | 0.30 | -1.52 |
| 24.00 | 0.24 | 0.26 | -0.02 | 1.30 | 0.18 | -8.29 | -0.79 | 0.24 | 0.06 | 0.18 | -0.06 | 0.39 | 0.31 | -1.57 |
| 25.00 | 0.23 | 0.26 | -0.02 | 1.37 | 0.23 | -8.61 | -0.78 | 0.23 | 0.06 | 0.18 | -0.06 | 0.42 | 0.32 | -1.62 |
| 26.00 | 0.23 | 0.26 | -0.02 | 1.44 | 0.28 | -8.92 | -0.77 | 0.23 | 0.06 | 0.18 | -0.06 | 0.44 | 0.32 | -1.67 |
| 27.00 | 0.23 | 0.26 | -0.02 | 1.51 | 0.33 | -9.24 | -0.76 | 0.23 | 0.06 | 0.18 | -0.06 | 0.46 | 0.33 | -1.73 |
| 28.00 | 0.23 | 0.25 | -0.02 | 1.58 | 0.38 | -9.55 | -0.75 | 0.23 | 0.06 | 0.17 | -0.07 | 0.48 | 0.33 | -1.78 |
| 29.00 | 0.23 | 0.25 | -0.02 | 1.64 | 0.43 | -9.86 | -0.75 | 0.23 | 0.06 | 0.17 | -0.07 | 0.50 | 0.34 | -1.83 |
| 30.00 | 0.22 | 0.25 | -0.02 | 1.71 | 0.47 | -10.17 | -0.74 | 0.22 | 0.06 | 0.17 | -0.07 | 0.52 | 0.34 | -1.88 |
| 31.00 | 0.22 | 0.24 | -0.02 | 1.78 | 0.52 | -10.48 | -0.73 | 0.22 | 0.06 | 0.17 | -0.07 | 0.55 | 0.35 | -1.93 |
| 32.00 | 0.22 | 0.24 | -0.02 | 1.84 | 0.57 | -10.78 | -0.72 | 0.22 | 0.06 | 0.16 | -0.07 | 0.57 | 0.35 | -1.98 |
| 33.00 | 0.22 | 0.24 | -0.02 | 1.91 | 0.61 | -11.08 | -0.72 | 0.22 | 0.06 | 0.16 | -0.08 | 0.59 | 0.36 | -2.03 |
| 34.00 | 0.21 | 0.23 | -0.02 | 1.97 | 0.65 | -11.39 | -0.71 | 0.21 | 0.06 | 0.16 | -0.08 | 0.61 | 0.36 | -2.08 |
| 35.00 | 0.21 | 0.23 | -0.02 | 2.04 | 0.70 | -11.69 | -0.70 | 0.21 | 0.06 | 0.15 | -0.08 | 0.63 | 0.36 | -2.13 |
| 36.00 | 0.21 | 0.22 | -0.02 | 2.10 | 0.74 | -11.98 | -0.70 | 0.21 | 0.06 | 0.15 | -0.08 | 0.64 | 0.37 | -2.18 |
| 37.00 | 0.21 | 0.22 | -0.01 | 2.16 | 0.78 | -12.28 | -0.69 | 0.21 | 0.06 | 0.15 | -0.08 | 0.66 | 0.37 | -2.23 |
| 38.00 | 0.20 | 0.21 | -0.01 | 2.22 | 0.82 | -12.57 | -0.68 | 0.20 | 0.06 | 0.14 | -0.09 | 0.68 | 0.37 | -2.28 |
| 39.00 | 0.20 | 0.21 | -0.01 | 2.28 | 0.86 | -12.86 | -0.68 | 0.20 | 0.06 | 0.14 | -0.09 | 0.70 | 0.37 | -2.33 |
| 40.00 | 0.20 | 0.21 | -0.01 | 2.34 | 0.89 | -13.15 | -0.67 | 0.20 | 0.06 | 0.14 | -0.09 | 0.72 | 0.37 | -2.38 |
Data for Figure 12 - Endo Spread ZLB
| Quarter | South: Nominal Interest Rate (annualised, in percentage points) | South: Real Interest Rate (annualised, in percentage points) | South: CPI Inflation (annualised, in percentage points) | South: Output (percent) | South: Real Exchange Rate (percent) | South: Govt Debt (Share of GDP, in percentage points) | South: Govt Spend (trend GDP share) | North: Nominal Interest Rate (annualised, in percentage points) | North: Real Interest Rate (annualised, in percentage points) | North: CPI Inflation (annualised, in percentage points) | North: Output (percent) | North: Aggregate Curr Union Output (percent) | North: Govt Debt (Share of GDP, in percentage points) | North: South: Government Spread (annualised, in percentage points) |
|---|---|---|---|---|---|---|---|---|---|---|---|---|---|---|
| 0.00 | 0.00 | -0.05 | 0.01 | -0.78 | 0.00 | 0.39 | -1.00 | 0.00 | -0.01 | 0.00 | -0.08 | -0.31 | 0.06 | -0.12 |
| 1.00 | 0.00 | -0.10 | 0.05 | -0.58 | -0.01 | 0.00 | -0.99 | 0.00 | -0.02 | 0.01 | -0.08 | -0.24 | 0.07 | -0.18 |
| 2.00 | 0.00 | -0.15 | 0.10 | -0.40 | -0.03 | -0.40 | -0.98 | 0.00 | -0.03 | 0.02 | -0.07 | -0.18 | 0.07 | -0.25 |
| 3.00 | 0.00 | -0.18 | 0.15 | -0.24 | -0.06 | -0.82 | -0.97 | 0.00 | -0.04 | 0.03 | -0.06 | -0.12 | 0.06 | -0.32 |
| 4.00 | 0.00 | -0.20 | 0.18 | -0.10 | -0.10 | -1.24 | -0.96 | 0.00 | -0.06 | 0.04 | -0.06 | -0.07 | 0.05 | -0.39 |
| 5.00 | 0.00 | -0.21 | 0.20 | 0.02 | -0.13 | -1.66 | -0.95 | 0.00 | -0.07 | 0.06 | -0.05 | -0.02 | 0.04 | -0.46 |
| 6.00 | 0.00 | -0.21 | 0.21 | 0.12 | -0.17 | -2.09 | -0.94 | 0.00 | -0.08 | 0.07 | -0.04 | 0.01 | 0.03 | -0.54 |
| 7.00 | 0.00 | -0.20 | 0.21 | 0.21 | -0.20 | -2.52 | -0.93 | 0.00 | -0.09 | 0.08 | -0.03 | 0.05 | 0.02 | -0.62 |
| 8.00 | 0.08 | -0.10 | 0.20 | 0.29 | -0.23 | -2.94 | -0.92 | 0.08 | -0.01 | 0.09 | -0.03 | 0.07 | 0.00 | -0.69 |
| 9.00 | 0.14 | -0.02 | 0.18 | 0.36 | -0.25 | -3.34 | -0.91 | 0.14 | 0.04 | 0.10 | -0.03 | 0.10 | 0.01 | -0.75 |
| 10.00 | 0.18 | 0.05 | 0.16 | 0.42 | -0.27 | -3.72 | -0.90 | 0.18 | 0.07 | 0.11 | -0.03 | 0.12 | 0.02 | -0.82 |
| 11.00 | 0.21 | 0.10 | 0.14 | 0.48 | -0.27 | -4.09 | -0.90 | 0.21 | 0.09 | 0.12 | -0.03 | 0.14 | 0.04 | -0.88 |
| 12.00 | 0.23 | 0.14 | 0.11 | 0.54 | -0.27 | -4.46 | -0.89 | 0.23 | 0.09 | 0.12 | -0.03 | 0.16 | 0.06 | -0.94 |
| 13.00 | 0.23 | 0.17 | 0.09 | 0.60 | -0.26 | -4.81 | -0.88 | 0.23 | 0.09 | 0.13 | -0.03 | 0.18 | 0.09 | -0.99 |
| 14.00 | 0.24 | 0.19 | 0.07 | 0.67 | -0.24 | -5.16 | -0.87 | 0.24 | 0.09 | 0.14 | -0.03 | 0.20 | 0.11 | -1.05 |
| 15.00 | 0.24 | 0.21 | 0.05 | 0.73 | -0.22 | -5.50 | -0.86 | 0.24 | 0.09 | 0.15 | -0.03 | 0.22 | 0.13 | -1.11 |
| 16.00 | 0.24 | 0.23 | 0.03 | 0.80 | -0.18 | -5.84 | -0.85 | 0.24 | 0.08 | 0.15 | -0.03 | 0.25 | 0.15 | -1.17 |
| 17.00 | 0.24 | 0.24 | 0.01 | 0.86 | -0.15 | -6.18 | -0.84 | 0.24 | 0.08 | 0.16 | -0.03 | 0.27 | 0.16 | -1.22 |
| 18.00 | 0.24 | 0.25 | 0.00 | 0.93 | -0.11 | -6.52 | -0.83 | 0.24 | 0.07 | 0.16 | -0.03 | 0.29 | 0.18 | -1.28 |
| 19.00 | 0.23 | 0.25 | -0.01 | 1.00 | -0.06 | -6.85 | -0.83 | 0.23 | 0.07 | 0.17 | -0.03 | 0.32 | 0.19 | -1.33 |
| 20.00 | 0.23 | 0.26 | -0.02 | 1.07 | -0.02 | -7.18 | -0.82 | 0.23 | 0.06 | 0.17 | -0.03 | 0.34 | 0.20 | -1.39 |
| 21.00 | 0.23 | 0.26 | -0.02 | 1.14 | 0.03 | -7.51 | -0.81 | 0.23 | 0.06 | 0.17 | -0.03 | 0.36 | 0.22 | -1.44 |
| 22.00 | 0.23 | 0.26 | -0.03 | 1.21 | 0.08 | -7.83 | -0.80 | 0.23 | 0.06 | 0.17 | -0.03 | 0.38 | 0.23 | -1.49 |
| 23.00 | 0.23 | 0.26 | -0.03 | 1.28 | 0.13 | -8.16 | -0.79 | 0.23 | 0.06 | 0.17 | -0.03 | 0.41 | 0.24 | -1.55 |
| 24.00 | 0.22 | 0.26 | -0.04 | 1.35 | 0.18 | -8.48 | -0.79 | 0.22 | 0.06 | 0.17 | -0.03 | 0.43 | 0.24 | -1.60 |
| 25.00 | 0.22 | 0.26 | -0.04 | 1.43 | 0.24 | -8.80 | -0.78 | 0.22 | 0.05 | 0.17 | -0.04 | 0.45 | 0.25 | -1.65 |
| 26.00 | 0.22 | 0.26 | -0.04 | 1.50 | 0.29 | -9.12 | -0.77 | 0.22 | 0.05 | 0.17 | -0.04 | 0.47 | 0.26 | -1.71 |
| 27.00 | 0.22 | 0.26 | -0.04 | 1.57 | 0.34 | -9.44 | -0.76 | 0.22 | 0.05 | 0.17 | -0.04 | 0.49 | 0.27 | -1.76 |
| 28.00 | 0.22 | 0.25 | -0.04 | 1.63 | 0.39 | -9.75 | -0.75 | 0.22 | 0.05 | 0.16 | -0.04 | 0.51 | 0.27 | -1.81 |
| 29.00 | 0.21 | 0.25 | -0.04 | 1.70 | 0.44 | -10.07 | -0.75 | 0.21 | 0.06 | 0.16 | -0.05 | 0.54 | 0.28 | -1.86 |
| 30.00 | 0.21 | 0.25 | -0.04 | 1.77 | 0.49 | -10.38 | -0.74 | 0.21 | 0.06 | 0.16 | -0.05 | 0.56 | 0.28 | -1.92 |
| 31.00 | 0.21 | 0.24 | -0.04 | 1.84 | 0.54 | -10.69 | -0.73 | 0.21 | 0.06 | 0.15 | -0.05 | 0.58 | 0.29 | -1.97 |
| 32.00 | 0.20 | 0.24 | -0.04 | 1.90 | 0.58 | -11.00 | -0.72 | 0.20 | 0.06 | 0.15 | -0.06 | 0.60 | 0.29 | -2.02 |
| 33.00 | 0.20 | 0.23 | -0.03 | 1.97 | 0.63 | -11.31 | -0.72 | 0.20 | 0.06 | 0.15 | -0.06 | 0.62 | 0.30 | -2.07 |
| 34.00 | 0.20 | 0.23 | -0.03 | 2.03 | 0.67 | -11.61 | -0.71 | 0.20 | 0.06 | 0.15 | -0.06 | 0.64 | 0.30 | -2.12 |
| 35.00 | 0.20 | 0.23 | -0.03 | 2.09 | 0.72 | -11.91 | -0.70 | 0.20 | 0.06 | 0.14 | -0.07 | 0.65 | 0.31 | -2.17 |
| 36.00 | 0.19 | 0.22 | -0.03 | 2.16 | 0.76 | -12.22 | -0.70 | 0.19 | 0.06 | 0.14 | -0.07 | 0.67 | 0.31 | -2.22 |
| 37.00 | 0.19 | 0.22 | -0.03 | 2.22 | 0.80 | -12.51 | -0.69 | 0.19 | 0.06 | 0.14 | -0.07 | 0.69 | 0.31 | -2.27 |
| 38.00 | 0.19 | 0.21 | -0.03 | 2.28 | 0.84 | -12.81 | -0.68 | 0.19 | 0.06 | 0.13 | -0.07 | 0.71 | 0.32 | -2.32 |
| 39.00 | 0.18 | 0.21 | -0.02 | 2.34 | 0.88 | -13.11 | -0.68 | 0.18 | 0.06 | 0.13 | -0.08 | 0.73 | 0.32 | -2.37 |
| 40.00 | 0.18 | 0.20 | -0.02 | 2.40 | 0.91 | -13.40 | -0.67 | 0.18 | 0.06 | 0.13 | -0.08 | 0.75 | 0.32 | -2.42 |
Figure 13. Responses to Coordinated and Uncoordinated Govt Spending Cuts in Large South Currency Union Member for Different Shares of HM Households
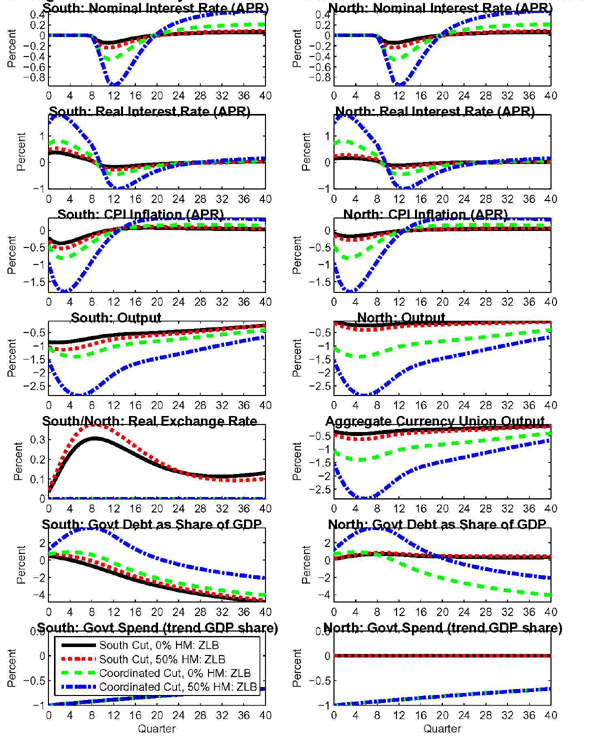
Data for Figure 13 - South Cut 0% HM ZLB
| Quarter | South: Nominal Interest Rate (annualised, in percentage points) | South: Real Interest Rate (annualised, in percentage points) | South: CPI Inflation (annualised, in percentage points) | South: Output (percent) | South: Real Exchange Rate (percent) | South: Govt Debt (Share of GDP, in percentage points) | South: Govt Spend (trend GDP share) | North: Nominal Interest Rate (annualised, in percentage points) | North: Real Interest Rate (annualised, in percentage points) | North: CPI Inflation (annualised, in percentage points) | North: Output (percent) | North: Aggregate Curr Union Output (percent) | North: Govt Debt (Share of GDP, in percentage points) | North: Govt Spend (trend GDP share) |
|---|---|---|---|---|---|---|---|---|---|---|---|---|---|---|
| 0.00 | 0.00 | 0.34 | -0.23 | -0.86 | 0.03 | 0.50 | -1.00 | 0.00 | 0.14 | -0.09 | -0.10 | -0.35 | 0.12 | 0.00 |
| 1.00 | 0.00 | 0.38 | -0.34 | -0.88 | 0.08 | 0.39 | -0.99 | 0.00 | 0.17 | -0.14 | -0.14 | -0.38 | 0.23 | 0.00 |
| 2.00 | 0.00 | 0.37 | -0.38 | -0.88 | 0.14 | 0.28 | -0.98 | 0.00 | 0.17 | -0.17 | -0.18 | -0.41 | 0.33 | 0.00 |
| 3.00 | 0.00 | 0.33 | -0.37 | -0.86 | 0.19 | 0.15 | -0.97 | 0.00 | 0.17 | -0.17 | -0.20 | -0.42 | 0.44 | 0.00 |
| 4.00 | 0.00 | 0.28 | -0.33 | -0.84 | 0.23 | 0.02 | -0.96 | 0.00 | 0.15 | -0.17 | -0.22 | -0.43 | 0.52 | 0.00 |
| 5.00 | 0.00 | 0.23 | -0.28 | -0.81 | 0.26 | -0.13 | -0.95 | 0.00 | 0.13 | -0.15 | -0.24 | -0.43 | 0.60 | 0.00 |
| 6.00 | 0.00 | 0.17 | -0.23 | -0.78 | 0.28 | -0.30 | -0.94 | 0.00 | 0.11 | -0.13 | -0.24 | -0.42 | 0.65 | 0.00 |
| 7.00 | 0.00 | 0.12 | -0.17 | -0.75 | 0.30 | -0.47 | -0.93 | 0.00 | 0.09 | -0.11 | -0.24 | -0.41 | 0.69 | 0.00 |
| 8.00 | -0.01 | 0.06 | -0.12 | -0.71 | 0.30 | -0.66 | -0.92 | -0.01 | 0.06 | -0.09 | -0.23 | -0.39 | 0.71 | 0.00 |
| 9.00 | -0.10 | -0.06 | -0.07 | -0.68 | 0.31 | -0.85 | -0.91 | -0.10 | -0.05 | -0.07 | -0.22 | -0.37 | 0.72 | 0.00 |
| 10.00 | -0.14 | -0.13 | -0.03 | -0.64 | 0.30 | -1.06 | -0.90 | -0.14 | -0.10 | -0.05 | -0.20 | -0.35 | 0.70 | 0.00 |
| 11.00 | -0.14 | -0.17 | 0.00 | -0.62 | 0.29 | -1.28 | -0.90 | -0.14 | -0.12 | -0.04 | -0.19 | -0.33 | 0.66 | 0.00 |
| 12.00 | -0.14 | -0.18 | 0.02 | -0.60 | 0.28 | -1.50 | -0.89 | -0.13 | -0.12 | -0.02 | -0.18 | -0.32 | 0.63 | 0.00 |
| 13.00 | -0.12 | -0.17 | 0.04 | -0.58 | 0.27 | -1.71 | -0.88 | -0.12 | -0.12 | -0.01 | -0.17 | -0.30 | 0.59 | 0.00 |
| 14.00 | -0.10 | -0.16 | 0.06 | -0.56 | 0.25 | -1.91 | -0.87 | -0.10 | -0.10 | 0.00 | -0.16 | -0.30 | 0.55 | 0.00 |
| 15.00 | -0.07 | -0.14 | 0.06 | -0.55 | 0.24 | -2.11 | -0.86 | -0.07 | -0.09 | 0.01 | -0.16 | -0.29 | 0.51 | 0.00 |
| 16.00 | -0.05 | -0.13 | 0.07 | -0.54 | 0.22 | -2.29 | -0.85 | -0.05 | -0.07 | 0.01 | -0.15 | -0.28 | 0.48 | 0.00 |
| 17.00 | -0.04 | -0.11 | 0.07 | -0.53 | 0.21 | -2.47 | -0.84 | -0.04 | -0.06 | 0.02 | -0.15 | -0.28 | 0.46 | 0.00 |
| 18.00 | -0.02 | -0.10 | 0.07 | -0.52 | 0.20 | -2.63 | -0.83 | -0.02 | -0.04 | 0.02 | -0.14 | -0.27 | 0.43 | 0.00 |
| 19.00 | -0.01 | -0.08 | 0.07 | -0.51 | 0.18 | -2.79 | -0.83 | -0.01 | -0.03 | 0.02 | -0.14 | -0.26 | 0.41 | 0.00 |
| 20.00 | 0.00 | -0.07 | 0.07 | -0.51 | 0.17 | -2.94 | -0.82 | 0.00 | -0.03 | 0.03 | -0.14 | -0.26 | 0.39 | 0.00 |
| 21.00 | 0.01 | -0.06 | 0.07 | -0.50 | 0.16 | -3.09 | -0.81 | 0.01 | -0.02 | 0.03 | -0.13 | -0.25 | 0.38 | 0.00 |
| 22.00 | 0.02 | -0.05 | 0.07 | -0.49 | 0.15 | -3.22 | -0.80 | 0.02 | -0.02 | 0.03 | -0.13 | -0.25 | 0.37 | 0.00 |
| 23.00 | 0.02 | -0.04 | 0.07 | -0.48 | 0.14 | -3.35 | -0.79 | 0.02 | -0.01 | 0.03 | -0.13 | -0.24 | 0.35 | 0.00 |
| 24.00 | 0.03 | -0.03 | 0.06 | -0.46 | 0.14 | -3.48 | -0.79 | 0.03 | -0.01 | 0.04 | -0.12 | -0.24 | 0.34 | 0.00 |
| 25.00 | 0.03 | -0.03 | 0.06 | -0.45 | 0.13 | -3.60 | -0.78 | 0.03 | -0.01 | 0.04 | -0.12 | -0.23 | 0.34 | 0.00 |
| 26.00 | 0.04 | -0.02 | 0.06 | -0.44 | 0.13 | -3.71 | -0.77 | 0.04 | 0.00 | 0.04 | -0.12 | -0.22 | 0.33 | 0.00 |
| 27.00 | 0.04 | -0.01 | 0.06 | -0.43 | 0.12 | -3.82 | -0.76 | 0.04 | 0.00 | 0.04 | -0.11 | -0.22 | 0.32 | 0.00 |
| 28.00 | 0.04 | -0.01 | 0.06 | -0.41 | 0.12 | -3.92 | -0.75 | 0.04 | 0.00 | 0.04 | -0.11 | -0.21 | 0.32 | 0.00 |
| 29.00 | 0.05 | 0.00 | 0.05 | -0.40 | 0.12 | -4.02 | -0.75 | 0.05 | 0.00 | 0.04 | -0.11 | -0.20 | 0.31 | 0.00 |
| 30.00 | 0.05 | 0.00 | 0.05 | -0.38 | 0.11 | -4.12 | -0.74 | 0.05 | 0.00 | 0.05 | -0.10 | -0.20 | 0.31 | 0.00 |
| 31.00 | 0.05 | 0.00 | 0.05 | -0.37 | 0.11 | -4.21 | -0.73 | 0.05 | 0.00 | 0.05 | -0.10 | -0.19 | 0.31 | 0.00 |
| 32.00 | 0.05 | 0.01 | 0.05 | -0.36 | 0.11 | -4.29 | -0.72 | 0.05 | 0.01 | 0.05 | -0.10 | -0.18 | 0.31 | 0.00 |
| 33.00 | 0.05 | 0.01 | 0.04 | -0.34 | 0.11 | -4.37 | -0.72 | 0.05 | 0.01 | 0.05 | -0.09 | -0.18 | 0.31 | 0.00 |
| 34.00 | 0.06 | 0.02 | 0.04 | -0.33 | 0.11 | -4.45 | -0.71 | 0.06 | 0.01 | 0.05 | -0.09 | -0.17 | 0.31 | 0.00 |
| 35.00 | 0.06 | 0.02 | 0.04 | -0.31 | 0.12 | -4.52 | -0.70 | 0.06 | 0.01 | 0.05 | -0.09 | -0.16 | 0.31 | 0.00 |
| 36.00 | 0.06 | 0.02 | 0.04 | -0.30 | 0.12 | -4.59 | -0.70 | 0.06 | 0.01 | 0.05 | -0.09 | -0.16 | 0.31 | 0.00 |
| 37.00 | 0.06 | 0.02 | 0.04 | -0.28 | 0.12 | -4.66 | -0.69 | 0.06 | 0.01 | 0.05 | -0.08 | -0.15 | 0.31 | 0.00 |
| 38.00 | 0.06 | 0.03 | 0.04 | -0.27 | 0.12 | -4.72 | -0.68 | 0.06 | 0.01 | 0.05 | -0.08 | -0.14 | 0.31 | 0.00 |
| 39.00 | 0.06 | 0.03 | 0.03 | -0.25 | 0.13 | -4.78 | -0.68 | 0.06 | 0.01 | 0.05 | -0.08 | -0.14 | 0.31 | 0.00 |
| 40.00 | 0.06 | 0.03 | 0.03 | -0.24 | 0.13 | -4.84 | -0.67 | 0.06 | 0.01 | 0.05 | -0.08 | -0.13 | 0.32 | 0.00 |
Data for Figure 13 - South Cut 50% HM ZLB
| Quarter | South: Nominal Interest Rate (annualised, in percentage points) | South: Real Interest Rate (annualised, in percentage points) | South: CPI Inflation (annualised, in percentage points) | South: Output (percent) | South: Real Exchange Rate (percent) | South: Govt Debt (Share of GDP, in percentage points) | South: Govt Spend (trend GDP share) | North: Nominal Interest Rate (annualised, in percentage points) | North: Real Interest Rate (annualised, in percentage points) | North: CPI Inflation (annualised, in percentage points) | North: Output (percent) | North: Aggregate Curr Union Output (percent) | North: Govt Debt (Share of GDP, in percentage points) | North: Govt Spend (trend GDP share) |
|---|---|---|---|---|---|---|---|---|---|---|---|---|---|---|
| 0.00 | 0.00 | 0.48 | -0.32 | -1.06 | 0.04 | 0.68 | -1.00 | 0.00 | 0.23 | -0.15 | -0.15 | -0.45 | 0.15 | 0.00 |
| 1.00 | 0.00 | 0.53 | -0.48 | -1.11 | 0.10 | 0.65 | -0.99 | 0.00 | 0.27 | -0.23 | -0.23 | -0.52 | 0.27 | 0.00 |
| 2.00 | 0.00 | 0.53 | -0.53 | -1.14 | 0.17 | 0.61 | -0.98 | 0.00 | 0.28 | -0.27 | -0.30 | -0.58 | 0.39 | 0.00 |
| 3.00 | 0.00 | 0.48 | -0.53 | -1.14 | 0.23 | 0.55 | -0.97 | 0.00 | 0.28 | -0.28 | -0.35 | -0.61 | 0.50 | 0.00 |
| 4.00 | 0.00 | 0.41 | -0.48 | -1.13 | 0.28 | 0.46 | -0.96 | 0.00 | 0.25 | -0.28 | -0.38 | -0.63 | 0.60 | 0.00 |
| 5.00 | 0.00 | 0.34 | -0.41 | -1.09 | 0.32 | 0.35 | -0.95 | 0.00 | 0.22 | -0.25 | -0.40 | -0.63 | 0.69 | 0.00 |
| 6.00 | 0.00 | 0.26 | -0.34 | -1.05 | 0.35 | 0.22 | -0.94 | 0.00 | 0.19 | -0.22 | -0.41 | -0.62 | 0.76 | 0.00 |
| 7.00 | 0.00 | 0.18 | -0.26 | -1.00 | 0.37 | 0.07 | -0.93 | 0.00 | 0.15 | -0.19 | -0.40 | -0.60 | 0.81 | 0.00 |
| 8.00 | -0.01 | 0.10 | -0.18 | -0.95 | 0.38 | -0.11 | -0.92 | -0.01 | 0.10 | -0.15 | -0.38 | -0.57 | 0.84 | 0.00 |
| 9.00 | -0.16 | -0.10 | -0.12 | -0.89 | 0.38 | -0.30 | -0.91 | -0.16 | -0.07 | -0.12 | -0.36 | -0.54 | 0.85 | 0.00 |
| 10.00 | -0.22 | -0.21 | -0.06 | -0.84 | 0.37 | -0.52 | -0.90 | -0.22 | -0.17 | -0.09 | -0.33 | -0.50 | 0.83 | 0.00 |
| 11.00 | -0.24 | -0.27 | -0.01 | -0.79 | 0.36 | -0.76 | -0.90 | -0.24 | -0.21 | -0.06 | -0.30 | -0.47 | 0.79 | 0.00 |
| 12.00 | -0.23 | -0.28 | 0.03 | -0.75 | 0.34 | -1.01 | -0.89 | -0.23 | -0.21 | -0.03 | -0.28 | -0.44 | 0.74 | 0.00 |
| 13.00 | -0.20 | -0.28 | 0.06 | -0.72 | 0.32 | -1.24 | -0.88 | -0.20 | -0.20 | -0.02 | -0.26 | -0.42 | 0.69 | 0.00 |
| 14.00 | -0.16 | -0.26 | 0.08 | -0.69 | 0.31 | -1.47 | -0.87 | -0.16 | -0.17 | 0.00 | -0.25 | -0.40 | 0.65 | 0.00 |
| 15.00 | -0.13 | -0.23 | 0.09 | -0.67 | 0.29 | -1.69 | -0.86 | -0.13 | -0.15 | 0.01 | -0.24 | -0.38 | 0.61 | 0.00 |
| 16.00 | -0.10 | -0.20 | 0.10 | -0.66 | 0.27 | -1.89 | -0.85 | -0.10 | -0.12 | 0.02 | -0.23 | -0.37 | 0.58 | 0.00 |
| 17.00 | -0.07 | -0.18 | 0.10 | -0.64 | 0.25 | -2.08 | -0.84 | -0.07 | -0.10 | 0.03 | -0.22 | -0.36 | 0.56 | 0.00 |
| 18.00 | -0.04 | -0.15 | 0.11 | -0.63 | 0.23 | -2.27 | -0.83 | -0.04 | -0.08 | 0.03 | -0.21 | -0.35 | 0.54 | 0.00 |
| 19.00 | -0.02 | -0.13 | 0.11 | -0.61 | 0.21 | -2.44 | -0.83 | -0.02 | -0.07 | 0.04 | -0.21 | -0.34 | 0.52 | 0.00 |
| 20.00 | -0.01 | -0.11 | 0.11 | -0.60 | 0.19 | -2.60 | -0.82 | -0.01 | -0.05 | 0.04 | -0.20 | -0.33 | 0.51 | 0.00 |
| 21.00 | 0.01 | -0.10 | 0.10 | -0.58 | 0.18 | -2.75 | -0.81 | 0.01 | -0.04 | 0.04 | -0.20 | -0.32 | 0.50 | 0.00 |
| 22.00 | 0.02 | -0.08 | 0.10 | -0.57 | 0.16 | -2.90 | -0.80 | 0.02 | -0.03 | 0.05 | -0.19 | -0.32 | 0.49 | 0.00 |
| 23.00 | 0.03 | -0.07 | 0.10 | -0.55 | 0.15 | -3.04 | -0.79 | 0.03 | -0.03 | 0.05 | -0.18 | -0.31 | 0.48 | 0.00 |
| 24.00 | 0.03 | -0.06 | 0.10 | -0.53 | 0.14 | -3.17 | -0.79 | 0.03 | -0.02 | 0.05 | -0.18 | -0.30 | 0.48 | 0.00 |
| 25.00 | 0.04 | -0.05 | 0.09 | -0.52 | 0.13 | -3.30 | -0.78 | 0.04 | -0.02 | 0.06 | -0.17 | -0.29 | 0.47 | 0.00 |
| 26.00 | 0.05 | -0.04 | 0.09 | -0.50 | 0.12 | -3.42 | -0.77 | 0.05 | -0.01 | 0.06 | -0.17 | -0.28 | 0.47 | 0.00 |
| 27.00 | 0.05 | -0.03 | 0.09 | -0.48 | 0.11 | -3.54 | -0.76 | 0.05 | -0.01 | 0.06 | -0.16 | -0.27 | 0.46 | 0.00 |
| 28.00 | 0.06 | -0.03 | 0.09 | -0.46 | 0.11 | -3.65 | -0.75 | 0.06 | -0.01 | 0.06 | -0.16 | -0.26 | 0.46 | 0.00 |
| 29.00 | 0.06 | -0.02 | 0.08 | -0.44 | 0.10 | -3.76 | -0.75 | 0.06 | 0.00 | 0.06 | -0.15 | -0.25 | 0.46 | 0.00 |
| 30.00 | 0.06 | -0.01 | 0.08 | -0.42 | 0.10 | -3.86 | -0.74 | 0.06 | 0.00 | 0.06 | -0.14 | -0.24 | 0.45 | 0.00 |
| 31.00 | 0.07 | -0.01 | 0.08 | -0.40 | 0.10 | -3.95 | -0.73 | 0.07 | 0.00 | 0.07 | -0.14 | -0.23 | 0.45 | 0.00 |
| 32.00 | 0.07 | 0.00 | 0.07 | -0.38 | 0.09 | -4.05 | -0.72 | 0.07 | 0.00 | 0.07 | -0.13 | -0.22 | 0.45 | 0.00 |
| 33.00 | 0.07 | 0.00 | 0.07 | -0.36 | 0.09 | -4.13 | -0.72 | 0.07 | 0.01 | 0.07 | -0.13 | -0.21 | 0.45 | 0.00 |
| 34.00 | 0.08 | 0.01 | 0.07 | -0.34 | 0.09 | -4.22 | -0.71 | 0.08 | 0.01 | 0.07 | -0.13 | -0.20 | 0.45 | 0.00 |
| 35.00 | 0.08 | 0.01 | 0.07 | -0.32 | 0.09 | -4.30 | -0.70 | 0.08 | 0.01 | 0.07 | -0.12 | -0.19 | 0.45 | 0.00 |
| 36.00 | 0.08 | 0.02 | 0.06 | -0.30 | 0.09 | -4.37 | -0.70 | 0.08 | 0.01 | 0.07 | -0.12 | -0.18 | 0.45 | 0.00 |
| 37.00 | 0.08 | 0.02 | 0.06 | -0.29 | 0.10 | -4.45 | -0.69 | 0.08 | 0.01 | 0.07 | -0.11 | -0.17 | 0.45 | 0.00 |
| 38.00 | 0.08 | 0.02 | 0.06 | -0.27 | 0.10 | -4.52 | -0.68 | 0.08 | 0.02 | 0.07 | -0.11 | -0.16 | 0.45 | 0.00 |
| 39.00 | 0.08 | 0.03 | 0.06 | -0.25 | 0.10 | -4.58 | -0.68 | 0.08 | 0.02 | 0.07 | -0.11 | -0.15 | 0.45 | 0.00 |
| 40.00 | 0.08 | 0.03 | 0.06 | -0.23 | 0.10 | -4.64 | -0.67 | 0.08 | 0.02 | 0.07 | -0.10 | -0.14 | 0.45 | 0.00 |
Data for Figure 13 - Coordinated Cut 0% HM ZLB
| Quarter | South: Nominal Interest Rate (annualised, in percentage points) | South: Real Interest Rate (annualised, in percentage points) | South: CPI Inflation (annualised, in percentage points) | South: Output (percent) | South: Real Exchange Rate (percent) | South: Govt Debt (Share of GDP, in percentage points) | South: Govt Spend (trend GDP share) | North: Nominal Interest Rate (annualised, in percentage points) | North: Real Interest Rate (annualised, in percentage points) | North: CPI Inflation (annualised, in percentage points) | North: Output (percent) | North: Aggregate Curr Union Output (percent) | North: Govt Debt (Share of GDP, in percentage points) | North: Govt Spend (trend GDP share) |
|---|---|---|---|---|---|---|---|---|---|---|---|---|---|---|
| 0.00 | 0.00 | 0.70 | -0.45 | -1.08 | 0.00 | 0.72 | -1.00 | 0.00 | 0.70 | -0.45 | -1.08 | -1.08 | 0.72 | -1.00 |
| 1.00 | 0.00 | 0.80 | -0.70 | -1.21 | 0.00 | 0.79 | -0.99 | 0.00 | 0.80 | -0.70 | -1.21 | -1.21 | 0.79 | -0.99 |
| 2.00 | 0.00 | 0.81 | -0.80 | -1.30 | 0.00 | 0.85 | -0.98 | 0.00 | 0.81 | -0.80 | -1.30 | -1.30 | 0.85 | -0.98 |
| 3.00 | 0.00 | 0.76 | -0.81 | -1.37 | 0.00 | 0.90 | -0.97 | 0.00 | 0.76 | -0.81 | -1.37 | -1.37 | 0.90 | -0.97 |
| 4.00 | 0.00 | 0.68 | -0.76 | -1.40 | 0.00 | 0.91 | -0.96 | 0.00 | 0.68 | -0.76 | -1.40 | -1.40 | 0.91 | -0.96 |
| 5.00 | 0.00 | 0.58 | -0.68 | -1.40 | 0.00 | 0.89 | -0.95 | 0.00 | 0.58 | -0.68 | -1.40 | -1.40 | 0.89 | -0.95 |
| 6.00 | 0.00 | 0.47 | -0.58 | -1.38 | 0.00 | 0.84 | -0.94 | 0.00 | 0.47 | -0.58 | -1.38 | -1.38 | 0.84 | -0.94 |
| 7.00 | 0.00 | 0.36 | -0.47 | -1.34 | 0.00 | 0.74 | -0.93 | 0.00 | 0.36 | -0.47 | -1.34 | -1.34 | 0.74 | -0.93 |
| 8.00 | -0.01 | 0.25 | -0.36 | -1.29 | 0.00 | 0.61 | -0.92 | -0.01 | 0.25 | -0.36 | -1.29 | -1.29 | 0.61 | -0.92 |
| 9.00 | -0.22 | -0.05 | -0.26 | -1.22 | 0.00 | 0.45 | -0.91 | -0.22 | -0.05 | -0.26 | -1.22 | -1.22 | 0.45 | -0.91 |
| 10.00 | -0.40 | -0.30 | -0.17 | -1.15 | 0.00 | 0.23 | -0.90 | -0.40 | -0.30 | -0.17 | -1.15 | -1.15 | 0.23 | -0.90 |
| 11.00 | -0.46 | -0.42 | -0.10 | -1.09 | 0.00 | -0.03 | -0.90 | -0.46 | -0.42 | -0.10 | -1.09 | -1.09 | -0.03 | -0.90 |
| 12.00 | -0.45 | -0.46 | -0.04 | -1.03 | 0.00 | -0.31 | -0.89 | -0.45 | -0.46 | -0.04 | -1.03 | -1.03 | -0.31 | -0.89 |
| 13.00 | -0.40 | -0.45 | 0.01 | -0.99 | 0.00 | -0.59 | -0.88 | -0.40 | -0.45 | 0.01 | -0.99 | -0.99 | -0.59 | -0.88 |
| 14.00 | -0.33 | -0.41 | 0.05 | -0.95 | 0.00 | -0.85 | -0.87 | -0.33 | -0.41 | 0.05 | -0.95 | -0.95 | -0.85 | -0.87 |
| 15.00 | -0.26 | -0.36 | 0.08 | -0.93 | 0.00 | -1.10 | -0.86 | -0.26 | -0.36 | 0.08 | -0.93 | -0.93 | -1.10 | -0.86 |
| 16.00 | -0.19 | -0.31 | 0.10 | -0.90 | 0.00 | -1.33 | -0.85 | -0.19 | -0.31 | 0.10 | -0.90 | -0.90 | -1.33 | -0.85 |
| 17.00 | -0.13 | -0.26 | 0.12 | -0.88 | 0.00 | -1.54 | -0.84 | -0.13 | -0.26 | 0.12 | -0.88 | -0.88 | -1.54 | -0.84 |
| 18.00 | -0.07 | -0.21 | 0.13 | -0.86 | 0.00 | -1.73 | -0.83 | -0.07 | -0.21 | 0.13 | -0.86 | -0.86 | -1.73 | -0.83 |
| 19.00 | -0.03 | -0.17 | 0.14 | -0.84 | 0.00 | -1.92 | -0.83 | -0.03 | -0.17 | 0.14 | -0.84 | -0.84 | -1.92 | -0.83 |
| 20.00 | 0.01 | -0.14 | 0.14 | -0.83 | 0.00 | -2.08 | -0.82 | 0.01 | -0.14 | 0.14 | -0.83 | -0.83 | -2.08 | -0.82 |
| 21.00 | 0.04 | -0.11 | 0.15 | -0.81 | 0.00 | -2.24 | -0.81 | 0.04 | -0.11 | 0.15 | -0.81 | -0.81 | -2.24 | -0.81 |
| 22.00 | 0.07 | -0.09 | 0.15 | -0.79 | 0.00 | -2.39 | -0.80 | 0.07 | -0.09 | 0.15 | -0.79 | -0.79 | -2.39 | -0.80 |
| 23.00 | 0.09 | -0.07 | 0.15 | -0.77 | 0.00 | -2.53 | -0.79 | 0.09 | -0.07 | 0.15 | -0.77 | -0.77 | -2.53 | -0.79 |
| 24.00 | 0.10 | -0.05 | 0.15 | -0.75 | 0.00 | -2.66 | -0.79 | 0.10 | -0.05 | 0.15 | -0.75 | -0.75 | -2.66 | -0.79 |
| 25.00 | 0.12 | -0.04 | 0.16 | -0.73 | 0.00 | -2.78 | -0.78 | 0.12 | -0.04 | 0.16 | -0.73 | -0.73 | -2.78 | -0.78 |
| 26.00 | 0.13 | -0.03 | 0.16 | -0.71 | 0.00 | -2.90 | -0.77 | 0.13 | -0.03 | 0.16 | -0.71 | -0.71 | -2.90 | -0.77 |
| 27.00 | 0.14 | -0.01 | 0.16 | -0.69 | 0.00 | -3.01 | -0.76 | 0.14 | -0.01 | 0.16 | -0.69 | -0.69 | -3.01 | -0.76 |
| 28.00 | 0.15 | 0.00 | 0.16 | -0.66 | 0.00 | -3.12 | -0.75 | 0.15 | 0.00 | 0.16 | -0.66 | -0.66 | -3.12 | -0.75 |
| 29.00 | 0.16 | 0.01 | 0.16 | -0.64 | 0.00 | -3.22 | -0.75 | 0.16 | 0.01 | 0.16 | -0.64 | -0.64 | -3.22 | -0.75 |
| 30.00 | 0.17 | 0.01 | 0.16 | -0.62 | 0.00 | -3.32 | -0.74 | 0.17 | 0.01 | 0.16 | -0.62 | -0.62 | -3.32 | -0.74 |
| 31.00 | 0.18 | 0.02 | 0.16 | -0.60 | 0.00 | -3.41 | -0.73 | 0.18 | 0.02 | 0.16 | -0.60 | -0.60 | -3.41 | -0.73 |
| 32.00 | 0.19 | 0.03 | 0.16 | -0.58 | 0.00 | -3.50 | -0.72 | 0.19 | 0.03 | 0.16 | -0.58 | -0.58 | -3.50 | -0.72 |
| 33.00 | 0.19 | 0.04 | 0.16 | -0.55 | 0.00 | -3.58 | -0.72 | 0.19 | 0.04 | 0.16 | -0.55 | -0.55 | -3.58 | -0.72 |
| 34.00 | 0.20 | 0.04 | 0.15 | -0.53 | 0.00 | -3.65 | -0.71 | 0.20 | 0.04 | 0.15 | -0.53 | -0.53 | -3.65 | -0.71 |
| 35.00 | 0.20 | 0.05 | 0.15 | -0.51 | 0.00 | -3.73 | -0.70 | 0.20 | 0.05 | 0.15 | -0.51 | -0.51 | -3.73 | -0.70 |
| 36.00 | 0.20 | 0.05 | 0.15 | -0.49 | 0.00 | -3.80 | -0.70 | 0.20 | 0.05 | 0.15 | -0.49 | -0.49 | -3.80 | -0.70 |
| 37.00 | 0.20 | 0.06 | 0.15 | -0.47 | 0.00 | -3.86 | -0.69 | 0.20 | 0.06 | 0.15 | -0.47 | -0.47 | -3.86 | -0.69 |
| 38.00 | 0.21 | 0.06 | 0.14 | -0.45 | 0.00 | -3.93 | -0.68 | 0.21 | 0.06 | 0.14 | -0.45 | -0.45 | -3.93 | -0.68 |
| 39.00 | 0.21 | 0.07 | 0.14 | -0.43 | 0.00 | -3.99 | -0.68 | 0.21 | 0.07 | 0.14 | -0.43 | -0.43 | -3.99 | -0.68 |
| 40.00 | 0.21 | 0.07 | 0.14 | -0.41 | 0.00 | -4.04 | -0.67 | 0.21 | 0.07 | 0.14 | -0.41 | -0.41 | -4.04 | -0.67 |
Data for Figure 13 - Coordinated Cut 50% HM ZLB
| Quarter | South: Nominal Interest Rate (annualised, in percentage points) | South: Real Interest Rate (annualised, in percentage points) | South: CPI Inflation (annualised, in percentage points) | South: Output (percent) | South: Real Exchange Rate (percent) | South: Govt Debt (Share of GDP, in percentage points) | South: Govt Spend (trend GDP share) | North: Nominal Interest Rate (annualised, in percentage points) | North: Real Interest Rate (annualised, in percentage points) | North: CPI Inflation (annualised, in percentage points) | North: Output (percent) | North: Aggregate Curr Union Output (percent) | North: Govt Debt (Share of GDP, in percentage points) | North: Govt Spend (trend GDP share) |
|---|---|---|---|---|---|---|---|---|---|---|---|---|---|---|
| 0.00 | 0.00 | 1.49 | -0.95 | -1.56 | 0.00 | 1.21 | -1.00 | 0.00 | 1.49 | -0.95 | -1.56 | -1.56 | 1.21 | -1.00 |
| 1.00 | 0.00 | 1.75 | -1.49 | -2.01 | 0.00 | 1.73 | -0.99 | 0.00 | 1.75 | -1.49 | -2.01 | -2.01 | 1.73 | -0.99 |
| 2.00 | 0.00 | 1.81 | -1.75 | -2.36 | 0.00 | 2.24 | -0.98 | 0.00 | 1.81 | -1.75 | -2.36 | -2.36 | 2.24 | -0.98 |
| 3.00 | 0.00 | 1.74 | -1.81 | -2.61 | 0.00 | 2.71 | -0.97 | 0.00 | 1.74 | -1.81 | -2.61 | -2.61 | 2.71 | -0.97 |
| 4.00 | 0.00 | 1.59 | -1.74 | -2.78 | 0.00 | 3.10 | -0.96 | 0.00 | 1.59 | -1.74 | -2.78 | -2.78 | 3.10 | -0.96 |
| 5.00 | 0.00 | 1.38 | -1.59 | -2.85 | 0.00 | 3.40 | -0.95 | 0.00 | 1.38 | -1.59 | -2.85 | -2.85 | 3.40 | -0.95 |
| 6.00 | 0.00 | 1.15 | -1.38 | -2.86 | 0.00 | 3.61 | -0.94 | 0.00 | 1.15 | -1.38 | -2.86 | -2.86 | 3.61 | -0.94 |
| 7.00 | 0.00 | 0.91 | -1.15 | -2.81 | 0.00 | 3.72 | -0.93 | 0.00 | 0.91 | -1.15 | -2.81 | -2.81 | 3.72 | -0.93 |
| 8.00 | -0.01 | 0.66 | -0.91 | -2.70 | 0.00 | 3.73 | -0.92 | -0.01 | 0.66 | -0.91 | -2.70 | -2.70 | 3.73 | -0.92 |
| 9.00 | -0.23 | 0.23 | -0.67 | -2.56 | 0.00 | 3.66 | -0.91 | -0.23 | 0.23 | -0.67 | -2.56 | -2.56 | 3.66 | -0.91 |
| 10.00 | -0.56 | -0.28 | -0.46 | -2.39 | 0.00 | 3.48 | -0.90 | -0.56 | -0.28 | -0.46 | -2.39 | -2.39 | 3.48 | -0.90 |
| 11.00 | -0.88 | -0.76 | -0.28 | -2.23 | 0.00 | 3.19 | -0.90 | -0.88 | -0.76 | -0.28 | -2.23 | -2.23 | 3.19 | -0.90 |
| 12.00 | -0.96 | -0.97 | -0.12 | -2.07 | 0.00 | 2.81 | -0.89 | -0.96 | -0.97 | -0.12 | -2.07 | -2.07 | 2.81 | -0.89 |
| 13.00 | -0.91 | -1.02 | 0.01 | -1.94 | 0.00 | 2.40 | -0.88 | -0.91 | -1.02 | 0.01 | -1.94 | -1.94 | 2.40 | -0.88 |
| 14.00 | -0.78 | -0.97 | 0.11 | -1.83 | 0.00 | 2.00 | -0.87 | -0.78 | -0.97 | 0.11 | -1.83 | -1.83 | 2.00 | -0.87 |
| 15.00 | -0.63 | -0.87 | 0.18 | -1.74 | 0.00 | 1.62 | -0.86 | -0.63 | -0.87 | 0.18 | -1.74 | -1.74 | 1.62 | -0.86 |
| 16.00 | -0.46 | -0.75 | 0.24 | -1.67 | 0.00 | 1.27 | -0.85 | -0.46 | -0.75 | 0.24 | -1.67 | -1.67 | 1.27 | -0.85 |
| 17.00 | -0.31 | -0.62 | 0.28 | -1.61 | 0.00 | 0.96 | -0.84 | -0.31 | -0.62 | 0.28 | -1.61 | -1.61 | 0.96 | -0.84 |
| 18.00 | -0.18 | -0.51 | 0.31 | -1.56 | 0.00 | 0.69 | -0.83 | -0.18 | -0.51 | 0.31 | -1.56 | -1.56 | 0.69 | -0.83 |
| 19.00 | -0.07 | -0.41 | 0.33 | -1.51 | 0.00 | 0.44 | -0.83 | -0.07 | -0.41 | 0.33 | -1.51 | -1.51 | 0.44 | -0.83 |
| 20.00 | 0.03 | -0.33 | 0.34 | -1.47 | 0.00 | 0.22 | -0.82 | 0.03 | -0.33 | 0.34 | -1.47 | -1.47 | 0.22 | -0.82 |
| 21.00 | 0.10 | -0.26 | 0.35 | -1.43 | 0.00 | 0.01 | -0.81 | 0.10 | -0.26 | 0.35 | -1.43 | -1.43 | 0.01 | -0.81 |
| 22.00 | 0.16 | -0.20 | 0.36 | -1.39 | 0.00 | -0.17 | -0.80 | 0.16 | -0.20 | 0.36 | -1.39 | -1.39 | -0.17 | -0.80 |
| 23.00 | 0.21 | -0.15 | 0.36 | -1.35 | 0.00 | -0.34 | -0.79 | 0.21 | -0.15 | 0.36 | -1.35 | -1.35 | -0.34 | -0.79 |
| 24.00 | 0.25 | -0.11 | 0.36 | -1.31 | 0.00 | -0.49 | -0.79 | 0.25 | -0.11 | 0.36 | -1.31 | -1.31 | -0.49 | -0.79 |
| 25.00 | 0.29 | -0.08 | 0.37 | -1.27 | 0.00 | -0.64 | -0.78 | 0.29 | -0.08 | 0.37 | -1.27 | -1.27 | -0.64 | -0.78 |
| 26.00 | 0.32 | -0.05 | 0.37 | -1.22 | 0.00 | -0.78 | -0.77 | 0.32 | -0.05 | 0.37 | -1.22 | -1.22 | -0.78 | -0.77 |
| 27.00 | 0.34 | -0.02 | 0.37 | -1.18 | 0.00 | -0.90 | -0.76 | 0.34 | -0.02 | 0.37 | -1.18 | -1.18 | -0.90 | -0.76 |
| 28.00 | 0.36 | 0.00 | 0.36 | -1.14 | 0.00 | -1.03 | -0.75 | 0.36 | 0.00 | 0.36 | -1.14 | -1.14 | -1.03 | -0.75 |
| 29.00 | 0.38 | 0.02 | 0.36 | -1.09 | 0.00 | -1.14 | -0.75 | 0.38 | 0.02 | 0.36 | -1.09 | -1.09 | -1.14 | -0.75 |
| 30.00 | 0.40 | 0.04 | 0.36 | -1.05 | 0.00 | -1.25 | -0.74 | 0.40 | 0.04 | 0.36 | -1.05 | -1.05 | -1.25 | -0.74 |
| 31.00 | 0.41 | 0.05 | 0.36 | -1.01 | 0.00 | -1.35 | -0.73 | 0.41 | 0.05 | 0.36 | -1.01 | -1.01 | -1.35 | -0.73 |
| 32.00 | 0.42 | 0.07 | 0.36 | -0.97 | 0.00 | -1.45 | -0.72 | 0.42 | 0.07 | 0.36 | -0.97 | -0.97 | -1.45 | -0.72 |
| 33.00 | 0.43 | 0.08 | 0.35 | -0.93 | 0.00 | -1.54 | -0.72 | 0.43 | 0.08 | 0.35 | -0.93 | -0.93 | -1.54 | -0.72 |
| 34.00 | 0.44 | 0.10 | 0.35 | -0.89 | 0.00 | -1.63 | -0.71 | 0.44 | 0.10 | 0.35 | -0.89 | -0.89 | -1.63 | -0.71 |
| 35.00 | 0.45 | 0.11 | 0.34 | -0.85 | 0.00 | -1.71 | -0.70 | 0.45 | 0.11 | 0.34 | -0.85 | -0.85 | -1.71 | -0.70 |
| 36.00 | 0.45 | 0.12 | 0.34 | -0.81 | 0.00 | -1.79 | -0.70 | 0.45 | 0.12 | 0.34 | -0.81 | -0.81 | -1.79 | -0.70 |
| 37.00 | 0.45 | 0.13 | 0.33 | -0.77 | 0.00 | -1.87 | -0.69 | 0.45 | 0.13 | 0.33 | -0.77 | -0.77 | -1.87 | -0.69 |
| 38.00 | 0.46 | 0.13 | 0.33 | -0.74 | 0.00 | -1.94 | -0.68 | 0.46 | 0.13 | 0.33 | -0.74 | -0.74 | -1.94 | -0.68 |
| 39.00 | 0.46 | 0.14 | 0.32 | -0.70 | 0.00 | -2.01 | -0.68 | 0.46 | 0.14 | 0.32 | -0.70 | -0.70 | -2.01 | -0.68 |
| 40.00 | 0.45 | 0.15 | 0.32 | -0.67 | 0.00 | -2.08 | -0.67 | 0.45 | 0.15 | 0.32 | -0.67 | -0.67 | -2.08 | -0.67 |
Footnotes
** This paper was prepared for the NBER's International Seminar on Macroeconomics (ISOM) Conference in Amsterdam on June 18-19, 2010. We would like to thank our discussants Bianca De Paoli and Hans-Helmut Kotz for very helpful comments. Comments by other conference participants and by seminar participants at the National Bank of Belgium, Sveriges Riksbank, IMF research department, Federal Reserve Bank of Richmond, MONFISPOL workshop at the London Metropolitan University and the Federal Reserve Bank of Chicago were also helpful. The authors are particularly grateful to Raymond Zhong for outstanding research assistance. The views expressed in this paper are solely the responsibility of the authors and should not be interpreted as reflecting the views of the Board of Governors of the Federal Reserve System or of any other person associated with the Federal Reserve System. Return to text
*** Corresponding Author: Telephone: 202-452-2575. Fax: 202-263-4850 E-mail addresses: [email protected] and [email protected] Return to text
1. Eggertsson (2008), Eggertsson (2009), and Christiano, Eichenbaum, and Rebelo (2009) argue that the fiscal multiplier is likely to be very large in a liquidity trap; Cogan et al (2009) offer a contrasting view. Return to text
2. We define
![]() to be the price in period
to be the price in period
![]() of a claim that pays one dollar if the
specified state occurs in period
of a claim that pays one dollar if the
specified state occurs in period ![]() (see the household
problem below); then the corresponding element of
(see the household
problem below); then the corresponding element of ![]() equals
equals ![]() divided
by the probability that the specified state will occur.
Return to text
divided
by the probability that the specified state will occur.
Return to text
3. Notice that the final investment good is not used by the government. Return to text
4. These contingent claims are in zero net supply from the standpoint of the South as a whole; hence, we omit them from the budget constraint for expositional simplicity. Return to text
5. We refer to Bernanke, Gertler and Gilchrist (1999) and Christiano, Motto and Rostagno (2008) for further details. An excellent exposition is also provided in Christiano, Trabandt and Walentin (2007). Return to text
This version is optimized for use by screen readers. Descriptions for all mathematical expressions are provided in LaTex format. A printable pdf version is available. Return to text