
Board of Governors of the Federal Reserve System
International Finance Discussion Papers
Number 1033, Novemeber 2011 --- Screen Reader
Version*
The Growth of Chinese Exports: An Examination of the Detailed Trade Data
NOTE: International Finance Discussion Papers are preliminary materials circulated to stimulate discussion and critical comment. References in publications to International Finance Discussion Papers (other than an acknowledgment that the writer has had access to unpublished material) should be cleared with the author or authors. Recent IFDPs are available on the Web at http://www.federalreserve.gov/pubs/ifdp/. This paper can be downloaded without charge from the Social Science Research Network electronic library at http://www.ssrn.com/.
Abstract:
Over the past decade, Chinese exports have
boomed, increasing far faster than GDP growth. What can account for
this explosion? Our paper uses finely detailed Chinese export data
(8-digit HS codes) combined with U.S. trade data to explore this
question. Although exchange rate policy clearly boosted the trade
surplus, and the structure of the economy, e.g. abundant cheap
labor, encouraged investment, these alone cannot account for the
changing composition and acceleration of exports. We find that the
growth in exports is most likely a product of effective Chinese
industrial policy and fortuitous timing. The detailed trade data
reveal that key "new" technology goods, such as cell phones, LCD
screens, and laptops played a critical role.
Finally, we use the data to examine the relationship between
Chinese exports and global manufacturing, in particular U.S.
manufacturing employment. We find that increased Chinese
competition in both domestic and U.S. export markets likely lowered
U.S. manufacturing employment between 2000 and 2007. Chinese policy
is not, however, wholly responsible. Some job losses, such as in
textile production, were no doubt the result of China's natural
comparative advantages, while other U.S. job losses are
attributable to relatively low investment and slow GDP growth in
the United States following the 2001 recession.
Keywords: China, trade, manufacturing
JEL classification: F12, F40, E65
Introduction
Between 2000 and 2007, the value of Chinese exports more than quadrupled and rose from 20 percent to 35 percent of GDP (Figure 1). Imports failed to keep pace and the Chinese economy became more dependent on external demand; the current account surplus, mirroring the trade surplus, ballooned from less than 2 percent of GDP to a peak of 10 percent.
Figure 1: Chinese Export Boom
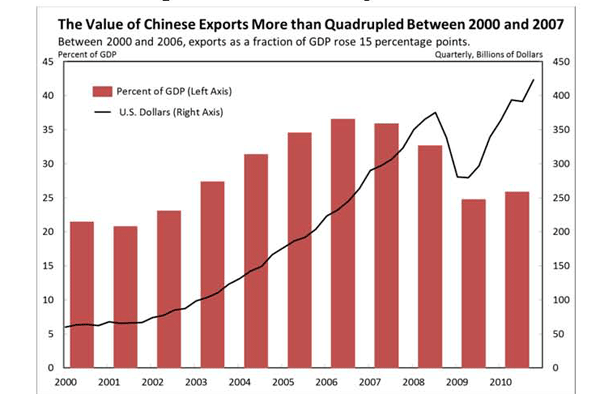
Source: China National Bureau of Statistics.
Data for Figure 1
| Time | Exports Quarterly, Billion $ |
|---|---|
| 0:01 | 59804.86 |
| 0:02 | 63182.35 |
| 0:03 | 63823.05 |
| 0:04 | 62534.41 |
| 1:01 | 67710.71 |
| 1:02 | 65894.01 |
| 1:03 | 66202.22 |
| 1:04 | 66882.95 |
| 2:01 | 74111.75 |
| 2:02 | 77400.34 |
| 2:03 | 85403.47 |
| 2:04 | 87519.95 |
| 3:01 | 98337.11 |
| 3:02 | 103762.82 |
| 3:03 | 110953.79 |
| 3:04 | 122926.67 |
| 4:01 | 131206.11 |
| 4:02 | 142344.51 |
| 4:03 | 149407.97 |
| 4:04 | 166712.74 |
| 5:01 | 176630.41 |
| 5:02 | 186619.55 |
| 5:03 | 192136.8 |
| 5:04 | 203507.17 |
| 6:01 | 223304.19 |
| 6:02 | 232396.32 |
| 6:03 | 245202.44 |
| 6:04 | 263172.21 |
| 7:01 | 290363.26 |
| 7:02 | 297629.51 |
| 7:03 | 306694.46 |
| 7:04 | 323074.17 |
| 8:01 | 350119.29 |
| 8:02 | 365385.17 |
| 8:03 | 375388.34 |
| 8:04 | 338422.86 |
| 9:01 | 280475.5 |
| 9:02 | 279343.35 |
| 9:03 | 296751.15 |
| 9:04 | 338958.53 |
| 10:01 | 364255.76 |
| 10:02 | 393463.73 |
| 10:03 | 391769.17 |
| 10:04 | 423294.6 |
| 11:01 | 455630.17 |
| 11:02 | 480655.36 |
Data for Figure 1 cont'd
| Year | Percent of GDP |
|---|---|
| 2000 | 20.8 |
| 2001 | 20.1 |
| 2002 | 22.4 |
| 2003 | 26.7 |
| 2004 | 30.7 |
| 2005 | 33.9 |
| 2006 | 35.9 |
| 2007 | 35.2 |
| 2008 | 32 |
| 2009 | 24.1 |
| 2010 | 25.2 |
Although other economies have had success utilizing an export-led growth strategy, such success in a country of China's size is unprecedented. In 2009, China became the largest global exporter and in 2010 passed Japan as the second largest economy in the world.1 How was China able to accomplish this goal? In this paper, we use finely detailed trade data to differentiate amongst the various reasons given for China's rapid growth of exports. The reasons for China's success also shed light on the effects China's export boom have had on the manufacturing sectors of other countries.
The data make clear that no one story, such as an undervalued exchange rate, can explain the surge in growth, as the growth was concentrated in specific sectors--textiles/apparel/furniture, metals (steel), and machinery--and within the machinery sector, growth was highly concentrated in specific products. Thus to answer the question of why exports boomed, one must answer why these particular sectors and products experienced outsized growth relative to others.
Textile and apparel producers benefited from the expiration of restrictive trade agreements, and these sectors along with furniture producers were also disproportionately aided by China's entry into the World Trade Organization, which allowed the country to take greater advantage of its vast pool of low-skill labor. Heavy industry, such as steel production, benefited from energy and capital subsidies, as well as from reform of state-owned-enterprises (SOEs), whose new profitability translated into a rapid expansion of capacity.
A key contribution of this paper is to shed some light on machinery exports. Aggregate trade data show that machinery exports accounted for almost half of Chinese export growth between 2000 and 2007. This has been cited by some as evidence of Chinese mercantilism, under the assumption that a developing country is unlikely to be an exporter of capital goods without official support. However, the highly disaggregated Chinese trade data, compiled by hand for this paper, show that the growth of Chinese machinery exports was concentrated in a few specific high-tech goods--cell phones, LCD displays, laptops, and integrated electronic circuits--not the prototypical examples of capital goods.
Although, we attribute some of the success of Chinese high-tech exports to industry-specific supports, such as the establishment of science parks, China's export boom likely would not have been achievable without a healthy dose of good luck in terms of timing. Global demand skyrocketed over this period for products based on these technologies, and Chinese producers were particularly well placed to take advantage: China's own domestic market became a key source of demand; labor costs in neighboring high-tech producers were on the rise; and, investment in the West, particularly in the high-tech sector, was severely impaired from the 2001 recession.
As Chinese exports surged, we find that China's gains in global manufacturing came primarily at the expense of advanced economies, with the U.S. share falling the most. As part of our examination of the effect on the United States, we look at manufacturing employment and conclude that the rise in Chinese exports led to some employment losses in certain sectors, but subpar GDP growth and investment were the principal factors behind the lack of a rebound in manufacturing employment following the 2001 recession.
The welfare implications for the United States of the increase in Chinese exports is beyond the scope of this paper, but it is important to note that it is not at all clear that the costs outweighed the benefits. The cost in loss of jobs is obvious, but the benefits included lower prices, more rapid adoption of new technology, and efficiency gains from the removal of trade barriers and through increased competition.
The paper is organized in 4 sections. Section 1 gives some background on the evolution of the Chinese economy and the factors that led to the boom in exports. This section examines Chinese exports at the readily-available 2-digit level of the Harmonized Commodity Description and Coding System (HS), which has been adopted by most countries. Section 2 uses 8-digit HS codes to delve further into the details of Chinese trade. Section 3 examines other countries' manufacturing sectors over the period, with a focus on the United States. Section 4 speculates on the implications of our research for the prospects of future Chinese export growth following the 2009 financial crisis. Section 5 concludes.
Section 1: The Growth of Chinese Exports: An Initial Look
In the three decades since economic reforms were enacted in the late 1970s, China has experienced a remarkable period of consistently robust economic growth, with real GDP increasing 23-fold since 1977. The composition of growth, however, has evolved away from consumption over this period. Household consumption fell from an already low 50 percent of GDP in the early 1980s to around 35 percent by the mid-2000s as investment soared and the economy became more export-oriented. This process accelerated significantly at the start of the new millennium. In 2000, China's exports, measured in dollars, were a third of those of the United States and around half of those of Japan and Germany. By 2009, China had become the largest exporter in the world.
Figure 2 sets the stage by showing, even at a fairly aggregated level, that Chinese exports growth was relatively concentrated in a few sectors. This growth was dominated first and foremost by machinery exports (HS categories 84 and 85), which accounted for about 45 percent of export growth. Textiles/furniture and metals accounted for 15 percent and 11 percent, respectively. The rest of this section examines each of the major categories of Chinese export growth.
Figure 2: China's Export Growth is Concentrated in a Few Sectors
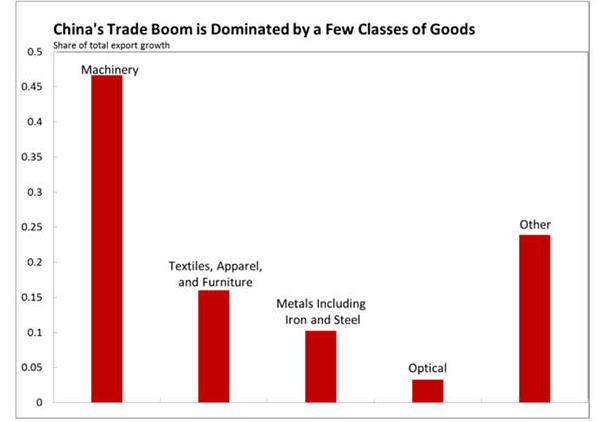
Source: China Customs (from CEIC) and U.S. Census Bureau.
Data for Figure 2
| Classes of Goods | Share of total export growth |
|---|---|
| Machinery Exports | 0.466687063 |
| Textiles, Apparel, and Furniture | 0.159709922 |
| Metals including Iron and Steel | 0.102228759 |
| Optical | 0.032469496 |
| Other | 0.23890476 |
Textile, Apparel, and Furniture Exports2
These categories of exports grew 220 percent from 2001 through 2007. No doubt, trade policy was a primary cause. Prior to China's entry into the World Trade Organization (WTO) in December 2001, China faced prohibitive tariffs and constraining quotas in textile/apparel and furniture markets. The production of these goods is intensive in low-skilled labor, an area in which China has an obvious natural comparative advantage.
Until 2005, Chinese exports of apparel and textiles were limited by a series of gradually less constraining multilateral agreements--the Multifiber Arrangement (MFA, through 1995) and subsequently the Agreement on Textiles and Clothing (ATC). Without these agreements, China's enormous supply of cheap labor likely would have led to a much larger share of the global market earlier. Indeed, Brambilla et al. (2009) found that China was constrained more than any other nation by these agreements. Consequently, when the MFA expired, textile and apparel export growth from China rose rapidly, and surged further with the expiration of the ATC. As China gained market share, exports from most other regions declined.
Figure 3: U.S. Furniture Imports (HS 94)
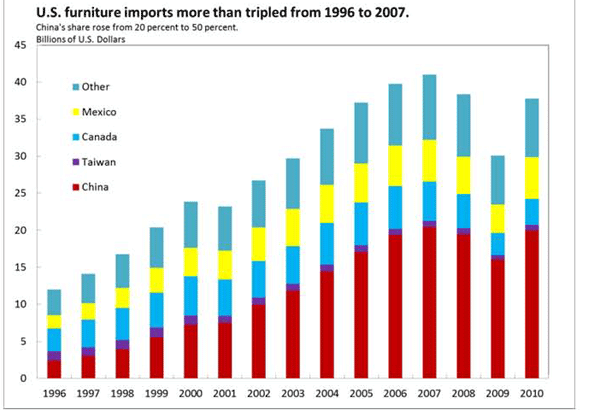
Source: U.S. International Trade Commission Dataweb.
Data for Figure 3
| Year | China | Taiwan | Canada | Mexico | Other |
|---|---|---|---|---|---|
| 1996 | 2.394781 | 1.259651 | 3.093568 | 1.778585 | 3.484692 |
| 1997 | 2.994361 | 1.205244 | 3.699993 | 2.237911 | 3.944428 |
| 1998 | 3.946958 | 1.233536 | 4.333574 | 2.698236 | 4.54293 |
| 1999 | 5.547166 | 1.277087 | 4.727628 | 3.335813 | 5.483141 |
| 2000 | 7.201921 | 1.277796 | 5.313094 | 3.820727 | 6.21266 |
| 2001 | 7.492034 | 0.94168 | 4.914405 | 3.913841 | 5.955039 |
| 2002 | 9.920731 | 0.973196 | 4.947011 | 4.543167 | 6.319155 |
| 2003 | 11.81832 | 0.924008 | 5.085464 | 5.058032 | 6.774231 |
| 2004 | 14.41745 | 0.929774 | 5.611296 | 5.146621 | 7.601129 |
| 2005 | 17.04463 | 0.871582 | 5.79402 | 5.263243 | 8.219429 |
| 2006 | 19.35052 | 0.825852 | 5.772521 | 5.485931 | 8.315633 |
| 2007 | 20.40398 | 0.816332 | 5.30673 | 5.669807 | 8.780581 |
| 2008 | 19.47237 | 0.821888 | 4.586011 | 5.042292 | 8.413911 |
| 2009 | 16.0419 | 0.61136 | 2.959485 | 3.852934 | 6.598356 |
| 2010 | 19.93536 | 0.776305 | 3.502966 | 5.641443 | 7.88546 |
Chinese furniture exports (HS 94), began to increase rapidly back in the early 1990s and accelerated in the 2000s. Some of this production was shifted from Taiwan, which accounted for a large share of global furniture exports in the early 1990s. By 2007, Taiwan's share of U.S. furniture imports had fallen to 2 percent and China was by far the largest source.
Metals3
By 2000, China was already the largest producer of steel, but output was only 25 percent higher than either Japan or the United States (Figure 4). But by 2009, China was producing 6½ times more steel than second place Japan and almost 10 times more than the United States, each of whom have experienced large declines in steel production since the beginning of decade.4 Overall, Chinese metals exports grew 630 percent from 2001 through 2007. Why would a developing country with an enormous supply of labor experience some of its greatest export growth in a capital and energy intensive industry?
Figure 4: Global Steel Production
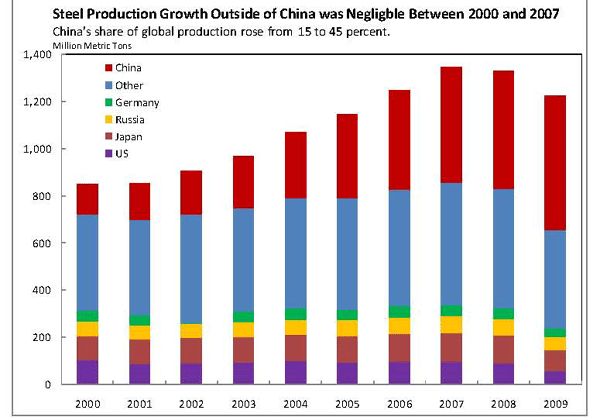
Source: Steel Statistics Yearbook 2010.
Data for Figure 4
| Year | US | China | Japan | Russia | Germany | Other | South Korea | India | Brazil | Ukraine | Italy | Other |
|---|---|---|---|---|---|---|---|---|---|---|---|---|
| 2000 | 101.803 | 128.5 | 106.444 | 59.136 | 46.376 | 406.675 | 43.107 | 26.924 | 27.865 | 31.767 | 26.759 | 250.253 |
| 2001 | 90.104 | 151.634 | 102.866 | 58.97 | 44.803 | 402.696 | 43.852 | 27.291 | 26.717 | 33.108 | 26.545 | 245.183 |
| 2002 | 91.587 | 182.366 | 107.745 | 59.777 | 4.515 | 458.18 | 45.39 | 28.814 | 29.604 | 3.45 | 2.666 | 348.256 |
| 2003 | 93.677 | 222.336 | 110.511 | 61.45 | 44.809 | 437.132 | 46.31 | 31.779 | 31.147 | 36.932 | 2.758 | 288.206 |
| 2004 | 99.681 | 282.911 | 112.718 | 65.583 | 46.374 | 464.241 | 47.521 | 32.626 | 32.909 | 38.738 | 28.604 | 283.843 |
| 2005 | 94.897 | 353.24 | 112.471 | 66.146 | 44.524 | 472.813 | 47.82 | 45.78 | 21.61 | 38.641 | 29.35 | 289.612 |
| 2006 | 98.557 | 419.149 | 116.226 | 70.83 | 47.224 | 495.192 | 48.455 | 49.45 | 30.901 | 40.891 | 31.624 | 293.871 |
| 2007 | 98.102 | 489.288 | 120.203 | 72.387 | 48.55 | 517.6 | 51.517 | 53.468 | 33.782 | 42.83 | 31.553 | 304.45 |
| 2008 | 91.35 | 500.312 | 118.739 | 68.51 | 45.833 | 504.277 | 53.625 | 57.791 | 33.716 | 37.279 | 30.59 | 291.276 |
| 2009 | 58.196 | 567.842 | 87.534 | 60.011 | 32.67 | 417.771 | 48.572 | 62.838 | 26.506 | 29.855 | 19.848 | 284.152 |
First, energy prices were heavily managed by the government and significantly subsidized. As the 2006 U.S. Manufacturing Energy Consumption survey confirms, steel and aluminum production are among the largest industrial energy consumers in terms of energy per dollar of value added.5 Second, the cost of capital for SOEs, which dominate China's heavy industry, was extremely low. SOEs had ready access to bank borrowing at low interest rates because of implicit government backing. Third, the SOEs made substantial strides in improving efficiency and lowering costs. Hsieh and Klenow (2009) estimate that improvements in resource allocation account for about 2 percentage points per year of Chinese total factor productivity growth between 1998 and 2005.
Reform of the SOEs began in the mid-1990s and dismantled the "iron rice bowl," the system of housing, pensions, and health care that accompanied SOE employment. As a result, the SOEs, which were money-losers in the decades prior to reform, began earning substantial profits for the first time. Since SOEs did not pay dividends to the government, they piled up retained earnings and generally had few options but to reinvest the earnings in expanding capacity. This fed a circle in which profits led to greater capacity and still greater profits. From 1995 to 2000, China's steel industry averaged $400 million in annual operating profits and crude steel production rose at an average pace of 6 percent per year. Beginning in 2000, profits and production began to rise rapidly in tandem--profits climbed from $2 billion in 2001 to more than $21 billion in 2007, and crude steel production rose at an average annual rate of 25 percent. Given the incentive structure, i.e. subsidized inputs and political approval of output growth, this reinvestment was optimal from the perspective of Chinese steel producers. Domestic demand could not absorb this massive production growth and China went from being a net importer of steel, as late as 2004, to the largest net exporter in the world.
Machinery6
This category of exports grew 520 percent from 2001 through 2007 and, as noted earlier, accounted for roughly 45 percent of China's total export growth. A wide range of economists have attributed much of these gains to China's most visible trade policy, its exchange rate regime. For much of the decade, the renminbi was pegged to the U.S. dollar, and, as evidenced by China's massive accumulation of foreign exchange reserves, authorities have intervened heavily to keep it from appreciating. But the detailed trade data, discussed in the next section, indicate that this was likely not the primary factor in the growth of China's machinery exports as growth was concentrated in a few select products, whereas the exchange rate would be expected to have a broader effect by lowering the prices of Chinese goods generally.
Section 2: Machinery Exports: The Devil in the Details7
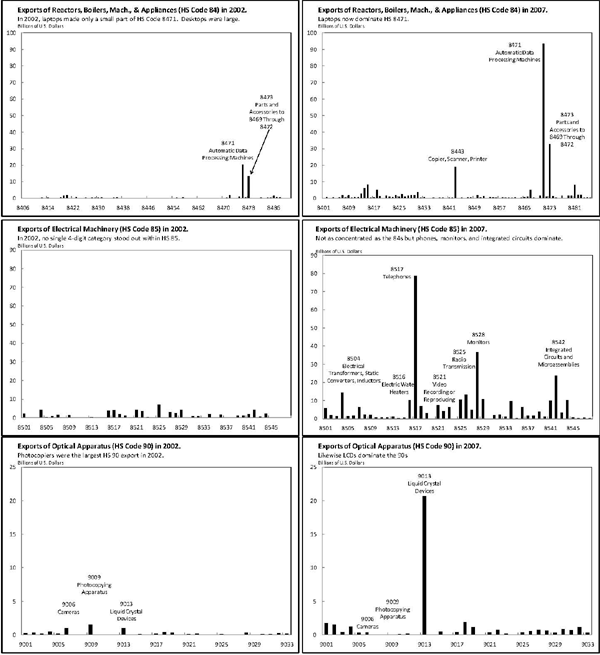
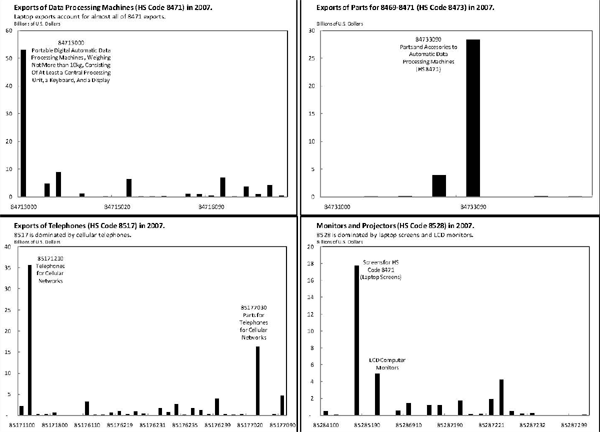
In order to understand the growth of Chinese machinery exports, we now turn to the detailed trade data. Figure 5 shows exports of the machinery categories and the optical category (HS 90) at the 4-digit level; on the left is data for 2002 and on the right is data for 2007. As the figure illustrates, growth in the machinery categories was highly concentrated in high-tech goods. Digging even deeper, the 8-digit categories, shown in Figure 6, reveal that the growth of machinery exports was dominated by four products--cell phones, liquid crystal displays (LCDs), integrated electronic circuits, and laptops--which together accounted for more than a third of the growth.
This concentration of export growth argues against China's exchange rate regime playing the major role. The exchange rate should have a more-or-less even handed influence across China's export industries, as all goods are made relatively cheaper, and therefore it is not a plausible explanation for the outsized growth of particular categories. Instead, the influence of the exchange rate can perhaps best be seen in the wide range of smaller bars in Figure 4. Most subcategories of machinery exports increased significantly over the period, but their growth was dwarfed by a few categories for which we have special stories. For this reason, we believe papers that explain Chinese trade using more aggregated data, such as Ahmed (2010), Marquez and Schindler (2007), and Thorbecke and Smith (2010) likely overestimate the importance of the exchange rate. But even using the relatively high elasticities common in the literature, the exchange rate would still account for only a minority of machinery export growth over the period. For example, assuming the renminbi became 30 percentage points more undervalued from 2001 to 2007 and the elasticity of Chinese exports was 1½, then the exchange rate would have accounted for less than 10 percent of machinery export growth.
For laptops, cell phones, LCDs, and integrated electronic circuits, China became the dominant global manufacturer and exporter because these products share characteristics that turned out to favor China. First, they are by-and-large "new" products. Though laptops and cell phones have been around for more than twenty years, each succeeding generation incorporates new technologies and production methods. Hence, there was an opportunity for new participants to enter the market and the need for established participants to open new facilities. Second, these products require large capital investments which were likely a barrier to entry for many firms. In particular, high-tech firms in the United States, reeling from the dot-com bust and a capital overhang, were not well positioned to invest. In contrast, Chinese firms and other Asian firms, several years removed from the Asian financial crisis, were better positioned. Third, existing production of related technologies was dominated by Japan and China's newly industrialized neighbors, such as Taiwan and Korea, which had historically dominated China's foreign direct investment and where labor costs were rising. Fourth, there was an explosion in global demand for these products which came to dominate their broader market categories--computers, phones, televisions and computer monitors. Fifth, the leader in the booming global demand for these products was China's own domestic market, where urban disposable income more than doubled between 2001 and 2007.
Figure 5: Within 4 and 8 Digit HS Categories Exports are even more Concentrated
Source: China Customs Statistical Yearbooks, 2002 and 2007.
Figure 6: A Glance at the 8-Digit Data
Source: China Customs Statistical Yearbooks, 2002 and 2007.
Reactors, Boilers, Machinery and Appliances (HS 84)
Returning to Figure 5, the top two panels show the 4-digit subcategories of HS 84 in 2002 and 2007, respectively. The top-left panel looks empty using the scale needed to show the 2007 data, shown to the right. Growth in computers (HS 8471) and associated parts (HS 8473) dominate, accounting for 52 percent of the total growth in HS 84.
These two categories were the largest in 2002 as well, but the composition of the computers making up the categories changed drastically over the period. Portable computers (i.e. laptops) made rapid gains in market share, relative to the traditional desktop computer, over the past decade. In 2002, laptops accounted for 7 percent of HS 8471 exports. By 2007, its share had surged to 42 percent. As shown in the upper left panel of Figure 6, portable computers (HS 84713000) were by far the largest subcategory of HS 8471. Similarly, parts and accessories for HS 8471 (HS 8473090) were the largest subcategory of HS 8473 (top right panel).
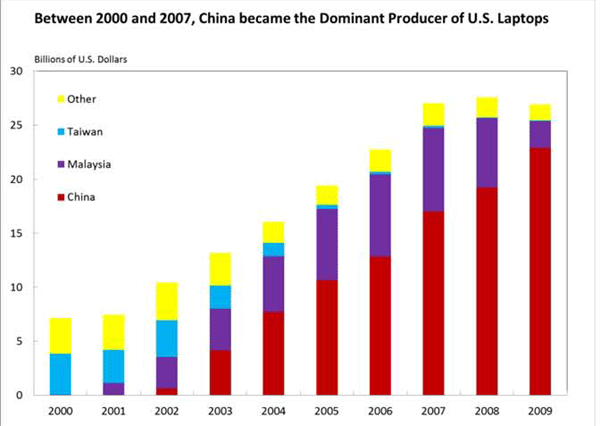
Figure 7: U.S. Imports of Laptops
Source: U.S. International Trade Commission Dataweb.
Data for Figure 7
| Country | 2000 | 2001 | 2002 | 2003 | 2004 | 2005 | 2006 | 2007 | 2008 | 2009 |
|---|---|---|---|---|---|---|---|---|---|---|
| China | 0.011062 | 0.022508 | 0.632162 | 4.158253 | 7.715796 | 10.67033 | 12.82771 | 17.00183 | 19.23541 | 22.90866 |
| Malaysia | 0.049354 | 1.08938 | 2.911701 | 3.851358 | 5.148499 | 6.580771 | 7.631719 | 7.767681 | 6.408913 | 2.46151 |
| Taiwan | 3.796062 | 3.068483 | 3.40782 | 2.165675 | 1.243289 | 0.371999 | 0.230243 | 0.186617 | 0.096789 | 0.102735 |
| Other | 3.262 | 3.258 | 3.49 | 3.01 | 1.927 | 1.798 | 2.062 | 2.094 | 1.862 | 1.452 |
From 2000 to 2007, during China's export boom, global shipments of personal computers grew 105 percent, with laptops accounting for 47 percentage points of the growth.8 In 2009, portable computers were estimated to have accounted for the majority of computer shipments for the first time.9 At the same time, China became the largest producer of laptops, surpassing Taiwan, which had accounted for 64 percent of global laptop production in 2002.10
The surge in Chinese exports of laptops was not primarily a case of mainland production displacing other producers, but this was part of the story. Figure 7 shows U.S. imports of laptops by country of origin and reflects the move away from Taiwanese production of laptops to the mainland. In 2000, Taiwan accounted for more than 50 percent of U.S. laptop imports, whereas China accounted for less than ¼ percent. By 2007, China accounted for 63 percent of U.S. imports of laptops, and by 2009 it accounted for 85 percent. Indeed, since 2007, Malaysia and China have accounted for more than 90 percent of U.S. imports of laptops. Nevertheless, through 2007, the value of non-Chinese imports actually increased as the overall market for laptops expanded more rapidly than Chinese imports. Given the price declines in portable computers over this period, real shipments grew much faster still. According to China's National Bureau of Statistics (NBS), Chinese production of microcomputers increased from 7 million units in 2000 to 143 million units in 2007.
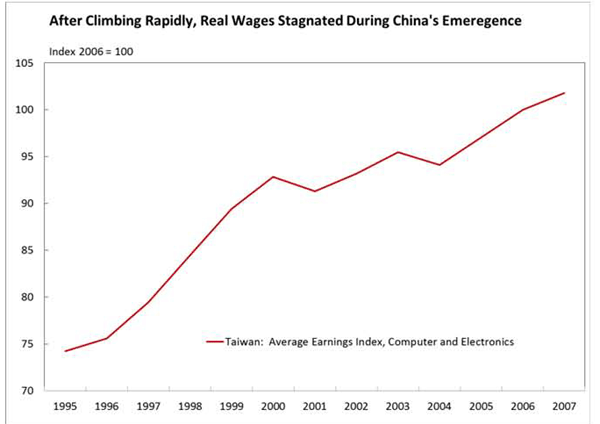
Government polices helped nurture domestic capabilities in consumer electronics and other advanced areas that would most likely not have developed in their absence (Rodrick (2006)). China's laptop industry, for example, was aided by the creation of "science parks," the development of which have been instrumental in the surge of Chinese high-tech exports generally. Although these parks were originally formed to promote indigenous innovation, they evolved to depend more on foreign investment and technology transfer. As noted in Sutherland (2005), in 2000, the Ministry of Science and Technology and Ministry of Foreign Trade approved a trial for about a third of the parks to become "high-technology export bases." Now, all of the parks have a bias toward this type of production. Foreign investment is drawn to these parks in particular by preferential tax policies. In addition, cheaper labor was a draw for high-tech investment, as in the case for Taiwanese laptop producers. As shown in Figure 8, between 1995 and 2000, Taiwanese labor costs in computer, electronic, and optical manufacturing rose by more than a third. As high-tech production moved to the mainland, wage growth in Taiwan slowed. Foreign firms were also drawn to China because of the potentially huge domestic market. The Chinese market soared from 21 million personal computers in use at the end of 2000 to 86 million in 2007, second to only the United States.11
Chinese laptop exports illustrate one of the primary points of Amiti and Freund (2010), the only other paper we are aware of that used detailed Chinese Customs statistics. Using 6 and 8-digit HS codes, they concluded that Chinese export growth was mainly accounted for by growth in trade of existing products. Laptops were an existing product, with the first laptop computers manufactured in the early 1980s. However, new technology for producing LCD screens, new integrated electronic circuits, along with the widespread adoption of wireless technology, moved the laptop from a business-only luxury to a household consumable. In this sense, laptops were a new good in the 2000s.
Figure 8: Rising Wages in Taiwan Led Production to Shift to China
Source: CEIC.
Data for Figure 8
| Year | Earning Index |
|---|---|
| 1995 | 74.20448 |
| 1996 | 75.58524 |
| 1997 | 79.43853 |
| 1998 | 84.43927 |
| 1999 | 89.42567 |
| 2000 | 92.83054 |
| 2001 | 91.29733 |
| 2002 | 93.16378 |
| 2003 | 95.44944 |
| 2004 | 94.09004 |
| 2005 | 97.04502 |
| 2006 | 100 |
| 2007 | 101.8078 |
Electrical Machinery (HS 85)
Electrical machinery exports (HS 85, the middle panels of Figure 5) also grew as the result of new goods. The growth is not quite as concentrated as in HS 84, but it is still dominated by three product categories, phones (HS 8517), monitors and televisions (HS 8528), and integrated electronic circuits (HS 8542). Moreover, the 8-digit data (bottom panels of Figure 6) show that the growth in these categories was also almost wholly accounted for by cell phones, liquid crystal displays (LCDs), and microprocessors and memory. LCD technology also accounted for the majority of the surge in the optical apparatus (HS 90) category (the bottom panels of Figure 5). As was the case with laptops transforming the computer market, cell phones and LCDs revolutionized the telephone, television, and computer monitor markets.
Cell Phones
Like for laptops, soaring global and domestic demand fueled China's rise in cell phone production and exports. Global cell phone users rose from about 750 million in 2000 to roughly 4 billion in 2008.12 Chinese mobile phone subscriptions rose from 85 million in 2000 to around 550 million in 2007 and 750 million in 2009, the largest market in the world. Led by Motorola, all of the major multinational cell phone manufacturers transferred at least some, and in some cases all, of their handset production to China.13 Although initially dominated by these firms, Chinese companies are gaining market share both at home and abroad. U.S. trade data reflects the growth of the global market and China's market share. U.S. imports of telephone sets rose from $12 billion in 2001 to $55 billion in 2007, with China's share rising from 12 percent to 38 percent (Figure 9). Of this 2007 total, $28 billion were imports of cell phones with China accounting for half of these.
Figure 9: U.S. Imports of Phones14
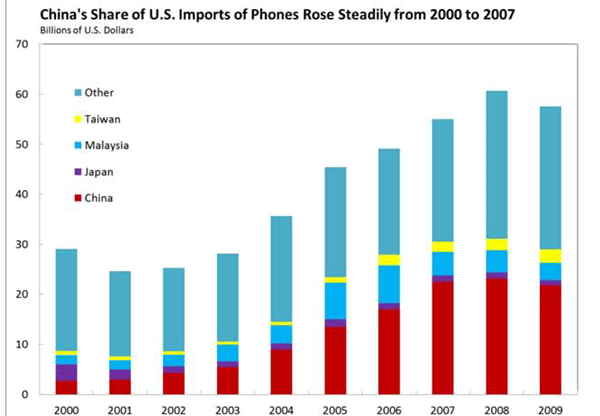
Source: U.S. International Trade Commission Dataweb.
Data for Figure 9
| Country | 2000 | 2001 | 2002 | 2003 | 2004 | 2005 | 2006 | 2007 | 2008 | 2009 |
|---|---|---|---|---|---|---|---|---|---|---|
| China | 2.726198 | 2.956891 | 4.286195 | 5.463497 | 8.920837 | 13.52647 | 16.99936 | 22.5301 | 23.16271 | 21.88311 |
| Japan | 3.29292 | 2.023441 | 1.4108 | 1.121282 | 1.268114 | 1.460983 | 1.180602 | 1.257697 | 1.23825 | 0.978805 |
| Malaysia | 1.818244 | 1.850631 | 2.22884 | 3.406174 | 3.687025 | 7.384736 | 7.635594 | 4.69915 | 4.424295 | 3.453447 |
| Taiwan | 0.891795 | 0.80641 | 0.650728 | 0.593852 | 0.622308 | 1.089485 | 2.107601 | 2.034431 | 2.3077 | 2.723109 |
| Other | 20.37393 | 16.9541 | 16.72085 | 17.61836 | 21.19146 | 21.9957 | 21.23785 | 24.51144 | 29.55927 | 28.50757 |
Liquid Crystal Displays (LCDs)
The market for televisions and computer monitors experienced a technical revolution over the past decade. In 2000, cathode ray tube (CRT) technology dominated the two markets. By 2004, LCDs and CRTs each had about half of the global market for computer monitors, but CRTs still accounted for around 90 percent of the television market. However, by 2008, LCDs accounted for more than 50 percent of the television market and, in 2009, around 70 percent.15 China's NBS estimates that production of color televisions in China doubled from 42 million units in 2001 to 84 million in 2007. China accounted for only 3 percent of the $8 billion in U.S. imports of televisions in 2001. By 2007, 39 percent of the $39 billion in U.S. imports came from China (Figure 10).
Figure 10: U.S. Imports of Televisions and Monitors (HS 8528)
Source: U .S. International Trade Commission Dataweb.
Data for Figure 10
| Country | 2000 | 2001 | 2002 | 2003 | 2004 | 2005 | 2006 | 2007 | 2008 | 2009 | 2010 |
|---|---|---|---|---|---|---|---|---|---|---|---|
| China | 0.17 | 0.25 | 0.81 | 1.45 | 2.28 | 4.88 | 7.61 | 15.05 | 17.1 | 14.5 | 15.06 |
| Japan | 0.66 | 1.23 | 1.58 | 2.11 | 2.72 | 2.28 | 1.6 | 1.16 | 0.92 | 0.61 | 0.84 |
| Korea | 0.13 | 0.21 | 0.32 | 0.78 | 0.97 | 0.72 | 0.4 | 0.54 | 0.44 | 0.44 | 0.51 |
| Taiwan | 0.13 | 0.13 | 0.21 | 0.51 | 1.12 | 1.68 | 1.76 | 1.97 | 1.51 | 0.91 | 1.09 |
| Mexico | 4.55 | 4.71 | 4.79 | 5.29 | 7.4 | 9.63 | 14.12 | 18.67 | 18.32 | 15.06 | 15.68 |
| Other | 1.47 | 1.49 | 2.2 | 1.97 | 1.97 | 2.28 | 2.2 | 1.47 | 1.61 | 1.64 | 2.24 |
Integrated Electronic Circuits
Although microprocessors and memory have been a part of personal computers since their introduction in the late 1970s, the rapid turnover of the technology in these products, with new manufacturing processes required for each successive generation, makes them similar to "new" products every few years. For example, between 2000 and 2008, there were 4 different production processes, characterized by ever smaller etching technology, utilized by the main semiconductor manufacturers. Because of the ever-changing technology and highly specialized processes, the capital requirements can be enormous. For example, a new semiconductor fabrication plant can cost as much as $5 billion dollars, with the equipment and necessary inventory holdings costing billions more.16 To be profitable, the plants need to run at high volumes. According to the NBS, Chinese production of semiconductor integrated circuits increased from less than 6 billion pieces in 2000 to 42 billion pieces in 2007.
Unlike for the other categories of exports discussed, the United States is not one of the primary markets for Chinese exports of integrated circuits. U.S. imports of integrated circuits have remained relatively flat since 2002 at around $22 billion, with China accounting for only $1.4 billion in 2007. This is likely because integrated circuits are an intermediate good, with China primarily exporting them to other countries as a step in the production process; the United States, however, may well be the primary market for the final product.
Section 3: The Effect of the Rise in Chinese Exports on Global Manufacturing
From 2000 to 2007, the value added of Chinese manufacturing output more than doubled in real terms, and its share of world manufacturing rose from less than 9 percent to 14½ percent (Figure 11).17 This nearly 6 percentage point increase in China's share of global manufacuring came mainly at the expense of advanced economies. The U.S. share of world manufacturing fell 2½ percentage points (from 23 percent to 20½ percent), Japan's fell 1¼, percentage points, Italy's and the United Kingdom's fell about 1 percentage point, and the shares of Germany, Canada, and France each fell a little more than ½ percentage point. Besides China, the only countries to gain at least ½ percentage point were South Korea and India.
Figure 11: Change in Global Manufacturing Share, 2000-2007
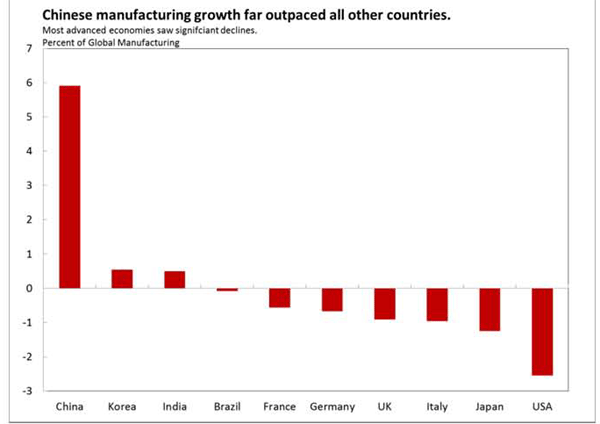
Source: United Nations Statistics Division.
Data for Figure 11
| China | Korea | India | Brazil | France | Germany | UK | Italy | Japan | USA |
|---|---|---|---|---|---|---|---|---|---|
| 5.908436 | 0.541749 | 0.491593 | -0.07989 | -0.56033 | -0.66761 | -0.91035 | -0.96687 | -1.24782 | -2.55347 |
The loss of manufacturing shares by the advanced economies was not because manufacturing output fell, but because it did not grow as fast as in emerging market economies. Nevertheless, increases in productivity, owing in part to heightened competition from China, led to declines in manufacturing employment in most advanced economies. The United States and the United Kingdom led the declines with manufacturing employment falling by more than 20 percent in the United States and 27 percent in the United Kingdom, despite the fact that manufacturing value added grew 14 percent in the United States and was flat in the United Kingdom. To gain a bettter understanding of the effect of the rise in Chinese exports on the manufacturing sectors of the advanced economies, we examine more closely the impact on manufacturing employment in the United States.
United States
The manufacturing sector has been shrinking as a share of the U.S. economy since the early 1970s, but through 2000 real manufacturing production continued to climb and employment in the manufacturing sector remained stable except for fluctuations correlated with the business cycle (Figure 12). However, between January 2000 and December 2007, manufacturing employment in the United States fell by 3.6 million, nearly 21 percent, to 13.7 million.
Figure 12: U.S. Manufacturing Employment
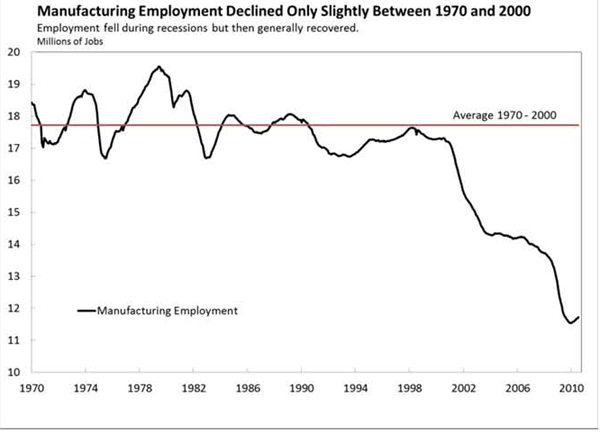
Source: Bureau of Labor Statistics.
Data for Figure 12
| Year-Month | Millions of Jobs |
|---|---|
| 1970 - Jan | 18424 |
| 1970 - Feb | 18361 |
| 1970 - Mar | 18360 |
| 1970 - Apr | 18207 |
| 1970 - May | 18029 |
| 1970 - Jun | 17930 |
| 1970 - Jul | 17877 |
| 1970 - Aug | 17779 |
| 1970 - Sep | 17692 |
| 1970 - Oct | 17173 |
| 1970 - Nov | 17024 |
| 1970 - Dec | 17309 |
| 1971 - Jan | 17280 |
| 1971 - Feb | 17216 |
| 1971 - Mar | 17154 |
| 1971 - Apr | 17149 |
| 1971 - May | 17225 |
| 1971 - Jun | 17139 |
| 1971 - Jul | 17126 |
| 1971 - Aug | 17115 |
| 1971 - Sep | 17154 |
| 1971 - Oct | 17126 |
| 1971 - Nov | 17166 |
| 1971 - Dec | 17202 |
| 1972 - Jan | 17283 |
| 1972 - Feb | 17361 |
| 1972 - Mar | 17447 |
| 1972 - Apr | 17508 |
| 1972 - May | 17602 |
| 1972 - Jun | 17641 |
| 1972 - Jul | 17556 |
| 1972 - Aug | 17741 |
| 1972 - Sep | 17774 |
| 1972 - Oct | 17893 |
| 1972 - Nov | 18005 |
| 1972 - Dec | 18158 |
| 1973 - Jan | 18276 |
| 1973 - Feb | 18410 |
| 1973 - Mar | 18493 |
| 1973 - Apr | 18530 |
| 1973 - May | 18564 |
| 1973 - Jun | 18606 |
| 1973 - Jul | 18598 |
| 1973 - Aug | 18629 |
| 1973 - Sep | 18609 |
| 1973 - Oct | 18702 |
| 1973 - Nov | 18773 |
| 1973 - Dec | 18820 |
| 1974 - Jan | 18788 |
| 1974 - Feb | 18727 |
| 1974 - Mar | 18700 |
| 1974 - Apr | 18702 |
| 1974 - May | 18688 |
| 1974 - Jun | 18690 |
| 1974 - Jul | 18656 |
| 1974 - Aug | 18570 |
| 1974 - Sep | 18492 |
| 1974 - Oct | 18364 |
| 1974 - Nov | 18077 |
| 1974 - Dec | 17693 |
| 1975 - Jan | 17344 |
| 1975 - Feb | 17004 |
| 1975 - Mar | 16853 |
| 1975 - Apr | 16759 |
| 1975 - May | 16746 |
| 1975 - Jun | 16690 |
| 1975 - Jul | 16678 |
| 1975 - Aug | 16824 |
| 1975 - Sep | 16904 |
| 1975 - Oct | 16984 |
| 1975 - Nov | 17025 |
| 1975 - Dec | 17140 |
| 1976 - Jan | 17287 |
| 1976 - Feb | 17384 |
| 1976 - Mar | 17470 |
| 1976 - Apr | 17541 |
| 1976 - May | 17513 |
| 1976 - Jun | 17521 |
| 1976 - Jul | 17524 |
| 1976 - Aug | 17596 |
| 1976 - Sep | 17665 |
| 1976 - Oct | 17548 |
| 1976 - Nov | 17682 |
| 1976 - Dec | 17719 |
| 1977 - Jan | 17803 |
| 1977 - Feb | 17843 |
| 1977 - Mar | 17941 |
| 1977 - Apr | 18024 |
| 1977 - May | 18107 |
| 1977 - Jun | 18192 |
| 1977 - Jul | 18259 |
| 1977 - Aug | 18276 |
| 1977 - Sep | 18334 |
| 1977 - Oct | 18356 |
| 1977 - Nov | 18419 |
| 1977 - Dec | 18531 |
| 1978 - Jan | 18593 |
| 1978 - Feb | 18639 |
| 1978 - Mar | 18699 |
| 1978 - Apr | 18772 |
| 1978 - May | 18848 |
| 1978 - Jun | 18919 |
| 1978 - Jul | 18951 |
| 1978 - Aug | 19006 |
| 1978 - Sep | 19068 |
| 1978 - Oct | 19142 |
| 1978 - Nov | 19257 |
| 1978 - Dec | 19334 |
| 1979 - Jan | 19388 |
| 1979 - Feb | 19409 |
| 1979 - Mar | 19453 |
| 1979 - Apr | 19450 |
| 1979 - May | 19509 |
| 1979 - Jun | 19553 |
| 1979 - Jul | 19531 |
| 1979 - Aug | 19406 |
| 1979 - Sep | 19442 |
| 1979 - Oct | 19390 |
| 1979 - Nov | 19299 |
| 1979 - Dec | 19301 |
| 1980 - Jan | 19282 |
| 1980 - Feb | 19219 |
| 1980 - Mar | 19217 |
| 1980 - Apr | 18973 |
| 1980 - May | 18726 |
| 1980 - Jun | 18490 |
| 1980 - Jul | 18276 |
| 1980 - Aug | 18414 |
| 1980 - Sep | 18445 |
| 1980 - Oct | 18506 |
| 1980 - Nov | 18601 |
| 1980 - Dec | 18640 |
| 1981 - Jan | 18639 |
| 1981 - Feb | 18613 |
| 1981 - Mar | 18647 |
| 1981 - Apr | 18711 |
| 1981 - May | 18766 |
| 1981 - Jun | 18789 |
| 1981 - Jul | 18785 |
| 1981 - Aug | 18748 |
| 1981 - Sep | 18712 |
| 1981 - Oct | 18566 |
| 1981 - Nov | 18409 |
| 1981 - Dec | 18223 |
| 1982 - Jan | 18047 |
| 1982 - Feb | 17981 |
| 1982 - Mar | 17857 |
| 1982 - Apr | 17683 |
| 1982 - May | 17588 |
| 1982 - Jun | 17430 |
| 1982 - Jul | 17278 |
| 1982 - Aug | 17160 |
| 1982 - Sep | 17074 |
| 1982 - Oct | 16853 |
| 1982 - Nov | 16722 |
| 1982 - Dec | 16690 |
| 1983 - Jan | 16705 |
| 1983 - Feb | 16706 |
| 1983 - Mar | 16711 |
| 1983 - Apr | 16794 |
| 1983 - May | 16885 |
| 1983 - Jun | 16960 |
| 1983 - Jul | 17059 |
| 1983 - Aug | 17118 |
| 1983 - Sep | 17255 |
| 1983 - Oct | 17367 |
| 1983 - Nov | 17479 |
| 1983 - Dec | 17551 |
| 1984 - Jan | 17630 |
| 1984 - Feb | 17728 |
| 1984 - Mar | 17806 |
| 1984 - Apr | 17872 |
| 1984 - May | 17916 |
| 1984 - Jun | 17967 |
| 1984 - Jul | 18013 |
| 1984 - Aug | 18034 |
| 1984 - Sep | 18019 |
| 1984 - Oct | 18024 |
| 1984 - Nov | 18016 |
| 1984 - Dec | 18023 |
| 1985 - Jan | 18009 |
| 1985 - Feb | 17966 |
| 1985 - Mar | 17939 |
| 1985 - Apr | 17886 |
| 1985 - May | 17855 |
| 1985 - Jun | 17819 |
| 1985 - Jul | 17776 |
| 1985 - Aug | 17756 |
| 1985 - Sep | 17718 |
| 1985 - Oct | 17708 |
| 1985 - Nov | 17697 |
| 1985 - Dec | 17693 |
| 1986 - Jan | 17686 |
| 1986 - Feb | 17663 |
| 1986 - Mar | 17624 |
| 1986 - Apr | 17616 |
| 1986 - May | 17593 |
| 1986 - Jun | 17530 |
| 1986 - Jul | 17497 |
| 1986 - Aug | 17489 |
| 1986 - Sep | 17498 |
| 1986 - Oct | 17477 |
| 1986 - Nov | 17472 |
| 1986 - Dec | 17478 |
| 1987 - Jan | 17465 |
| 1987 - Feb | 17499 |
| 1987 - Mar | 17507 |
| 1987 - Apr | 17525 |
| 1987 - May | 17542 |
| 1987 - Jun | 17537 |
| 1987 - Jul | 17593 |
| 1987 - Aug | 17630 |
| 1987 - Sep | 17691 |
| 1987 - Oct | 17729 |
| 1987 - Nov | 17775 |
| 1987 - Dec | 17809 |
| 1988 - Jan | 17790 |
| 1988 - Feb | 17823 |
| 1988 - Mar | 17844 |
| 1988 - Apr | 17874 |
| 1988 - May | 17892 |
| 1988 - Jun | 17916 |
| 1988 - Jul | 17926 |
| 1988 - Aug | 17891 |
| 1988 - Sep | 17914 |
| 1988 - Oct | 17966 |
| 1988 - Nov | 18003 |
| 1988 - Dec | 18025 |
| 1989 - Jan | 18057 |
| 1989 - Feb | 18055 |
| 1989 - Mar | 18060 |
| 1989 - Apr | 18055 |
| 1989 - May | 18040 |
| 1989 - Jun | 18013 |
| 1989 - Jul | 17980 |
| 1989 - Aug | 17964 |
| 1989 - Sep | 17922 |
| 1989 - Oct | 17895 |
| 1989 - Nov | 17886 |
| 1989 - Dec | 17881 |
| 1990 - Jan | 17799 |
| 1990 - Feb | 17896 |
| 1990 - Mar | 17870 |
| 1990 - Apr | 17847 |
| 1990 - May | 17796 |
| 1990 - Jun | 17775 |
| 1990 - Jul | 17703 |
| 1990 - Aug | 17648 |
| 1990 - Sep | 17610 |
| 1990 - Oct | 17575 |
| 1990 - Nov | 17428 |
| 1990 - Dec | 17394 |
| 1991 - Jan | 17331 |
| 1991 - Feb | 17214 |
| 1991 - Mar | 17141 |
| 1991 - Apr | 17095 |
| 1991 - May | 17069 |
| 1991 - Jun | 17042 |
| 1991 - Jul | 17016 |
| 1991 - Aug | 17025 |
| 1991 - Sep | 17011 |
| 1991 - Oct | 16998 |
| 1991 - Nov | 16960 |
| 1991 - Dec | 16916 |
| 1992 - Jan | 16840 |
| 1992 - Feb | 16831 |
| 1992 - Mar | 16805 |
| 1992 - Apr | 16830 |
| 1992 - May | 16834 |
| 1992 - Jun | 16825 |
| 1992 - Jul | 16820 |
| 1992 - Aug | 16783 |
| 1992 - Sep | 16761 |
| 1992 - Oct | 16750 |
| 1992 - Nov | 16758 |
| 1992 - Dec | 16767 |
| 1993 - Jan | 16791 |
| 1993 - Feb | 16806 |
| 1993 - Mar | 16795 |
| 1993 - Apr | 16771 |
| 1993 - May | 16766 |
| 1993 - Jun | 16742 |
| 1993 - Jul | 16740 |
| 1993 - Aug | 16741 |
| 1993 - Sep | 16769 |
| 1993 - Oct | 16777 |
| 1993 - Nov | 16800 |
| 1993 - Dec | 16815 |
| 1994 - Jan | 16854 |
| 1994 - Feb | 16863 |
| 1994 - Mar | 16896 |
| 1994 - Apr | 16932 |
| 1994 - May | 16961 |
| 1994 - Jun | 17011 |
| 1994 - Jul | 17026 |
| 1994 - Aug | 17082 |
| 1994 - Sep | 17113 |
| 1994 - Oct | 17143 |
| 1994 - Nov | 17187 |
| 1994 - Dec | 17218 |
| 1995 - Jan | 17261 |
| 1995 - Feb | 17265 |
| 1995 - Mar | 17262 |
| 1995 - Apr | 17278 |
| 1995 - May | 17259 |
| 1995 - Jun | 17249 |
| 1995 - Jul | 17218 |
| 1995 - Aug | 17239 |
| 1995 - Sep | 17246 |
| 1995 - Oct | 17215 |
| 1995 - Nov | 17207 |
| 1995 - Dec | 17229 |
| 1996 - Jan | 17208 |
| 1996 - Feb | 17230 |
| 1996 - Mar | 17192 |
| 1996 - Apr | 17204 |
| 1996 - May | 17222 |
| 1996 - Jun | 17227 |
| 1996 - Jul | 17222 |
| 1996 - Aug | 17255 |
| 1996 - Sep | 17252 |
| 1996 - Oct | 17268 |
| 1996 - Nov | 17276 |
| 1996 - Dec | 17283 |
| 1997 - Jan | 17299 |
| 1997 - Feb | 17317 |
| 1997 - Mar | 17339 |
| 1997 - Apr | 17351 |
| 1997 - May | 17363 |
| 1997 - Jun | 17388 |
| 1997 - Jul | 17388 |
| 1997 - Aug | 17451 |
| 1997 - Sep | 17465 |
| 1997 - Oct | 17513 |
| 1997 - Nov | 17556 |
| 1997 - Dec | 17587 |
| 1998 - Jan | 17623 |
| 1998 - Feb | 17627 |
| 1998 - Mar | 17637 |
| 1998 - Apr | 17635 |
| 1998 - May | 17623 |
| 1998 - Jun | 17609 |
| 1998 - Jul | 17421 |
| 1998 - Aug | 17563 |
| 1998 - Sep | 17557 |
| 1998 - Oct | 17511 |
| 1998 - Nov | 17465 |
| 1998 - Dec | 17447 |
| 1999 - Jan | 17432 |
| 1999 - Feb | 17395 |
| 1999 - Mar | 17368 |
| 1999 - Apr | 17343 |
| 1999 - May | 17333 |
| 1999 - Jun | 17296 |
| 1999 - Jul | 17308 |
| 1999 - Aug | 17286 |
| 1999 - Sep | 17279 |
| 1999 - Oct | 17273 |
| 1999 - Nov | 17281 |
| 1999 - Dec | 17277 |
| 2000 - Jan | 17292 |
| 2000 - Feb | 17284 |
| 2000 - Mar | 17302 |
| 2000 - Apr | 17298 |
| 2000 - May | 17279 |
| 2000 - Jun | 17298 |
| 2000 - Jul | 17321 |
| 2000 - Aug | 17286 |
| 2000 - Sep | 17226 |
| 2000 - Oct | 17215 |
| 2000 - Nov | 17202 |
| 2000 - Dec | 17178 |
| 2001 - Jan | 17114 |
| 2001 - Feb | 17029 |
| 2001 - Mar | 16939 |
| 2001 - Apr | 16803 |
| 2001 - May | 16662 |
| 2001 - Jun | 16516 |
| 2001 - Jul | 16378 |
| 2001 - Aug | 16225 |
| 2001 - Sep | 16113 |
| 2001 - Oct | 15971 |
| 2001 - Nov | 15825 |
| 2001 - Dec | 15710 |
| 2002 - Jan | 15598 |
| 2002 - Feb | 15518 |
| 2002 - Mar | 15446 |
| 2002 - Apr | 15394 |
| 2002 - May | 15338 |
| 2002 - Jun | 15297 |
| 2002 - Jul | 15250 |
| 2002 - Aug | 15164 |
| 2002 - Sep | 15115 |
| 2002 - Oct | 15059 |
| 2002 - Nov | 14992 |
| 2002 - Dec | 14910 |
| 2003 - Jan | 14867 |
| 2003 - Feb | 14780 |
| 2003 - Mar | 14722 |
| 2003 - Apr | 14608 |
| 2003 - May | 14556 |
| 2003 - Jun | 14493 |
| 2003 - Jul | 14401 |
| 2003 - Aug | 14378 |
| 2003 - Sep | 14347 |
| 2003 - Oct | 14334 |
| 2003 - Nov | 14315 |
| 2003 - Dec | 14300 |
| 2004 - Jan | 14292 |
| 2004 - Feb | 14277 |
| 2004 - Mar | 14288 |
| 2004 - Apr | 14316 |
| 2004 - May | 14342 |
| 2004 - Jun | 14331 |
| 2004 - Jul | 14333 |
| 2004 - Aug | 14343 |
| 2004 - Sep | 14330 |
| 2004 - Oct | 14334 |
| 2004 - Nov | 14305 |
| 2004 - Dec | 14285 |
| 2005 - Jan | 14261 |
| 2005 - Feb | 14274 |
| 2005 - Mar | 14271 |
| 2005 - Apr | 14253 |
| 2005 - May | 14258 |
| 2005 - Jun | 14227 |
| 2005 - Jul | 14223 |
| 2005 - Aug | 14201 |
| 2005 - Sep | 14174 |
| 2005 - Oct | 14191 |
| 2005 - Nov | 14181 |
| 2005 - Dec | 14189 |
| 2006 - Jan | 14210 |
| 2006 - Feb | 14215 |
| 2006 - Mar | 14220 |
| 2006 - Apr | 14232 |
| 2006 - May | 14209 |
| 2006 - Jun | 14217 |
| 2006 - Jul | 14190 |
| 2006 - Aug | 14159 |
| 2006 - Sep | 14125 |
| 2006 - Oct | 14070 |
| 2006 - Nov | 14030 |
| 2006 - Dec | 14001 |
| 2007 - Jan | 14007 |
| 2007 - Feb | 13998 |
| 2007 - Mar | 13973 |
| 2007 - Apr | 13949 |
| 2007 - May | 13939 |
| 2007 - Jun | 13916 |
| 2007 - Jul | 13898 |
| 2007 - Aug | 13833 |
| 2007 - Sep | 13788 |
| 2007 - Oct | 13753 |
| 2007 - Nov | 13745 |
| 2007 - Dec | 13726 |
| 2008 - Jan | 13721 |
| 2008 - Feb | 13691 |
| 2008 - Mar | 13654 |
| 2008 - Apr | 13604 |
| 2008 - May | 13577 |
| 2008 - Jun | 13528 |
| 2008 - Jul | 13456 |
| 2008 - Aug | 13363 |
| 2008 - Sep | 13270 |
| 2008 - Oct | 13129 |
| 2008 - Nov | 12999 |
| 2008 - Dec | 12822 |
| 2009 - Jan | 12543 |
| 2009 - Feb | 12377 |
| 2009 - Mar | 12212 |
| 2009 - Apr | 12063 |
| 2009 - May | 11911 |
| 2009 - Jun | 11782 |
| 2009 - Jul | 11739 |
| 2009 - Aug | 11682 |
| 2009 - Sep | 11634 |
| 2009 - Oct | 11577 |
| 2009 - Nov | 11552 |
| 2009 - Dec | 11534 |
| 2010 - Jan | 11556 |
| 2010 - Feb | 11572 |
| 2010 - Mar | 11591 |
| 2010 - Apr | 11629 |
| 2010 - May | 11668 |
| 2010 - Jun | 11681 |
| 2010 - Jul | 11717 |
No doubt some of these losses were attributable to the 2001 recession. But as shown in Figure 13, overall manufacturing job losses during the 2001 recession were not unusual by historical U.S. standards. The panel plots manufacturing employment in the months centered around recession troughs (as designated by the NBER), indicated by the vertical line. The blue line corresponds to the average experience over the post-war recessions prior to the 2001 recession, which is plotted as the red line. The pattern of manufacturing employment was very typical prior to the recession and through its trough, but atypical from that point onward. In the past, manufacturing employment began to rebound within 6 months of the trough, but following the 2001 recession, manufacturing employment contined to fall for 2 years and then only flattened out rather than recover.
Figure 13: U.S. Recessions and Manufacturing Employment
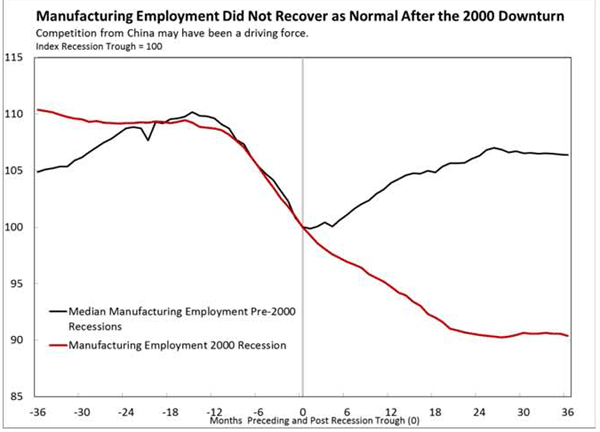
Source: Bureau of Labor Statistics, Bureau of Economic Analysis.
Data for Figure 13
| Months around recession trough (0) | Median Manufacturing Employment Pre-2000 Recessions | Manufacturing Employment 2000 Recession |
|---|---|---|
| -36 | 104.8731247 | 110.3633 |
| -35 | 105.0781154 | 110.2496 |
| -34 | 105.2061788 | 110.1548 |
| -33 | 105.3630037 | 109.921 |
| -32 | 105.3531538 | 109.7504 |
| -31 | 105.8858381 | 109.5924 |
| -30 | 106.1570283 | 109.5292 |
| -29 | 106.6216883 | 109.2954 |
| -28 | 107.0626434 | 109.3712 |
| -27 | 107.4842612 | 109.2322 |
| -26 | 107.8284732 | 109.188 |
| -25 | 108.2872732 | 109.1501 |
| -24 | 108.7186837 | 109.2006 |
| -23 | 108.8515041 | 109.1754 |
| -22 | 108.7162014 | 109.2701 |
| -21 | 107.6567997 | 109.2196 |
| -20 | 109.2861845 | 109.3333 |
| -19 | 109.1710309 | 109.3081 |
| -18 | 109.5259568 | 109.188 |
| -17 | 109.6062985 | 109.3081 |
| -16 | 109.7534934 | 109.4534 |
| -15 | 110.1654312 | 109.2322 |
| -14 | 109.8301996 | 108.8531 |
| -13 | 109.795853 | 108.7836 |
| -12 | 109.6088317 | 108.7014 |
| -11 | 109.0593564 | 108.5498 |
| -10 | 108.7164902 | 108.1453 |
| -9 | 107.7123961 | 107.6082 |
| -8 | 107.317605 | 107.0395 |
| -7 | 106.2359551 | 106.1801 |
| -6 | 105.3416466 | 105.2891 |
| -5 | 104.6968578 | 104.3665 |
| -4 | 104.1677672 | 103.4945 |
| -3 | 103.2165244 | 102.5276 |
| -2 | 102.2836285 | 101.8199 |
| -1 | 100.829317 | 100.9226 |
| 0 | 100 | 100 |
| 1 | 99.86940959 | 99.2733 |
| 2 | 100.0302444 | 98.56556 |
| 3 | 100.3946965 | 98.06003 |
| 4 | 100.0291525 | 97.60506 |
| 5 | 100.5993703 | 97.27646 |
| 6 | 101.0777249 | 96.92259 |
| 7 | 101.6336115 | 96.66351 |
| 8 | 102.0226469 | 96.36651 |
| 9 | 102.3741542 | 95.82306 |
| 10 | 102.9342648 | 95.51343 |
| 11 | 103.3354034 | 95.15956 |
| 12 | 103.8912062 | 94.73618 |
| 13 | 104.2369772 | 94.21801 |
| 14 | 104.5794401 | 93.94629 |
| 15 | 104.7593233 | 93.39652 |
| 16 | 104.7163574 | 93.03002 |
| 17 | 104.993413 | 92.30964 |
| 18 | 104.8278221 | 91.98104 |
| 19 | 105.3278397 | 91.58294 |
| 20 | 105.6263413 | 91.00158 |
| 21 | 105.6245713 | 90.85624 |
| 22 | 105.6734379 | 90.66035 |
| 23 | 106.0592408 | 90.5782 |
| 24 | 106.2965643 | 90.45814 |
| 25 | 106.804751 | 90.36335 |
| 26 | 106.9861373 | 90.3128 |
| 27 | 106.8459433 | 90.21801 |
| 28 | 106.6073975 | 90.28752 |
| 29 | 106.6960186 | 90.46445 |
| 30 | 106.5332048 | 90.62875 |
| 31 | 106.5624661 | 90.55924 |
| 32 | 106.4773016 | 90.57188 |
| 33 | 106.5109955 | 90.63507 |
| 34 | 106.4833983 | 90.55292 |
| 35 | 106.4133939 | 90.5782 |
| 36 | 106.3743782 | 90.39494 |
To better quantify the different forces affecting U.S. employment, we regress the log difference of quarterly manufacturing employment on a constant, and the log differences of U.S. GDP, foreign GDP (weighted by U.S. exports), and investment in equipment and software (E&S). The right-hand side variables were estimated using third degree polynomials of four lags. We also include a first-order autoregressive error term, AR(1). The results are reported in Table 1, with the statistics for the sum of the lags reported for the economic variables. We estimated the equation through 1999:Q4 in order to allow for out-of-sample forecasts from 2000 forward, our period of interest.
Table 1. Dependent Variable: Log-difference Manufacturing Employment
| Variable | Coefficient | Std. Error | t-Statistic |
|---|---|---|---|
| C | -0.015 | 0.002 | -7.747 |
| US GDP | 0.604 | 0.277 | 2.182 |
| For GDP | 0.948 | 0.256 | 3.712 |
| E&S Inv. | 0.112 | 0.074 | 1.517 |
| AR(1) | 0.319 | 0.096 | 3.319 |
R2 =0.816
Adj. R2 =0.791
*Independent variables are log differences.
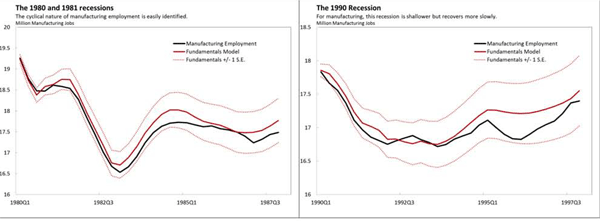
The coefficients on the GDP variables are of the expected sign and statistically significant at the 5 percent confidence level. The coefficient on investment falls just short of signficance at the 10 percent level. The inclusion of the autoregressive term has little impact on the coefficients and significance of the other variables as its relatively low value would suggest. In Figure 14, we show dynamic forecasts of the model through the 1980 and 1990 recessions. The model does a very good job of capturing both the contours and levels of employment, despite the very different characteristics of the two recessions.
Figure 14: Model Fit of the 1980 and 1990 Recessions
Data for Figure 14
| Year/Quarter | Manufacturing Employment | Fundamentals Model | Fundamentals - 1 S.E. | Fundamentals + 1 S.E. |
|---|---|---|---|---|
| 1980Q1 | 19.2614481 | 19.239 | 19.13600772 | 19.34199228 |
| 1980Q2 | 18.76943417 | 18.73 | 18.58806748 | 18.87193252 |
| 1980Q3 | 18.47980981 | 18.378 | 18.20685119 | 18.54914881 |
| 1980Q4 | 18.47335233 | 18.582 | 18.38444344 | 18.77955656 |
| 1981Q1 | 18.61447754 | 18.633 | 18.4104377 | 18.8555623 |
| 1981Q2 | 18.58673042 | 18.755 | 18.51155863 | 18.99844137 |
| 1981Q3 | 18.54029576 | 18.748 | 18.48571018 | 19.01028982 |
| 1981Q4 | 18.27674054 | 18.399 | 18.12258635 | 18.67541365 |
| 1982Q1 | 17.84819472 | 17.962 | 17.67569344 | 18.24830656 |
| 1982Q2 | 17.43263926 | 17.567 | 17.27223298 | 17.86176702 |
| 1982Q3 | 17.00958334 | 17.171 | 16.86934831 | 17.47265169 |
| 1982Q4 | 16.67055816 | 16.755 | 16.44621477 | 17.06378523 |
| 1983Q1 | 16.53423409 | 16.707 | 16.38823436 | 17.02576564 |
| 1983Q2 | 16.66381646 | 16.88 | 16.54660872 | 17.21339128 |
| 1983Q3 | 16.90277281 | 17.144 | 16.79395866 | 17.49404134 |
| 1983Q4 | 17.23604893 | 17.466 | 17.09735066 | 17.83464934 |
| 1984Q1 | 17.47928282 | 17.721 | 17.3356425 | 18.1063575 |
| 1984Q2 | 17.63303361 | 17.918 | 17.51798246 | 18.31801754 |
| 1984Q3 | 17.70866859 | 18.022 | 17.60925819 | 18.43474181 |
| 1984Q4 | 17.72921322 | 18.021 | 17.59704456 | 18.44495544 |
| 1985Q1 | 17.71621937 | 17.971 | 17.53689334 | 18.40510666 |
| 1985Q2 | 17.66555852 | 17.853 | 17.40994824 | 18.29605176 |
| 1985Q3 | 17.62171319 | 17.75 | 17.29811513 | 18.20188487 |
| 1985Q4 | 17.64281856 | 17.699 | 17.23684321 | 18.16115679 |
| 1986Q1 | 17.57537761 | 17.658 | 17.18811626 | 18.12788374 |
| 1986Q2 | 17.54448014 | 17.58 | 17.10165314 | 18.05834686 |
| 1986Q3 | 17.49575754 | 17.495 | 17.00889467 | 17.98110533 |
| 1986Q4 | 17.39272167 | 17.476 | 16.98388986 | 17.96811014 |
| 1987Q1 | 17.23903248 | 17.49 | 16.99360473 | 17.98639527 |
| 1987Q2 | 17.31826826 | 17.535 | 17.02779814 | 18.04220186 |
| 1987Q3 | 17.43329839 | 17.638 | 17.11898948 | 18.15701052 |
| 1987Q4 | 17.48707931 | 17.771 | 17.24205804 | 18.29994196 |
| 1990Q1 | 17.83153424 | 17.855 | 17.75965356 | 17.95034644 |
| 1990Q2 | 17.66617231 | 17.806 | 17.67241023 | 17.93958977 |
| 1990Q3 | 17.55687489 | 17.654 | 17.49139886 | 17.81660114 |
| 1990Q4 | 17.36522353 | 17.466 | 17.28029392 | 17.65170608 |
| 1991Q1 | 17.10998462 | 17.229 | 17.02442603 | 17.43357397 |
| 1991Q2 | 16.96570295 | 17.069 | 16.84679019 | 17.29120981 |
| 1991Q3 | 16.86031135 | 17.017 | 16.77847695 | 17.25552305 |
| 1991Q4 | 16.80453542 | 16.958 | 16.70385167 | 17.21214833 |
| 1992Q1 | 16.75313486 | 16.825 | 16.55625952 | 17.09374048 |
| 1992Q2 | 16.80113175 | 16.83 | 16.54591109 | 17.11408891 |
| 1992Q3 | 16.84255676 | 16.788 | 16.48931039 | 17.08668961 |
| 1992Q4 | 16.88005353 | 16.758 | 16.44533433 | 17.07066567 |
| 1993Q1 | 16.8203343 | 16.797 | 16.47271859 | 17.12128141 |
| 1993Q2 | 16.7772778 | 16.76 | 16.42433871 | 17.09566129 |
| 1993Q3 | 16.71574138 | 16.75 | 16.40383192 | 17.09616808 |
| 1993Q4 | 16.74792255 | 16.797 | 16.43879084 | 17.15520916 |
| 1994Q1 | 16.82869589 | 16.871 | 16.49998568 | 17.24201432 |
| 1994Q2 | 16.87598266 | 16.968 | 16.58515668 | 17.35084332 |
| 1994Q3 | 16.91758031 | 17.074 | 16.67969635 | 17.46830365 |
| 1994Q4 | 17.03891103 | 17.183 | 16.77555163 | 17.59044837 |
| 1995Q1 | 17.11126385 | 17.263 | 16.84371678 | 17.68228322 |
| 1995Q2 | 17.00397668 | 17.262 | 16.8355407 | 17.6884593 |
| 1995Q3 | 16.90046244 | 17.234 | 16.80061063 | 17.66738937 |
| 1995Q4 | 16.83211827 | 17.217 | 16.77607965 | 17.65792035 |
| 1996Q1 | 16.82516989 | 17.21 | 16.76017332 | 17.65982668 |
| 1996Q2 | 16.89506882 | 17.218 | 16.75735921 | 17.67864079 |
| 1996Q3 | 16.98187388 | 17.243 | 16.77117251 | 17.71482749 |
| 1996Q4 | 17.04586692 | 17.276 | 16.79370378 | 17.75829622 |
| 1997Q1 | 17.09962618 | 17.318 | 16.82561891 | 17.81038109 |
| 1997Q2 | 17.21213179 | 17.367 | 16.86290657 | 17.87109343 |
| 1997Q3 | 17.36939552 | 17.435 | 16.91789195 | 17.95210805 |
| 1997Q4 | 17.39881304 | 17.552 | 17.02572788 | 18.07827212 |
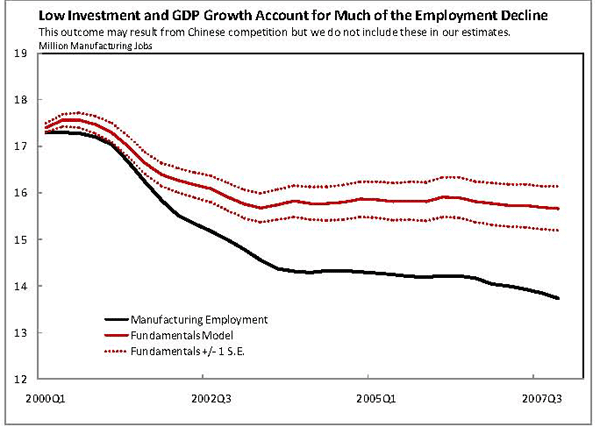
Figure 15 shows our out-of-sample forecast for manufacturing employment from 2000 through the fourth quarter of 2007. The model matches the general shape of employment through this period but significantly underestimates the job losses from the trough of the recession in the fourth quarter of 2001 through the end of 2003.18 It is important to note that the model shows that even after the recession's trough, U.S. GDP and investment growth were not sufficiently robust to prevent a further decline in employment over the next two years or a substantive rebound thereafter. We could not find a domestic macro variable capable of explaining the gap between the model fit and the data.
Figure 15: Out-of-Sample Forecast of 2001 Recession
Data for Figure 15
| Year/Quarter | Manufacturing Employment | Fundamentals Model | Fundamentals - 1 S.E. | Fundamentals + 1 S.E. |
|---|---|---|---|---|
| 2000Q1 | 17.293 | 17.39649539 | 17.30347514 | 17.48951565 |
| 2000Q2 | 17.292 | 17.55943281 | 17.42665019 | 17.69221543 |
| 2000Q3 | 17.278 | 17.55885735 | 17.39623784 | 17.72147685 |
| 2000Q4 | 17.198 | 17.46566694 | 17.27888671 | 17.65244718 |
| 2001Q1 | 17.027 | 17.28473321 | 17.07806988 | 17.49139655 |
| 2001Q2 | 16.66 | 16.98127494 | 16.75886117 | 17.20368871 |
| 2001Q3 | 16.239 | 16.63635828 | 16.40100349 | 16.87171306 |
| 2001Q4 | 15.835 | 16.39036985 | 16.14248528 | 16.63825442 |
| 2002Q1 | 15.521 | 16.26188358 | 16.00102336 | 16.5227438 |
| 2002Q2 | 15.343 | 16.16594524 | 15.89259664 | 16.43929384 |
| 2002Q3 | 15.176 | 16.08446335 | 15.79921794 | 16.36970876 |
| 2002Q4 | 14.987 | 15.91455781 | 15.61977581 | 16.2093398 |
| 2003Q1 | 14.79 | 15.75338625 | 15.44967467 | 16.05709783 |
| 2003Q2 | 14.552 | 15.67989532 | 15.36618924 | 15.99360139 |
| 2003Q3 | 14.375 | 15.74661045 | 15.4205122 | 16.07270869 |
| 2003Q4 | 14.316 | 15.82013696 | 15.48177154 | 16.15850239 |
| 2004Q1 | 14.286 | 15.77743656 | 15.42959886 | 16.12527426 |
| 2004Q2 | 14.33 | 15.76867906 | 15.41095569 | 16.12640243 |
| 2004Q3 | 14.335 | 15.8002426 | 15.43198111 | 16.16850409 |
| 2004Q4 | 14.308 | 15.86620098 | 15.48679542 | 16.24560655 |
| 2005Q1 | 14.269 | 15.85426767 | 15.46578506 | 16.24275028 |
| 2005Q2 | 14.246 | 15.81439366 | 15.41776907 | 16.21101825 |
| 2005Q3 | 14.199 | 15.83084617 | 15.42488566 | 16.23680669 |
| 2005Q4 | 14.187 | 15.81767846 | 15.40333154 | 16.23202538 |
| 2006Q1 | 14.215 | 15.9101301 | 15.48476732 | 16.33549288 |
| 2006Q2 | 14.219 | 15.89712703 | 15.46369493 | 16.33055913 |
| 2006Q3 | 14.158 | 15.80684565 | 15.36766535 | 16.24602594 |
| 2006Q4 | 14.034 | 15.76837759 | 15.32222669 | 16.2145285 |
| 2007Q1 | 13.993 | 15.73291253 | 15.27988574 | 16.18593931 |
| 2007Q2 | 13.935 | 15.72428551 | 15.26376678 | 16.18480424 |
| 2007Q3 | 13.84 | 15.68184387 | 15.21497628 | 16.14871145 |
| 2007Q4 | 13.741 | 15.66495358 | 15.19112653 | 16.13878063 |
Chinese exports, competing with U.S.-produced goods in the domestic and foreign markets, likely account for part of this unusual pattern. U.S. job losses were concentrated in those sectors where Chinese exports grew most rapidly--more than half of the losses were in the apparel and textiles, furniture, metals, and computer industries (Figure 16).
Figure 16: U.S. Employment Losses by Industry, 2000-2007

Source: Bureau of Labor Statistics.
Data for Figure 16
| Textiles and Apparel | Computers | Metals and Minerals | Transportation | Print & Paper | Plas. & Chem. | Furniture | Machinery | Electrical | Misc. | Food & Bev. |
|---|---|---|---|---|---|---|---|---|---|---|
| 633 | 524.5 | 419.7 | 410.5 | 348.9 | 335 | 291.8 | 274 | 163 | 85.9 | 79.2 |
An Examination Industry-by-Industry
To quantify the effect of Chinese competition on U.S. manufacturing employment, we regress the log change in employment on the log change in Chinese import penetration, the log change in import penetration excluding China, and the log change in U.S. industrial production. Import penetration is defined as the ratio of imports to domestic demand, and demand is calculated as industrial production minus the change in inventories and net exports. The first two columns of the table quantifies the estimated impact of import pentration on jobs. The number takes the coeficient on the relevant variable and multiplies it by the change in that variable between 2001 and 2007. The next four columns give the results of the regressions for the import pentration variables. Numbers highlighted in bold are statistically significant. The first line of the table shows the results of a panel regression with industry fixed effects (at the 3-digit NAICS level). A one percent increase in Chinese import penetration reduces employment across these manufacturing sectors by almost 3 percent. In contrast, the same increase in imports from other countries boosts employment by over 8 percent. Both coeficients are highly statistically significant. Moving down the table, regressions are conducted one industry at a time. The estimated job losses are concentrated in three industries. Fabricated metal, machinery, and computers. These three industries have relatively large coefficients and were large employers in 2001.
The panel regression coefficient implies that domestic competition from Chinese exports can account for approximately ¾ million of the 3½ million manufacturing jobs lost. This regression may underestimate the effect on U.S. employment of Chinese exports by not fully capturing the effect of Chinese competition with U.S. exports in foreign markets.
Table 2. Cummulative Impact of Import Penetration on Jobs*
| Chinese Jobs Impact | World Jobs Impact | Chinese Imports | T-Stat | World Imports ex China | T-Stat | |
|---|---|---|---|---|---|---|
| Panel Estimate | -788 | 464 | -2.89 | -2.6 | 8.39 | 4.3 |
| Industry Estimates: 311 Food | 12 | -26 | 1.14 | 0.2 | 7.03 | -0.9 |
| Industry Estimates: 312 Bev. and Tobacco | 0 | -6 | 4.15 | 1.7 | -8.99 | -0.6 |
| Industry Estimates: 313 Textiles | 8 | 4 | 3.45 | 0.7 | 7.82 | 0.5 |
| Industry Estimates: 314 Txtl. Mill Products | -46 | 9 | -34.85 | -2.6 | 15.37 | 1.0 |
| Industry Estimates: 315 Apparel | -25 | 1 | -8.30 | -1.3 | 0.70 | 0.1 |
| Industry Estimates: 316 Leather | -13 | 4 | -50.31 | -1.7 | 19.90 | 0.7 |
| Industry Estimates: 321 Wood | 32 | 6 | 10.85 | 1.4 | 19.54 | 7.6 |
| Industry Estimates: 322 Paper | -29 | 3 | -8.07 | -1.4 | 5.34 | 0.7 |
| Industry Estimates: 323 Printed Matter | -8 | 0 | -2.14 | -0.3 | 0.02 | 0.0 |
| Industry Estimates: 324 Petroleum | 0 | 0 | 0.22 | 0.2 | -2.08 | -0.4 |
| Industry Estimates: 325 Chemicals | -8 | 8 | -1.66 | -0.9 | 4.62 | 0.9 |
| Industry Estimates: 326 Plastics | 38 | -13 | 8.84 | 0.6 | -7.03 | -0.3 |
| Industry Estimates: 327 NonMetal Mineral | -16 | 19 | -13.60 | -1.8 | 42.87 | 6.7 |
| Industry Estimates: 331 Primary Metal | -1 | 18 | -0.28 | -0.1 | 8.28 | 1.3 |
| Industry Estimates: 332 Fabricated Metal | -242 | 155 | -29.04 | -3.5 | 41.98 | 3.9 |
| Industry Estimates: 333 Machinery | -123 | 71 | -16.16 | -2.5 | 30.02 | 3.6 |
| Industry Estimates: 334 Computers | -149 | 39 | -13.41 | -0.5 | 16.83 | 0.8 |
| Industry Estimates: 335 Electrical Equip. | -26 | 47 | -11.25 | -0.6 | 30.06 | 1.5 |
| Industry Estimates: 336 Transportation | 24 | 16 | 2.28 | 1.0 | 17.17 | 1.5 |
| Industry Estimates: 337 Furniture | -6 | 13 | -2.24 | -0.2 | 17.73 | 1.0 |
| Industry Estimates: 339 Misc. | -18 | 19 | -9.23 | -2.9 | 9.83 | 2.0 |
* Percent change in employment to percent change in import penetration
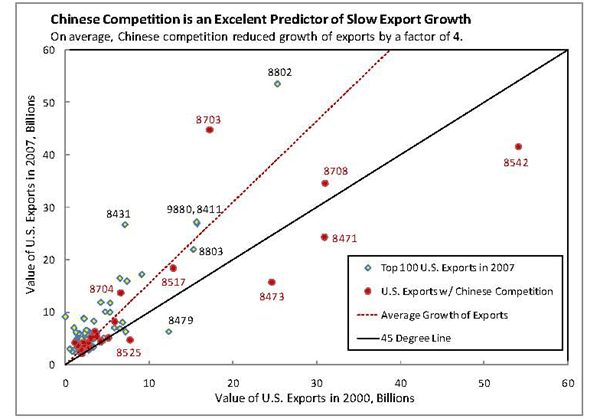
We attempt to illustrate this competition in Figure 17. Each point of the scatter plot represents the value of U.S. exports in 2000 (horizontal axis) and 2007 (vertical axis). The points are drawn from the 100 largest 4-digit HS categories in 2007. We shaded a point red if that category was also one of the top 50 categories of Chinese export growth measured in dollars. The red dots primarily fall below the trend line (dashed-red). Moreover, the red-shaded points that fall below the 45 degree line, indicating that those categories fell in dollar value between 2000 and 2007, are all high-tech goods.
As these high-tech goods evolved rapidly in the 2000s, the United States did not make the capital investment necessary to maintain its competitive position because of the bursting of the tech bubble and ensuing recession. In 2002 and 2003, the stock of private fixed assets in the computer and electronics industry fell for the first time in the postwar era. In contrast, Chinese investment in high-tech was soaring. Chinese fixed asset investment in communications, computer, and other electronics industries doubled between 2004, the first year of available data, and 2007. Of course, it is difficult to determine whether U.S. investment was lacking because of Chinese competition or whether the lack of investment opened the door to said competition. But regardless of the cause, with U.S. manufacturing capacity stagnant, there was an opportunity for Chinese producers to gain market share, both of the U.S. import market and the global market.
Figure 17: Chinese Competition with U.S. Exports
Source: U.S. International Trade Commission Dataweb.
Data for Figure 17
| HS Code | 2000 | 2007 |
|---|---|---|
| 8542 | 54.09808 | 41.58776 |
| 8708 | 30.99461 | 34.57804 |
| 8471 | 30.92929 | 24.30857 |
| 8802 | 25.3252 | 53.50371 |
| 8473 | 24.64877 | 15.65774 |
| 8703 | 17.23369 | 44.79258 |
| 9880 | 15.70685 | 26.91253 |
| 8411 | 15.60753 | 27.15228 |
| 8803 | 15.23914 | 21.95535 |
| 8517 | 12.89104 | 18.3539 |
| 8479 | 12.27859 | 6.314796 |
| 9018 | 9.100666 | 17.25416 |
| 8525 | 7.711569 | 4.626867 |
| 8431 | 7.353828 | 15.87453 |
| 9030 | 7.165229 | 6.257367 |
| 2710 | 7.106752 | 26.73326 |
| 8536 | 6.820582 | 8.091127 |
| 8704 | 6.608101 | 13.70651 |
| 8407 | 6.51329 | 6.870782 |
| 3004 | 6.500089 | 16.48099 |
| 8541 | 5.910817 | 8.170474 |
| 8544 | 5.874838 | 7.04294 |
| 1201 | 5.312705 | 10.01622 |
| 7108 | 5.292628 | 11.79211 |
| 8529 | 5.160715 | 5.055722 |
| 1005 | 4.713944 | 10.0999 |
| 8409 | 4.591543 | 5.094469 |
| 3926 | 4.385503 | 4.530331 |
| 7102 | 4.238377 | 11.91136 |
| 8504 | 4.233916 | 4.369901 |
| 8414 | 3.76683 | 5.323414 |
| 8421 | 3.755258 | 6.094264 |
| 8481 | 3.502823 | 6.281801 |
| 9027 | 3.42197 | 6.082227 |
| 1001 | 3.387501 | 8.344748 |
| 9032 | 3.343455 | 3.286943 |
| 9031 | 3.325472 | 4.916007 |
| 8413 | 3.270053 | 5.54887 |
| 3907 | 3.050432 | 5.152346 |
| 3920 | 2.943871 | 3.804439 |
| 9401 | 2.939105 | 3.297619 |
| 9001 | 2.798714 | 2.76355 |
| 3901 | 2.698302 | 6.443451 |
| 4703 | 2.695868 | 3.621009 |
| 9701 | 2.679905 | 5.581577 |
| 3923 | 2.671371 | 4.073722 |
| 8543 | 2.670514 | 3.708941 |
| 7326 | 2.639244 | 3.071137 |
| 8408 | 2.595114 | 4.820822 |
| 8701 | 2.592573 | 4.860597 |
| 9021 | 2.521667 | 6.502778 |
| 3100 | 2.485444 | 3.741922 |
| 3822 | 2.475201 | 4.137121 |
| 4011 | 2.413462 | 3.573826 |
| 9801 | 2.352621 | 4.074527 |
| 8429 | 2.263788 | 5.923723 |
| 8418 | 2.255467 | 2.755958 |
| 3002 | 2.215488 | 8.752614 |
| 2933 | 2.192101 | 4.169998 |
| 7606 | 2.157762 | 3.210091 |
| 4901 | 2.14814 | 2.634647 |
| 9403 | 2.092148 | 2.556966 |
| 8538 | 2.045393 | 2.918966 |
| 2701 | 2.044477 | 4.161278 |
| 8518 | 2.016651 | 2.375267 |
| 9013 | 2.013233 | 2.101809 |
| 4804 | 1.951295 | 2.77302 |
| 5201 | 1.91489 | 4.580338 |
| 2902 | 1.899506 | 4.826869 |
| 8419 | 1.864042 | 2.993625 |
| 8483 | 1.787603 | 3.092921 |
| 207 | 1.784064 | 3.259545 |
| 2106 | 1.684361 | 2.974067 |
| 9022 | 1.671615 | 3.416548 |
| 8523 | 1.588085 | 5.969436 |
| 8424 | 1.552854 | 2.574898 |
| 7110 | 1.528383 | 3.900049 |
| 8501 | 1.516361 | 2.442179 |
| 8433 | 1.512094 | 2.697578 |
| 3824 | 1.502897 | 3.186087 |
| 8528 | 1.474621 | 3.643175 |
| 8537 | 1.460521 | 2.907322 |
| 4002 | 1.371469 | 2.981997 |
| 7112 | 1.360225 | 4.987 |
| 3902 | 1.359503 | 3.931721 |
| 7113 | 1.333582 | 4.470029 |
| 2711 | 1.299678 | 4.61399 |
| 3304 | 1.276407 | 2.666729 |
| 9026 | 1.259952 | 2.534374 |
| 203 | 1.251927 | 2.487563 |
| 8443 | 1.245641 | 6.120288 |
| 4707 | 1.24299 | 2.775561 |
| 8716 | 1.169879 | 2.955991 |
| 9504 | 1.169762 | 4.20705 |
| 2844 | 1.150434 | 2.38605 |
| 7204 | 1.005763 | 6.964051 |
| 802 | 0.998778 | 2.775726 |
| 8502 | 0.781087 | 2.533465 |
| 7404 | 0.544812 | 2.927775 |
| 7602 | 0.49683 | 2.994806 |
| 8486 | 0 | 9.180212 |
The welfare implications for the United States of the increase in Chinese exports is beyond the scope of this paper, but it is important to note that it is not at all clear that the costs outweighed the benefits. Although the loss of manufacturing jobs is obviously costly to those individuals, the benefits to society included lower prices, more rapid adoption of new technology, and efficiency gains from the removal of trade barriers and through increased competition. Kamin et al (2006) estimated that for every percentage point increase in China's import share, U.S. import price inflation was reduced by about 1 percentage point. According to this estimate, the increase in China's import share between 2000 and 2007 reduced the 2007 level of import prices by about 8 percent. The United States also appears to have efficiently reallocated its labor resources, with economy-wide job growth sufficient to push the unemployment rate in 2007 down to well below its average of the 1990s and within ½ percentage point of its all-time low in early 2000, even as the manufacturing sector shed workers.
Section 4: Implications for the Future
In the aftermath of the global financial crisis, U.S. investment has been lackluster. Like in the early part of the 2000s, the stock of high-tech fixed capital fell in 2009 and 2010.19 This may once again open the door for new technologies to be dominated by foreign producers. The IMF and others project China's trade surplus will again surge. For example, in its 2011 Article IV for China, the IMF projected that Chinese exports will more than double from $1.6 trillion in 2010 to $4.2 trillion in 2016. But which sectors will generate this growth and to whom will these goods go?
For apparel, furniture, and steel, it is unlikely that China will be able to repeat the massive surge in exports experienced earlier this decade. China now has a high market share in these categories and the categories themselves are unlikely to experience tremendous global growth.For high-tech products, China may be able to repeat its success, but it will be difficult. For example, China already produces most of the world's laptops. For some of the products discussed in this paper, there may be some room for China to increase market share further, but China's ability to gain additional market share in these now more mature markets, with more established players, is far from certain. Although China retains the draw of its huge domestic market, recent increases in wages have likely eroded, at least to a degree, its cost advantage relative to its neighboring emerging market economies. When the next product comes along that is adopted quickly and globally, such as the cell phone, it is not clear that China will be the country best positioned to dominate the market.
A final point is that, no matter the sector, there must be an importer on the other side of China's exports. If Chinese exports increase by $2.6 trillion, then the rest of the world's imports must also increase by that sum. This notion often gets swept under the carpet. For example, the IMF's April 2011 WEO projects the current account surplus of the emerging and developing economies will increase by more than $520 billion between 2010 and 2016 but that the deficit in the advanced economies will increase by only $200 billion--the majority of the burgeoning surplus in the emerging markets is added to the statistical discrepancy.
Section 5: Conclusion
This paper examines the underlying causes of China's rapid growth of exports over the past decade. An undervalued exchange rate likely contributed to a degree, but export growth was relatively concentrated in select industries when one would expect the exchange rate to have a broader impact. Labor-intensive industries such as apparel, textiles, and furniture, benefited from China's WTO ascension. The apparel and textile industries saw massive gains following the expiration of multilateral agreements which had limited China's exports. Capital and energy-intensive industries, particularly iron and steel, benefited from government subsidies. These industries also benefited from Chinese reforms that led to state-owned enterprises becoming increasingly profitable. These profits, retained by the SOEs, resulted in an expansion of capacity and production beyond the domestic market's ability to absorb it.
These explanations, however, can take one only so far, as nearly half of Chinese export growth occurred in the "machinery" categories. It is only by examining more detailed Chinese trade data that one can see that this growth was heavily concentrated in a few specific high-tech products--cell phones, laptops, liquid crystal displays, and integrated electronic circuits. China was able to rapidly increase its exports of these products because of: industrial policy, such as science parks, that specifically encouraged these types of exports; an explosion in global demand for these products, with Chinese domestic demand leading the way; and, finally, a sharp fall in U.S. high-tech fixed investment, which contributed to China's ability to dominate these new technologies.
Further, this expansion of Chinese exports led to a decline in manufacturing share of the advanced economies, and in many cases a decline in manufacturing employment. We show that Chinese exports can help account for a significant portion of U.S. job losses at the industry level, but that macroeconomic fundamentals explain the majority of the fall in U.S. manufacturing employment between 2000 and 2007. Also, as we have noted earlier, quite a number of the jobs lost over this period, particularly in the textile, apparel, and furniture industries, would have moved to China earlier, owing to its natural comparative advantage in labor-intensive production, if not for protective tariffs and trade agreements. Chinese industrial policy aided the country's exports of high-tech goods, but China was also able to gain a competitive position in key products because it invested heavily at a time of burgeoning global demand for these products and diminished U.S. investment.
References
Ahmed, Shaghil (2009), "Are Chinese Exports Sensitive to Changes in the Exchange Rate?" International Finance Discusion Papers, 987.
Amiti, Mary and Caroline Freund (2010), "The Anatomy of China's Export Growth," in China's Growing Role in World Trade, editors Robert C. Feenstra and Shang-Jin Wei, University of Chicago Press.
Brambilla, Irene, Amit K. Khandelwal, and Peter K. Schott (2010), "China's Experience under the Multi-Fiber Arrangement (MFA) and the Agreement on Textiles and Clothing (ATC)," in China's Growing Role in World Trade, editors Robert C. Feenstra and Shang-Jin Wei, University of Chicago Press.
Cheung, Yin-Wong, Menzie Chin, and Eiji Fujii (2010), "China's Current Account and Exchange Rate," in China's Growing Role in World Trade, editors Robert C. Feenstra and Shang-Jin Wei, University of Chicago Press.
Congressional Budget Office, "How Changes in the Value of the Chinese Currency Affect U.S. Imports," Congressional Budget Office, July 2008.
Hsieh, Chang-Tai and Peter J. Klenow (2009), "Misallocation and Manufacturing TFP in China and India," The Quarterly Journal of Economics, Vol. 124, Iss. 4.
Kamin, Steven B., Mario Marazzi, and John W. Schindler (2006). "The Impact of Chinese Exports on Global Import Prices," Review of International Economics, Vol 14, No. 2, pp. 179-201.
Marquez, Jaime and John Schindler (2007), "Exchange-rate Effects on China's Trade," Review of International Economics, Vol. 15, Iss. 5.
Rodrik, Dani (2006), "What's So Special about China's Exports?" China & World Economy, Vol. 14, No. 5.
Sutherland, Dylan (2005). "China's Science Parks: Prodcution Bases or a Tool for Instituional Reform?" Asia Pacific Business Review, Vol 11, No. 1, pp 83-104.
Thorbecke, Willem and Gordon Smith (2010), "How Would an Appreciation of the Renminbi and Other East Asian Currencies Affect China's Exports," Review of International Economics, Vol. 18, Iss. 1.
Footnotes
** The authors are economists in the International Finance Division of the Federal Reserve Board. The views in this paper are solely the responsibility of the authors and should not be interpreted as reflecting the views of the Board of Governors of the Federal Reserve System or of any other person associated with the Federal Reserve System. Return to text
1. Exports and GDP measured in U.S. dollars at market exchange rates. Return to text
2. This section includes HS categories 42, 51, 52, 58, 60, 61, 62, 63, 64, 94 Return to text
3. The metals section includes HS categories 28, 72, 73, 74, 76, 79, 83. Return to text
4. Based on data from the World Steel Association (www.worldsteel.org), Steel Statistical Yearbook 2009. Return to text
5. http://www.eia.doe.gov/emeu/mecs/mecs2006/2006tables.html (Tables 1.1 and 6.3) Return to text
6. The machinery section includes HS categories 84 and 85. Return to text
7. In this section we use data from the China Customs Statistical Yearbooks for 2002 and 2007. Return to text
8. Laptop sales data from Computer Industry Almanac (www.c-i-a.com/pr0707) and Gartner (http://www.gartner.com/it/products/newsroom/index.jsp) Return to text
9. International Data Corporation (IDC). http://www.idc.com/getdoc.jsp?sessionId=&containerId=prUS22383910 Return to text
10. http://english.peoopledaily.com.cn/200401/08/print20040108_132140.html Return to text
11. Computer Industry Almanac. www.c-i-a.com/pr0608.htm. www.c-i-a.com/pr0701.htm. Return to text
12. International Telecommunications Union. http://www.itu.int/en/pages/default.aspx Return to text
13. "China's Burgeoning Mobile Phone Industry," China Daily, September 2003. http://www.chinatoday.com.cn/English/e2003/e20039/9p12.htm Return to text
14. Includes HS 8517 for all years and 852520 for 2000-2006. Return to text
15. Display Search. http://www.displaysearch.com/cps/rde/xchg/displaysearch/hs.xsl/index.asp Return to text
16. http://spectrum.ieee.org/semiconductors/design/the-new-economics-of-semiconductor-manufacturing Return to text
17. U.N. Statistics. Value-added in U.S. dollars by economic activity at constant 2005 prices. Return to text
18. The same exercise done in-sample produces essentially the same result. Return to text
19. Source U.S. Department of Commerce, Bureau of Economic Analysis. Current-cost net stock of private fixed assets in the computer and electronic products industry. Return to text
This version is optimized for use by screen readers. Descriptions for all mathematical expressions are provided in LaTex format. A printable pdf version is available. Return to text