
Release Date: June 17, 2003
Release dates | Historical data | Documentation
Current Monthly Release Other formats: ASCII | PDF (144 KB)
Supplemental Monthly Release Other formats: ASCII | PDF (144 KB)
Annual Revision Release Other formats: ASCII | PDF (150 KB)
INDUSTRIAL PRODUCTION AND CAPACITY UTILIZATION
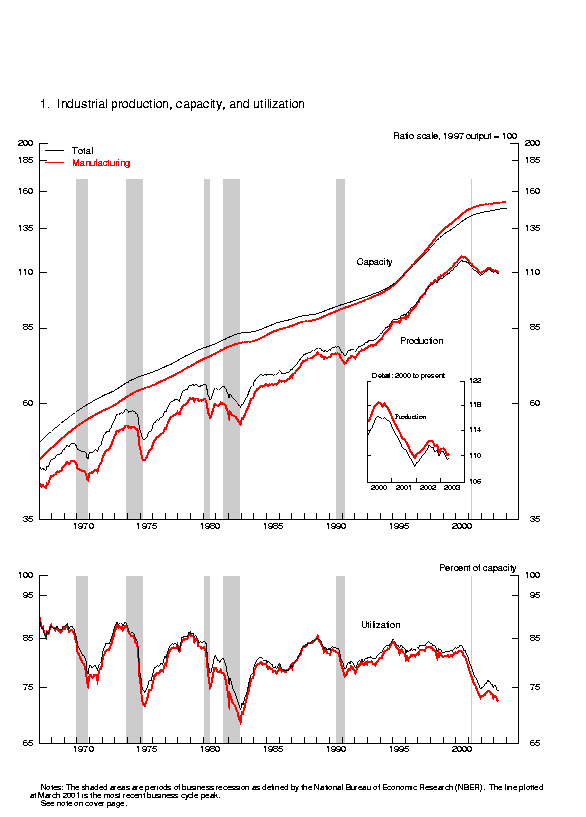
Industrial production edged up 0.1 percent in May after having fallen 0.6 percent in both March and April. At 109.6 percent of its 1997 average, industrial output was 0.8 percent lower than its level in May 2002. Manufacturing output, which declined 0.7 percent in April, increased 0.2 percent in May. The production in mining increased 0.8 percent, while the output at utilities decreased 0.8 percent. Capacity utilization for total industry was unchanged at 74.3 percent, a rate 7 percentage points below its 1972-2002 average.
 INDUSTRIAL PRODUCTION AND CAPACITY UTILIZATION:  SUMMARY
 Seasonally adjusted
 --------------------------------------------------------------------------------------------------------------------------------------
                                  |                    1997=100                     |                  Percent change
                                  | ----------------------------------------------- | -------------------------------------------------
                                  |       2003                                      |   2003                          |     May '02 to
 Industrial production            |       Feb.        Mar.        Apr.         May  |   Feb.    Mar.    Apr.     May  |      May '03
 --------------------------------------------------------------------------------------------------------------------------------------
                                  |                                                 |                                 |
  Total index                     |      110.7       110.1       109.4       109.6  |     .1     -.6     -.6      .1  |            -.8
     Previous estimates           |      110.7       110.2       109.7              |     .0     -.5     -.5          |
                                  |                                                 |                                 |
  Major market groups             |                                                 |                                 |
  Final Products                  |      107.2       106.8       106.2       106.2  |     .1     -.4     -.6      .0  |            -.9
     Consumer goods               |      107.8       107.3       106.6       106.5  |     .0     -.4     -.7     -.1  |            -.8
     Business equipment           |      105.9       105.5       104.9       104.9  |     .2     -.3     -.6      .0  |           -2.8
  Nonindustrial supplies          |      114.7       113.8       112.8       113.1  |     .3     -.8     -.8      .2  |           -1.3
     Construction                 |      101.8       101.4       100.5       100.8  |    -.4     -.5     -.9      .3  |           -3.6
  Materials                       |      112.8       112.0       111.5       111.7  |    -.1     -.7     -.5      .2  |            -.4
                                  |                                                 |                                 |
  Major industry groups           |                                                 |                                 |
  Manufacturing (see note below)  |      111.1       110.9       110.1       110.3  |     .0     -.2     -.7      .2  |           -1.0
     Previous estimates           |      111.0       110.9       110.2              |    -.1     -.1     -.6          |
  Mining                          |       92.8        92.8        93.1        93.9  |    -.8     -.1      .4      .8  |             .5
  Utilities                       |      116.3       111.7       111.8       111.0  |    1.2    -4.0      .1     -.8  |             .8
 --------------------------------------------------------------------------------------------------------------------------------------
                                  |                                                                                   |    Capacity
                                  |                                Percent of capacity                                |     growth
                                  | --------------------------------------------------------------------------------- | ---------------
                                  |     Average        1982     1988-89       2002  |   2003                          |     May '02 to
 Capacity utilization             |  1972-2002          Low        High        May  |   Feb.    Mar.    Apr.     May  |      May '03
 --------------------------------------------------------------------------------------------------------------------------------------
                                  |                                                 |                                 |
  Total industry                  |       81.3        70.8        85.1        75.7  |   75.3    74.8    74.3    74.3  |            1.1
     Previous estimates           |                                                 |   75.3    74.8    74.4          |
                                  |                                                 |                                 |
  Manufacturing (see note below)  |       80.2        68.6        85.6        73.9  |   73.3    73.1    72.5    72.6  |             .7
     Previous estimates           |                                                 |   73.2    73.0    72.5          |
  Mining                          |       86.9        78.6        85.6        84.8  |   84.1    84.1    84.3    85.0  |             .2
  Utilities                       |       86.7        77.2        92.6        87.7  |   88.4    84.6    84.3    83.4  |            6.0
                                  |                                                 |                                 |
  Stage-of-process groups         |                                                 |                                 |
  Crude                           |       86.4        77.2        88.6        83.5  |   82.5    82.7    82.3    82.6  |            -.3
  Primary and semifinished        |       82.2        67.9        86.2        77.8  |   77.9    77.0    76.4    76.5  |            1.4
  Finished                        |       78.5        71.3        83.1        71.5  |   70.7    70.5    70.0    70.0  |             .8
 --------------------------------------------------------------------------------------------------------------------------------------
 r  Revised.  p  Preliminary.
        The statistics in this release cover output, capacity, and capacity utilization in the
 industrial sector, which the Federal Reserve defines as manufacturing, mining, and electric and
 gas utilities.  Manufacturing comprises those industries included in the North American Industry
 Classification System, or NAICS, manufacturing plus the logging and newspaper, periodical,
 book and directory publishing industries that have traditionally been considered manufacturing and included
 in the industrial sector.
Market Groups
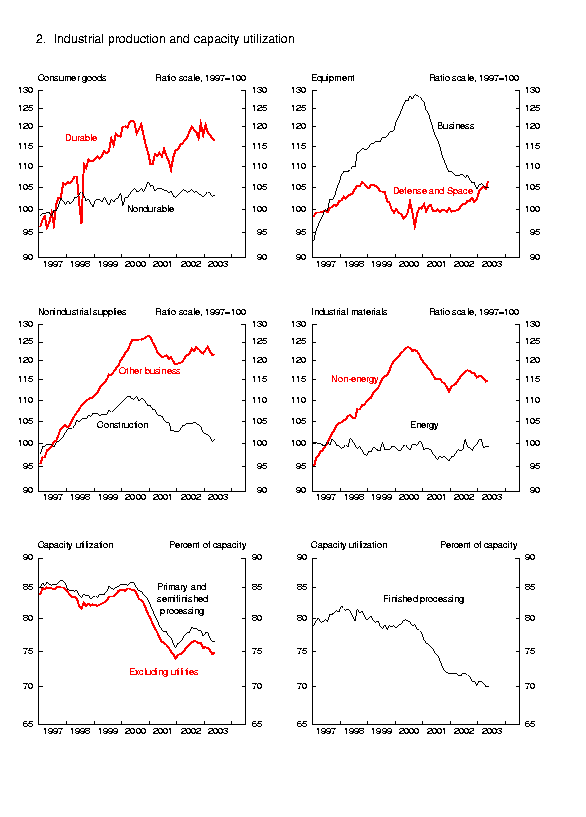
A 0.1 percent decline in the output of consumer goods in May was driven by a 0.5 percent decline in the production of durable goods. The output of nondurable consumer goods was unchanged. Among durable goods, gains in appliances, furniture, and carpets were more than offset by a decline in automotive products. Within nondurables, the output of consumer paper products rose and the production of consumer chemicals and clothing declined further.
The index for business equipment output was unchanged in May. An increase in the production of information processing equipment was offset by declines in the output of transit equipment and of industrial and other equipment. The sharp bounceback in the production of defense and space equipment partly reflected the end of a strike at a major military aircraft producer.
The output of construction supplies posted its first increase since last summer. The production of materials rose 0.2 percent. The output of durable materials increased 0.4 percent and was led by increases in equipment parts. Among nondurable materials, which fell 0.1 percent, textile materials and chemical materials declined. The output of energy materials rose 0.2 percent.
Industry Groups
Manufacturing output edged up 0.2 percent in May after two consecutive months of decline. Durable goods production increased 0.2 percent, and nondurable goods production edged up 0.1 percent. In durable goods manufacturing, gains in the production of computer and electronic products, fabricated metal products, and nonmetallic mineral products were partially offset by declines in the production of motor vehicles and parts and of primary metal products. Capacity utilization in manufacturing was 72.6 percent, up 0.1 percentage point from April but 7.6 percentage points below its 1972-2002 average.
Output at mines rose for a second month in May, with gains across all major categories. Capacity utilization in mining rose 0.7 percentage point, to 85.0 percent. Utility output declined 0.8 percent in May, and utilization slipped to 83.3 percent.
By stage of processing, capacity utilization for industries in the crude stage of processing rose 0.3 percentage point, to 82.6 percent. Capacity utilization for the industries in the primary and semifinished stage ticked up 0.1 percentage point, to 76.5 percent, and capacity utilization for industries in the finished goods stage was unchanged, at 70.0 percent.
Note: This release includes revised estimates of industry capacity in 2003. The rate of change in industrial capacity in 2003 was marked down 1/2 percentage point and primarily reflects weaker estimates for capital spending by manufacturers this year.
G.17 Release Tables:
| Ascii | Screen reader | Summary: Industrial Production and Capacity Utilization | Chart | Chart 1: Industrial Production, Capacity, and Capacity Utilization | Chart | Chart 2: Industrial Production and Capacity Utilization | Chart | Chart 3: Industrial Production and Capacity Utilization, High Technology Industries |
| Ascii | Screen reader | Table 1:Industrial Production: Market and Industry Groups (percent change) |
| Ascii | Screen reader | Table 2:Industrial Production: Special Aggregates and Selected Detail (percent change) |
| Ascii | Screen reader | Table 3: Motor Vehicle Assemblies |
| Ascii | Screen reader | Table 4: Industrial Production Indexes: Market and Industry Group Summary |
| Ascii | Screen reader | Table 5: Industrial Production Indexes: Special Aggregates |
| Ascii | Screen reader | Table 6: Diffusion Indexes of Industrial Production |
| Ascii | Screen reader | Table 7: Capacity Utilization: Manufacturing, Mining, and Utilities |
| Ascii | Screen reader | Table 8: Industrial Capacity: Manufacturing, Mining, and Utilities (percent change) |
| Ascii | Screen reader | Table 9: Industrial Production: Gross Value of Products |
| Ascii | Screen reader | Table 10: Gross-Value-Weighted Industrial Production: Stage-of-Process Groups |
| Ascii | Screen reader | Table 11: Electric Power Use: Manufacturing and Mining |
| Ascii | Screen reader | Table 12: Historical Statistics for IP, Capacity, and Utilization: Total Industry |
| Ascii | Screen reader | Table 13: Historical Statistics for IP, Capacity, and Utilization: Manufacturing |
| Ascii | Screen reader | Table 14: Historical Statistics for IP, Capacity, and Utilization: Total Industry excluding Selected High-Technology Industries |
| Ascii | Screen reader | Table 15: Historical Statistics for IP, Capacity, and Utilization: Manufacturing excluding Selected High-Technology Industries |
Release dates | Historical data | Documentation
Current Monthly Release Other formats: ASCII | PDF (144 KB)
Supplemental Monthly Release Other formats: ASCII | PDF (144 KB)
Annual Revision Release Other formats: ASCII | PDF (150 KB)