FEDS Notes
February 01, 2019
Are Disappearing Employer Pensions Contributing to Rising Wealth Inequality?
John Sabelhaus and Alice Henriques Volz*
This note was revised on November 7, 2019, to correct an error that results in new estimates appearing in table 1 and in figures 3 through 6.
The share of U.S. workers covered by a traditional employer-sponsored pension plan has declined dramatically over the past few decades. Fewer jobs today have any form of employer-sponsored retirement plan coverage, and those jobs that do have coverage are much more likely to come with contributory retirement plans such as a 401(k). Even some public sector jobs--once the bastion of the traditional employer pensions--are seeing shifts in coverage, especially for newly hired employees.1 A natural concern is that wealth inequality has increased more than it would have in a counterfactual world in which traditional pension coverage did not decrease. In fact, that is the conclusion reached by some researchers who have looked at the distributional implications of shifting pension coverage.2 The implication of shifting pension coverage for overall wealth inequality is made even more intriguing because the wealth associated with employer-sponsored retirement plans has risen at the same time coverage was falling, from just over 20 percent of household net worth three decades ago to around 35 percent in recent years.
The net impact of shifting employer pensions on overall wealth inequality depends on how the different types of retirement wealth vary across the population, and how those retirement wealth distributions have shifted over time. Using data from the Federal Reserve's Survey of Consumer Finances (SCF) for the years 1989 through 2016, we show that traditional employer pensions and account-type retirement plan holdings are both highly concentrated at the top of the wealth distribution. The share of combined retirement assets held by the top wealth quartile was around two thirds in 1989, and that share increased by about 10 percentage points between 1989 and 2016. While we confirm here that trends in employer-sponsored retirement plans negatively impacted families outside the top wealth quartile, the limited effect primarily impacts families in the third quartile of the wealth distribution, who saw their share of total retirement plan wealth fall from about 25 percent to about 17 percent. The entire bottom half of the wealth distribution had a very small share of total retirement assets in 1989--only about 7 percent--and that share fell to about 4 percent by 2016.
Focusing our attention on families close to retirement, we consider the interplay between employer-sponsored retirement wealth and Social Security. We show that the only segment of the population for whom employer-sponsored retirement wealth is significantly more important than Social Security is the top wealth quartile. In the second highest wealth quartile, employer-sponsored plans and Social Security each account for about half of total retirement wealth, and in the bottom half of the wealth distribution, Social Security dominates employer-sponsored retirement plans by a wide margin. Although the assets associated with employer-sponsored retirement plans accounted for 35 percent of total household wealth in 2016, the wealth equivalent of future Social Security benefits for all workers was roughly twice the size of all employer-sponsored retirement plan assets in that year. The progressive nature of Social Security offsets the high degree of concentration in employer-sponsored retirement wealth, and thus the ratio of total retirement wealth to pre-retirement income is roughly constant across the wealth distribution. In that sense, Social Security is the traditional pension that allows most families to maintain their pre-retirement standard of living after they retire.
Trends in Employer-Sponsored Retirement Coverage
Our starting point for analyzing the connection between retirement plans and wealth inequality is to look at trends in employer-sponsored retirement plan coverage over time.3 Employer-sponsored retirement plans typically come in one of two forms, the traditional defined benefit (DB) plan and the now ubiquitous defined contribution (DC) plan. Traditional DB plans provide a beneficiary with a promised income stream from retirement until death, and adequately funding those promised benefits is the responsibility of the employer. The most prevalent type of DC plan is the 401(k), though other employer plans such as the 403(b) are also very common. There is substantial variation across those plans, though the contribution levels, portfolio allocation, and withdrawal decisions are generally the responsibility of the participant. Thus, the trend towards DC plans can be (and often is) characterized as shifting the risk associated with providing adequate retirement income from employers to employees.4
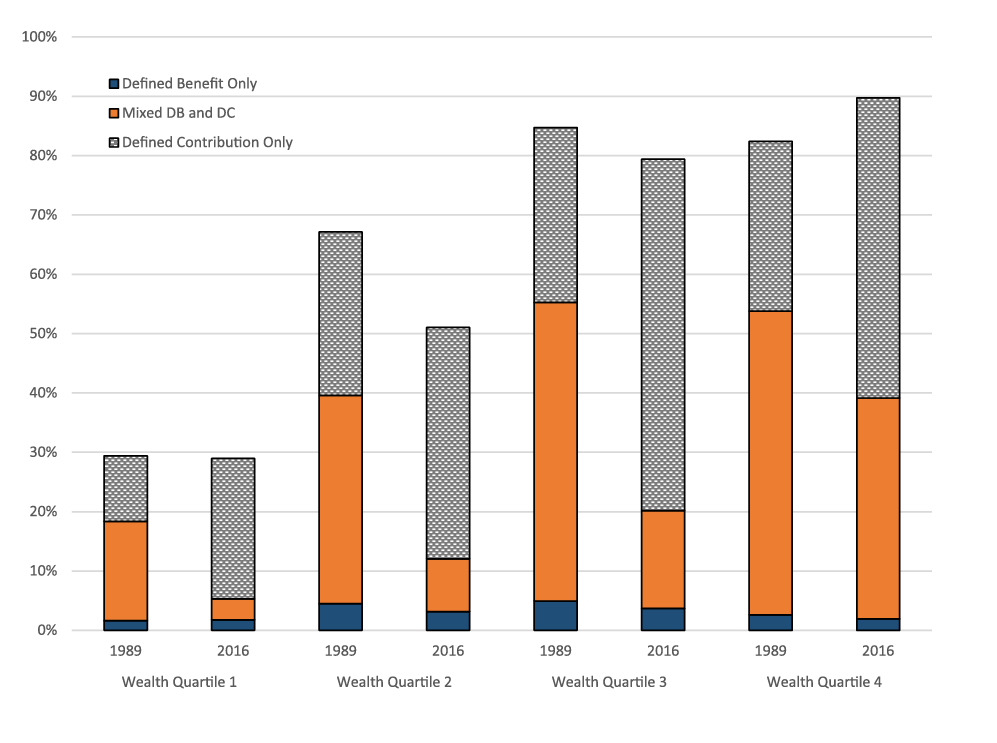
Note: Key identifies bar segments in order from bottom to top.
Source: Federal Reserve Board, Survey of Consumer Finances.
Figure 1 shows the shift from DB to DC coverage among working age families across the four quartiles of the wealth distribution over the past three decades.5 The overall height of each bar shows total employer-sponsored retirement plan coverage (percent of households with a worker participating in a plan) in each wealth group for the beginning and end of our sample period, 1989 and 2016. In general, retirement plan coverage increases with wealth in any given year, and the reduction in overall coverage has occurred in the bottom half of the wealth distribution, most notably the second wealth quartile. As of 2016, working families in the top half of the wealth distribution had a coverage rate of about 80 percent, roughly double the coverage rate in the bottom half of the wealth distribution.
The common and dramatic shift in retirement plan coverage across all workers is the decline in DB and offsetting increase in DC. In 1989, most employers who offered DB plans also offered some sort of DC coverage, and thus the bottom portion of each bar--workers with only DB coverage--was already smaller than it had been in earlier decades when DC plans were much less common.6 The important trend for most workers over the past three decades is the gradual elimination of the DB component of the mixed DB and DC plans, represented by the middle portion of each bar. In every wealth group, the mixed DB and DC coverage was replaced by DC-only coverage, which is represented by the top portion of each bar. Thus, the disappearing traditional DB pension is a widespread phenomenon, affecting all wealth groups (relative to their respective 1989 starting points) in similar ways.
Trends in Aggregate Retirement Wealth
In order to transition from retirement plan coverage to retirement wealth, we need to consider first the appropriate retirement wealth measure. In the case of contributory DC-type retirement plans, the answer is simple because retirement wealth is just the sum of account balances in 401(k), Individual Retirement Account (IRA), and similar retirement saving plans.7 Those account balances are measured directly in the SCF data, and thus we have the appropriate concept directly from the survey.8 DB plans are more complicated, though, because the wealth associated with such plans is the discounted present value of the expected stream of benefits that workers will receive from the plans at some point in the future. There are, however, various ways to think about exactly what the present value of DB benefits should be capturing, and for that, we first turn to how DB wealth is measured in the Financial Accounts of the United States (FA). 9
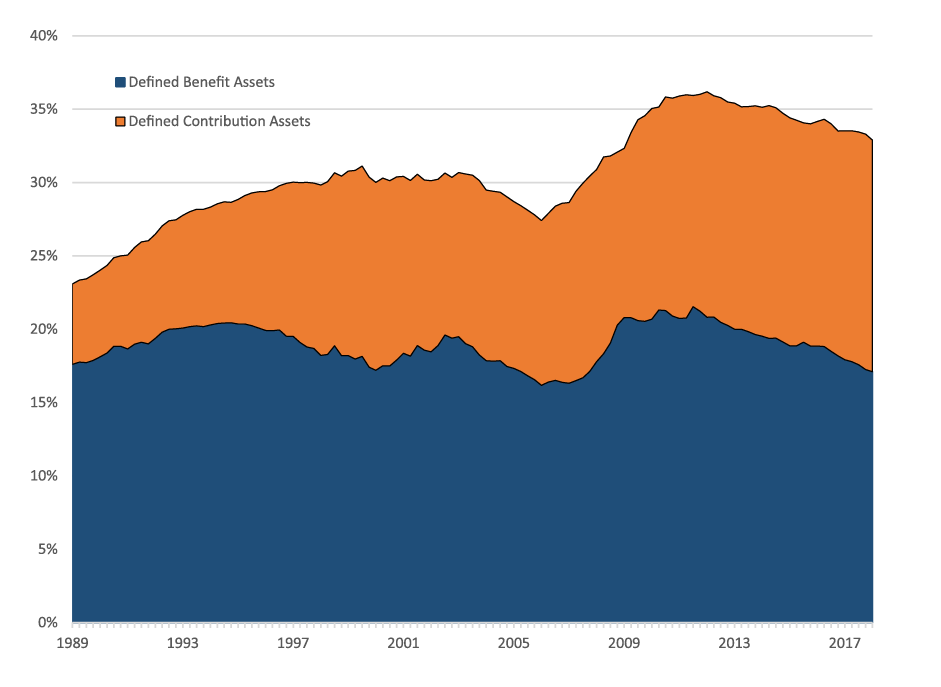
Note: Key identifies regions in order from bottom to top.
Source: Financial Accounts of the United States, Tables B.101 and L.117.
One of the entries on the asset side of the FA household sector ledger is the combined value of DC account balances plus the present value of future DB pension benefits, referred to as pension entitlements.10 As shown in figure 2, even though DB coverage is declining, DB assets have grown in line with the other components of household net worth, and thus the DB share has remained between 15 and 20 percent of total net worth over the past three decades. DC balances have grown much faster, rising from about 5 percent of household net worth in 1989 to roughly 15 percent of the total in recent years. In total, retirement assets have grown faster than other household wealth components, and the retirement asset share is up from just over 20 percent three decades ago around 35 percent in recent years.
The DC component of FA assets is simply current account balances, but the DB wealth in the FA is an estimate based on actuarial and legal principles. DB plan sponsors are legally required to hold enough financial assets (such as cash, stocks, and bonds) to pay the benefits that workers have earned the right to receive in the future. In the FA, the positive DB entitlement entries for households have exactly offsetting entries on the liabilities side of business and government ledgers, because those sectors (they are the employers) are responsible to pay those future DB benefits.11 However, the FA measure of future benefits earned to date are not necessarily what any given worker (or even many economists) might view as the appropriate concept for the present value of a given DB pension. The expected benefit from the worker's perspective is more likely to be a calculation that factors in how long they expect to continue to work along with their expected future earnings, which together will determine what they ultimately receive from the pension. Thus, the FA measure is a generally narrower concept of wealth, capturing only what the DB plan sponsors legally owe workers at a specific point in time.
Estimating DB Retirement Wealth for SCF Families
The SCF collects comprehensive detailed information about retirement plans associated with current and past jobs of the respondent and their spouse or partner. Information about account-type, DC plans and IRAs is collected in the form of direct wealth measures, because the retirement account balance reflects the current value of the underlying financial assets. There is no analogous respondent-reported wealth measure for DB retirement plans in the SCF.12 In a survey, the value of a DB pension is captured as either current benefits that will continue to be paid in the future or expectations about future benefits that have not yet been initiated. The measure of wealth we want for our comprehensive household balance sheet is the present value of those future DB benefits, which is equivalent to the financial assets held now that will be liquidated over time to pay the promised stream of DB benefits when those liabilities come due. That is precisely the FA measure of DB pension wealth described in the previous section.
The SCF collects details about DB pension benefits in three different survey modules.13 The three categories cover DB benefits already being received, DB benefits associated with a past job where the known benefit amount will be received at a specific future date, and DB benefits associated with a current job, where the ultimate benefit will depend on how much longer the worker is covered by the plan and their final salary. The survey questions about currently received benefits and expected benefits from past-job pensions are standard. The respondent is simply asked how much is currently being received, or how much will be received when the benefit begins.14 For our purposes, these streams of benefit payments are the input to an actuarial present-value calculation that also involves an assumed interest rate and respondents' expected longevity.15 This present value calculation is the level of financial assets that the retirement plan sponsor must hold to pay promised benefits and, thus, corresponds directly to the household wealth measure we are trying to capture. In total, these present value calculations for SCF respondents indicate that about 40 percent of the aggregate DB pension assets in the FA is attributable to the promised benefits of currently receiving and past-job pensioners, and thus the remainder is accounted for workers still in the jobs for which they are accumulating the rights to future DB benefits.
Calculating DB pension wealth for workers covered by a plan on their current job is more complicated than for the first two cases, because the benefit that will eventually be received is unknown as of the survey date, and in any event, that benefit is likely different from the FA concept we are trying to match. The SCF asks a series of questions about current job DB pensions, including how long the worker has been in the plan, when they expect to receive benefits, and how much they expect to receive after benefit payments begin. These questions make it possible to construct a few different measures of what the stream of future benefits represents in present value. For example, it is possible to compute the present value of the future benefit stream assuming the worker remains in the job until his or her expected retirement age, for a given projected final salary, and under the assumption that the worker knows and reports values consistent with the actual benefit formula in the survey. DB benefit formulas are generally based on a complicated combination of years of service and average "high" salary, and those formulas are generally beyond the grasp of survey participants. However, if constructed properly, this "continuation" value of the DB pension is an important and useful concept when thinking about lifecycle financial planning.
The continuation value represents what the DB pension could be worth to the worker now, based on a series of assumptions about future employment and earnings under the current plan rules. However, the measure of DB wealth we want--the measure that corresponds to total household wealth in the FA--is the more narrow financial liability of retirement plan sponsors. Plan sponsors are not required to set aside the continuation value of a pension for every worker in their plans. Rather, DB plans are required to hold only the present value of benefits already earned by the worker, the "termination" value that corresponds to DB wealth in the FA. The termination value represents the worker's legal claim to DB wealth, because that level of assets is equivalent to the present value of benefits they will actually receive if their plan coverage ended today. The termination value of a DB pension is always less than or equal to the continuation value, and the two converge as the worker approaches retirement age, at which point they are equal by definition.16
Our approach to solving for DB pension termination values for current workers in the SCF relies on three complementary source of information. First, we know the aggregate value of DB pension assets from the FA. After subtracting the roughly 40 percent of total assets accounted for by currently received and known future benefits (described above), we know that the remainder represents the legal claims (termination values) of current job DB participants. Second, in the SCF, we know the age, accumulated years of plan coverage, earnings, and sector (private or public) of the job held by the worker. Third, we use supplemental data from Fang, Brown, and Weir (2016) from the Health and Retirement Study (HRS) to parameterize and validate our estimated person-level termination values. After building in the observable wedge between public and private sector DBs (public plans are more generous than private, relative to earnings), we use actuarial present value calculations to construct termination values based on characteristics observed for SCF respondents, then scale those to match the appropriate FA aggregates.17 With those DB termination values for SCF respondents in hand, we now have the three components of household wealth (DB, DC, and all non-retirement) needed to look at wealth inequality over time.
Is the Demise of Traditional DB Pensions Driving Increasing Wealth Concentration?
There is general agreement that U.S. wealth inequality has increased over the past few decades, though different data sources and methods do lead to some differences in the estimated magnitude and timing.18 In order to investigate the role that the shifting employer-sponsored retirement plan landscape might be playing in overall wealth inequality, we consider our three key components of household wealth, in isolation and then together. We look at how the SCF-based measures of DB wealth, DC wealth, and all other (non-retirement) wealth are distributed across wealth quartiles in 1989 and 2016, in order to isolate the contribution of each wealth component to overall wealth inequality.
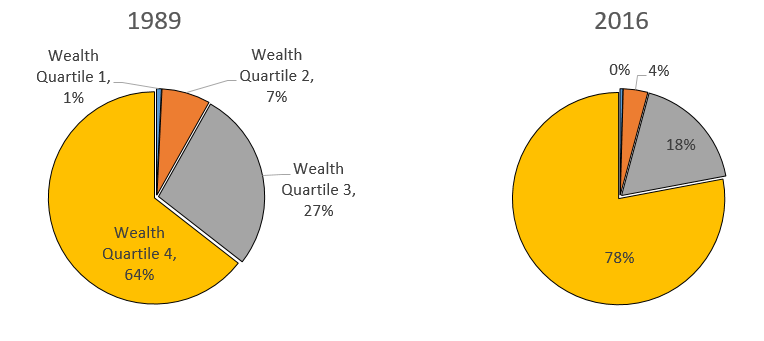
Source: Federal Reserve Board, Survey of Consumer Finances and Financial Accounts of the United States.
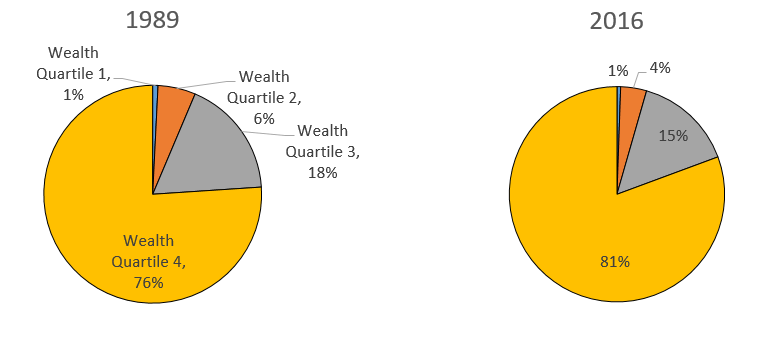
Source: Federal Reserve Board, Survey of Consumer Finances.
The vast majority of both DB and DC wealth is owned by the top quartile of the wealth distribution in both 1989 and 2016, and the differences across the two types of retirement wealth are modest. Figure 3 shows that the share of DB wealth held by the top wealth quartile increased from 64 percent in 1989 to 78 percent by 2016. The corresponding top quartile share for DC plans in figure 4 was also 76 percent in 1989, and increased to 81 percent in 2016. Thus, the dramatic shifts in retirement plan coverage (figure 1) and relative growth in aggregate DC plan assets (figure 2) has had a positive but limited net impact on the share of retirement wealth owned by the top wealth quartile.
Figures 3 and 4 also show that most of the retirement wealth not owned by the top wealth quartile is also in the top half of the wealth distribution, though again, the distinction between DB and DC holdings is second order. The third wealth quartile held 27 percent of DB assets in 1989, and that fell to 18 percent by 2016, the DB to DC shift affected this group the most. The share of DC assets held by the third quartile was 18 percent in 1989, and fell slightly to 15 percent by 2016. The little remaining retirement wealth--about 7 percent of combined DB and DC in 1989 and 5 percent in 2016--is accounted for by the entire bottom half of the wealth distribution. Taken together, these observations indicate that families below the top quartile of the wealth distribution hold a disproportionately small share of retirement wealth in 2016, but that was also true, to a lesser extent, in 1989. The shift in employer-sponsored plans from DB to DC was not the key driver of increasing wealth inequality.
Source: Federal Reserve Board, Survey of Consumer Finances.
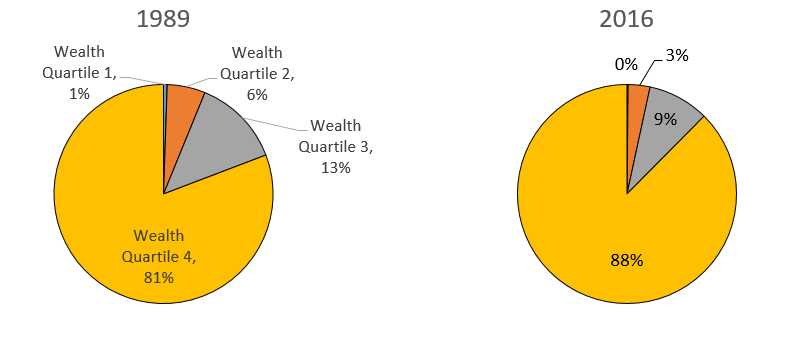
The finding that both DB and DC wealth are highly concentrated near the top of the wealth distribution (and have been for the past three decades) runs counter to the general sense that employer-sponsored retirement plans are a great wealth equalizer. That belief can be further tested by considering how all other (non-retirement) wealth varies across wealth groups, which we show in figure 5. It is indeed the case that non-retirement wealth is more concentrated than either DB or DC retirement wealth. The top quartile share of non-retirement wealth was 81 percent in 1989, and rose 7 percentage points, to 88 percent by 2016. Most of the net difference between retirement and non-retirement comes out of the third quartile share, however, whose non-retirement wealth fell from 13 percent of the total in 1989 to 9 percent in 2016. The bottom half of the wealth distribution owned only 6 percent of non-retirement wealth in 1989, and that fell to 3 percent in 2016.
Source: Federal Reserve Board, Survey of Consumer Finances and Financial Accounts of the United States.
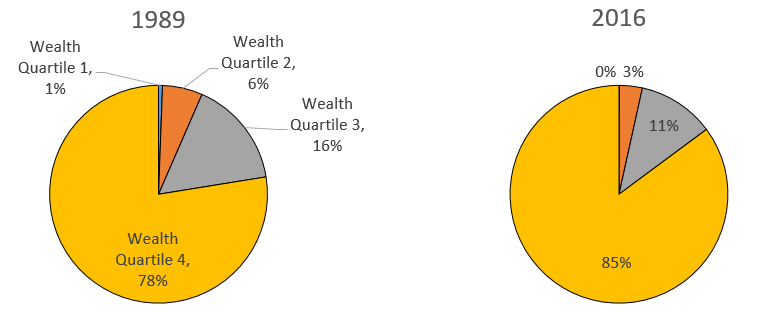
The relatively modest differentials between the distributions of retirement and non-retirement wealth suggest that overall wealth distribution will lie somewhere in between (figure 6 shows this). The overall wealth share of the top quartile increased from 78 to 85 percent in the past three decades, and the seven percentage point increase in the top wealth share is accounted for by both the third wealth quartile and the entire bottom half of the wealth distribution. The fact that the share of total wealth owned by the top wealth quartile increased roughly in line with the shares of retirement wealth owned by the top wealth quartile suggests that the shifting pension landscape neither fueled nor dampened overall wealth inequality.
The Missing Piece of the Retirement Puzzle: Social Security
The statistics on the distribution of employer-sponsored retirement wealth reported above come with a rather dire interpretation. Many families outside the top wealth quartile are not covered by an employer-sponsored plan, and those families that are covered do not tend to accumulate retirement wealth at rates anywhere near the families at the top of the wealth distribution. The disappearance of traditional employer-sponsored DB pension coverage is not the primary cause of this dire situation, however, because the share of employer-sponsored retirement wealth held by the top wealth quartile was already around two thirds in 1989. Even though, on net, holdings by those outside the top quartile fell by 13 percentage points through 2016. The headline takeaway is thus less about how the trends in type of coverage shifted wealth across the wealth distribution, and more about how the trends in type of coverage affected the type of retirement wealth held within each wealth group. Consequently, the key policy question is not about how to restore the distribution of employer-sponsored retirement wealth to a more egalitarian past. Rather, the important policy question is more about how most families outside the top quartile are able to maintain a reasonable standard of living in retirement.
Social Security is the key to understanding retirement resources for most families. Our approach to showing the interplay between Social Security and employer-sponsored plans across the wealth distribution relies on the same wealth-equivalent framework as in the previous section. In particular, we compute the wealth equivalent of future Social Security benefits using the same present value calculations employed above for DB pensions. We focus on near-retirees because we have good information on accumulated employer-sponsored retirement wealth and enough earnings history to project Social Security benefits with a fair amount of certainty.19
Social Security is perhaps best described as a government-run, mandatory, multi-employer, and progressive DB retirement plan. The Social Security system has both retirement and disability benefits, and a number of spousal and family protections that provide comprehensive income insurance for a worker and their dependents. Earnings covered by Social Security are capped at a "taxable maximum" which is currently near the 95th percentile of earnings.20 The tax and benefit calculations both ignore any earnings above the taxable maximum, so the system has very little practical meaning for the very wealthy earning well above the cap. Below the taxable maximum, the system is on net progressive. Although combined employer and employee contributions are level at 12.4 percent for all workers up to the taxable maximum, benefits are higher relative to income for lower earners. For example, recent retirees in the first lifetime income quintile receive a benefit equal to about 62 percent of their pre-retirement earnings if they claimed benefits at age 65, while a retiree in the top quintile received about 27 percent.21 These vast differences in income replacement rates are important for interpreting the distributional findings on employer-sponsored retirement above, and suggests a completely different way to think about what retirement wealth really means to most families.
Expected future Social Security benefits are not counted as wealth in published FA statistics, because the system is financed through pay-as-you-go intergenerational transfers. In any given year, younger generations work and pay the taxes used to finance the benefits paid to older retired generations. Thus, from the FA accounting perspective, there is no such thing as Social Security wealth – the system is just a social contract between generations. The fact that a Social Security trust fund currently exists right now is only because the working generations in the past few decades contributed more in taxes than they paid out in benefits to their retired parents and grandparents.22 In addition, even the modest trust fund is not part of FA household wealth, because the Social Security trust fund assets are exactly offset by general liabilities of the federal government, which in turn are the liabilities of households.
However, from the perspective of individual Social Security participants, the present value of future benefits they will receive and the present value of the taxes they will pay do in fact have a very straight-forward "retirement wealth" interpretation. Social Security wealth nets out to zero in aggregate, but at any point in time some individuals have positive Social Security wealth, while for others it is negative. The positive Social Security wealth values are associated with the individuals in or approaching retirement who have little or no taxes left to pay and are receiving or close to receiving benefits. The negative Social Security wealth values are associated with individuals early in the lifecycle who are starting to pay taxes but have many years to wait before their benefits begin. The social contract is like a non-marketable bond in that sense. A young person entering the labor force inherits a large debt from the previous generation. As that younger generation earns and makes payroll tax contributions, they are both retiring the debt they inherited and are themselves in turn accumulating an asset by issuing a new debt that future generations will be required to honor.
Acknowledging that future Social Security benefits reflect wealth across individuals is important to get a true sense of the overall distribution of retirement wealth, for two reasons. First, the expected future Social Security benefits for current workers and retirees easily dominate all of DB and DC. All employer-sponsored retirement wealth together accounts for about one-third of measured household sector net worth (see figure 2), while the present value of future Social Security benefits is estimated to be about twice the size of all employer-sponsored retirement accounts combined.23 The second reason for incorporating Social Security is distributional. In addition to being larger overall than employer-sponsored retirement plans, the progressive nature of Social Security and caps on taxes and benefits suggest that the present value of benefits (at least relative to income) are skewed towards those in the bottom half of the wealth distribution within each cohort.
Table 1: Retirement wealth for working families approaching retirement (ages 50-59) in 2016
| Wealth Quartile | Average Pre-Retirement Income | Average Wealth | Wealth/Pre-Retirement Income | ||||
|---|---|---|---|---|---|---|---|
| Employer-Sponsored Retirement Plans | Social Security Benefits | Total Retirement | Employer-sponsored Retirement Plans | Social Security Benefits | Total Retirement | ||
| 1 | $31,500 | $6,500 | $160,800 | $167,300 | 20% | 510% | 530% |
| 2 | $57,800 | $61,900 | $262,100 | $324,000 | 110% | 450% | 560% |
| 3 | $86,600 | $342,800 | $339,200 | $682,000 | 400% | 390% | 790% |
| 4 | $408,200 | $1,465,100 | $489,300 | $1,954,400 | 360% | 120% | 480% |
| All | $146,000 | $469,100 | $312,800 | $781,900 | 320% | 210% | 540% |
Source: Federal Reserve Board, Survey of Consumer Finances and Financial Accounts of the United States.
The importance of Social Security for understanding total retirement resources across the wealth distribution is demonstrated in table 1. The table shows incomes and retirement wealth for families with a head between the ages 50 and 59 in 2016.24 These working families are sorted into quartiles by total wealth, as in the previous sections, and the reported statistics are averages within each wealth group. The table shows that there are large differences in incomes across the wealth quartiles, as the average family in the top wealth group has an income more than twenty times that of the average family in the first group.25 The entries for employer-sponsored retirement wealth are the sum of DB and DC wealth described in the previous sections. The entries for Social Security wealth are the average of present value estimates for what the families in the various wealth groups will eventually receive in Social Security benefits, based on the current and past earnings of the individuals in those groups.26
The key insight from table 1 is that together employer-sponsored retirement and the Social Security system lead to ratios of total retirement wealth to pre-retirement income that do not vary substantially across wealth groups. Both forms of retirement wealth rise with wealth in absolute terms, but the present value of future Social Security benefits rise much more slowly than income, so the ratio of Social Security wealth to pre-retirement income declines with wealth. The average working family in the first wealth quartile of the 50-59 year old age group in 2016 had a Social Security wealth to pre-retirement income ratio of 7.2. That ratio falls to 5.2 for the second quartile, 4.2 for the third quartile, and 1.2 for the top quartile. This is of course just another way of saying that the Social Security system is progressive.
The most striking result of the present value wealth calculations involves the interplay between employer-sponsored wealth and Social Security across the wealth distribution. In the first wealth quartile, average Social Security wealth is more than 20 times average employer-sponsored retirement wealth. In the second wealth quintile, Social Security is about four times the size of employer-sponsored retirement wealth, and in the third quintile, the two are close to equal. In the top wealth quartile, employer-sponsored retirement wealth is roughly three times Social Security wealth. On net, however, the combined ratio of employer-sponsored and Social Security retirement wealth to income is nearly flat across the first two wealth quartiles (last column of table 1), while the third quartile has the most retirement income relative to their income. The drop in the combined ratio at the very top is due to (1) the taxable maximum income in Social Security program and (2) the limits to tax benefits in the employer-provided pensions which leads the very wealthy to hold most of their wealth outside of retirement accounts.
The perspective on retirement wealth that comes from incorporating Social Security in the overall measure of retirement wealth underscores the role that Social Security plays in maintaining living standards in retirement, and sheds some light on the differences in employer-sponsored retirement coverage and wealth accumulation described in the previous sections. The progressive nature of Social Security means that lower-income individuals have less need to save through employer plans to get the same overall income replacement in retirement. The fact that overall retirement wealth relative to pre-retirement income is roughly constant across the bottom three quartiles of the wealth distribution is consistent with comparable overall income replacement in retirement. This is not meant to suggest that that many families will not face hardship in retirement, because absolute need and comparable replacement rates are two very different things. However, looking at employer-sponsored retirement plans and Social Security together does help us understand the observed differences in retirement account participation and accumulation across wealth groups.
Indeed, expanding the concept of wealth to include Social Security has an important corollary in how we think about the very meaning of retirement saving. If one considers only employer-sponsored retirement plans, it is easy to draw the conclusion that workers outside the top quartile save very little, on average, for retirement. However, those same workers are paying 12.4 percent of their incomes into the Social Security system each year. The 12.4 percent rate is already quite high relative to employer-sponsored retirement plan contributions, but the amount of taxes paid does not even capture how much some workers are truly saving. Each year that a worker contributes to Social Security they are increasing the present value of their future benefits, because they are boosting their own future benefits and moving a year closer to getting benefits. This positive rate of future benefit accumulation is even more pronounced for lower-income workers because the system is progressive. It is the change in that present value (the "accrual" rate) that truly captures their saving, in an economic sense. The discussion above about Social Security wealth varying from negative to positive over the lifecycle but netting out to zero has an analog in what it means to save. Young workers are saving as they accumulate future Social Security wealth, and retirees are dissaving as they draw down their Social Security wealth.
Social Security is the main source of retirement wealth for most families, and that is the key to understanding differences in retirement saving behavior across the wealth distribution. That observation also comes with an important message about employer-sponsored retirement plan and Social Security policies. Social Security financing is an important policy concern, and the current projections indicate that only about 75 percent of benefits will be payable after the trust fund is exhausted in about two decades. The question of who should pay more in taxes or receive less in benefits, both within and across generations, should acknowledge the distributional realities of the employer-sponsored retirement system. In addition, if tax policies designed to overcome the inherent obstacles to expanding employer-sponsored coverage are not actually benefitting most workers outside the very top of the wealth distribution, an alternative might be to allocate those resources to directly shoring up or even expanding Social Security.
References
Bricker, Jesse, Lisa J. Dettling, Alice Henriques, Joanne W. Hsu, Lindsay Jacobs, Kevin B. Moore, Sarah Pack, John Sabelhaus, Jeffrey Thompson, and Richard A .Windle. 2017. "Changes in U.S. Family Finances from 2013 to 2016: Evidence from the Survey of Consumer Finances," Federal Reserve Bulletin, 103(3): 1-42. (September)
Bricker, Jesse, Alice Henriques, Jacob Krimmel, and John Sabelhaus. 2016. "Measuring Income and Wealth at the Top Using Administrative and Survey Data," Brookings Papers on Economic Activity, 1:2016, p. 261-321.
Dettling, Lisa J., Sebastian Devlin-Foltz, Jacob Krimmel, Sarah Pack, and Jeff Thompson. 2015. "Comparing Micro and Macro Sources for Household Accounts in the United States: Evidence from the Survey of Consumer Finances," Federal Reserve Board: FEDS Working Paper 2015-86. (October)
Devlin-Foltz, Sebastian, Alice M. Henriques, and John Sabelhaus. 2016. "Is the U.S. Retirement System Contributing to Rising Wealth Inequality?" Russell Sage Journal of the Social Sciences, 2(6): 59-85. (Fall 2016)
Fang, Chichun, Charles Brown, and David Weir. 2016. "Cohort Changes in Social Security Benefits and Pension Wealth," Working Paper 2016-350, University of Michigan Retirement Research Consortium. (September)
Harris, Seth D., 2018. "Retirement for middle-class Americans is crumbling," The Biden Forum, available at https://bidenforum.org/retirement-for-middle-class-americans-is-crumbling-9bf0d5b680fc.
Henriques, Alice, Lindsay Jacobs, Kevin B. Moore, and Jeffrey Thompson. 2016. "Estimating Comprehensive Retirement Wealth over the Lifecycle," National Tax Association, 109th Annual Conference Proceedings. (November)
Lenze, David G. 2013. "State and Local Government Defined Benefit Pension Plans: Estimates of Liabilities and Employer Normal Costs by State, 2001-2011," U.S. Bureau of Economic Analysis. (December)
Rassier, Dylan G. 2014. "Private Defined Benefit Pension Plans in the U.S. National Accounts: Accrual Measures for the 2013 Comprehensive Revision," U.S. Bureau of Economic Analysis. (August)
Saez, Emmanuel, and Gabriel Zucman. 2016. "Wealth Inequality in the United States since 1913: Evidence from Capitalized Income Tax Data," Quarterly Journal of Economics, 131(2): 519-578.
Wolff, Edward N., 2015. "U.S Pensions in the 2000's: The Lost Decade?" Review of Income and Wealth, 61(4): 599-629. (December)
*Division of Research and Statistics, Federal Reserve Board. Contacts: [email protected], [email protected]. The analysis and conclusions set forth are those of the authors and do not indicate concurrence by other members of the research staff or the Board of Governors.
1. Details on recent pension plan changes for state employees are available on the National Association of State Retirement Plan Administrators (NASRA) website, https://www.nasra.org/Files/Topical%20Reports/Governance%20and%20Legislation/Pension%20Reform/dbplanchanges.pdf. Return to text
2. See, for example, Wolff (2015) and Harris (2018). Return to text
3. The analysis here is based the Federal Reserve's triennial SCF, which provides a nearly comprehensive snapshot of the balance sheets and incomes of U.S. households. The latest SCF findings (for the 2016 survey wave) are described in Bricker, Dettling, Henriques, Hsu, Jacobs, Moore, Pack, Sabelhaus, Thompson, and Windle (2017). Return to text
4. One type of risk associated with traditional DB plans is often ignored in this calculus. If a worker separates from the employer or loses their job mid-career, they forego most of the value of promised benefits, because DB formulas are generally based on years of service and some measure of "highest" earnings. Employers can (and many have) shut down DB plans, leaving workers with much less than they would have expected in terms of retirement wealth. In contrast, the assets in DC plans are perfectly portable, and are, from that perspective, actually less risky than DB for early and mid-career workers. Return to text
5. In this figure (and elsewhere), families are sorted into wealth quartiles within their ten-year birth cohort. If we sorted everyone by wealth in one large group regardless of age, the wealthiest group would be dominated by the oldest families who have accumulated more wealth because of where they are in the lifecycle. By sorting within age groups, we remove those lifecycle effects, and thus (for example) the top quartile is equally represented by the top quartile within each birth cohort. Return to text
6. One noteworthy example of the pre-1989 coverage trend is that federal government workers hired after 1987 are automatically in the new FERS system with both DB and DC components, replacing the DB-only CSRS system that had been in place until then. In some sense, though, federal workers have been unique since the 1980s, because their plan have not further evolved into a DC only as most private sector plans. Return to text
7. We lump IRAs in with all other type of employer-sponsored DC plans, because most IRA wealth is the result of employer-sponsored DC plan rollovers to IRAs. See, for example, figure 8.19 in the most recent Investment Company Institute Fact Book, available at http://www.icifactbook.org/ch8/18_fb_ch8. Return to text
8. Devlin-Foltz, Henriques, and Sabelhaus (2016) show that the SCF account-type retirement assets track well with published aggregates from the Investment Company Institute (ICI). The ICI provides source data for the FA, and thus, the SCF also tracks FA quite well. Return to text
9. The FA data is released quarterly in the Z1 publication, see https://www.federalreserve.gov/releases/z1/current/. Return to text
10. As noted above, we include IRA balances in the FA pension entitlement concept, using data from FA Table L.117. Return to text
11. Some of those liabilities show up in the FA insurance sector, as employers make the necessary payments to establish DB annuities. The FA bookkeeping acknowledges that the actual assets (such as stocks and bonds) plan sponsors hold may not be sufficient to meet all of the plan obligations, because that will ultimately depend on the uncertain returns on those stocks and bonds. Thus, there is an underfunding adjustment that equalizes the household sector assets and plan sponsor liabilities. The issue of DB pension funding status is an interesting but controversial topic, involving assumptions about inflation, real rates of return to various assets, and appropriate risk-adjusted discounting. We choose to avoid those debates in this Note. In any event, the impact on our wealth distribution estimates is limited to how we distribute the relatively small underfunded portion. Return to text
12. Dettling, et al. (2014) show how the overall SCF and FA wealth concepts compare over time, and DB wealth is by far the most substantial difference. The published SCF wealth measures do not include any estimates of DB wealth, and thus the 15 to 20 percent of FA household wealth accounted for by DB plans (figure 2) is missing from the published SCF wealth measures. Return to text
13. The Stata code that generates DB wealth estimates for the SCF survey years 1989 through 2016 is available from the authors upon request. Return to text
14. Questions about survivor benefits and inflation adjustment are also asked of current recipients in the SCF, and those answers are also used to choose the appropriate mortality and discount rate inputs for the present value calculations. Return to text
15. We rely on cohort mortality rates from the Social Security Administration (SSA) and estimates of demographic mortality differentials from the Congressional Budget Office (CBO). For nominal interest rates, we use estimates from the Bureau of Economic Analysis (BEA) with a benchmark to a 3 percent real rate. See Lenze (2013) and Rassier (2014) for details on the BEA actuarial methodology. Return to text
16. The distinction between termination and continuation values is a corollary to the discussion of DB risk in footnote 4, above. The assertion that early to mid-career workers face risk under the DB because they may lose or leave the job, or because the employer may terminate or change the plan, is equivalent to saying the plan has a low termination relative to the continuation value for those workers. Return to text
17. We are grateful to Chichun Fang for running the termination simulation on the HRS data that made it possible for us to solve for the wedge between private and public plan generosity and validate the statistical relationship between age, earnings, years in plan, sector, and plan termination value. Our approach to estimating termination values for current job DB plans effectively ignores variation in expected DB benefits that is not explained by age, years of plan coverage, earnings, and sector. The HRS simulations provided by Chichun Fang show that about seventy percent of the variation in termination values is explained by just those four variables. Thus, the only potential bias in our approach is if the remaining thirty percent of variation in termination values is correlated with some other variable we are using in the tabulations, that is, the other components of household wealth. Return to text
18. See, in particular, Saez and Zucman (2016) and Bricker, Henriques, Krimmel, and Sabelhaus (2016). Return to text
19. Henriques et al. (2016) describes a more ambitious approach to estimating the accumulation of retirement wealth--both employer-sponsored and Social Security--across generations and over time. Return to text
20. That is, about 5 percent of workers earn above the taxable maximum, which is $128,700 in 2018. Return to text
21. These numbers are for the 1940s birth cohort. The Congressional Budget Office reports projected replacement rates by birth cohort, lifetime income, and various policy scenarios in their annual report on Social Security. For the latest data, see https://www.cbo.gov/publication/54428. Return to text
22. The Old Age Survivors and Disability Insurance (OASDI) trust fund has enough to pay benefits for about three years. The balance in the fund is mostly an accounting exercise, because the bonds held are both liabilities and assets of the same government. However, it is an important accounting exercise, because it provides information about much a given birth cohort has paid in taxes relative to the benefits they will receive. Return to text
23. The present value of benefits is calculated for all workers in the system ages 15 and older. The estimate is now a regular part of the annual Social Security Trustees Report, in Table VI.F.2, available at https://www.ssa.gov/oact/. The value reported in the 2018 report was $68.6 trillion, which is roughly 70 percent of the total household net worth in the FA at that time. Return to text
24. The age group 50 to 59 is chosen because most are still working, so we directly observe the relevant earnings measures, but they are close enough to retirement that we have a good sense of their retirement resources. The table excludes the relatively few families in this age group where neither the head or spouse is still working. The income measure is the SCF "usual" income measure that is close to the preferred economic "permanent income" concept. Return to text
25. The SCF is unique among household surveys in terms of "oversampling" very wealthy families, and thus the value for average income in the top wealth quartile is itself dominated by the very wealthiest families, those in the top 1 percent. The vast majority of families in the top wealth quartile earn much less than the average income in the group. Return to text
26. The Social Security wealth estimates are based on the same mortality and discount rate assumptions used for the DB calculations in the previous section. Return to text
Sabelhaus, John, and Alice Henriques Volz (2019). "Are Disappearing Employer Pensions Contributing to Rising Wealth Inequality?," FEDS Notes. Washington: Board of Governors of the Federal Reserve System, February 1, 2019, https://doi.org/10.17016/2380-7172.2308.
Disclaimer: FEDS Notes are articles in which Board staff offer their own views and present analysis on a range of topics in economics and finance. These articles are shorter and less technically oriented than FEDS Working Papers and IFDP papers.