FEDS Notes
May 21, 2019
Assessing the size of the risks posed by life insurers' nontraditional liabilities1
Nathan Foley-Fisher, Borghan N. Narajabad, and Stéphane Verani
This note discusses potential methods for assessing the size of the run risk associated with life insurers' nontraditional liabilities.2 A run on a life insurer poses a potential financial stability risk if the life insurer plays an important role in the financial system. For example, during the financial crisis of 2007-09, runs occurred on several types of nontraditional liabilities issued by life insurers.3 Some of the largest and most interconnected life insurers that experienced runs required substantial government assistance to prevent spillovers to households and to the rest of the financial system.
Life insurers' nontraditional liabilities are wholesale funding instruments that are issued from their general accounts. In contrast to life insurers' traditional liabilities that make payments conditional on the health of the holder, nontraditional liabilities have neither mortality nor morbidity contingencies.4 Nontraditional liabilities include, for example, institutional funding agreements privately sold to investors, funding agreement-backed securities (FABS), borrowing from the Federal Home Loan Banks (FHLBs) backed by institutional funding agreements, and repo and securities lending cash collateral. Life insurers issue nontraditional liabilities to earn a spread between the cost of raising funds with nontraditional liabilities and the yields on assets purchased with these funds, which necessarily involves some degree of maturity, liquidity, and/or credit transformation.
A benchmark for the size of a life insurer's nontraditional liabilities is essential to assess the potential risk posed by those liabilities in the event that investors decide to run.5 For example, some assessments of life insurers' nontraditional liabilities infer that the potential risks are minor because these liabilities are a small fraction of the assets held by life insurers.6 The assumption behind these assessments is that life insurers can easily sell parts of their enormous asset portfolios in the event of a run. However, many of those assets are tied to the insurers' traditional insurance liabilities and therefore cannot be sold for actuarial and/or regulatory reasons. This constraint applies even to assets with highly liquid markets, such as Treasuries. As a consequence, dividing a life insurer's nontraditional liabilities by its asset holdings is a potentially misleading benchmark for assessing the run risk.
We propose an alternative method for assessing the size of life insurers' nontraditional liabilities. We argue that a benchmark for the size of a life insurer's nontraditional liabilities should be based on the cash flows of that insurer. We estimate the typical size of each life insurer's unexpected cash needs using the volatility of their individual realized cash flows. Our assumption is that a life insurer with low cash flow volatility in normal times may find it harder to cope with a run on its nontraditional liabilities. We show that a run on life insurers' nontraditional liabilities would be equivalent to a very large adverse cash flow shock. On average, life insurers' runnable nontraditional liabilities are almost seven times the standard deviation of the unexpected component of their cash flows.
The remainder of this note is divided in four sections. In the first section, we provide an overview of life insurers' nontraditional liabilities. In the second section, we summarize two case studies in which runs on nontraditional liabilities created severe liquidity stresses for life insurers that had large portfolios of assets. In the third section, we describe why a life insurer's asset holdings are a potentially misleading benchmark for the magnitude of their nontraditional liabilities. In the final section, we introduce our proposal for assessing the size of the risks posed by nontraditional liabilities using life insurers' cash flows.
Life insurers' nontraditional liabilities
The two panels in Figure 1 show the total amount of nontraditional liabilities of U.S. life insurers outstanding, by type of liability. The upper panel shows funding agreement-backed securities and FHLB advances beginning in the first quarter of 2006. Our data on FABS and FHLB advances are available from 1998 and 2006, respectively, when life insurers began issuing these liabilities. The lower panel shows repo and securities lending. Data on repurchase agreements and securities lending are available only from 2011 when new reporting requirements took effect. In total, 118 life insurance groups have a combined $224 billion in outstanding nontraditional liabilities as of the third quarter of 2018.
Note: Our data on FABS and FHLB advances are available from available from 1998 and 2006, respectively, when life insurers began issuing these liabilities. Data on repurchase agreements and securities lending are available only from 2011 when new reporting requirements took effect. Key identifies bar segments in order from top to bottom.
Source: Staff estimates based on data from Bloomberg Finance LP, Moody's ABCP Program Index, the FHLB Office of Finance, and NAIC Quarterly and Annual Statutory Filings. Data are quarterly and current as of 2018Q3.
Case studies: AIG and The Hartford's life insurance subsidiaries
The case study of AIG during 2008 demonstrates how a large life insurer can be vulnerable to relatively small unexpected cash needs related to nontraditional liabilities.7 At that time, AIG held $1 trillion in assets and issued AAA-rated debt in capital markets. According to regulatory filings, AIG's large life subsidiaries held about $365 billion in assets, with roughly $2 billion in government-guaranteed fixed income securities in their general accounts. The life insurers' large asset portfolios did not prevent a run on the securities lending program of AIG's life subsidiaries. AIG had invested a substantial portion of the cash collateral it received from lending securities in long‑term illiquid assets, such as residential mortgage-backed securities. Amid concerns about the quality of assets in the cash collateral reinvestment portfolio, many securities borrowers returned the securities and demanded their cash collateral throughout the summer of 2008.8 As a result, AIG's securities lending program shrank from $88.4 billion in September 2007 to $69 billion at the end of August 2008. As the rate of withdrawals peaked, the immediate cash needs of AIG could not be met, despite their enormous portfolio of assets, and the firm sought federal government support in September 2008.9
The case study of The Hartford during the financial crisis provides another example where unexpected cash needs related to nontraditional liabilities contributed to liquidity stress.10 Before the crisis, The Hartford was a large, diversified insurer and part of the Hartford Financial Services Group that had over $360 billion in assets at the end of 2007. Like AIG, the large portfolio of assets did not prevent a run by institutional investors, in this case on The Hartford's short-term FABS. Amid mounting losses due to its exposure to real estate-linked assets, The Hartford's stock price fell by more than 90 percent between January and October 2008. In late 2008, the insurer faced obligations amounting to $2.7 billion, including $1.8 billion in unexpected withdrawals from extendible FABS, a type of short-term FABS with embedded put option. Despite its large portfolio of assets, the Hartford struggled to meet its immediate cash needs. The collapse of the insurer was prevented only by its surrendering of a 23 percent ownership stake to Allianz and obtaining government support through Troubled Asset Relief Program funding.11
Why might assessing the size of life insurers' nontraditional liabilities using their asset holdings be misleading?
As suggested by the case studies above, assessing life insurers' nontraditional liabilities by the stock of assets on a life insurer's balance sheet could be misleading. The reason is that those assets are not readily convertible into cash; life insurers need to keep those assets on balance sheet to meet actuarial and regulatory needs. The assets are held against long-term insurance liabilities, with attendant capital charges. A life insurer that sells assets needs to find alternative assets with similar cash flows to meet obligations related to its insurance liabilities to satisfy a basic tenet of their business: Match the cash flows of assets and liabilities.12 In addition, when replacing assets that have been sold, the insurer may face costly regulatory capital charges.
Even assets with highly liquid markets, such as Treasuries, may not be readily available because life insurers do not hold "spare" liquid assets. A life insurer with spare liquid assets on its balance sheet is less profitable than it could be. As a consequence, although desperately short of cash, a life insurer may not be able to sell its most liquid assets without violating its actuarial or regulatory constraints. Figure 2 offers some empirical evidence for these constraints using the two case studies described above. The figure shows the par value of total Treasury holdings by the life insurance subsidiaries of AIG (blue line) and The Hartford (red line) in each month from January 2006 through December 2011.13 The blue line indicates that AIG's life insurance subsidiaries did not sell any of their Treasury holdings despite the run on their securities lending program in 2008 that eventually required substantial cash loans from the government. Similarly, the red line suggests that The Hartford's life insurance companies did not sell their Treasuries while they were experiencing severe cash shortages, and instead sought government support. The Hartford life insurers increased their Treasury holdings in 2009 at the same time that the group was trying to sell its life insurance businesses.14
Source: Staff estimates based on data from NAIC Quarterly and Annual Statutory Filings.
An alternative method for assessing the size of life insurers' nontraditional liabilities
The run risk posed by unexpected cash needs is better quantified in the context of a life insurer's net cash flows, rather than the amount of assets on its balance sheet. Life insurers use cash flow analysis to provide insight into their liquidity exposure (Gilbert 2017). Although they do sell some securities, life insurers tend to follow a buy-and-hold strategy using fixed income securities because of the greater certainty in the asset cash flows.15 The major risk to this strategy is that asset cash flows are insufficient. This includes the impact of possible defaults, re-balancing of the portfolio, re-investment of net proceeds, and potential forced sales to meet policy liability payments or other liquidity requirements. Insurers have their own internal models to assess their cash flow risk and generally decide their own test scenarios and risk tolerances (ASB 2002).
Life insurance regulation has historically put little to no emphasis on liquidity risk. Life insurance regulation evolved in the 1990s to ensure that the assets backing life insurance liabilities are of sufficiently high quality that the insurer can meet these obligations promptly. Because mortality and morbidity risks are largely cross-sectional, they can be, at least in principle, fully diversified across a large enough pool of individuals. The risk-based capital formula for U.S. life insurers does not include any consideration for liquidity risk stemming from any of their insurance liabilities.16 As a consequence, there are no statutory data currently available to measure precisely the risk that unexpected cash needs pose to life insurers.
In the absence of statutory reports on liquidity risk or cash management, we use the time-series variation in each life insurer's quarterly net flow in cash, cash equivalents, and short-term investments ("net cash flow") as a benchmark for the run risk associated with nontraditional liabilities.17 The net cash flow is the difference between each life insurer's incoming cash flows and their outgoing cash flows.18 If insurers perfectly matched their incoming and outgoing cash flows, the net cash flow would be zero. In reality, an insurers' net cash flow is never zero and depends on their underlying business model. Because life insurers specialize in writing long‑term liabilities, we assume that the best predictor of each quarterly cash flow is cash flow in the previous quarter.19 The change in the quarterly net cash flow is our measure of the size of the insurance company's unexpected cash needs--sometimes positive and sometimes negative.20 The standard deviation of the realized change in net cash flows is then a measure of each insurer's quarterly cash flow volatility.21 We compare each life insurer's nontraditional liabilities to the volatility of that insurer's net cash flows.22
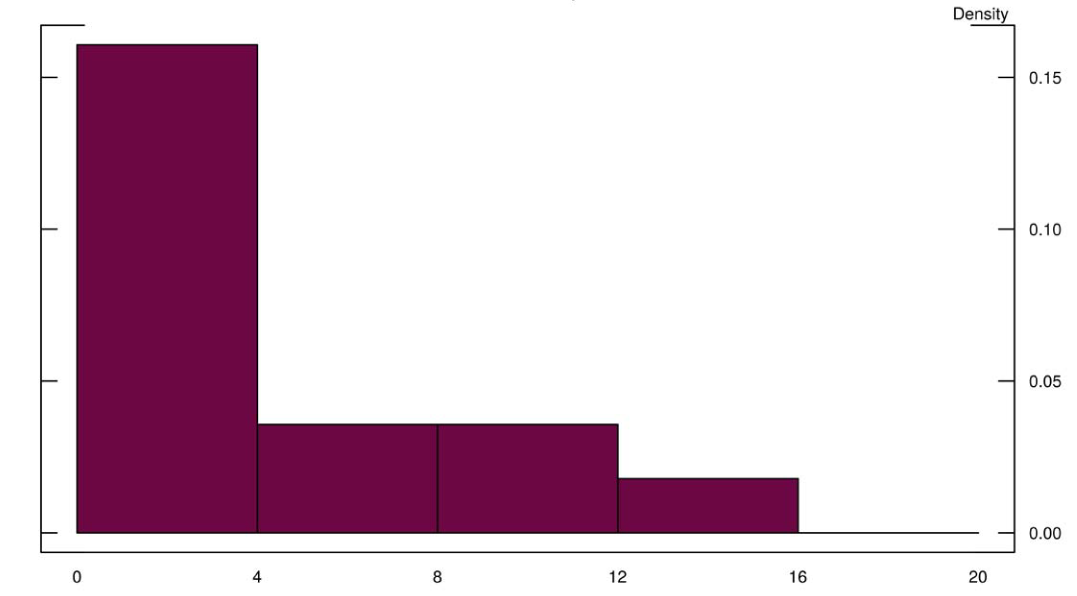
The two panels of Figure 3 plot the distribution of the ratio of U.S. life insurers' runnable nontraditional liabilities to the standard deviation of the change in their quarterly net cash flows.23 We restrict the set of nontraditional liabilities only to those that are the most runnable: Short-term FABS with a residual maturity of less than one year, FHLB advances that can be terminated at the discretion of the FHLBs, and cash collateral from securities lending and repo.24 The upper panel shows the distribution of the ratio across insurers as of Q3 2018. On average, life insurers' runnable nontraditional liabilities are 6.8 times the standard deviation of the unexpected component of their cash flows. For reference, the $20 billion withdrawn from AIG's securities lending program between September 2007 and August 2008 equates to only 6 percent of the assets held by AIG's life subsidiaries. But those withdrawals amounted to roughly 7 times its standard deviation of unexpected quarterly net cash flows.
The lower panel shows the same data as the upper panel excluding FHLB advances because, while FHLB advances are a runnable liability, they can also be a source of liquidity in times of stress. For example, during the last financial crisis, nearly all of the increase in the FHLB advances to the insurance industry was to FABS issuers (Foley-Fisher, Meisenzahl, Narajabad, Perozek, and Verani 2016). That said, increasing a life insurer's reliance on FHLB advances may make runs by other investors more likely because FHLBs have a "super-lien" status over other claimants that weakens the seniority of other investors. On average, life insurers' runnable nontraditional liabilities excluding FHLB advances are 4.2 times the standard deviation of the unexpected component of their cash flows.
In summary, the size of the risks associated with life insurers' nontraditional liabilities should be assessed using insurers' net cash flows, not the size of their asset holdings. While nontraditional liabilities may appear to be small relative to insurers' asset portfolios, those assets are not readily convertible to meet unexpected cash needs. In the case studies described above, life insurers with large asset portfolios needed government support to satisfy the cash demands arising from their relatively small amounts of nontraditional liabilities. In addition, we show that those life insurers were unable or unwilling to sell their most liquid assets, Treasuries, to meet their severe cash needs. We propose an alternative method for assessing the size of the run risks arising from life insurers' nontraditional liabilities, based on each insurers' cash flow volatility.25 The data suggest that a run on some life insurers' nontraditional liabilities would be equivalent to a very large adverse cash flow shock.
For each of the 14 life insurers that issue nontraditional liabilities, we sum short-term FABS, FHLB advances, and cash collateral from securities lending and repo as of Q3 2018. We then divide by the standard deviation of the change in each insurer's quarterly net cash flows. The upper panel shows the distribution of these ratios across the 14 life insurers that issue nontraditional liabilities. The units on the horizontal axis are multiples of the standard deviation of the change in insurers' quarterly net cash flows. The lower panel shows the ratio excluding FHLB advances from the numerator.
Source: Staff estimates based on data from Bloomberg Finance LP, FHLB Office of Finance, and NAIC Quarterly and Annual Statutory Filings. Data are current as of 2018Q3.
References
ASB (2002), 'Analysis of life, health, or property/casualty insurer cash flows', Actuarial Standards Board Standard of Practice No. 7 Document No. 089.
Bai, J., Krishnamurthy, A. & Weymuller, C.-H. (2018), 'Measuring liquidity mismatch in the banking sector', The Journal of Finance 73(1), 51–93.
Chodorow-Reich, G., Ghent, A. & Haddad, V. (2016), 'Asset insulators', mimeo.
Foley-Fisher, N., Gissler, S. & Verani, S. (2019), 'Over-the-counter market liquidity and securities lending', Review of Economic Dynamics, forthcoming.
Foley-Fisher, N., Meisenzahl, R. R., Narajabad, B. N., Perozek, M. G. & Verani, S. (2016), 'Funding Agreement-Backed Securities in the Enhanced Financial Accounts', FEDS Notes 2016-08-05-2, Board of Governors of the Federal Reserve System (U.S.).
Foley-Fisher, N., Narajabad, B. & Verani, S. (2015), 'Self-fulfilling runs: Evidence from the U.S. life insurance industry', Finance and Economics Discussion Series 2015-32, Board of Governors of the Federal Reserve System (US).
Gilbert, C. (2017), Asset Liability Management, in I. R. Committee, ed., 'IAA Risk Book', International Actuarial Association, Canada, chapter 13.
McDonald, R. & Paulson, A. (2015), 'AIG in Hindsight', Journal of Economic Perspectives 29(2), 81–106.
Peirce, H. (2014), 'Securities Lending and the Untold Story in the Collapse of AIG', George Mason University Mercatus Center Working Paper No. 14-12.
Schmidt, L., Timmermann, A. & Wermers, R. (2016), 'Runs on money market mutual funds', The American Economic Review 106(9), 2625–2657.
1. Nathan Foley-Fisher, Borghan Narajabad, and Stephane Verani. We are grateful to Celso Brunetti, Burcu Duygan-Bump, Diana Hancock, Patrick McCabe, Maria Perozek, and Rich Rosen for many helpful comments and suggestions. Andrew Elsner and Nathan Heinrich provided excellent research assistance. Return to text
2. This note extends the analysis presented in Foley-Fisher, Narajabad, and Verani (2015). Return to text
3. Foley-Fisher, Narajabad, and Verani (2015) describe the run on life insurers' funding agreement-backed securities, and structurally estimate a model of the run by liquidity-sensitive institutional investors on life insurers' extendible FABS, a type of short-term FABS with embedded put option. Foley-Fisher, Gissler, and Verani (2019) describe the run on life insurers' securities lending programs. Return to text
4. Life insurers issue a wide range of traditional liabilities, including fixed and variable annuities, as well as universal, term, and whole life policies. A nontechnical description of these liabilities is available here: https://www.naic.org/documents/prod_serv_consumer_lig_lp.pdf Return to text
5. In general, statutory filings do not indicate the specific assets funded by nontraditional liabilities. The only exception are the assets funded by cash collateral obtained from securities lending. Since 2010, state insurance regulators have required insurers to report the details of their securities lending cash collateral reinvestment portfolios. Return to text
6. See, for example, page 1 of this report on securities lending from the NAIC: https://www.naic.org/capital_markets_archive/180730.pdf and page 34 of the Federal Reserve 2018 Financial Stability Report available at https://www.federalreserve.gov/publications/files/financial-stability-report-201811.pdf Return to text
7. See Peirce (2014), McDonald and Paulson (2015) and Foley-Fisher, Gissler, and Verani (2019) for more details of the run on AIG life subsidiaries' securities lending program. Return to text
8. In addition to its exposure to the real estate market through its cash collateral reinvestment portfolio, AIG suffered losses on financial insurance contracts it sold to holders of CDOs backed by real estate assets that were heavily written down during the crisis. Return to text
9. Subsequently, at the same time that AIG released its third-quarter financial report in 2008, the firm publicly announced that it would terminate its securities lending program. At the end of December 2008, the securities lending program amounted to just $3 billion. Return to text
10. See Appendix E of Foley-Fisher, Narajabad, and Verani (2015) for more details about The Hartford during the financial crisis. Return to text
11. The Hartford repaid these costly capital injections shortly after the crisis, which suggests that the period of financial stress was related to liquidity concerns, rather than solvency concerns. The Hartford has since exited the life insurance business, selling its life insurance business line to other life insurers, including Prudential and Massachusetts Mutual, as well as a consortium of private equity firms. Return to text
12. Unlike insurance companies, banks' asset cash flows are not intended to match the cash flows on long-term liabilities. While banks forecast and manage their short-term cash flows, those institutions' inherent function in financial markets is to mismatch the liquidity of their long-term assets and short-term liabilities. As a consequence, it is possible to measure the liquidity exposure of banks using stocks of assets and liabilities on their balance sheet (Bai, Krishnamurthy & Weymuller 2018). Return to text
13. We constructed the data for this figure by combining the end-of-year holdings with individual Treasury transactions reported in the Statutory Filings. Return to text
14. https://www.courant.com/business/hc-the-hartford-tarp-0515.artmay15-story.html Return to text
15. This allows life insurers with traditional buy-to-hold business models and long-term illiquid liabilities to act as asset insulators that can protect the value of assets in their portfolio from exposure to financial market vagaries (Chodorow-Reich, Ghent & Haddad 2016). By contrast, property and casualty insurers specialize in insuring non-poolable risks and their insurance obligations are short-term--that is, one year or less. Return to text
16. See page 7 of this document that explains the risk-based capital formula: https://www.naic.org/cipr_newsletter_archive/vol23_rbc_requirement.pdf Return to text
17. Using expected cash flows as a benchmark for liquidity risk is methodologically similar to the Liquidity Coverage Ratio, which scales the amount of unencumbered high-quality liquid assets relative to the expected future net cash flows over a 30-day period. Another way to interpret the actuarial and regulatory constraints on a life insurers' (liquid) asset holdings is that those assets are encumbered to their traditional insurance liabilities. Return to text
18. For each life insurer, we compute net cash, cash equivalents, and short-term investments by subtracting holdings of bonds, preferred and common stock, mortgage loans, real estate, contract loans and premium notes, and other investments from total cash and invested assets. Return to text
19. Although state insurance regulation has placed little to no emphasis on liquidity risk, the National Association of Insurance Commissioners (NAIC) recommends financial analysts to "review the trend in cash flow from operations for the past five periods, and note any unusual fluctuations or negative trends between quarters" as part of their assessments of the potential risks to life insurers' liquidity (NAIC Financial Analysis Handbook 2018, pg. 196). Return to text
20. Denoting by $$c_{it}$$ the net cash flow of insurer i in quarter t, we compute unexpected cash needs as $$\Delta c_{it} = c_{it} – c_{it-1}$$. As an alternative to first differencing the net cash flows, we also computed the unexpected component of cash flows as the residuals from an AR(1) model with insurer-specific intercepts and obtained similar results. Return to text
21. Across life insurers, the average difference between the mean and median of each insurer's quarterly net cash flows is not statistically different from zero, indicating that there is no skew in the distribution across insurers that may be driving our results. Return to text
22. As a rough benchmark for "high" cash flow volatility, without imposing any assumption about the shape of the distribution, we bootstrapped (10,000 repetitions) the 95th percentile of the distribution across insurers to obtain an estimated value of 0.77. Return to text
23. We construct data for 14 insurance groups issuing nontraditional liabilities by aggregating their individual life subsidiaries. Return to text
24. An FHLB can terminate its advances to a life insurer whenever it determines that there has been a material change in the borrower's financial position. For example, if the borrower were to receive a financial rating downgrade. Return to text
25. An interesting question for future research is what level of this ratio might be optimal. One way to address the question is to consider a model that includes both the benefits and costs of nontraditional liabilities. In the case of securities lending, for example, the model could consider the trade-off between the potential costs associated with runs on insurance companies with the improvement in market liquidity caused by greater securities lending (Foley-Fisher, Gissler, and Verani 2019). Return to text
Foley-Fisher, Nathan, Borghan Narajabad, and Stephane Verani (2019). "Assessing the size of the risks posed by life insurers' nontraditional liabilities," FEDS Notes. Washington: Board of Governors of the Federal Reserve System, May 21, 2019, https://doi.org/10.17016/2380-7172.2358.
Disclaimer: FEDS Notes are articles in which Board staff offer their own views and present analysis on a range of topics in economics and finance. These articles are shorter and less technically oriented than FEDS Working Papers and IFDP papers.