FEDS Notes
August 02, 2019
Comparing Two Measures of Core Inflation: PCE Excluding Food & Energy vs. the Trimmed Mean PCE Index1
Matteo Luciani and Riccardo Trezzi
The inflation objective of the FOMC is set in terms of the rate of change of the price index for total personal consumption expenditures (PCE). However, total PCE price inflation is highly volatile, even on a year-to-year basis. Consequently, economists and policymakers have suggested alternative procedures for reweighting the index's components so as to reduce the variance of the measured inflation, to better distinguish transitory from persistent movements, and, ultimately to better anticipate future developments in inflation. The literature has used the generic term "core" inflation to refer to these alternative measures.2
The most commonly used indicators of core inflation are exclusion indexes and central-tendency statistical measures, where the former are computed by removing a pre-specified list of components from the overall index and the latter are constructed by deleting a fixed proportion of extreme price changes.
The goal of this note is to provide an assessment of two of the most commonly used indicators of core inflation: the PCE price index excluding food and energy (an exclusion index), and the Dallas Fed trimmed mean PCE price index (a central-tendency statistical measure). In particular, we consider their relative performance in terms of three arguably desirable properties of a core measure: its ability to be less volatile than total inflation while having the same average rate over longer periods of time, its power to predict future inflation, and its ability to avoid undergoing large revisions across data vintages.
Definitions and historical perspective
A consumer price index excluding food and energy was first reported by the Bureau of Labor Statistics (BLS) in the CPI Detailed Report for December 1975. Starting in 1978, this exclusion index was routinely included in the CPI Detailed Report; subsequently, a similar exclusion measure was computed for the price index for personal consumption expenditures in the national accounts. The rationale behind an exclusion index is quite simple, and involves excluding a fixed list of items that are judged to be relatively more volatile and more subject to idiosyncratic shocks on average.3 Indeed, when it was first introduced, this index was not motivated in terms of the estimated statistical properties of food and energy prices; rather, its use reflected the 1970s' experience of high commodity price volatility and represented an attempt to reduce the variance of measured consumer price inflation while maintaining its average over longer periods.
Like an exclusion index, a trimmed-mean index is based on the idea that large movements in prices for a subset of items can induce high volatility in total inflation. However, a trimmed-mean index differs from an exclusion index in that the price changes that are omitted can differ in each period the index is computed (that is, they are not confined to a fixed list of items that is specified in advance). The statistical motivation for the trimmed-mean measure is that a suitably chosen trimmed mean will provide a robust estimator of the location of a fat-tailed distribution, while a weighted mean typically will not. Hence, to the extent that the empirical distribution of individual consumer price changes tends to exhibit fat tails, a trimmed-mean inflation measure might be viewed as preferable to an exclusion measure on purely statistical grounds.
The particular application of the trimmed-mean approach to PCE price inflation that we consider in this note was suggested by Dolmas (2005), published regularly by the Dallas Fed since August 2005.4 As currently computed, the portion of personal consumption expenditure that is excluded from the trimmed mean represents 55 percent of overall PCE (24 percent from the lower tail of the distribution of monthly price changes and 31 percent from the upper tail).5
Metric I: mean and volatility of the series
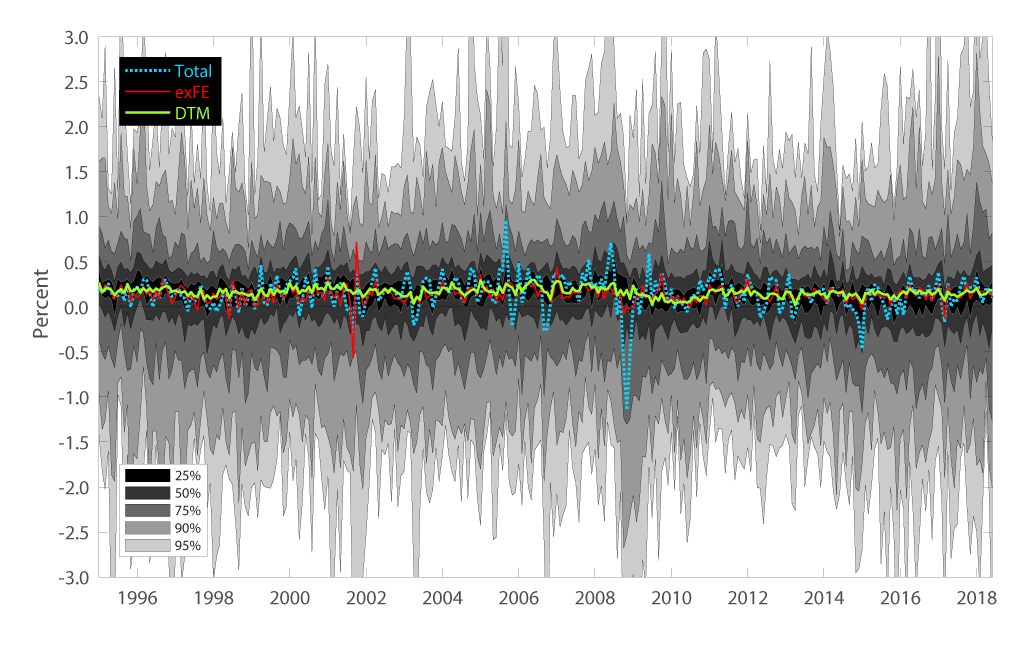
Figure 1 provides a visual representation of the issue that exclusion indexes and central-tendency statistical measures try to address. For each month in the sample, the gray areas show the distribution of the monthly percent changes of the 178 PCE price index components used by the Dallas Fed to construct the trimmed mean PCE price index. The blue, red, and green lines show the one-month percent changes of the total PCE price index, the PCE excluding food and energy index, and the trimmed mean index, respectively.
There are three main takeaways from Figure 1. First, in each month there is a wide distribution of price changes (Panel A of Figure 1); it is precisely this dispersion that makes it difficult for policymakers and others to interpret high-frequency inflation readings. Second, the index excluding food and energy and the trimmed-mean measure are both considerably less volatile than the total PCE price index. Finally, although the trimmed mean is able to smooth across idiosyncratic episodes more effectively than the index excluding food and energy (for example, during the 2001 episode shown in Panel B of Figure 1), both indexes tend to lie within the inner 25 percent range of the distribution of individual price changes.6 In other words, both indexes do a reasonable job capturing the location of the price data distribution by successfully filtering out various item-specific shocks.
Panel A: January 1995 - June 2018
Panel B: January 2001 - April 2002
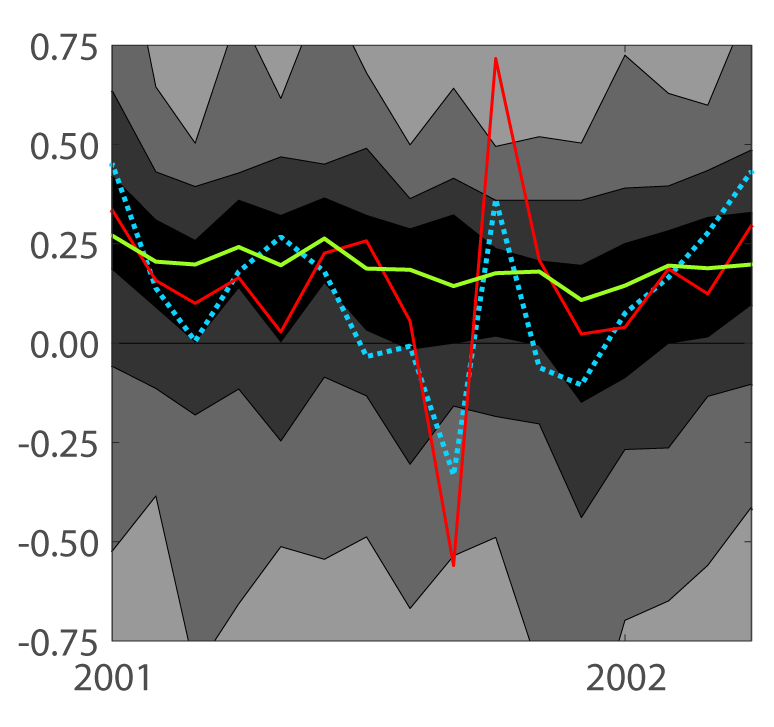
Note: The gray areas show the inner range of monthly price changes for the percentiles specified in the figure's lower-left legend generated by 178 subcomponents of the overall PCE price index. The dotted blue line plots monthly changes in the total PCE price index; the red line plots the monthly change in the PCE price index excluding food and energy, and the thick green line shows the monthly percent change of the trimmed-mean PCE price index.
Source: Authors' calculations using data from the Bureau of Economic Analysis and Federal Reserve Bank of Dallas.
Table 1 provides summary statistics for the annualized monthly percent change in the total PCE price index and the two core measures over various subsamples.
For a policymaking body such as the FOMC, which specifies its longer-term price objective in terms of total PCE inflation, it is useful if a core price index has an average rate of change that matches the mean rate of total inflation over a sufficiently long period of time. As is evident from line 1 of the table, from 1977 to 2009 the average change in the trimmed-mean measure is identical to the average change in the total PCE price index. However, this property of the index does not hold across shorter sample periods: For example, over the first two decades of the sample (line 2), trimmed-mean inflation ran about 1/4 percentage point below total PCE price inflation; since the mid-1990s (line 3), the rate of increase in the trimmed-mean measure has run about 1/4 percentage point above total inflation.7 By contrast, the average change in the index excluding food and energy has been almost identical to the overall inflation rate in all three periods.
Table 1: Descriptive statistics of inflation measures
| Total PCE | excluding Food and Energy | Dallas Fed Trimmed Mean | ||||
|---|---|---|---|---|---|---|
| Mean | Stdev | Mean | Stdev | Mean | Stdev | |
| (1) 1977-2009 | 3.5 | 3.2 | 3.5 | 2.5 | 3.5 | 2 |
| (2) 1977-1995 | 4.8 | 3.2 | 4.8 | 2.5 | 4.5 | 2.1 |
| (3) 1995-2018 | 1.8 | 2.3 | 1.7 | 1 | 2 | 0.6 |
Note: The table shows descriptive statistics for monthly percent changes at an annual rate for three measures of PCE price inflation. "Stdev" stands for "Standard deviation".
Source: Authors' calculations on Bureau of Economic Analysis (BEA) and Federal Reserve Bank of Dallas data.
To summarize, despite their methodological differences, both indexes appear capable of reducing the variance of total inflation while capturing the location of the overall distribution of price changes. The trimmed mean PCE index is able to smooth across large idiosyncratic episodes better than the index excluding food and energy; however the fact that the trimmed-mean inflation measure has run consistently higher than total PCE price inflation since the mid-1990s suggests that its current level should be interpreted carefully.
Metric II: relative forecasting performance
A key purpose of a measure of core inflation is to provide an indication of the future direction of total inflation. Hence, we investigate the relative forecasting performance of the index excluding food and energy and the trimmed mean index. Specifically, we investigate the performance of the annualized core inflation rate between month t–s and month t in predicting the annualized total PCE price inflation rate between month t and month t+h.8
The forecasting exercise is run in real time, meaning that we construct our forecasts using the actual vintages of data that were available at each point in time. The first forecast we produce is for inflation over the 24 months from June 2005 to June 2007, using data available as of June 2005. Next, we produce a forecast for July 2007 using the data available as of July 2005. We then repeat the same procedure until June 2018, thereby yielding a total of 157 forecasts. The target is the annualized 24-month-ahead percent change in the total PCE price index computed using the latest available data (meaning the data published by the BEA on July 31, 2018).
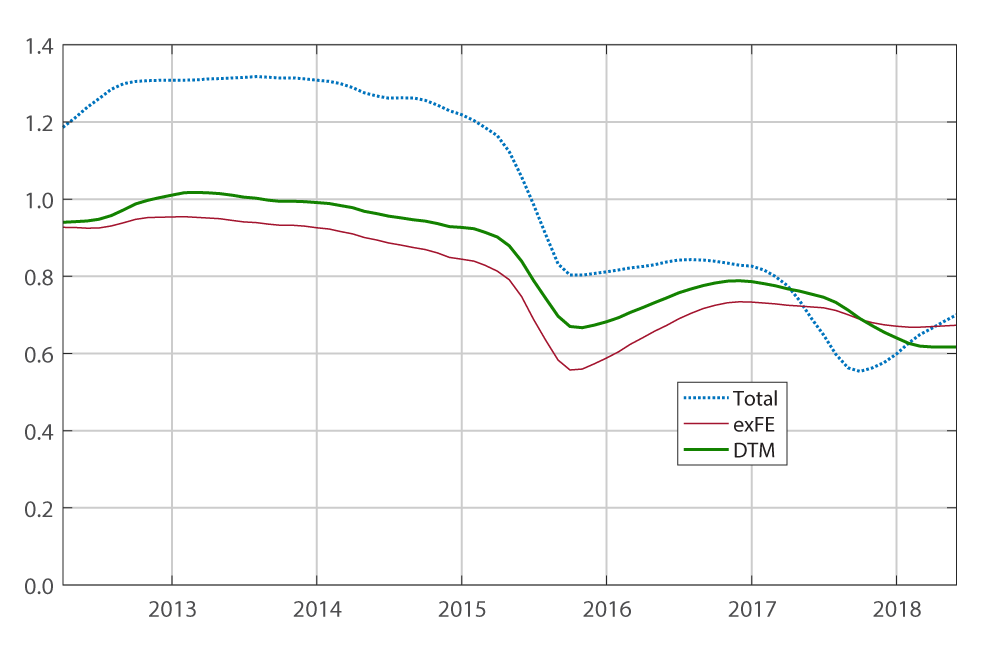
Figure 2 summarizes the results of this exercise. The top panel of Figure 2 shows the root-mean-squared forecast error (RMSE) that obtains over a rolling 5-year window when we use the 24‑month change in the core price index as a predictor; the bottom panel shows the root-mean-squared forecast error that obtains for the full sample when we use annualized core inflation rates computed over periods that range from one to 36 months.
Starting with the RMSEs computed over rolling windows (top panel), the index excluding food and energy and the trimmed mean each yield better forecasts than total PCE price inflation itself, although the improvement is minimal in recent years. In addition, until very recently the index excluding food and energy performs slightly better than the trimmed-mean measure. For the forecasting models that use core inflation measures computed over alternative horizons (bottom panel), both core measures perform better than total inflation, but none of them clearly dominates the other.
RMSE at different horizons
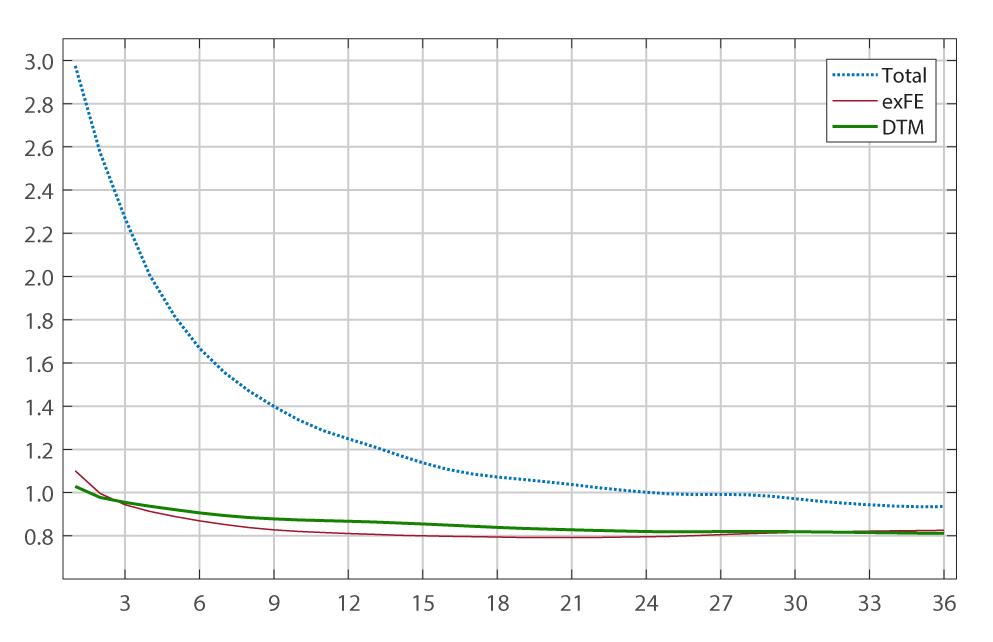
Note: The top panel shows the 5-years rolling window root mean squared error of the 24-month change of total (dotted blue line), exFE (red line), and TM (thick green line) in predicting the 24-month change of total PCE inflation. Each point in the first panel represents the RMSE for the 5-year window ending at that date. The bottom panel shows the root mean squared error when different number of months is used in constructing the core measure's inflation rate (i.e., s in formula 1). For example, the point corresponding to the number "6" on the x-axis represents the RMSE of the 24-month total inflation has been predicted using the 6-month changes. "Total" stands for "Total PCE price". "exFE" stands for "PCE excluding food and energy". "DTM" stands for "Dallas FED Trimmed Mean PCE index".
Source: Authors' calculations on Bureau of Economic Analysis (BEA) and Federal Reserve Bank of Dallas data.
Summing up, the results of the forecasting exercise show that the two measures of core inflation predict future inflation significantly better than total PCE price inflation itself. The trimmed mean and the measure excluding food and energy perform similarly well in predicting future inflation, with a slightly better performance in recent years of the trimmed mean in predicting average inflation over the next two years. However, over the previous six years or so the measure excluding food and energy delivered a more accurate forecast of total inflation. In conclusion, from the point of view of forecasting future inflation, there is no clear advantage of one measure over the other.
Metric III: revisions across data vintages
In the previous section, we demonstrated that the two core measures have roughly the same forecasting ability. Nevertheless, for a policymaker making and communicating decisions in real time, it is also desirable that a core inflation measure is not subject to large revisions.9
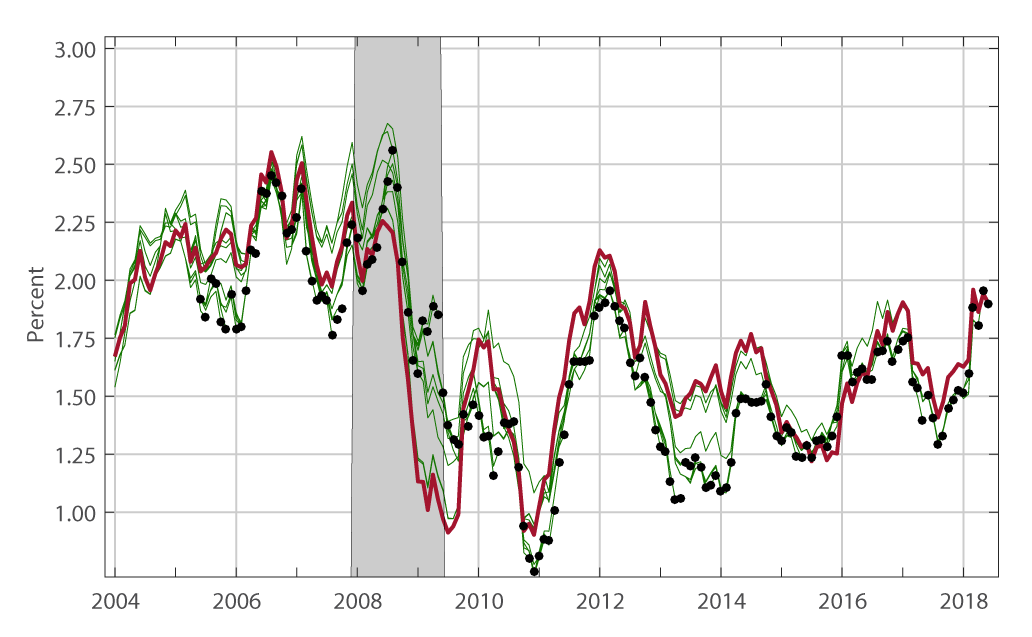
To compare the relative performance of the two core inflation measures along this dimension, Figure 3 plots real time and current-vintage estimates of the 12-month change in the index excluding food and energy (top panel) and the trimmed-mean index (bottom panel).
In each chart, the red line shows the 12-month changes computed using the latest available data (meaning the data published by the BEA on July 31, 2018). The black dots show the value of the 12-month change in each month using the first release for that month. Finally, for each of the 157 black dots there is a corresponding green line, showing the 12-month changes computed using the associated vintages. Put differently, in the figure there is a green line for each black dot and each green line ends with a corresponding black dot.
12-month percentage change
PCE prices exFE
12-month percentage change
DTM PCE prices
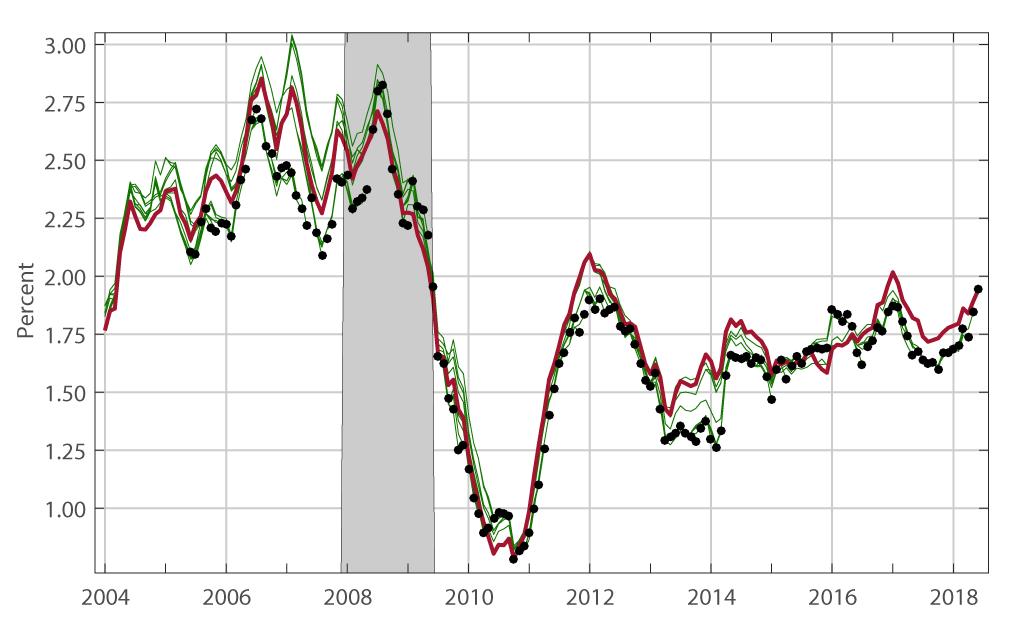
Note: In each panel the thick red line is the 12-month change obtained with the last available vintage of data (July 31, 2018), while the green lines are the 12-month changes obtained with all the remaining 156 vintages. The black dots represent the 12 month change of inflation for month M and year Y obtained with the vintage of data ending at month M and year Y. The ticks on the x-axis correspond to the month of January. "exFE" stands for "excluding food and energy". "DTM" stands for "Dallas FED Trimmed Mean".
Source: Authors' calculations on Bureau of Economic Analysis (BEA) and Federal Reserve Bank of Dallas data.
As is apparent from the figure, the magnitude of the revisions to these inflation measures can be sizable at times. As an example, consider the 12-month change in January 2014 for the index excluding food and energy prices. According to the first vintage (indicated by the black dot), the 12-month change through January 2014 was estimated at 1.09 percent. It was then revised to 1.24 percent with the annual revision of that year; then to 1.44 and 1.47 percent with the two subsequent annual revisions. Finally, according to the current vintage (the red line), the 12-month change through January 2014 is estimated to be 1.52 percent—about 1/2 percentage point higher than the first release.
Switching to the trimmed-mean index, this index is also subject to revisions, but such revisions tend to be smaller than those of the index excluding food and energy, as shown by the fact that the green lines are less dispersed around the red line.10
Table 2 gives some descriptive statistics for the revisions that we define as the difference between the current-vintage estimates (the red line in Figure 3) and the real time estimates (the corresponding black dots in Figure 3). In absolute terms, the mean revision is 19 basis points for the measure excluding food and energy and 12 basis points for the trimmed-mean measure. In addition to being smaller, the revisions to the trimmed mean are also less volatile: The standard deviation of the revision to the trimmed-mean inflation measure is 11 basis points, compared with 23 basis points for the change in the index excluding food and energy. Given its smaller bias and variability, the root-mean-square error for the trimmed-mean measure is also smaller than the one for the index excluding food and energy.
Table 2: Statistics on PCE inflation revisions
| Total | exFE | DTM | |
|---|---|---|---|
| Mean | 0.03 | 0.09 | 0.09 |
| Mean Absolute Value | 0.17 | 0.19 | 0.12 |
| Standard Deviation | 0.24 | 0.23 | 0.11 |
| Root Mean Squared Error | 0.24 | 0.25 | 0.14 |
Note: Difference between current vintage and the first release of the 12-month percent change; "Total" refers to "Total PCE price inflation". "exFE" refers to "PCE price inflation excluding food and energy". "DTM" refers to "Dallas FED Trimmed Mean PCE price inflation".
Source: Authors' calculations on Bureau of Economic Analysis (BEA) and Federal Reserve Bank of Dallas data.
Summing up, both measures of core inflation are subject to revisions, though the revisions are larger for the index excluding food and energy than the trimmed mean. This evidence suggests that the first release of the index excluding food and energy should be interpreted with care. Also, this evidence suggests that from the point of view of the stability across data vintages, the trimmed mean is preferable over the index excluding food and energy.
A summing up
We have assessed the relative performance of two measures of core inflation according to three metrics: the measure's ability to match the mean rate of total PCE price inflation with a lower degree of variability; its susceptibility to revisions; and its ability to predict future inflation.
Our results do not identify one measure as clearly preferable to the other. The rate of change in PCE prices excluding food and energy price offers the advantage of having the same mean as total PCE price inflation over sufficiently long samples, but is more affected by data revisions than the trimmed mean. In contrast, the trimmed-mean is less subject to subsequent revision, but the index has tended to rise faster than the total PCE price index over the past 20 years or so. Finally, from a forecasting perspective, the two core measures anticipate future movement of total inflation better than total inflation itself; however, neither clearly outperforms the other.
In conclusion, our results suggest that the two indexes of core inflation should be viewed as complementary tools for gauging the underlying pace of inflation.
References
Blinder, Alan S. (1997), "Measuring short-run inflation for central bankers – commentary", Review, Federal Reserve Bank of St. Louis, pages 157-160.
Brischetto, Andrea, and Anthony Richards (2007). "The Performance of Trimmed Mean Measures of Underlying Inflation." Revised version of Reserve Bank of Australia, RBA Research Discussion Paper 2006-10. Presented at Federal Reserve Bank of Dallas, Conference on Price Measurement for Monetary Policy, May 24–25, 2007.
Bryan, Michael F., and Stephen G. Cecchetti (1994). "Measuring Core Inflation," in N.G. Mankiw, editor, Monetary Policy. Chicago: University of Chicago Press, pp. 195–215.
Bryan, Michael F., and Christopher J. Pike. (1991). "Median price changes: An alternative approach to measuring current monetary inflation." Economic Commentary, Federal Reserve Bank of Cleveland (December).
Catte, Pietro, and Torsten Sløk (2005). "Assessing the Value of Indicators of Underlying Inflation for Monetary Policy," OECD Economics Department Working Papers: 461.
Clark, Todd E. (2001). "Comparing Measures of Core Inflation," Federal Reserve Bank of Kansas City Economic Review, vol. 86, no. 2, pp. 5–31.
Cogley, Timothy (2002), "A Simple Adaptive Measure of Core Inflation," Journal of Money, Credit, and Banking, Vol. 34, No. 1 (Feb., 2002), pp. 94–113.
Crone, Theodore, N. Neil K. Khettry, Loretta J. Mester, and Jason A. Novak (2011). "Core Measures of Inflation as Predictors of Total Inflation," Federal Reserve Bank of Philadelphia Research Department Working Paper No. 11-24. June.
Detmeister A., "The Usefulness of Core PCE Inflation Measures," Finance and Economics Discussion Series Divisions of Research & Statistics and Monetary Affairs Federal Reserve Board, Washington, D.C., Working Paper No. 56, 2011.
Dolmas, Jim (2005). "Trimmed Mean PCE Inflation," Federal Reserve Bank of Dallas, Working Papers: 05-06.
Dolmas, Jim and Koenig, Evan F. (2019), "Two Measures of Core Inflation: A Comparison", Federal Reserve of Dallas Working Papers Series, No. 1903.
Freeman, Donald G. (1998). "Do Core Inflation Measures Help Forecast Inflation?" Economics Letters, vol. 58, no. 2, pp. 143–147.
Koenig, Evan F., Dolmas, Shelia, Piger, Jeremy, 2003. The use and abuse of real-time data in economic forecasting. The Review of Economics and Statistics 85, 618–628.
Rich R., and Steindel C. (2007). "A comparison of measures of core inflation." Economic Policy Review, Vol. 13, No.3.
Robalo Marques, Carlos, Pedro Duarte Neves, and Luis Morais Sarmento (2003). "Evaluating Core Inflation Indicators," Economic Modelling, vol. 20, no. 4, pp. 765–775.
Wynne, Mark A. (2008). "Core Inflation: A Review of Some Conceptual Issues," Federal Reserve Bank of St. Louis Review, vol. 90, no. 3, part 2, pp. 205–209.
1. We are grateful to Jeremy Rudd, David Lebow, Jim Dolmas, Evan Koenig, Christopher Waller, Mark Wynne, and the economists and officers in the Research and Statistics division at the Board of Governors of the Federal Reserve System for valuable comments. Any remaining errors are ours. Return to text
2. Conceptually, core inflation measures can be grouped into several categories: exclusion indexes, central-tendency statistical measures, variance-weighted indexes, regression-weighted indexes, model-based trend inflation measures, and component-smoothing indexes. A non-exhaustive list of contributions in this literature includes Brischetto and Richards (2007), Bryan and Cecchetti (1994), Bryan and Pike (1991), Catte and Sløk (2005), Cecchetti (1997), Clark (2001), Cogley (2002), Crone, et al. (2011), Detmeister (2011), Dolmas (2005), Freeman (1998), Rich and Steindel (2007), and Robalo Marques, et al. (2003). For a review of this literature, see Wynne (2008). Return to text
3. Blinder (1997) has also argued that "The real reason [why food and energy prices were excluded from the overall index] was that the prices of food (really, food at home) and energy are, for the most part, beyond the control of the central bank" (p. 160). Return to text
4. Bryan and Cecchetti (1994) applied this concept first to the consumer price index, and then Dolmas (2005) adopted the idea for PCE prices. Return to text
5. These thresholds were calibrated using data on monthly price changes from February 1977 to June 2009, and were chosen so as to minimize the difference between trimmed-mean inflation and a measure of trend inflation. In detail, three different notions of trend were considered, and the trimming proportions minimize the average root mean squared error between the trimmed mean and each of the three. The three trends are a centered 36-month moving average, a forward 24-month moving average, and a band-pass filtered trend (with the pass-band chosen to correspond to the frequency range policy-makers seemed to respond to, see Dolmas 2005 for details). Return to text
6. The 2001 swing in the PCE price index excluding food and energy was driven by the price index for life insurance, which plunged 55 percent in September 2001 and jumped 121 percent in October 2001 as a result of the 9/11 terrorist attacks. Return to text
7. An alternative approach to compute these descriptive statistics is to use only first release data, as suggested by Koenig et al. (2003). Dolmas and Koenig (2019) follow this approach and argue that the trimmed mean has not averaged higher than actual inflation in the sub-samples reported in the table. Return to text
8. In practice, we follow Detmeister (2011) and use the following forecasting equation for total PCE price inflation: $$ \pi_{t+h,t} = \alpha + \pi^c_{t,t-s} + \varepsilon_{t+h,t}$$, where $$\pi_{t+h,t}$$ is total PCE price inflation between month t and month t+h (expressed at an annual rate), $$\pi^c_{t,t-s}$$ is a specified measure of core inflation between month t–s and month t (again at an annual rate), and $$\alpha$$ is the average difference between total and core inflation over the past ten years, and $$\varepsilon_{t+h,t}$$ is a prediction error. Note that the inclusion of α means that the trimmed mean is not penalized in this exercise for averaging a little higher than overall PCE inflation over the past 20 years. Return to text
9. CPIs are the most important source data for PCE prices, and because the CPI is not revised (except for seasonal factors), revisions to PCE prices typically come from either PPIs or from the non-market components, most of which are imputed and noisy. Return to text
10. A priori, neither of the two indexes is necessarily more stable than the other across vintages on purely theoretical grounds. That said, we can advance two possible explanations for this empirical fact. First, if an item is revised and the revision is sufficiently large to push it in the tail of the distribution, the item is removed by the trimmed mean while it is nevertheless included in the index excluding food and energy. Second, there might be a correlation between the size of the price change in the first release and the subsequent revision, and hence the items that revise the most would be those initially removed by the trimmed mean. Return to text
Luciani, Matteo, and Riccardo Trezzi (2019). "Comparing Two Measures of Core Inflation: PCE Excluding Food & Energy vs. the Trimmed Mean PCE Index," FEDS Notes. Washington: Board of Governors of the Federal Reserve System, August 2, 2019, https://doi.org/10.17016/2380-7172.2390.
Disclaimer: FEDS Notes are articles in which Board staff offer their own views and present analysis on a range of topics in economics and finance. These articles are shorter and less technically oriented than FEDS Working Papers and IFDP papers.