FEDS Notes
January 04, 2019
Household and Nonprofit Balance Sheets in the Financial Accounts of the United States
Elizabeth Holmquist1
Overview
This Note describes new supplemental tables in the Financial Accounts of the United States that provide separate balance sheets for households and nonprofit organizations. Traditionally, households and nonprofit organizations have been combined in the Financial Accounts, because data sufficient for breaking out nonprofit organizations into a separate sector have not been available. In particular, since comprehensive sector-specific data have not been available for either households or nonprofits, the two have been jointly estimated in table B.101 as the residual holders of assets and liabilities after all other sectors have been accounted for. However, because the ability to analyze the two sectors separately is a high priority for many users, we have introduced two supplementary balance sheet tables, B.101.h and B.101.n, which provide separate, though less detailed, balance sheets for households and nonprofits, respectively. We hope that these tables, first included in the September 2018 publication, will be useful to analysts and researchers seeking to examine the two sectors separately (for example, by creating a household table more comparable to household surveys).2
Construction of B.101.n
The data for nonprofit organizations come from several sources. Some nonprofit series have long been shown separately on table B.101, including nonfinancial assets (primarily derived from Bureau of Economic Analysis data and real estate price indexes), syndicated loans, consumer credit (student loans), and municipal securities outstanding. The new table B.101.n combines these series with series derived from annual tax return data reported in the IRS Statistics of Income (SOI).3 To estimate quarterly data between SOI benchmarks as well as data after the latest available SOI benchmark, we use stock and bond price indexes for the market values for nonprofits' holdings of debt securities and equity and investment fund shares. For other series from the tax returns, we linearly interpolate between benchmarks and use a perpetual inventory method based on the moving average of previous periods' transactions after the last benchmark.
Figure 1 below shows the broad asset and liability categories of nonprofit organizations, while the bold black line shows the sector's net worth (about $7 trillion as of 2018:Q3). Nonfinancial assets (yellow), particularly real estate, account for the largest portion of nonprofits' wealth.
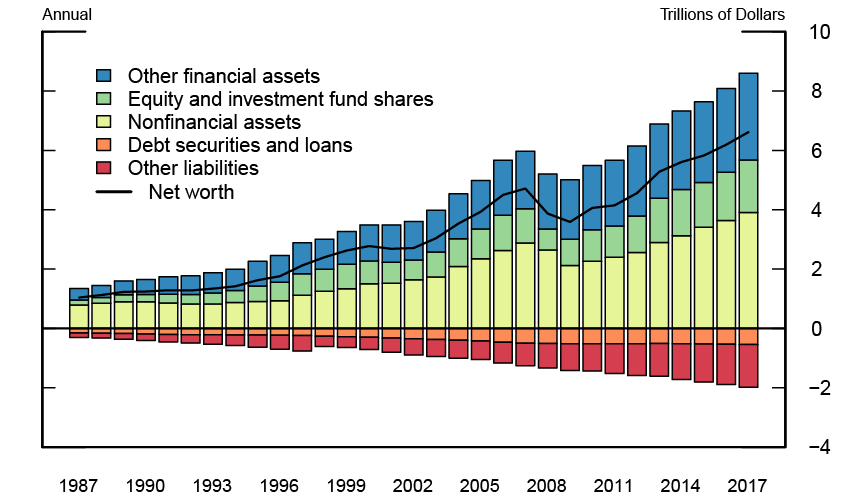
Note: Components are labeled from top to bottom.
Source: Financial Accounts of the United States.
Construction of B.101.h
Roughly speaking, we construct B.101.h residually by subtracting the assets and liabilities of nonprofits from the data reported on table B.101. However, some exceptions and caveats apply. First, we assume that nonprofits do not hold owner-occupied real estate, consumer durable goods, cash accounts at brokers, life insurance reserves, pension entitlements, equity in non-corporate business, or identified miscellaneous assets, and thus these asset categories from B.101 are allocated to households.4 Similarly, the B.101 liability categories home mortgage loans, consumer credit, and deferred and unpaid life insurance premiums are attributed to households only.
The household portion of the remaining B.101 asset categories, such as checkable deposits and currency, money market fund shares, and mortgages, and liability categories, such as depository institution loans n.e.c. and other loans and advances, are calculated by subtracting the nonprofit holdings from the B.101 holdings. Because the instrument detail available for B.101.n is less than that of B.101, we first group the B.101 instrument categories more broadly to match the lower level of detail available for the nonprofit organizations. In particular, we combine holdings of foreign deposits and time and savings deposits to make the new financial asset category "time deposits and short-term investments"; Treasury, agency-and GSE-backed, and municipal securities are summed together to make "U.S. government and municipal securities"; and holdings of corporate equities and mutual fund shares are also combined.
Figure 2 below shows the broad assets and liability categories of households, while the bold black line shows the sector's net worth. Nonfinancial assets (dark blue), particularly real estate, are the largest asset category on the household balance sheet, while home mortgages (gold) account for most of the liabilities.
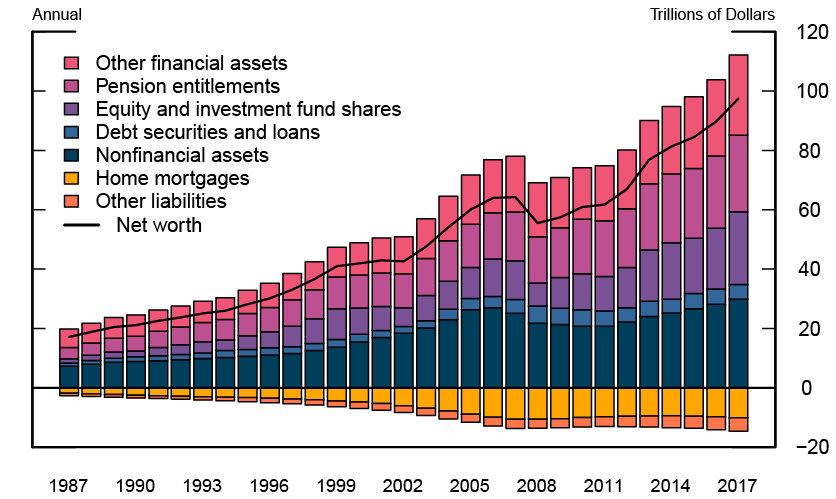
Note: Components are labeled from top to bottom.
Source: Financial Accounts of the United States.
The memo section at the bottom of table B.101.h shows a reconciliation between B.101 and the sum of B.101.h and B.101.n. While the sums of the instrument categories on B.101.h and B.101.n generally equal the series shown B.101, some adjustments are needed. In particular, nonprofit organizations' miscellaneous assets and liabilities are shown on table B.101.n, but are not included on table B.101.5 In addition, some loans that are included in nonprofit organizations' asset holdings are not included in the measure of other loans and advances that appears on table B.101.6
Discussion
Figure 3 below shows the combined net worth of households and nonprofit organizations as presented on the new supplemental tables. What stands out immediately is that the vast majority of B.101 net worth comes from households, rather than nonprofits. Despite the growth of the nonprofit sector over the last thirty years, they still represent only about 6% of the combined sector's wealth, a share that has been quite stable over the time period.
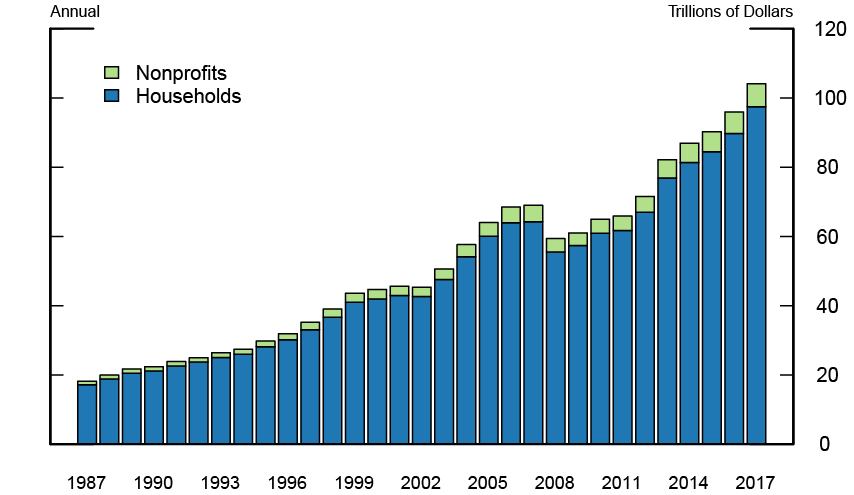
Note: Components are labeled from top to bottom.
Source: Financial Accounts of the United States.
While we hope these new supplementary balance sheets will be useful to many users of the Financial Accounts, some caveats should be kept in mind. For example, religious organizations and other nonprofit institutions with less than $25,000 in annual gross receipts are not required to file with the IRS and are therefore not included in the nonprofit organizations sector. More fundamentally, because B.101.h is calculated residually from B.101, which is itself calculated residually, any data issues that stem from residual calculation come to rest in B.101.h. In particular, as residual tables, both B.101.h and B.101 will include the assets and liabilities of institutions that are not well captured elsewhere in the Financial Accounts, the most prominent of which are hedge funds and other private equity funds.7
Another consequence of residual calculation for B.101 and B.101.h concerns debt securities. Because we are midway through a long-term project to transition debt securities from book value to market value (as data come available for each sector), some sectors show debt securities at book value and some show them at market value. As a result, the residually calculated tables B.101 and B.101.h show debt securities as a blend of book and market values. This issue will be resolved over time as we complete the transition to market value.
A final caveat is that the financial instrument categories in B.101 and B.101.n do not match perfectly. For example, U.S. Treasury bills and other short-term government obligations are included with debt securities in B.101 but are included with time deposits and short-term investments in B.101.n. In both cases, the short-term government securities are not separately identifiable.
Despite these caveats, the new supplementary balance sheet tables for households and nonprofits are a significant new feature of the Financial Accounts. Not only do they allow a user to get a better sense of relative sizes of the household and nonprofit sectors, they also make the Financial Accounts more useful for certain types of research. In particular, B.101.h can be used to better align the Financial Accounts with other household-sector datasets, such as the Survey of Consumer Finances. Finally, these new supplementary tables are a prerequisite to future development of fully independent household and nonprofit organization sectors in the Financial Accounts.
1. I thank Marco Cagetti, Susan McIntosh, and Paul Smith for comments and suggestions. The analysis set forth here are those of the author and do not indicate concurrence by the Federal Reserve System, its Board of Governors, or staff. Return to text
2. Supplementary tables for nonprofits were included in some previous vintages of the Financial Accounts as tables F.101.a and L.101.a. These tables did not include nonfinancial assets and were only available at an annual frequency with a several year lag. The new nonprofit table, B.101.n, includes nonfinancial assets and data through the latest publication period. While the published tables B.101.n and B.101.h show annual levels data, quarterly data are available in the Federal Reserve's Data Download Program. Return to text
3. Nonprofit organizations are exempt from federal income tax under sections 501(c)(3)-(9) and file form 990 with the IRS. These organizations include educational, charitable, scientific, or literary organizations; hospitals; civic and business leagues; and social and recreational clubs (among others). Also included in the nonprofit sector are private foundations and charitable trusts, which both file IRS form 990-PF. Religious organizations and other institutions with less than $25,000 in annual gross receipts are not required to file with the IRS and are therefore excluded from the sector. Return to text
4. Cash accounts at brokers is a sub-component of the other loans and advances series shown on table B.101. Miscellaneous assets include Postal Saving System deposits, life insurance company reserves, policy receivables from property-casualty insurance companies, and retiree health care funds. Return to text
5. Table B.101 has never included the unidentified miscellaneous assets or liabilities of households and nonprofit organizations. Significant changes to the Financial Accounts were not within the scope of this project, though we may revisit this issue in the future. Return to text
6. Other loans and advances on table B.101 is calculated as the sum of cash accounts at brokers and dealers and syndicated loans. Cash accounts at brokers are assumed to be held exclusively by households while syndicated loans are assumed to be included in the measure of nonprofit organizations loans shown on table B.101.n. Return to text
7. We plan to create a new sector for hedge funds and other private funds when sufficient data become available; until then, they will be included in both B.101 and B.101.h. Return to text
Holmquist, Elizabeth (2019). "Household and Nonprofit Balance Sheets in the Financial Accounts of the United States," FEDS Notes. Washington: Board of Governors of the Federal Reserve System, January 4, 2019, https://doi.org/10.17016/2380-7172.2313.
Disclaimer: FEDS Notes are articles in which Board staff offer their own views and present analysis on a range of topics in economics and finance. These articles are shorter and less technically oriented than FEDS Working Papers and IFDP papers.