FEDS Notes
January 31, 2020
How Do U.S. Global Systemically Important Banks Lower Their Capital Surcharges?
Jared Berry, Akber Khan, and Marcelo Rezende1
Introduction
In recent years, many countries introduced surcharges on global systemically important banks (G-SIBs). G-SIB surcharges are an amount of capital that G-SIBs must hold in excess of minimum requirements and that increases with banks' systemic importance indicators. G-SIB surcharges incentivize banks to lower their indicators, which may decrease the risks that G-SIBs impose on financial stability, but may also adversely affect the economy, for example, if banks restrict the supply of certain services to reduce these indicators. In this note, we examine whether and how U.S. G-SIBs adjust their systemic importance indicators to lower their surcharges.
We present evidence that U.S. G-SIBs mainly reduce one indicator of systemic importance—the notional amount of over-the-counter (OTC) derivatives. G-SIBs lower these amounts in the fourth quarter of each year, the quarter that the Federal Reserve Board (FRB) uses to determine G-SIB surcharges. We show that this seasonal adjustment is stronger at G-SIBs than at other banks, and that it became more pronounced after the G-SIB surcharge was introduced in 2016. 2 These findings are consistent with reports that U.S. bank managers have lowered surcharges to a large extent by compressing OTC derivatives—terminating offsetting contracts and replacing them with another contract with the same market risk but a lower notional amount than the terminated contracts (Woodall and Osborn, 2017; Younger and Ho, 2018).
Background
The G-SIB surcharge was introduced on January 1, 2016, was fully phased in on January 1, 2019, and is applied to the capital conservation buffer of the bank holding company (bank, henceforth).3 The U.S. G-SIB rule requires that a bank whose method 1 score—a measure of systemic importance—exceeds a certain threshold be identified as a G-SIB and be subject to capital surcharges. The method 1 score of a bank is a linear combination of 12 systemic importance indicators distributed into 5 categories: size, interconnectedness, cross-jurisdictional activity, substitutability, and complexity.4
A bank designated as a G-SIB must also calculate a method 2 score. The method 2 score replaces the substitutability measures with a metric of the bank's use of short-term wholesale funding. Based on its method 1 and 2 scores, a G-SIB is assigned method 1 and 2 surcharges, respectively. The G-SIB surcharge of a bank is the highest of the method 1 and 2 surcharges. Surcharges of U.S. G-SIBs currently range between 1.0 percent and 3.5 percent of risk-weighted assets.
Data
We use bank-level data from two datasets. Systemic importance indicators come from the Banking Organization Systemic Risk Reports (FR Y-15). During our sample period, all banks with total consolidated assets above a certain threshold had to report FR Y-15 data and are thus included in the sample.5 We also use quarterly data on bank characteristics collected from the Consolidated Financial Statements for Holding Companies (FR Y-9C), namely data on the notional amount of interest rate swap, forward, and option contracts. Interest rate OTC derivatives are by far the largest category of OTC derivatives at U.S. banks.6 G-SIBs are larger and have higher values than non-G-SIBs for every systemic importance indicator, on average. However, G-SIBs' and non-G-SIBs' values overlap for most systemic importance indicators, suggesting that non-G-SIBs can serve as a control group to study how G-SIBs respond to surcharges. All the data used in this note are public and available upon request.
Results
We examine whether systemic importance indicators of G-SIBs drop in the fourth quarter compared with indicators of non-G-SIBs.7 These drops can be interpreted as attempts by banks to window-dress to avoid or reduce G-SIB surcharges.
Figure 1 shows estimates of changes in 13 systemic importance indicators of G-SIBs in the fourth quarter. The estimate of this effect is only statistically significant for the notional amount of OTC derivatives, and implies that OTC derivatives held by G-SIBs drop 13.4 percent relative to non-G-SIBs at year-end, a large effect.8
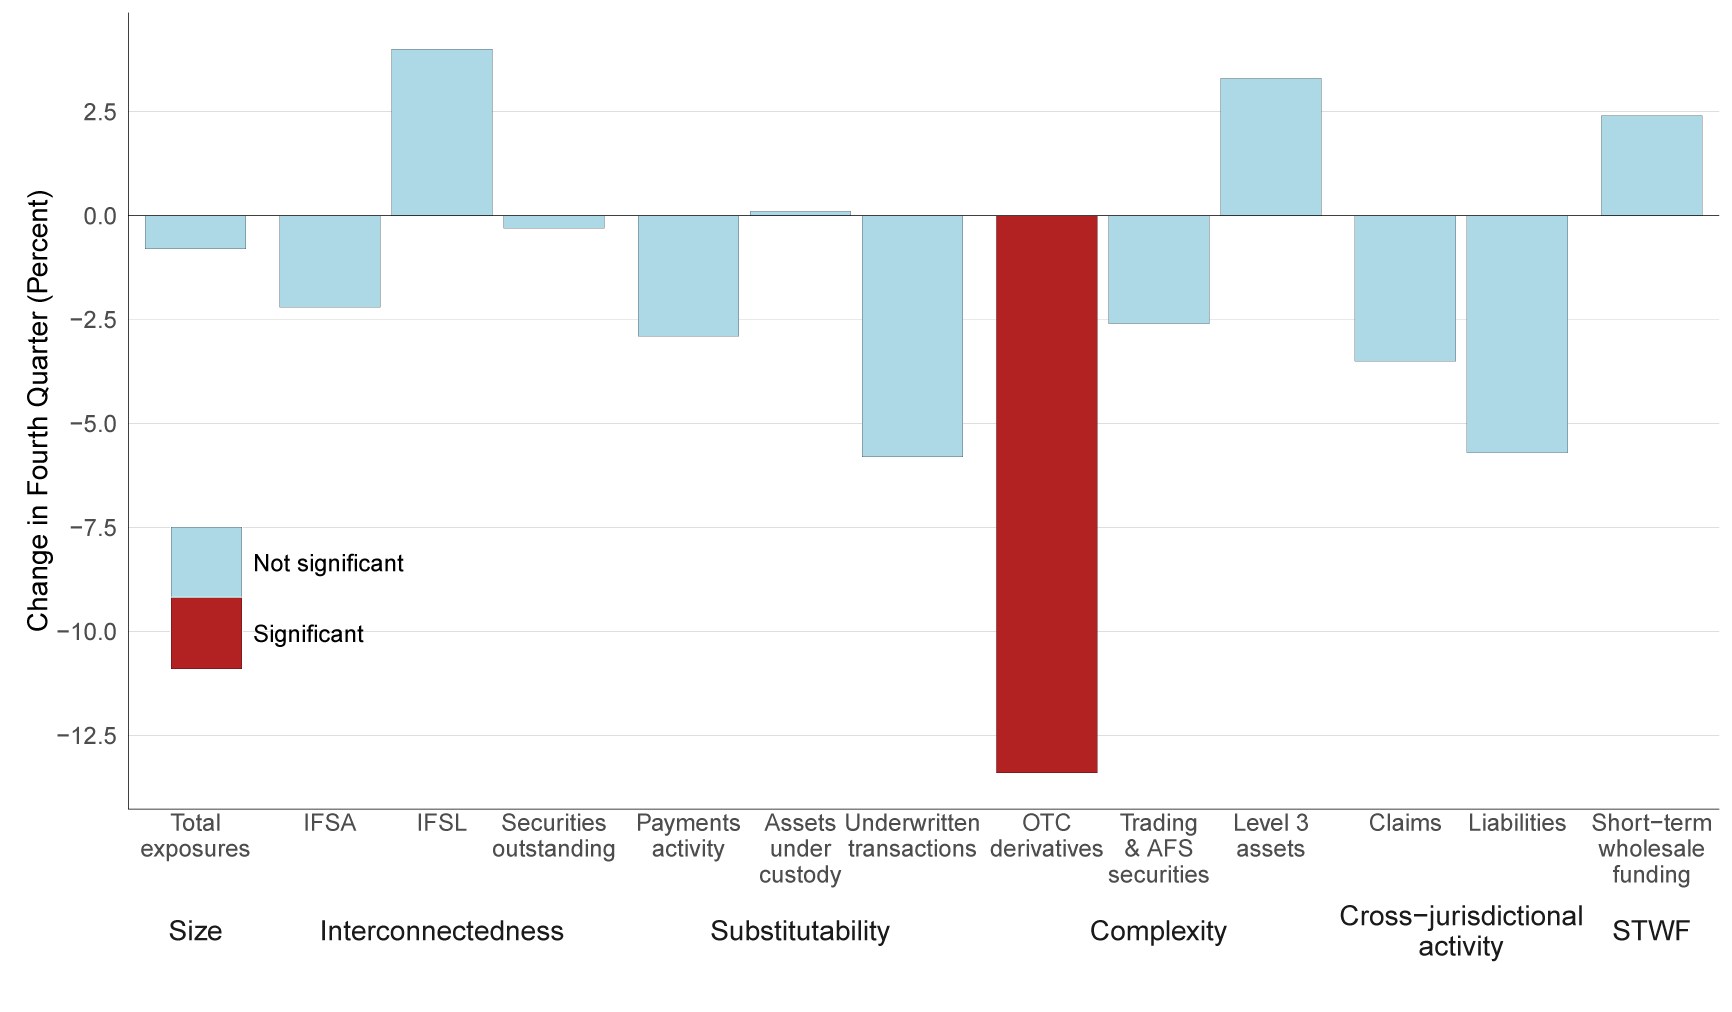
Note: This figure shows estimates of the change in systemic importance indicators of G-SIBs in the fourth quarter of each year. We estimate these changes using a differences-in-differences equation in which G-SIBs are the treatment group, non-G-SIBs are the control group, and the dependent variable is the natural logarithm of systemic importance indicator measured in dollar amounts. The regression equation allows indicators of G-SIBs and non-G-SIBs to jump by different amounts when surcharges were introduced and to follow different time trends. The equation includes bank characteristics, bank and time fixed effects, and controls for quarterly variation between G-SIBs and non-G-SIBs in the second and third quarter, leaving the first quarter as the reference case. The red color indicates that the estimate of the change is statistically significant at the 5 percent level. AFS, IFSA, IFSL, and STWF are available-for-sale, intra-financial system assets, intra-financial system liabilities, and short-term wholesale funding, respectively.
To better understand how banks adjust OTC derivatives amounts to avoid or lower G-SIB surcharges, we next examine the quarterly variation of measures of interest rate OTC derivatives using the FR Y-9C data. These quarterly data start in 1996 and allow us to determine whether the seasonal drop in notional amounts of OTC derivatives of G-SIBs relative to non-G-SIBs did actually begin when G-SIB surcharges were introduced, in 2016. We now estimate differences in the notional amounts of OTC derivatives of G-SIBs relative to non-G-SIBs in the fourth quarter of each year after the G-SIB surcharge was introduced. Estimates of these changes provide stronger evidence of window-dressing by G-SIBs than the tests presented in figure 1 because we can now separate seasonal differences between G-SIBs and non-G-SIBs observed prior to the introduction of the G-SIB surcharge from seasonal differences observed after the introduction.
Figure 2 shows estimates of changes in the notional amounts of interest rate swap, forward, and option contracts. The estimates provide further evidence of a drop in OTC derivative amounts by G-SIBs relative to non-G-SIBs after the introduction of the surcharge. The estimates are large, negative, and statistically significant for the two categories of interest rate OTC derivatives with the largest notional amounts. The estimates indicate that the notional amounts of interest rate swap and forward contracts drop about 10.4 percent and 24.3 percent in the fourth quarter by G-SIBs relative to non-G-SIBs after the introduction of the surcharges. The estimate of these changes in the notional amounts of interest rate OTC options is small and not statistically significant, suggesting that G-SIB surcharges do not affect the seasonality of the options for G-SIBs compared with non-G-SIBs.
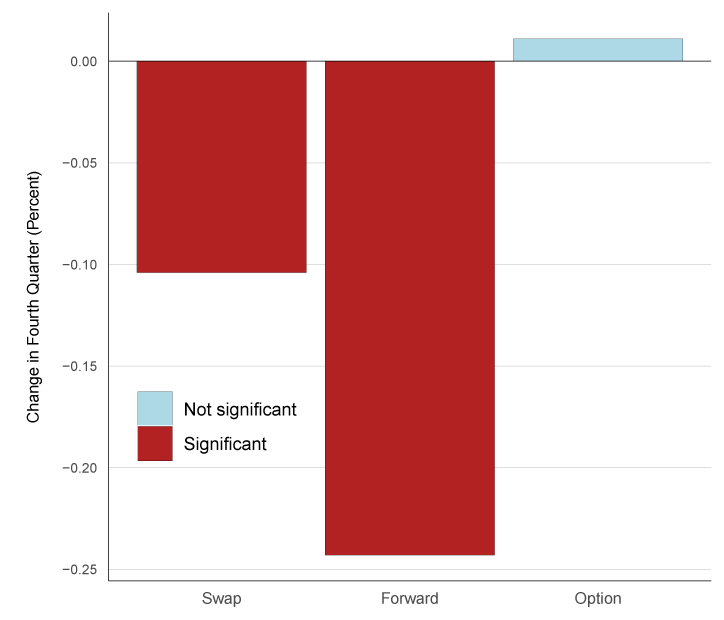
Note: This figure shows estimates of the change in the notional amounts of interest rate OTC derivative contracts of G-SIBs in the fourth quarter of each year after the introduction of G-SIB surcharges. We estimate these changes using a differences-in-differences equation in which G-SIBs are the treatment group, non-G-SIBs are the control group, and the dependent variable is the natural logarithm of the notional amount of interest rate swap, forward, and option contracts measured in dollar amounts. The regression equation allows indicators of G-SIBs and non-G-SIBs to jump by different amounts when surcharges were introduced and to follow different time trends. The equation includes bank characteristics, bank and time fixed effects, and controls for quarterly variation between G-SIBs and non-G-SIBs in the second and third quarter, leaving the first quarter as the reference case. The red color indicates that the estimate of the change is statistically significant at the 5 percent level.
Conclusion
In this note, we examine how U.S. G-SIBs respond to capital surcharges. Consistent with recent analysis (Woodall and Osborn, 2017; Younger and Ho, 2018), we find that efforts to reduce surcharges are concentrated in compression of OTC derivatives: G-SIBs lower notional amounts of OTC derivatives in the fourth quarter of each year, the quarter that the FRB uses to determine G-SIB surcharges. These findings indicate that the costs and benefits of adjustments vary materially across indicators and support the view that compression of OTC derivatives is one of the most attractive alternatives because it allows banks to eliminate redundant contracts while keeping market risk unchanged.
References
Behn, Markus, Giacomo Mangiante, Laura Parisi, and Michael Wedow (2019). "Behind the Scenes of the Beauty Contest: Window Dressing and the G-SIB Framework," ECB Working Paper Series No. 2298. Frankfurt: European Central Bank, July, https://www.ecb.europa.eu/pub/pdf/scpwps/ecb.wp2298~c461fb89c7.en.pdf.
Board of Governors of the Federal Reserve System (2015). "Regulatory Capital Rules: Implementation of Risk-Based Capital Surcharges for Global Systemically Important Bank Holding Companies," final rule (Docket No. R-1505), Federal Register, vol. 80 (August 14), pp. 49082–116.
Woodall, Louie, and Tom Osborn (2017). "JP Morgan Urges Clients to Compress over G-Sib Fears," Risk.net, available at www.risk.net/risk-management/5368461/g-sib-clearing-proposal-sparks-compression-drive-at-jp-morgan.
Younger, Joshua, and Teresa Ho (2018). "Revisiting GSIB Dynamics around Year-End," research note, J.P. Morgan North America Fixed Income Strategy, September 10.
1. We thank Christopher Appel, Rochelle Edge, Giovanni Favara, Holly Kirkpatrick, and Rebecca Zarutskie for comments. The analysis and conclusions are those of the authors and do not necessarily reflect the views of the Federal Reserve System, its Board of Governors, or its staff. Jared Berry is at Morning Consult and was previously at the Federal Reserve Board. Akber Khan and Marcelo Rezende are at the Federal Reserve Board. Return to text
2. Behn, Mangiante, Parisi, and Wedow (2019) also present evidence that European banks also adjust their activities to reduce G-SIB surcharges in the fourth quarter. Return to text
3. The capital conservation buffer of a bank is the minimum of (i) the common equity tier 1 capital ratio minus 4.5 percent, (ii) the tier 1 capital ratio minus 6.0 percent, and (iii) the total capital ratio minus 8.0 percent. Of note, the scope and the effect of the G-SIB designation and surcharge is not limited to the capital conservation buffer. For instance, the G-SIB surcharge is applied to a G-SIB's external total loss-absorbing capacity and long-term debt requirements. Return to text
4. A bank holding company that is an advanced approaches banking organization and is not a consolidated subsidiary of a foreign bank organization must calculate a method 2 score. Federal Register (2015) details how method 1 and 2 scores and surcharges are calculated. Return to text
5. The assets threshold was $50 billion at the start of the sample period and increased to $100 billion in the second quarter of 2018. Currently, 8 U.S. banks are G-SIBs: Bank of America, Bank of New York Mellon, Citigroup, Goldman Sachs, JP Morgan Chase, Morgan Stanley, State Street, and Wells Fargo. The 20 non-G-SIB banks in the sample are Ally, American Express, BB&T, BBVA Compass, BMO Financial, Capital One, Citizens Bank, Discover, Fifth Third, HSBC, Huntington Bank, Keycorp, M&T Bank, MUFG, Northern Trust, PNC, Regions Financial, Santander, SunTrust, US Bank, and Union Bank. The FR Y-15 data in this note range from the fourth quarter of 2013 to the third quarter of 2019. These data were collected annually in the fourth quarter of 2013 to 2015 and became quarterly in the second quarter of 2016. Return to text
6. In addition, we use data on total assets, total capital ratio, tier 1 capital ratio, leverage ratio, return on assets, return on equity, net interest margin, delinquency ratio, and charge-off ratio. The FR Y-9C data in this note range from the fourth quarter of 1996 to the third quarter of 2019. Return to text
7. For this purpose, we use a differences-in-differences equation in which G-SIBs are the treatment group, non-G-SIBs are the control group, and the dependent variable is the natural logarithm of the respective systemic importance indicator measured in dollar amounts. The equation allows indicators of G-SIBs and non-G-SIBs to jump by different amounts when surcharges were introduced and to follow different time trends. The regression equation includes bank characteristics from the Y-9C data and bank and time fixed effects and controls for quarterly variation between G-SIBs and non-G-SIBs in the second and third quarter, leaving the first quarter as the reference case. Behn, Mangiante, Parisi, and Wedow (2019) use a similar strategy to examine window-dressing by banks. Return to text
8. The amount of short-term wholesale funding that banks report in the FR Y-15 data is a daily average across the whole year, which implies that this indicator should not be subject to the fourth-quarter declines for G-SIBs relative to non-G-SIBs that we estimate. Return to text
Berry, Jared, Akber Khan, and Marcelo Rezende (2020). "How Do U.S. Global Systemically Important Banks Lower Their Capital Surcharges?," FEDS Notes. Washington: Board of Governors of the Federal Reserve System, January 31, 2020, https://doi.org/10.17016/2380-7172.2480.
Disclaimer: FEDS Notes are articles in which Board staff offer their own views and present analysis on a range of topics in economics and finance. These articles are shorter and less technically oriented than FEDS Working Papers and IFDP papers.