FEDS Notes
December 21, 2018
The Ins and Outs of Collateral Re-use
Sebastian Infante, Charles Press, and Jacob Strauss (University of Minnesota)1
Executive Summary
In this article, we empirically document how primary dealers use and re-use collateral in the United States. Using confidential supervisory data, we precisely map the flow of collateral to and from individual dealers and identify whether the collateral used in those transactions is encumbered or rehypothecated. From these data, we can characterize how different cash and secured financing transactions affect dealers' balance sheets and present some stylized facts of their operations. We present three measures of collateral use and re-use at the dealer level to proxy for the amount of collateral circulation in the U.S. financial system. We find evidence from one of our measures that the degree of collateral circulation is significantly higher for U.S. Treasury securities and highlight the special role repurchase agreements (repos) play in their intermediation. Characterizing dealers' use and re-use of collateral contributes to ongoing research aimed at understanding how collateral circulation improves market functioning by increasing the availability of collateral but may also lead to financial fragility by increasing the amount of interconnectedness in the financial system.
1. Introduction
The circulation of collateral--or, more specifically, the circulation of financial securities that can be used as collateral in financial contracts--provides numerous benefits for market efficiency.2 In a world where collateral can be scarce, the ability to freely circulate collateral alleviates some of the costs associated with scarcity. The use of collateral can be beneficial in many ways. For example, collateral can be used to quickly raise funds through secured financing transactions (SFTs) or to satisfy margin requirements on derivatives positions. The re-use of collateral--defined as the outflow of collateral that is sourced through an SFT and returned at a later date--allows for the efficient distribution of the aforementioned benefits. For example, collateral can be re-used to easily finance secured loans extended to clients (a process known as rehypothecation) or to source securities in order to sell them (a process known as shorting). All of those activities enhance the collateral's underlying market liquidity and increase efficiency by distributing collateral to where it is needed most.
However, the free circulation of collateral comes at a cost. Namely, the re-use of collateral increases interconnectedness and can contribute to fragility in financial markets by increasing the uncertainty regarding who holds the collateral, the ability of counterparties to return the collateral, and who is entitled to the collateral in case of default. The use and re-use of collateral can create long "collateral chains" in which one security is used for multiple transactions. These collateral chains have the potential to propagate uncertainties and amplify fragility in times of market stress.
The important role of collateral circulation--and the financial stability concerns that come with it--has garnered increased interest from market participants, academics, and policymakers in understanding and measuring how collateral circulates throughout the financial system. There has also been increased interest in understanding how new regulatory initiatives such as the enhanced supplementary leverage ratio (eSLR) and the liquidity coverage ratio have affected collateral circulation. Regrettably, data on collateral circulation are scant, and much of the existing literature has relied on aggregates and significant assumptions on market functioning in an attempt to measure how collateral circulates throughout the U.S. financial system.
In this article, we fill in the gap by providing precise measures on how collateral flows in and out at the individual firm level. Studying individual firm activity reduces the number of assumptions needed to get precise estimates on collateral circulation. Specifically, using confidential supervisory data, we are able to identify the main contracts that large financial institutions use to source and distribute different types of collateral. With these data, we are able to unpack how each contract fits into a firm's overall balance sheet and thus how these contracts contribute to the firm's overall risk profile.3 The data also identify how much of the incoming collateral is either re-used or restricted from re-use (that is, encumbered) and how much of the outgoing collateral comes from incoming SFTs (that is, rehypothecated).4 Our analysis focuses on a subset of primary dealers (PDs), both foreign and domestic, that are subsidiaries of large banks. We study their activity in different collateral classes with an emphasis on U.S. Treasury securities.
In our analysis, we observe that approximately 85 percent of collateral that flows in, simultaneously flows out, which indicates a high volume of collateral circulation through PDs. We also observe that almost all encumbered collateral becomes encumbered due to its re-use. This observation suggests that the amount of collateral that cannot be re-used for contractual, operational, or regulatory reasons is relatively small. The data also allow us to document which are the most prevalent contracts used to source and distribute collateral. For example, for U.S. Treasury securities, the vast majority of transactions involving encumbered and rehypothecated collateral are reverse repos and repos, respectively, consistent with Baklanova et al. (2016). This finding highlights the importance of repo markets to circulate "safe" collateral throughout the financial system.
Using the encumbered and rehypothecated classifications, and inspired by previous work, we are able to construct three ratios that precisely measure the amount of collateral use and re-use at the individual firm level at a daily frequency. Roughly speaking, all three ratios we propose have the same informational content but allow for different interpretations.
- The first ratio, which we label "Total Collateral Pass-Through," is the ratio of the total amount of outgoing collateral to the total amount of incoming collateral and owned assets. Intuitively, this ratio measures the amount of collateral that flows out relative to the total amount of collateral the firm can access directly.
- The second ratio, which we call "Rehypothecated Collateral Pass-Through," compares the amount of re-used collateral with the amount of collateral incoming from SFTs that is eligible for re-use. It simply measures re-use as a percentage of collateral received through SFTs that is eligible for re-use.
- The third ratio, which we refer to as the "Collateral Multiplier," is the ratio of the amount of outgoing collateral to the amount of collateral that is outright owned but financed with an SFT. In a sense, this last measure is akin to a money multiplier, as it compares the total amount of private liabilities backed by direct asset holdings, much like the amount of deposits relative to the amount of central bank reserves.
To understand how much collateral is re-used throughout the financial system, we take simple averages of our measures from the group of PDs we study. Because these firms are at the center of collateral circulation, their average activity is representative of the activity in the financial system.5 We find that for one of our three ratios, the amount of collateral circulation is markedly higher for U.S. Treasury securities than for all other collateral classes combined. Specifically, the Collateral Multiplier for U.S. Treasury securities has been fluctuating between six and nine times, whereas the Collateral Multiplier for all other collateral classes on aggregate has been more stable at around three times. Interestingly, we observe a slight downward trend in the Collateral Multiplier for U.S. Treasuries and speculate that it may be driven, in part, by the increase in the total amount of U.S. Treasury securities outstanding over the same period. An increase in U.S. Treasury securities outstanding effectively reduces the need for collateral circulation. Of note, it is difficult to attribute recent trends in collateral re-use to new regulation because it is not clear that our short sample period spans clearly defined "pre-" and "post-" regulatory periods.6
Our approach to measure collateral circulation by taking averages of individual firm activity is markedly different from that in previous literature, which has attempted to capture the total amount of collateral circulation in the financial system. In order to get a precise estimate of how collateral circulates at the system-wide level, we would need detailed data of incoming and outgoing collateral for all market participants. This level of detail is currently not available for the U.S. financial system. Previous efforts to calculate collateral circulation have made important assumptions to capture aggregate activity. For example, Singh (2011) proposes a measure of "collateral velocity" that is based on the total amount of securities large banks can access from nonbank counterparties. This estimate relies on assuming who the main collateral providers are and how they interact with large banks, which may, in reality, be fairly heterogeneous and depend on different market conventions that can change over time.
Our work is novel because we observe and map flows of collateral to and from dealers and identify whether the collateral used in those transactions is encumbered or rehypothecated. In practice, it is difficult for reporting firms to make this distinction. That is, within an asset class, the underlying collateral sourced and delivered from these transactions is in many ways fungible. But firms use their discretion to accurately classify the encumbrance or re-use of their SFTs to the best of their ability. To our knowledge, no other data set is able to identify collateral in this way.
To be clear, the data we use represent the collateral value in transactions, not cash distributed--that is, we are not quantifying accounting entries. In addition, some transactions we consider are deemed off balance sheet for accounting purposes. Our stylized balance sheet mapping is intended to capture the economic significance of each transaction.
The rest of the article is organized as follows. Section 2 describes the confidential supervisory data used in our analysis. Section 3 discusses how to map the data onto dealers' balance sheets and gives an overview of their aggregate activity. Section 4 presents our proposed measures of collateral circulation. Finally, section 5 provides concluding remarks and possible areas of future research.
2. Data
The data used in this exercise come from the FR 2052a Complex Institution Liquidity Monitoring Report, which is collected by the Federal Reserve Board in order to obtain a comprehensive view of banking organizations' liquidity profiles. In light of the global financial crisis in 2007–08, the Federal Reserve Board determined that enhanced, real-time, daily liquidity monitoring was necessary. To achieve such oversight, the FR 2052a was designed to include data detailing inflows, outflows, wholesale financing transactions, prime brokerage activities, and various other variables relevant to overall firm liquidity. The data from the FR 2052a is confidential and may not be released to the public.
Respondents are U.S. bank holding companies (BHCs) with total assets equal to or greater than $100 billion and foreign banking organizations (FBOs) with $50 billion or more in U.S. total assets or FBOs designated as Large Institution Supervision Coordinating Committee (LISCC) firms.7 Data for various subsidiaries are reported separately so that the operations of individual entities can be observed. For instance, BHCs will report operations for each bank, branch, and nonbank entity (that is, dealer, trust company, and overseas branch) that has a material effect on the parent's funding and liquidity. The size of the respondent determines the frequency at which it reports. U.S. BHCs with total assets equal to or above $700 billion or with $10 trillion or more in assets under custody are required to file daily. Other U.S. BHCs are required to file monthly. Similarly, FBOs designated as LISCC firms are required to file daily, whereas all other required FBOs submit monthly reports. LISCC-designated institutions have reported since December 2015, while non-LISCC respondents began reporting in 2017.
In this article, we primarily use data detailing secured inflows and secured outflows at the dealer level.8 Dealers report the amount of incoming and outgoing collateral via SFTs, and they classify whether the collateral is encumbered or rehypothecated. We focus on nine PDs who report daily without a lapse in reporting of over one month and have over two years of reported data. We analyze this subset for a few reasons. First, business lines that borrow and lend collateral are primarily located in the dealer entity. Second, since we pay particular attention to Treasury collateral trades and PDs are required to participate in Treasury auctions, it follows that PDs' activities in this market are of particular importance.
In our analysis, we track the flow of collateral. All values below represent the market value of collateral used in cash trades or SFTs. We simply represent economically where the transaction associated with the collateral sits on dealers' balance sheets.
3. Dealers' Securities In and Securities Out
The granularity of the data allows us to translate how different cash and financing transactions appear on a dealer's balance sheet. Box A provides a detailed description of all transaction types reported in the FR 2052a and how they affect a firm's asset position. From this perspective, we can visualize how dealers' cash trades contribute to their risk profile and how collateral circulates through them. Broadly speaking, collateral can flow in and out of a firm through two types of transactions: cash trades and SFTs. The former is the mere buying and selling of securities (including levered long and short positions), whereas the latter may take various contractual forms but economically amounts to incoming and outgoing secured financing using financial securities as collateral.
Along with measuring the total amount of collateral that flows in and out, firms' reporting allows us to identify whether incoming or outgoing collateral is labeled as encumbered or rehypothecated, respectively. Incoming collateral is encumbered when it is simultaneously used in a collateral outflow transaction or the firm is legally, contractually, or operationally restricted from recirculating it. Outgoing collateral is rehypothecated when it is sourced from another incoming SFT--that is, when the firm is not directly exposed to the collateral it is delivering.9 With these data, we can estimate the total amount of collateral these firms use and re-use (see section 4).
Figure 1 provides a reduced-form view of how cash trades and SFTs fit into a representative dealer's balance sheet. It also illustrates what constitutes encumbered or rehypothecated collateral. Although it is typically treacherous to match specific assets with specific liabilities, because we focus on transactions involving collateral, we can identify corresponding assets and liabilities through the use and re-use of the collateral. On the asset side, there are long positions (green diamonds) and incoming SFTs (blue rectangles), while on the liability side, there are short positions, outgoing SFTs, and other nonsecured funding liabilities such as equity or unsecured debt (yellow ovals). The figure aligns balance sheet items to highlight the nexus between assets where collateral flows in and liabilities where collateral flows out. Specifically, the dealer's long position can either be financed with nonsecured funding or outgoing SFTs, and its incoming SFTs can be financed by nonsecured funding, short positions, or outgoing SFTs. Regarding the dealer's assets, the figure makes clear the majority of incoming SFTs are labeled as encumbered, which can be because the collateral is re-used or because the dealer faces legal, contractual, or operational restrictions that prohibit its re-use. We refer to encumbered collateral that is not re-used as contractually encumbered collateral. Conversely, incoming collateral may be unencumbered when the dealer sourced a security through a cash trade or an SFT using nonsecured funding liabilities. Regarding the dealer's liabilities, short positions and outgoing SFTs are labeled as rehypothecated if the collateral was sourced through an incoming SFT. Outgoing SFTs labeled as non-rehypothecated can come only from the dealer's levered long positions.10
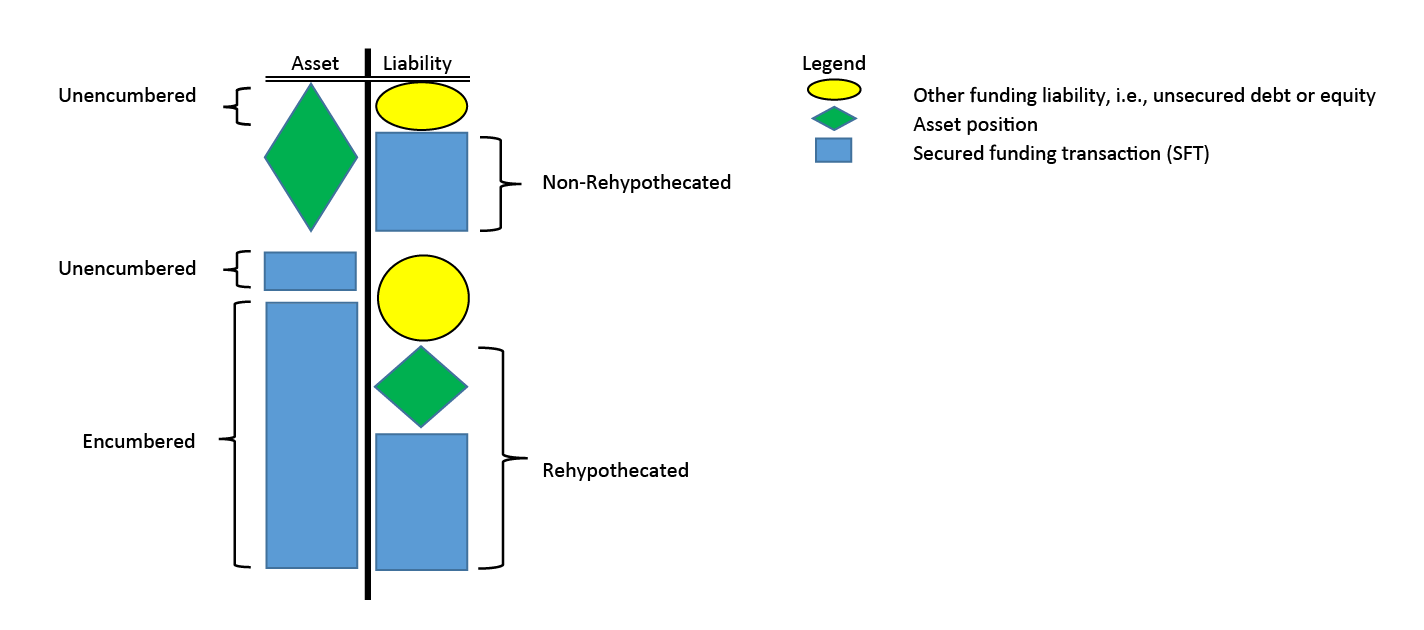
Note: Graphical representation of collateral inflows and outflows on a representative dealer's balance sheet. Asset positions are represented by green diamonds, SFTs are represented by blue rectangles, and unsecured liabilities are yellow ovals. On the asset side, securities flow in through outright purchases and incoming SFTs. On the liability side, securities flow out through sales and outgoing SFTs. The liability side also consists of other types of nonsecured liabilities, such as unsecured debt and equity that finance a fraction of the dealer's position and incoming SFTs. The figure matches assets with liabilities that use the same collateral. A large share of the incoming SFTs are encumbered (i.e., the collateral flows out through a short sale or an SFT). A large share of outgoing collateral is rehypothecated (i.e., the collateral flows in through a short sale or an SFT).
Source: Authors' calculations.
Understanding how each type of transaction fits onto a dealer's balance sheet allows us to interpret dealers' activities that we observe in the FR 2052a. Figure 2a shows the total amount of incoming collateral (consisting of securities both owned and sourced through SFTs--dashed blue line), the total amount of outgoing collateral (consisting of securities both sold short and distributed through SFTs--thin solid blue line), and the total amount of encumbered collateral from SFTs (dashed dotted red line) and rehypothecated collateral (thick solid red line) for the firms in our sample. We observe that the vast majority of collateral that flows in, subsequently flows out--that is, the difference between the dashed blue line and thin solid blue line is small. This result implies that only a small fraction of incoming collateral is financed with nonsecured funding liabilities (that is, securities backed by yellow ovals in figure 1), suggesting a relatively tight box constraint.11 This observation is consistent with the idea that dealers rely heavily on SFTs to distribute securities throughout the financial system. Huh and Infante (2018) characterize how repo allows dealers to make markets by sourcing and delivering securities without altering their risk exposure to the underlying securities they intermediate.
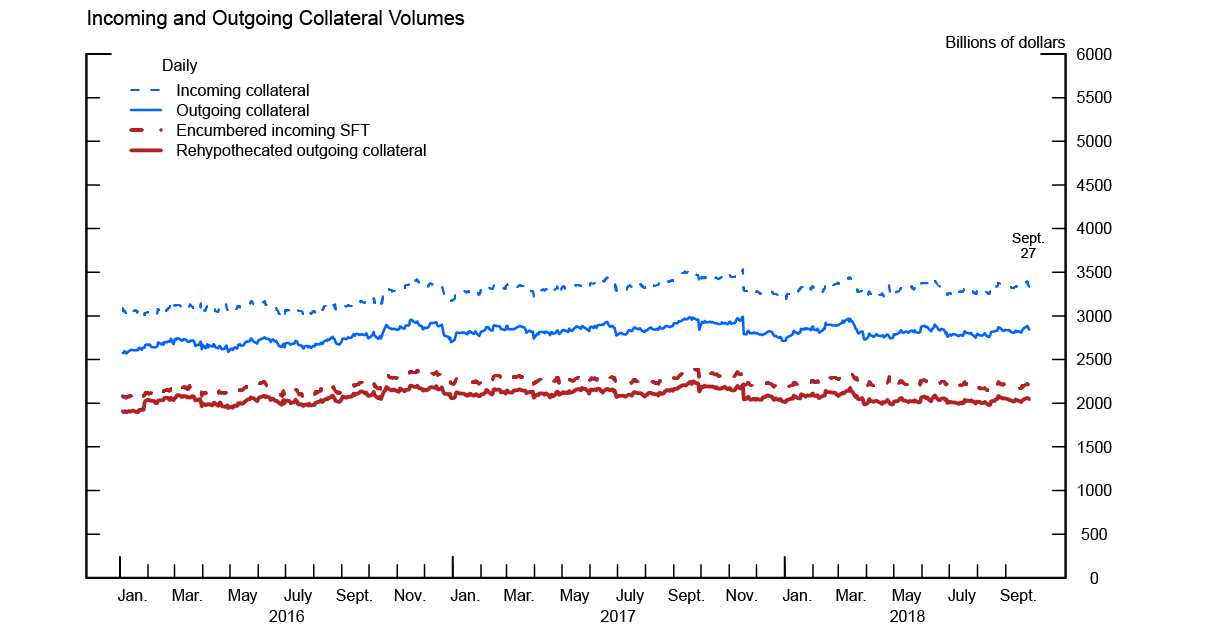
Note: Firms included are a subset of primary dealers. Internal transactions with affiliates and parent are included. Unsettled transactions are excluded. SFT is secured financing transaction.
Source: Federal Reserve Board, Form FR 2052a, Complex Institution Liquidity Monitoring Report.
Note: Firms included are a subset of primary dealers. Internal transactions with affiliates and parent are included. Unsettled transactions are excluded. Repo is repurchase agreement.
Source: Federal Reserve Board, Form FR 2052a, Complex Institution Liquidity Monitoring Report.
Figure 2a also shows that a large fraction of incoming collateral and outgoing collateral is encumbered and rehypothecated, respectively. In theory, if all incoming collateral could be used in another transaction, the total amount of encumbered collateral should equal the total amount of rehypothecated collateral at the firm level. However, we can observe small differences between the dash dotted red line and the thick solid red line, which are driven, in part, by the restrictions some contracts impose on how incoming collateral can be used--that is, contractually encumbered collateral. The data suggests that the amount of contractually encumbered collateral is small relative to the total amount of collateral that is re-used.
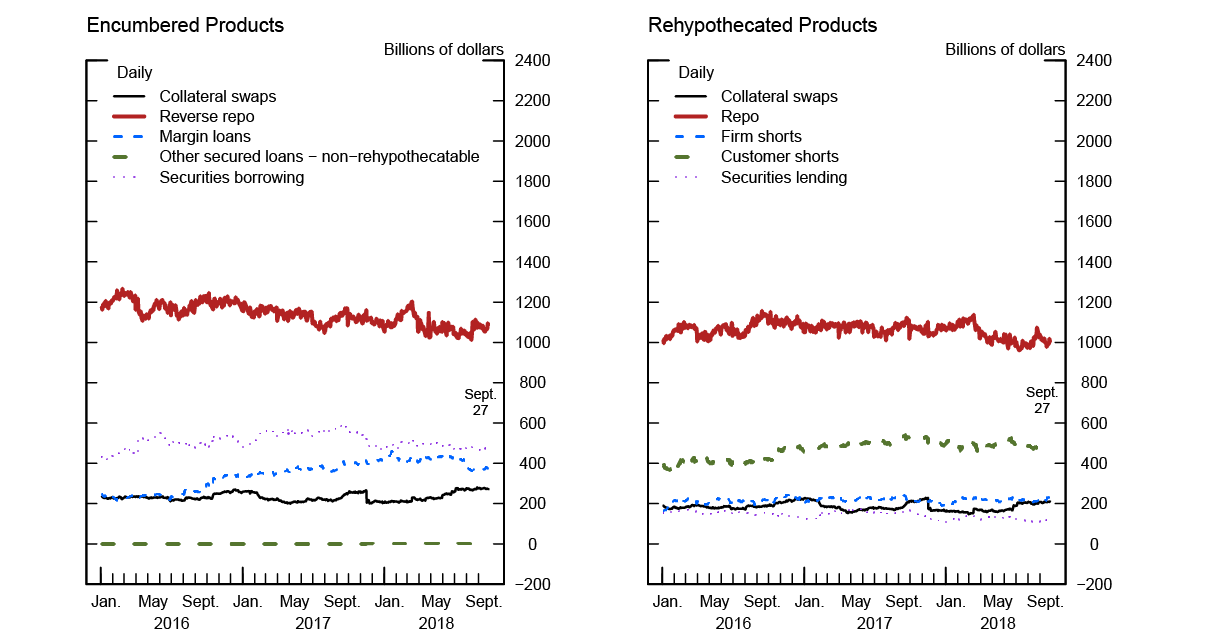
In figures 2b and 2c, we further unpack the main types of contracts used in encumbered and rehypothecated transactions. For all collateral classes, the most significant contracts that encumber collateral are reverse repos, followed by securities borrowing and margin loans (figure 2b). The most significant contracts used to rehypothecate collateral are repos, followed by customer shorts--contracts in which collateral is delivered to customers so customers can take short positions--and firm shorts (figure 2c).
Figure 3 repeats the exercise from figure 2 but focuses solely on U.S. Treasury securities. From figure 3a, we can see that the dealer's box constraint for U.S. Treasury securities is just as tight as for all collateral classes, with about 85 percent of the incoming collateral becoming outgoing collateral. This outcome is particularly interesting because new liquidity regulations encourage BHCs to hold unencumbered high-quality liquid assets (HQLA), which include U.S. Treasury securities. The green line in figure 3a shows the amount of Treasury holdings and incoming SFTs backed by Treasury securities that are unencumbered--that is, the amount of Treasury securities that count as HQLA. The relatively small amount of HQLA Treasury securities held by dealers suggests that the vast majority of U.S. Treasury securities held by BHCs and intermediate holding companies to satisfy their HQLA requirements are in other parts of the consolidated firm. Figures 3b and 3c indicate that most U.S. Treasury circulation is done through repo markets, highlighting the importance that these markets serve for U.S. Treasury intermediation. The relative importance of Treasury repo is likely driven, in part, by the limited restrictions on dealers to re-use repo collateral, the high degree of leverage that can be taken through repos, and the seniority of repos in bankruptcy.12 Interestingly, one can also see that for U.S. Treasury securities, rehypothecated collateral swaps are almost half as large as encumbered collateral swaps. This difference suggests that dealers engage in collateral upgrades when using collateral swaps. That is, through these contracts, dealers receive safe U.S. Treasury securities in exchange for securities with lower credit quality, thereby "upgrading" their collateral.
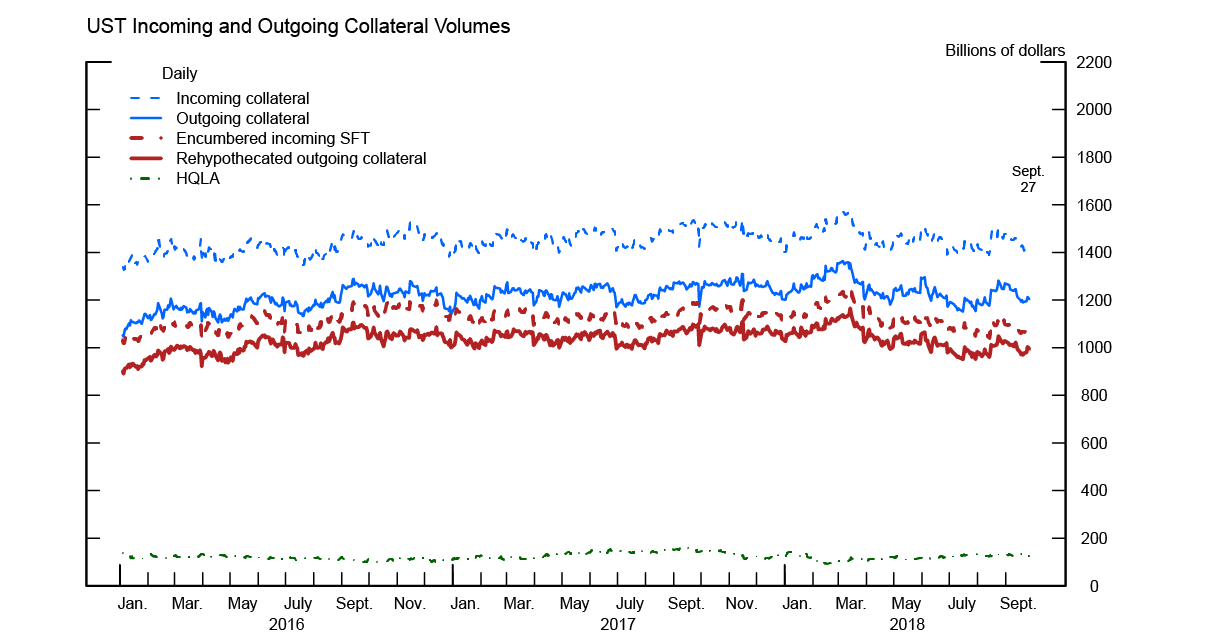
Note: Firms included are a subset of primary dealers. Internal transactions with affiliates and parent are included. Unsettled transactions are excluded. SFT is secured financing transaction. HQLA is high−quality liquid assets.
Source: Federal Reserve Board, Form FR 2052a, Complex Institution Liquidity Monitoring Report.
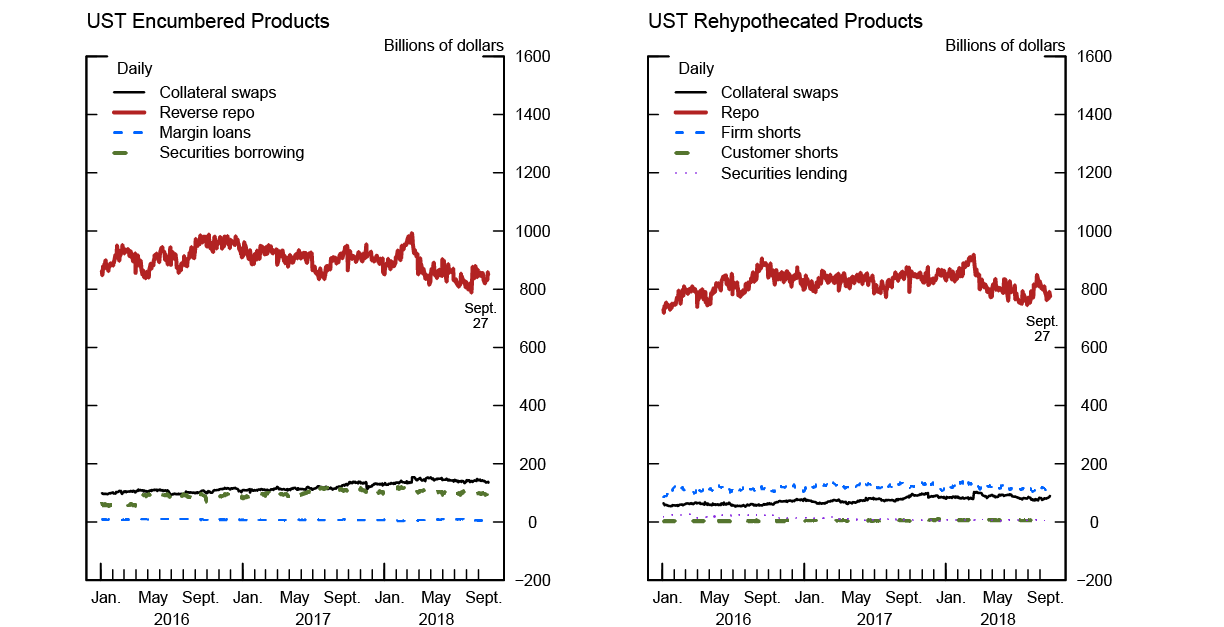
Note: Firms included are a subset of primary dealers. Internal transactions with affiliates and parent are included. Unsettled transactions are excluded. Repo is repurchase agreement.
Source: Federal Reserve Board, Form FR 2052a, Complex Institution Liquidity Monitoring Report.
4. Measuring Collateral Circulation
The ability to measure how much collateral flows in and out of a particular dealer allows us to estimate how much collateral is used and re-used throughout the financial system. Ideally, in order to track how collateral circulates throughout the system, we would like to track how a specific security moves from one firm to the next. Figure 4 provides an illustration of how, at any given moment in time, one specific security can be attributed to multiple financial transactions by being either sold or posted in an SFT. In figure 4, straight arrows represent collateral delivered through cash transactions (buy/sell), and curved arrows represent collateral delivered through SFTs. In this stylized example, regarding dealers' liabilities, the security appears as an outgoing SFT for D1, D2, and D4 and as a short position for D3. With respect to dealers' assets, the security appears as an incoming SFT for D2, D3, and D5 and as a levered long position for D4. Note that for D3 and D4, collateral is being transferred through a cash transaction, implying that both agents are exposed to the collateral's risk, but on opposite sides of the balance sheet (long versus short).
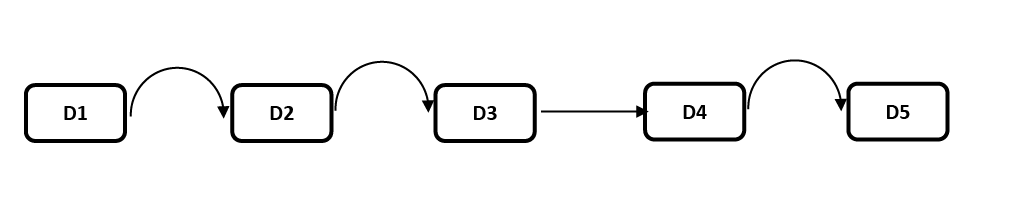
Note: Illustration of how, for any given moment in time, one security can be attributed to multiple financial transactions. The figure illustrates how dealers can sell a security (straight lines) or post a security through SFTs (curved lines). In the figure, D1 posts the security to D2 through an SFT, D2 posts the security to D3 through an SFT, D3 sells short the security to D4, and, finally, D4 posts the security to D5 through an SFT.
Source: Authors' calculations.
To precisely measure the amount of collateral circulation in the entire financial system, we would need detailed data on incoming and outgoing collateral at the CUSIP level--or, at the very least, the collateral class level--for all traders and investors. Currently, this degree of detail is not available for the U.S. financial system and perhaps may not even be feasible to measure. In effect, tracking an individual bond would be similar to tracking banknotes with serial numbers ending in the same digit--an impossible task with little added benefit.13
Use and Re-use Measures: Description
We can, however, measure the amount of use and re-use at the individual firm level for aggregate collateral classes. We define collateral re-use at the firm level as the amount of collateral sourced through an SFT that is simultaneously used in an outgoing collateral transaction--that is, collateral that is marked as rehypothecated. In order to estimate the importance of collateral circulation for a firm, we need to compare the amount of use and re-use relative to the firm's overall activity or position. Inspired by previous studies that have proposed or attempted to measure the total amount of collateral circulation in the financial system, we present three ratios to measure the amount of collateral circulation at the firm level.
- Total Collateral Pass-Through: This measure quantifies the amount of outgoing collateral relative to total incoming collateral that the firm has at its disposal. We define total incoming collateral as collateral sourced either from outright ownership or from SFTs. Total Collateral Pass-Through is imprecise in determining re-use but offers insight into the total outflow of collateral as a fraction of available collateral.
- Rehypothecated Collateral Pass-Through: This measure is the fraction of collateral re-used relative to all incoming collateral that is eligible for re-use. This ratio is a measure of re-use relative to the amount of securities that the firm has at its disposal through incoming SFTs. Rehypothecated Collateral Pass-Through is related to one of the measures proposed by the Financial Stability Board (FSB), which aims to capture the amount of collateral re-use by comparing the dollar amount of collateral the firm can re-use with the total amount of collateral at its disposal. 14 The FSB's proposed measure would only capture the amount of securities that can be re-used, rather than the amount of securities that are re-used. But, using firms' reporting that categorizes what is encumbered and rehypothecated, we can take an important step in identifying what is available for re-use and what is actually re-used. Actual re-use--not potential re-use--offers clear insight and is more representative of how collateral circulates through the financial system.15
- Collateral Multiplier: This measure is the fraction of all outgoing collateral relative to the firm's outright security holdings financed through SFTs. The numerator consists of non-rehypothecated and rehypothecated outgoing collateral transactions, made up of short positions and SFTs. The denominator is composed of non-rehypothecated SFTs which are equal to dealers' levered long positions: Outgoing collateral that is not rehypothecated must be owned. In a sense, our Collateral Multiplier is akin to a "money multiplier," as it compares private liabilities created by a firm with the amount of specific assets held to create those liabilities. In our comparison, outgoing SFTs act like deposits, incoming SFTs act like loans, and asset positions act like reserves. In the money multiplier, a percentage of funds a bank receives through deposits (liabilities) are held as reserves (assets). The remaining funds are lent out in the form of loans (assets), which become new deposits in another bank, which then repeats the process. Thus, the total sum of deposits is a multiple of the total amount of reserves in the system. The multiplier effect of our measure is similar. A percentage of funds a dealer receives through outgoing SFTs (liabilities) are used to purchase securities (assets). The remaining money is lent out in the form of an incoming SFT (assets), which becomes a new outgoing SFT at another dealer, which then repeats the process. Thus, the total amount of repos is a multiple of the total amount of securities in the system. This measure differs from our other two in that it normalizes outgoing collateral with assets owned rather than incoming collateral from SFTs.
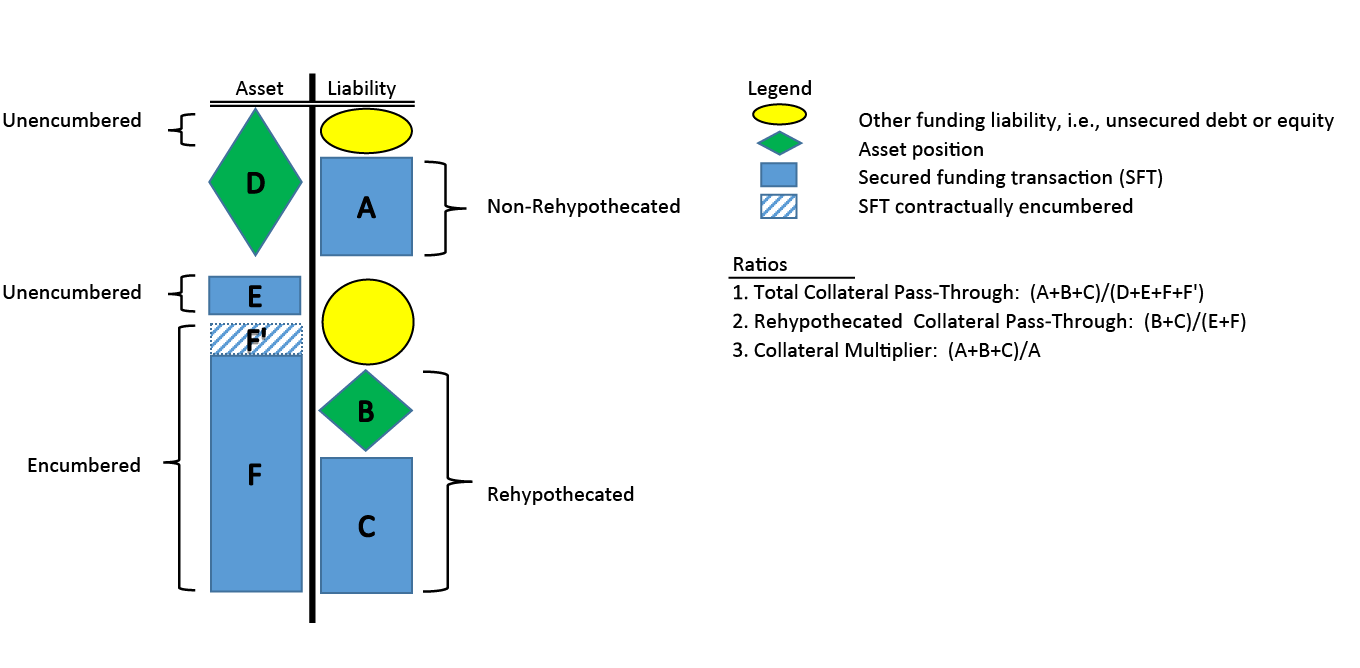
Note: Graphical representation of collateral inflows and outflows on a representative dealer's balance sheet. Asset positions are represented by green diamonds, SFTs are represented by blue rectangles, and unsecured liabilities are yellow ovals. On the asset side, securities flow in through outright purchases and incoming SFTs. On the liability side, securities flow out through sales and outgoing SFTs. The liability side also consists of other types of nonsecured liabilities, such as unsecured debt and equity that finance a fraction of the dealer's position and incoming SFTs. The figure matches assets with liabilities that use the same collateral. A large share of the incoming SFTs are encumbered (i.e., the collateral flows out through a short sale or an SFT). A large share of outgoing collateral is rehypothecated (i.e., the collateral flows in through a short sale or an SFT).
Source: Authors' calculations.
Figure 5 illustrates how each ratio is constructed. The figure is similar to figure 1, except that it highlights the fraction of incoming SFTs that are contractually encumbered (striped blue and white area). The Collateral Multiplier is similar to the measure proposed by Singh (2011), which attempts to capture the amount of collateral re-use in the financial system using filings with the Securities and Exchange Commission and other public data sources. Specifically, Singh measures the dollar amount of collateral received by the largest dealers relative to an estimate of the amount of underlying securities those dealers can access through their nondealer counterparties (for example, hedge funds and securities lenders). The latter part of this estimation is difficult to measure and relies on assumptions regarding the types of counterparties dealers face, the strategies they implement, and the interaction between the two.
Use and Re-use Measures: Observations
In order to capture the amount of collateral circulation in the financial system, we take simple averages of our firm-level measures of collateral use and re-use. To the extent that PDs are the representative agents at the heart of collateral circulation, simple averages of our firm-level ratios should reflect the relevant amount of collateral circulation in the financial system.
Figure 6a shows the average Total Collateral Pass-Through for PDs in our sample for non-Treasury collateral and separately for U.S. Treasury securities.16 We observe that, at present, about 86 percent of non-Treasury collateral and 85 percent of U.S. Treasury securities at PDs' disposal are used in an outflow transaction. Interestingly, this metric shows a decline in the use and re-use of non-Treasury collateral over our sample period, which suggests dealers are using relatively more of their unsecured liabilities to finance their activities.
Figure 6b shows the average Rehypothecated Collateral Pass-Through for non-Treasury collateral and U.S. Treasury securities. For most of our sample period, over 90 percent of U.S. Treasury securities are re-used, while around 90 percent of non-Treasury collateral is re-used. A higher ratio implies there is more re-use relative to incoming collateral from SFTs that are eligible for re-use. Therefore, it follows from this chart that U.S. Treasury securities are re-used somewhat more often than non-Treasury collateral.
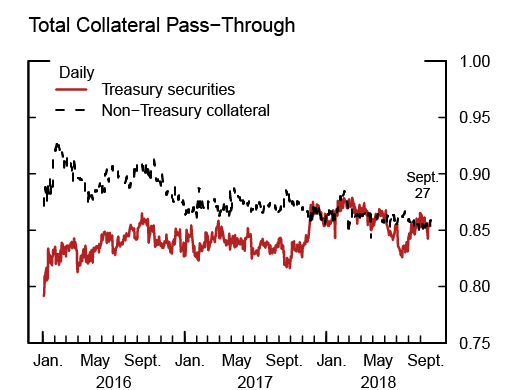
Note: Total Collateral Pass-Through is defined as (all outgoing collateral)/(all incoming collateral). The series above are cross−sectional averages across firms.
Source: Federal Reserve Board, Form FR 2052a, Complex Institution Liquidity Monitoring Report.
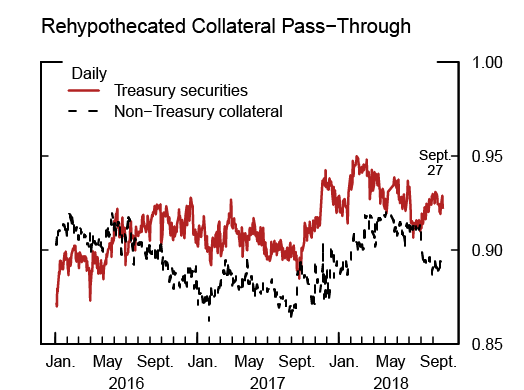
Note: Rehypothecated Collateral Pass-Through is defined as (rehy outgoing collateral)/(incoming SFT − contractually encumbered SFT). The series above are cross−sectional averages across firms.
Source: Federal Reserve Board, Form FR 2052a, Complex Institution Liquidity Monitoring Report.
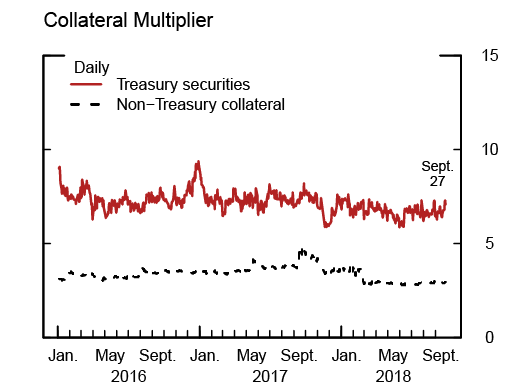
Note: Collateral Multiplier is defined as (all outgoing collateral)/(non−rehy outgoing collateral). The series above are cross−sectional averages across firms.
Source: Federal Reserve Board, Form FR 2052a, Complex Institution Liquidity Monitoring Report.
Note: Collateral Multiplier is defined as (all outgoing collateral)/(non−rehy outgoing collateral).
Source: Federal Reserve Board, Form FR 2052a, Complex Institution Liquidity Monitoring Report.
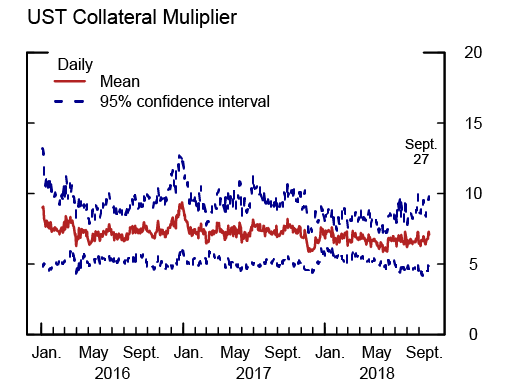
Figure 6c shows the average Collateral Multiplier for PDs in our sample for non-Treasury collateral and for U.S. Treasury securities. Intuitively, we expect the ratio to increase when collateral is scarce and to decrease when collateral is more abundant. From this measure, we observe that PDs currently re-use about three times as many securities as they own for non-Treasury collateral and seven times as many securities as they own for U.S. Treasury securities. From this perspective, there is significantly more re-use for U.S. Treasury securities than for other collateral classes combined. One way to interpret the Collateral Multiplier for U.S. Treasury securities is that PDs "create" seven times as many private safe assets backed by Treasury securities as they own. This observation is consistent with the idea that U.S. Treasury securities are easy to monetize and, hence, post as SFTs, which is driven, in part, by their information insensitivity and their money-like status. Figure 6d gives us a sense of how the Collateral Multiplier behaves across firms in our sample. We can see that there is not much dispersion across dealers, indicating that all dealers are highly active in multiplying U.S. Treasury securities. In addition, the relatively high amount of re-use underscores the importance of SFTs--in particular, repos--to distribute Treasury securities throughout the financial system. From this perspective, in order to gauge PDs' ability to intermediate Treasury securities, their capacity to source and distribute repos is seven times more important than their inventory.
It is interesting to note that, over the past two years, the collateral multiplier for U.S. Treasury securities has exhibited a slightly negative trend--starting around nine and falling to under seven. The eSLR rule came into effect on January 1, 2018, potentially reducing the incentives for individual firms to engage in Treasury-backed repos.17 But it is unclear whether the effective date of the new regulation changed dealers' behavior, given that financial firms typically modify their activities to comply with regulations before their actual implementation. During this time, there has also been a significant increase in U.S. Treasury bond and Treasury bill issuance and a reduction in the reinvestment policy of the Federal Reserve's System Open Market Account portfolio. All else being equal, an increase in the total amount of U.S. Treasury securities available to the market would alleviate collateral scarcity. We speculate that an increase in the total amount U.S. Treasury securities outstanding would reduce the need for PDs to actively engage in collateral circulation. These trends warrant further monitoring.
5. Conclusions and Future Work
In this article, we document the role that PDs play in circulating financial securities. Using confidential supervisory data, we observe the various contracts through which dealers source and distribute collateral while explaining where they belong on a balance sheet. We find that most of the collateral that flows in, simultaneously flows out, and underscores the important role that repos play in the movement of collateral. In addition, we present three measures of collateral use and re-use at the dealer level, which we then use to calculate the average level of collateral circulation across our sample of dealers. We argue that averages of dealer-level activity are representative of the amount of collateral in circulation within the U.S. financial system. Interestingly, one of our measures suggests that the degree of re-use for U.S. Treasury securities is much higher than for all other collateral classes combined and that re-use has been slowly declining over the past two years.
Establishing how securities exposures for various contracts affect dealers offers a richer understanding of how collateral moves through the financial system. These data, and the insights we put forth, form the foundation from which we can begin to address deeper economic questions. For example, what is the effect, if any, of primary Treasury issuance on collateral circulation? Do the Federal Reserve's open market operations have an effect on collateral circulation? How does the flow of collateral differ between PDs and their consolidated parent holding companies? How do internal capital markets operate (that is, how does collateral flow from one subsidiary to another within a large BHC)? How do different regulatory treatments across different jurisdictions affect firms? We hope to shed light on these questions in future work.
References
Aguilar, Andrea, Richard M. Bookstaber, Dror Y. Kenet, and Thomas Wipf (2016). "A Map of Collateral Uses and Flows," OFR Brief Series 16-06. Washington: Office of Financial Research, May.
Baklanova, Viktoria , Cecilia Caglio, Marco Cipriani, and Adam Copeland (2016). "The U.S. Bilateral Repo Market: Lessons from a New Survey," OFR Brief Series 16-01. Washington: Office of Financial Research, January.
Duffie, Darrell. (2017). "Financial Regulatory Reform after the Crisis: An Assessment," forthcoming, Management Science.
Financial Stability Board (2017a). Transforming Shadow Banking into Resilient Market-Based Finance: Re-hypothecation and Collateral Re-use: Potential Financial Stability Issues, Market Evolution and Regulatory Approaches (Basil, Switzerland: FSB, January). http://www.fsb.org/wp-content/uploads/Re-hypothecation-and-collateral-re-use.pdf.
---------- (2017b). Transforming Shadow Banking into Resilient Market-Based Finance: Non-cash Collateral Re-use: Measure and Metrics (Basil, Switzerland: FSB, January), http://www.fsb.org/wp-content/uploads/Non-cash-Collateral-Re-Use-Measures-and-Metrics.pdf.
Fuhrer, Lucas Marc, Basil Guggenheim, and Silvio Schumacher (2016). "Re‐Use of Collateral in the Repo Market," Journal of Money, Credit and Banking, vol. 48(6), pp. 1169–93.
Huh, Yesol and Sebastian Infante (2018). "Bond Market Intermediation and the Role of Repo," Finance and Economics Discussion Series 2017-003. Washington: Board of Governors of the Federal Reserve System, January,
Infante, Sebastian (2018). "Liquidity Windfalls: The Consequences of Repo Rehypothecation," forthcoming, Journal of Financial Economics.
Kirk, Adam, James McAndrews, Parinitha Sastry, and Phillip Weed (2014). "Matching Collateral Supply and Financing Demands in Dealer Banks", Economic Policy Review, vol. 20 (December), pp. 127–51.
Singh, Manmohan (2011). "Velocity of Pledged Collateral: Analysis and Implications," IMF Working Papers 11/256. Washington: International Monetary Fund, November,
Box A: Specific Securities Transactions and How They Are Recorded on Balance Sheets
Our data are complex and include a wide range of transaction types, which can be broadly separated into cash trades (outright buying and selling) and SFTs. For that reason, in the following text, we describe each transaction, whether collateral is incoming or outgoing, and where they would be recorded on a balance sheet. The values shown throughout this work represent the incoming or outgoing collateral in SFTs or cash trades rather than outstanding loan amounts, although for most transactions, the collateral value would be roughly equivalent to the amount of cash exchanged. All of the transactions below are described from the perspective of a dealer.
The data are not reported as a net number, and FIN 41 does not apply.18 All values described in this exercise are gross.
Assets: Long Positions and Incoming SFTs
Firms have immediate access to collateral through outright ownership or incoming SFTs. Furthermore, incoming collateral in each SFT is either encumbered or unencumbered. An unencumbered security is free from legal, contractual, or operational restrictions.
Assets that are outright owned can be unencumbered (that is, financed by nonsecured funding liabilities--unsecured debt or equity) or can be encumbered (that is, financed by SFTs). The former is reported directly as part of firms' calculation of HQLA (see the text that follows immediately). The latter equals the total amount of non-rehypothecated outgoing collateral from SFTs (See the Liabilities section).
Unencumbered assets are positions that are purchased outright that are (i) free of legal, regulatory, contractual, or other restrictions on the ability of the reporting entity to monetize the assets; and (ii) not pledged, explicitly or implicitly, to secure or to provide credit enhancement to any transaction.
Reverse repo agreements are SFTs that represent the majority of incoming collateral for dealers in our sample. A reverse repurchase transactions has two legs. In the first, collateral comes in, and cash is transferred to a counterparty. The second leg unwinds the first leg with adjustments for transaction fees.
Similar to reverse repos, a securities borrowing transaction is a two-leg SFT where securities are traded for cash--that is, collateral comes in, and cash goes out. The second leg unwinds the first. In this trade, the dealer acts as a cash lender.
In the most basic terms, a margin loan is a form of securitized lending extended by dealers to their customers. The dealer provides credit to clients to finance their positions, who post said positions as collateral for the loan. We consider margin loans to be an SFT.
Collateral swaps refer to SFTs where noncash assets--that is, various types of securities--are exchanged and later returned. These swaps often take the form of collateral upgrades. As an inflow, we record the value of incoming collateral.
There are small amounts of other secured loans that do not fit the definitions of the aforementioned products. The collateral received by dealers in these SFTs is not able to be rehypothecated. That is, the collateral received cannot be re-used by the dealer. As seen in figure 2, these other secured loans account for an insignificant amount of incoming collateral.
Dollar rolls are transitions using "To Be Announced" (TBA) contracts with the intent of providing financing for a specific security or pool of collateral. These SFTs are typically used to sell exposure to TBA agency mortgage-backed securities. Toward the end of 2016, dealers ceased to use the product, and volumes dropped to zero. Since dollar rolls are equal in size when comparing inflows (asset) and outflows (liability), we have excluded them from this analysis.
Liabilities: Short Positions and Outgoing SFTs
SFTs recorded as liabilities are similar to those found in the Assets section. Some of the transactions listed below would not traditionally be considered SFTs (customer shorts, for instance); however, based on the reporting in the FR 2052a and the mechanics of the trades, we consider them tantamount to SFTs in this exercise. Outgoing collateral can be rehypothecated or non-rehypothecated--that is, the collateral used in the SFT or to secure the short position is re-used.
Most outgoing collateral on dealers' balance sheets takes the form of repurchase agreements (repos). In the first leg, cash is received against outgoing collateral. The flows in the second leg are the opposite of the flows in the first. A repo is an SFT that can use rehypothecated or non-rehypothecated collateral. From non-rehypothecated repo collateral, we can infer a set of outright assets owned (referred to in the Assets section).
Dealers frequently use securities lending transactions (which are SFTs) to lend securities or to borrow cash. Similar to repos, securities lending involves two legs. In the first, outgoing collateral is transferred to a counterparty in exchange for cash. The second leg reverses the first. We show the outgoing collateral in our figures discussed earlier.
Collateral swaps refer to SFTs where noncash assets--that is, various types of securities--are exchanged and later returned. These swaps often take the form of collateral upgrades. As an outflow, we show the value of outgoing collateral.
A customer short is a transaction where a dealer's customer sells a security it does not own and the dealer obtains that security for its client to make delivery into the sale. Outgoing collateral transferred from a dealer to a counterparty is the SFT we observe from the 2052a data. Therefore, in terms of the movement of collateral, a customer short is akin to any other SFT in that collateral goes out of a dealer and into a counterparty or client. Since we track collateral in this exercise, tracking collateral from client shorts is necessary. As seen in figure 2, behind repo, customer shorts account for the second-highest level of outgoing collateral.
A firm short (position) is a transaction where a dealer sells a security it does not own and that dealer obtains the same security to make the delivery into a sale. Collateral flows out of the dealer and into a counterparty. The outward flow of collateral is tracked in our exercise. The dealer uses an accompanying trade to source the collateral used in the short, but that is not represented in the firm short category. Rather, just the short position is represented. Firm shorts are characterized as positions and denoted by green diamonds in figure 1.
Dollar rolls are SFTs using TBA contracts with the intent of providing financing for a specific security or pool of collateral. These contracts are typically used to sell exposure to TBA agency mortgage-backed securities. Toward the end of 2016, dealers ceased to use the product, and volumes dropped to zero. Since dollar rolls are equal in size when comparing inflows (asset) and outflows (liability), we have excluded them from this analysis.
1. We are very grateful to Roop Ambardekar for his assistance in sourcing and managing the data and to Thomas Doherty, Adam Kirk, and Phillip Weed for helping us interpret the data. We would also like to thank Zack Saravay for his exceptional research assistance. Return to text
2. Throughout this article, we use the term "collateral" to reference financial securities that are outright owned or sourced through a secured financing transaction. Return to text
3. We are interested only in firms' exposure to the securities themselves, leaving aside the issue of how counterparty risk can affect the riskiness of SFTs. Of note, firms' outright holdings of securities do not capture their total risk exposure because we do not include derivative and all off-balance-sheet exposures. Return to text
nbsp; Kirk and others (2014) also study how dealers raise and distribute financing and provide additional details on how dealers' cash and collateral demands affect their balance sheets.
4. In this article, "re-use" and "rehypothecation" are used interchangeably. Strictly speaking, the difference between the two is whether the counterparty posting the collateral is a client or just a counterparty. For the purpose of this article (and the data), we do not make this distinction. Return to text
5. Aguilar et. al. (2016) give a descriptive map of how collateral flows through the financial system and the important role banks/dealers play in circulating collateral. Return to text
6. Several major regulatory changes for large banks went into effect during and just before our sample period, but financial firms typically adjust their operations before new regulations are enforced. Return to text
7. Firms in the LISCC portfolio are financial institutions that may pose elevated risks to U.S. financial stability and are supervised by the Federal Reserve. The LISCC designation is not itself a sufficient requirement to compel U.S. BHCs to report, but it is for FBOs. Currently, all LISCC-designated U.S. BHCs file FR 2052a. Return to text
8. Of note, we do not include collateral sourced or distributed for initial or variation margin. We leave this analysis for future work. Return to text
9. Although some SFTs explicitly transfer ownership of the collateral (for example, repo), economically, absent default, the collateral provider is still exposed to its underlying risk, while the collateral receiver merely has a receivable from the collateral provider. In this sense, we say that the collateral receiver is not exposed to the collateral but has access to it. Return to text
10. As noted in the box, FR 2052a does not report levered longs, but these volumes are equal to securities out that are not rehypothecated. Return to text
11. The box constraint forces dealers to have access to securities, either by owning or borrowing them, to deliver to counterparties. Intuitively, the box constraint acts like a budget constraint for securities. Return to text
12. See Infante (2018) for details on the legal treatment of repos in the United States. Return to text
13. This tracking could be possible if we observed all of the agents trading in collateral markets. For example, Fuhrer, Guggenheim, and Schumacher (2016) can measure collateral re-use in the Swiss repo market because it is an interbank market. Return to text
14. The FSB's proposal is intended to prompt a globally coordinated data collection effort to measure collateral re-use in different jurisdictions. Institutions will be asked to report the necessary data elements by January 2020. See FSB (2017a) and (2017b) for more details on the FSB's proposal to measure collateral re-use. Return to text
15. In addition, the FSB's proposal intends to measure the dollar amount of re-use, which may be difficult for comparing re-use across jurisdictions. This observation suggests that it may be more informative to compare percentages of re-use as a measure of firms' activities rather than the dollar amount of re-use. Return to text
16. Non-Treasury collateral classes can be broken down into the following categories: GSE (government-sponsored enterprises) securities, investment grade, high yield, foreign debt, equity, structured products, and whole loans. Return to text
17. Duffie (2017) details why leverage ratio rules are particularly onerous for repo intermediation of government securities. Return to text
18. Refers to FASB Interpretation No. 41. Return to text
Infante, Sebastian, Charles Press, and Jacob Strauss (2018). "The Ins and Outs of Collateral Re-use," FEDS Notes. Washington: Board of Governors of the Federal Reserve System, December 21, 2018, https://doi.org/10.17016/2380-7172.2298.
Disclaimer: FEDS Notes are articles in which Board staff offer their own views and present analysis on a range of topics in economics and finance. These articles are shorter and less technically oriented than FEDS Working Papers and IFDP papers.