FEDS Notes
August 14, 2019
International Trade in Services: Stylized Facts about Exporters in the Service Sector
Service trade accounts for about 30 percent of U.S. exports and has grown about 5 percent per year over the past decade. However, despite the growing importance of the service sector in foreign markets, empirical work has mostly focused on manufacturing because of service-sector data limitations.2
This note contributes to expand the knowledge on foreign trade in services by presenting a series of stylized facts about exporters of services.3 We rely on a unique dataset, the Compustat customer segment, which records transactions between U.S. firms and their major customers. Exploiting the customer name and the market segment of the buyer, we construct a foreign indicator that differentiates between domestic and foreign transactions.4 We focus on two main segments of the broadly defined service sector, business (NAICS 51-56) and personal (NAICS 61-81) services, jointly accounting for more than 50 percent of the U.S. economy and over 70 percent of services exports.
Table 1 highlights that firm exporting remains a relatively rare activity in services industries, consistent with the prediction in the trade literature on heterogeneous firms following Melitz (2003). Replicating the analysis in Bernard et al. (2007) and (2018a), column (2) reports the average share of firms in a given industry that export. On average, 29 percent of firms in the business services sectors were exporters between 2003 and 2007; in the personal services industries, the share of exporters is lower, 26 percent, likely reflecting higher trade costs for personal services.5 Overall, the shares of services exporters constructed from our data is somewhat greater than the share of Belgian exporters in services--on average, 7 percent, between 1995 and 2005--documented in Ariu (2016), with most of the difference likely explained by the fact that the Compustat customer segment database is skewed toward larger firms and bigger transactions. For a more direct comparison, the participation of services firms in foreign markets is about half that of manufacturing firms within Compustat; a similar discrepancy also applies to Belgian exporters, as shown in Ariu (2016).6 Despite the meaningful difference in participation relative to the manufacturing sector, thinking of services exclusively as nontradable activities contrasts with the empirical evidence. In addition to a positive participation margin, column (3) emphasizes that the average share of exports in firm shipments averages 30 percent in business services and 17 percent in personal services, a little below with the value export share (35 percent) for the manufacturing sector in our data.
Table 1: Firm Exporting: Business and Personal Services
| NAICS | Sector | Percent of Firms | Fraction of Exporters | Avg Share of Exports in Total Shipments |
|---|---|---|---|---|
| (1) | (2) | (3) | ||
| 51-56 | Business Services | 100.0 | 0.29 | 0.30 |
| 511 | Publishing Industries | 9.7 | 0.40 | 0.34 |
| 512 | Motion Picture | 1.0 | 0.33 | 0.32 |
| 515 | Broadcasting | 1.9 | 0.39 | 0.31 |
| 517 | Telecommunications | 5.9 | 0.31 | 0.40 |
| 518 | Data Processing | 1.9 | 0.32 | 0.26 |
| 519 | Other Information Svcs | 3.7 | 0.31 | 0.38 |
| 522 | Credit Intermediation | 21.3 | 0.18 | 0.22 |
| 523 | Securities & Other Investments | 5.5 | 0.33 | 0.30 |
| 524 | Insurance Carriers | 5.6 | 0.37 | 0.27 |
| 525 | Funds & Trusts | 21.3 | 0.17 | 0.15 |
| 531 | Real Estate | 6.1 | 0.25 | 0.24 |
| 532 | Rental and Leasing | 1.1 | 0.38 | 0.43 |
| 533 | Lessors of Nonfinancial Intangible Assets | 1.5 | 0.40 | 0.43 |
| 541 | Professional Services | 9.1 | 0.29 | 0.28 |
| 561 | Administrative and Support Services | 3.1 | 0.16 | 0.26 |
| 562 | Waste Management and Remediation | 1.0 | 0.17 | 0.19 |
| 61-81 | Personal Services | 100.0 | 0.26 | 0.17 |
| 611 | Educational Services | 7.6 | 0.19 | 0.20 |
| 621 | Ambulatory Health Care | 24.4 | 0.10 | 0.22 |
| 622 | Hospitals | 4.8 | 0.02 | 0.30 |
| 623 | Nursing and Residential Care | 4.6 | 0.07 | 0.14 |
| 624 | Social Assistance | 0.9 | 0.00 | 0.00 |
| 711 | Performing Arts | 3.0 | 0.30 | 0.31 |
| 713 | Amusement, Gambling | 12.3 | 0.32 | 0.14 |
| 721 | Accommodation | 11.2 | 0.50 | 0.21 |
| 722 | Food Services | 23.7 | 0.36 | 0.26 |
| 811 | Repair and Maintenance | 2.1 | 0.70 | 0.04 |
| 812 | Personal and Laundry | 5.2 | 0.26 | 0.04 |
Note: Column 1 summarizes the average distribution of firms across business and personal services industries. Column 2 reports the average share of firms in each industry that export. Column 3 reports the average share of exports in total shipments across all exporters. Percentages in the third column do not sum exactly to 100 due to omitted sectors and rounding.
Source: S&P Global Market Intelligence, Compustat North America, 2003-2007.
The literature on heterogeneous firms in trade has also documented that exporters in manufacturing are different from non-exporters. Table 2 explores the margins of systematic differences between exporters and non-exporters in services industries, in the spirit of Bernard et al. (2007) and (2018a). Each row of the table shows the implied average percent difference between exporters and non-exporters, estimated in a regression of firm characteristics against a dummy variable capturing the firm export status. We confirm that exporters tend to be larger--69 percent larger in terms of employment, 93 percent in terms of shipments, and 126 percent in terms of market capitalization--more productive, and more capital-intensive than non-exporters (column (1) estimates). The exporter premia remain positive and significant even after controlling for industry-specific characteristics (industry fixed effects) and firm size--proxied by employment--but they appear somewhat smaller in column (3), ranging between 19 and 46 percent.
Table 2: Export Premia in Business and Personal Services
| Exporter Premia | |||
|---|---|---|---|
| (1) | (2) | (3) | |
| log L | 0.69*** | 0.93*** | - |
| log R | 0.93*** | 1.11*** | 0.22*** |
| log Mkt Val | 1.26*** | 1.25*** | 0.46*** |
| log Y/L | 0.20*** | 0.15** | 0.19** |
| log CapEx | 1.07*** | 1.22*** | 0.29** |
| log K/L | 0.31* | 0.20** | 0.29** |
| Additional Vars | None | Industry FE | log L, Industry FE |
log L: Employment (in log-s).
log R: Revenues (in log-s).
log Y/L: Real output per worker (in log-s).
log CapEx: Real capital expenditure (in log-s).
log K/L: Capital per worker (in log-s).
log Mkt Val: Market Valuation (in log-s).
Legend: *** significant at 1 %, ** at 5%, * at 10 %.
Note: Average percent differences between exporters and non-exporters in a regression of firm characteristics on an export dummy.
Source: S&P Global Market Intelligence, Compustat North America, 2003-2007.
The rare nature of the exporting activity extends to other margins of participation in international trade. Figure 1 explores the distribution of services exporters across customers. While the majority of firms exports to a single customer, those firms account for about 5 percent of export value and 3 percent of employment. Firms that export to at least 11 customers, instead, represent nearly 50 percent of the total export value and more than 65 percent of employment.7
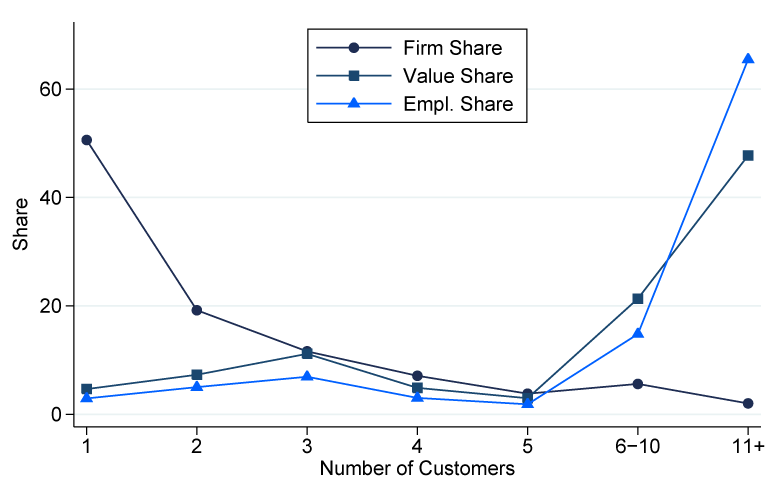
Note: Distribution of customers across exporters, the value of exports, and employment.
Source: Compustat, 2003-2007.
Table 3 provides further details on the customer dimension. We classify the relationship between an exporting firm and its customer into four categories: one-to-one, including exporters and customers that have a single connections; many-to-one, referring to the group of exporters that has multiple connections and the set of customers with a single connection; one-to-many, denoting exporters with a unique connection and customers with multiple connections; and many-to-many, capturing exporters and customers with multiple connections.
Table 3: Type of Matches, Business and Personal Services
| Foreign Markets | ||||
|---|---|---|---|---|
| One-to-one | Many-to-one | One-to-many | Many-to-many | |
| Share of Matches | 11.8 | 8.8 | 54.9 | 24.5 |
| Share of Value | 2.8 | 4.3 | 56.5 | 36.4 |
Note: Distributions of firm-customer matches by type.
Source: S&P Global Market Intelligence, Compustat North America, 2003-2007.
One-to-many matches account for more than 50 percent of aggregate services trade in our data, confirming the dominant role of a small group of exporters in shaping trade patterns through their extensive connections. While larger exporters tend to be well connected and sell to a variety of customers, figure 2 implies that smaller firms tend to be less connected are able to reach only the most important customers. After classifying each firm by the number of foreign market connections, we find that a 1 percent increase in the number of customers per exporter is associated with a 0.30 percent decline in the average number of connections among the customers--the slope of the fitted regression line in figure 2. The degree of negative assortativity in services trade is a little above an analogous estimate for the manufacturing sector, suggesting that the exchange of services, where nonstandard attributes contribute to quality, is associated with larger relationship-specific fixed costs.8
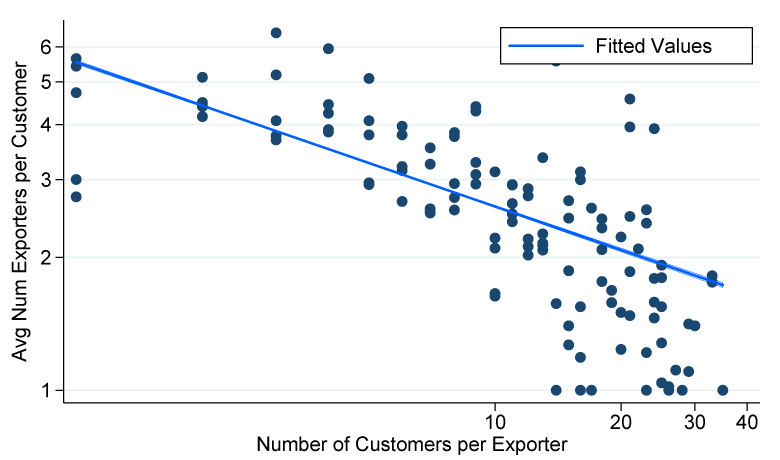
Note: Relation between the number of customers per exporter and the average number of connections among these customers. Axes are in log-s.
Source: Compustat, 2003-2007.
In sum, our analysis shows that most of the basic facts on exporters in manufacturing extend to the business and personal services sectors, with an important difference: The participation rate of services firms in foreign market is much lower than that of manufacturing firms, suggesting that firms in the service sector face larger trade costs. While our results partly hinge upon the composition of the Compustat sample, which includes only major transactions of larger firms, the characteristics of U.S. services exporters we document are precise metrics to evaluate the tradability of services.
References
Anderson, James E., Catherine Milot, and Yoto Yotov (2014). "How Much Does Geography Deflect Services Trade?" International Economic Review, vol. 55(3), pp. 791–818.
Ariu, Andrea (2016). "Services Versus Goods Trade: A Firm-level Comparison," Review of World Economics, vol. 152(1), pp. 19–41.
Bernard, Andrew B., Bradford J. Jensen, Stephen J. Redding, and Peter K. Schott (2007). "Firms in International Trade," Journal of Economic Perspectives, vol. 21(3), pp. 105–130.
Bernard, Andrew B., Bradford J. Jensen, Stephen J. Redding, and Peter K. Schott (2018a). "Global Firms," Journal of Economic Literature, vol. 56(2), 565–619.
Bernard, Andrew B., Andreas A. Moxnes, and Karen H. Ulltveit-Moe (2018b). "Two-sided Heterogeneity and Trade," Review of Economics and Statistics, vol. 100(3), 424–439.
Egger, P., M. Larch, and K. E. Staub (2012). "Trade Preferences and Bilateral Trade in Goods and Services: A Structural Approach." CEPR Discussion Paper No. DP9051. London: Centre for Economic Policy Research, July, available at https://papers.ssrn.com/sol3/papers.cfm?abstract_id=2153502
Feenstra, Robert C., Robert E. Lipsey, Lee G. Branstetter, C. F. Foley, James J. Harrigan, J. B. Jensen, Lori Kletzer, Catherine Mann, Peter K. Schott, and Greg C. Wright (2010). "Report on the State of Available Data for the Study of International Trade and Foreign Direct Investment," NBER Working Paper No. 16254. Cambridge, Mass.: National Bureau of Economic Research, August, https://www.nber.org/papers/w16254.
Francois, Joseph, and Bernard Hoekman (2010). "Services Trade and Policy," Journal of Economic Literature, vol. 48(3), pp. 642–692.
Jensen, J. (2011). Global Trade in Services: Fear, Facts, and Offshoring. Washington: Peterson Institute for International Economics.
Melitz, Marc J. (2003). "The Impact of Trade on Intra‐industry Reallocations and Aggregate Industry Productivity," Econometrica, vol. 71(6), pp. 1695–1725.
S&P Global. Compustat North America, Wharton Research Data Services (WRDS), https://wrds-www.wharton.upenn.edu/pages/support/data-overview/
Tito, Maria (2019). "Trade in Goods and Services: Measuring Domestic and Export Flows in Buyer-Supplier Data," FEDS Notes. Washington: Board of Governors of the Federal Reserve System, June 26, 2019, https://doi.org/10.17016/2380-7172.2400.
1. The views expressed in the article are those of the author and do not necessarily reflect those of the Federal Reserve System. Return to text
2. Bureau of Economic Analysis data on international trade in services are available for about 30 categories, whereas the U.S. Census Bureau publishes information on U.S. imports and exports of goods for more than 10,000 product categories. For more details, see Feenstra et al. (2010). Return to text
3. Some notable exceptions include Anderson et al. (2014); Ariu (2016); Egger et al. (2012); Francois and Hoekman (2010); Gervais and Jensen (2019); and Jensen (2011). Return to text
4. For more details on the methodology, see Tito (2019). Return to text
5. While the OECD Services Trade Restrictiveness Index captures trade costs for business services, no direct measure, to the best of our knowledge, on trade costs in personal services is available. Exploiting the distribution of producers and consumers across regions of the United States, Gervais and Jensen (2019) estimate, instead, that firms in business services face larger trade costs than firms in personal services. The difference with our findings could partly reflect the composition of the Compustat data, in addition to differences between the U.S. and foreign markets. Return to text
6. Ariu (2016) reports that more than 20 percent of Belgian manufacturing firms exports versus about 7 percent in the services sector. Return to text
7. Looking at the distribution of exporters across countries and products, Bernard et al. (2007) and (2018a) report a similar concentration of export activity in U.S. manufacturing. Return to text
8. Our estimate is about three times larger than what is reported by Bernard et al. (2018b) for Norwegian manufacturing exporters. However, the difference with Bernard et al. (2018) partly reflects differences in sample coverage. Return to text
Tito, Maria D. (2019). "International Trade in Services: Stylized Facts about Exporters in the Service Sector," FEDS Notes. Washington: Board of Governors of the Federal Reserve System, August 14, 2019, https://doi.org/10.17016/2380-7172.2411.
Disclaimer: FEDS Notes are articles in which Board staff offer their own views and present analysis on a range of topics in economics and finance. These articles are shorter and less technically oriented than FEDS Working Papers and IFDP papers.