FEDS Notes
September 20, 2019
A New Way to Visualize the Evolution of Monetary Policy Expectations1
Introduction
At the conclusion of its July 2019 meeting, the Federal Open Market Committee (FOMC) announced its decision to lower the target range for the federal funds rate by 25 basis points to 2.00 to 2.25 percent.2 This was the first change in the target range since December 2018, when it had been raised by 25 basis points. In his prepared press conference remarks, Chair Powell recounted that the Committee had moved, in the wake of the December 2018 meeting and over the course of 2019, from expecting further rate increases to adopting a patient stance and, finally, to deciding on the July rate cut.3
Using information from financial market quotes and surveys, this article analyzes the evolution from January to July 2019 of probabilities attached to different policy rate outcomes using "probability simplex" diagrams. Qualitatively, these market- and survey-implied expectations largely mirrored the progression of the FOMC's assessment of appropriate policy as described by Chair Powell. As regards timing, financial markets, in particular, appear to have anticipated the FOMC's eventual "loss of 'patience.'"
The Probability Simplex
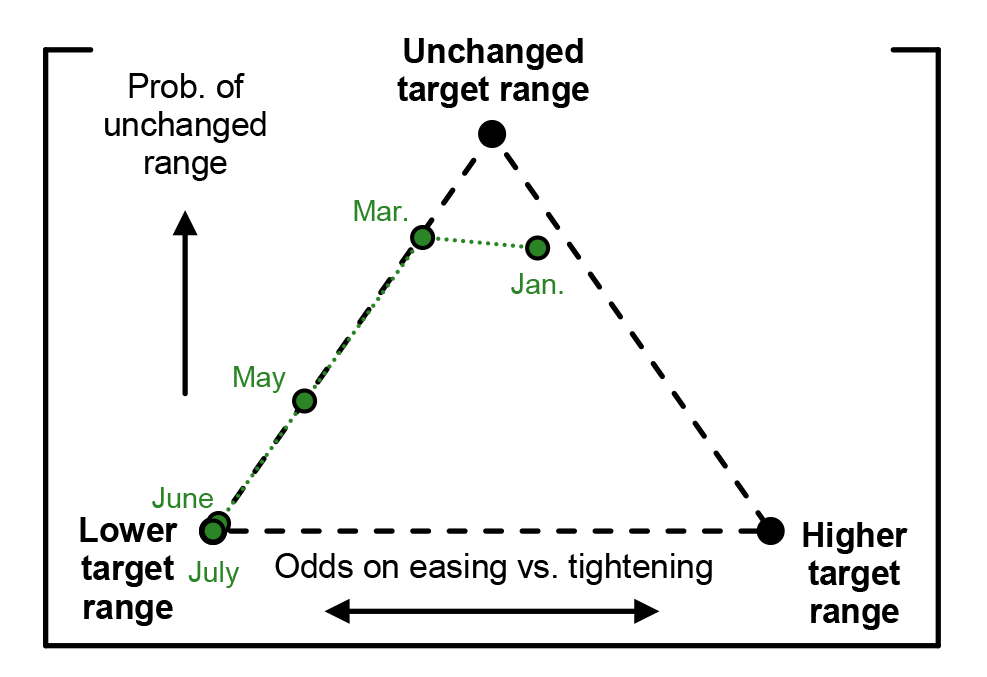
When the set of outcomes can be partitioned into three events of interest, the distributional information about these events can be represented by the probability triple $$p=(p_1,p_2,p_3)$$, which occupies a subset of $$\mathbb{R}^3$$ given by $$\mathcal{P}=\left\{p \in \mathbb{R}^3:p \ge 0,p_1+p_2+p_3=1\right\}$$. The set $$\mathcal{P}$$ is known as the 2-probability simplex. In particular, since probabilities sum to 1, the vector $$p$$ contains only two independent pieces of information. The simplex, whose graph corresponds to an upward-leaning equilateral triangle within three-dimensional Euclidean space (in its usual Cartesian representation), can thus be projected down to two dimensions without loss of information. Figure 1 shows the resulting simplex diagram--also known as a "ternary plot"--for the case where the three outcomes are a lower, unchanged, or higher future target range for the federal funds rate. Each corner of the dashed triangle corresponds to a 100 percent probability of the indicated outcome. Points halfway along the edges of the triangle represent 50-50 odds on the two corresponding corner outcomes, with no probability on the third outcome; the center of the triangle represents equal probabilities of all three outcomes. Figure 1 also shows four iso-probability sets for the "unchanged target range" outcome--points or lines of equal probability of that outcome--and three iso-odds sets, along which the odds (that is, the ratio of probabilities) on lower relative to higher rates are constant. Note that the assignment of outcomes to specific corners is arbitrary and purely for interpretational convenience, as is the choice to focus on the absolute probability of the top outcome and the odds on the bottom-left versus bottom-right outcomes. One way to think of the dotted blue lines and the dotted orange lines is as representing "constant patience" and "constant directional bias," respectively.
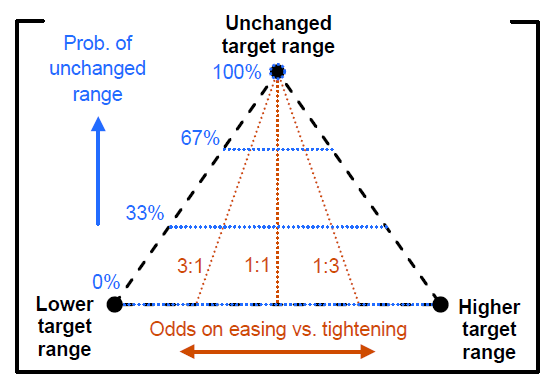
Note: The top corner of the triangle corresponds to a 100 percent probability of an unchanged target range. Along the dotted blue iso-probability lines, the probability of an unchanged range is equal to the indicated percentage. Along the dotted orange iso-odds lines, the odds on a lower vs. higher range are equal to the indicated ratio.
Source: Federal Reserve Board staff.
Monetary Policy Expectations for the End of 2019
Figure 2 plots, within the simplex diagram introduced in figure 1, the time-series trace of market-implied probabilities of lower, unchanged, or higher rates at the end of 2019, from the day before the January 2019 FOMC meeting to the day before the July 2019 meeting. These risk-neutral probabilities were extracted from quotes on federal funds futures options using the methodology discussed in Priebsch (forthcoming). The circle representing January is close to the center of the diagram (indicating a near-equal division of probabilities among the three outcomes), with easing versus tightening odds slightly in favor of higher rates. Between the January and March meetings, these latter odds reversed, and the probability of unchanged rates rose notably, in line with the FOMC's explicit affirmation of its patient stance in the January FOMC statement.4 By the time of the May meeting, the probability of unchanged rates had returned to roughly its January level, and the directional odds had shifted firmly toward lower rates. Just before the June meeting, virtually all probability was on lower rates by the end of the year. At that meeting, the FOMC dropped the "patient" language from its statement, a move that was widely interpreted in the financial press as clearing the way for rate cuts.5 By the eve of the July meeting, the market-implied probability of lower rates had nudged even closer toward 100 percent.
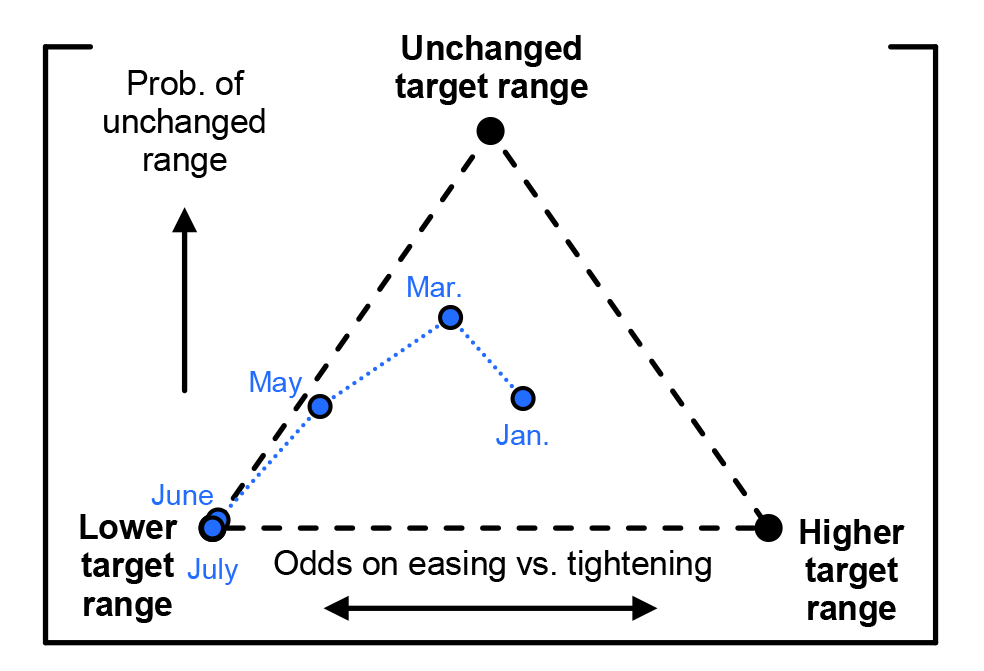
Note: Points within the dashed triangle represent probabilities that the federal funds rate at the end of 2019 will be below, within, or above the range of 2.25 to 2.50 percent. Each blue circle depicts the probabilities as implied by federal futures options on the eve of the indicated FOMC meeting.
Source: CME Group Inc.; Federal Reserve Board staff computations.
The probabilities shown in figure 2 are risk neutral, and federal funds futures markets have been shown to be subject to risk premiums (as in Piazzesi and Swanson, 2008). Physical counterparts to the market-implied probabilities might be gleaned from survey forecasts. Most surveys--including those in the Blue Chip family--ask for point forecasts rather than distributional forecasts. Notable exceptions are the Federal Reserve Bank of New York's surveys of primary dealers and market participants, which have asked respondents to assign probabilities to the FOMC's next policy action in 2019.6 While the resulting events, displayed in figure 3, are not identical to the events in figure 2, they are closely related. The overall contour of the trace of these survey-implied probabilities is very similar to its market-implied counterpart; however, there are some notable differences:
- Throughout, survey respondents, on average, appeared to assign somewhat greater odds to higher rates than financial markets.
- Up to and including the June meeting, average survey-implied probabilities seemed to lag market-implied probabilities by roughly one meeting.
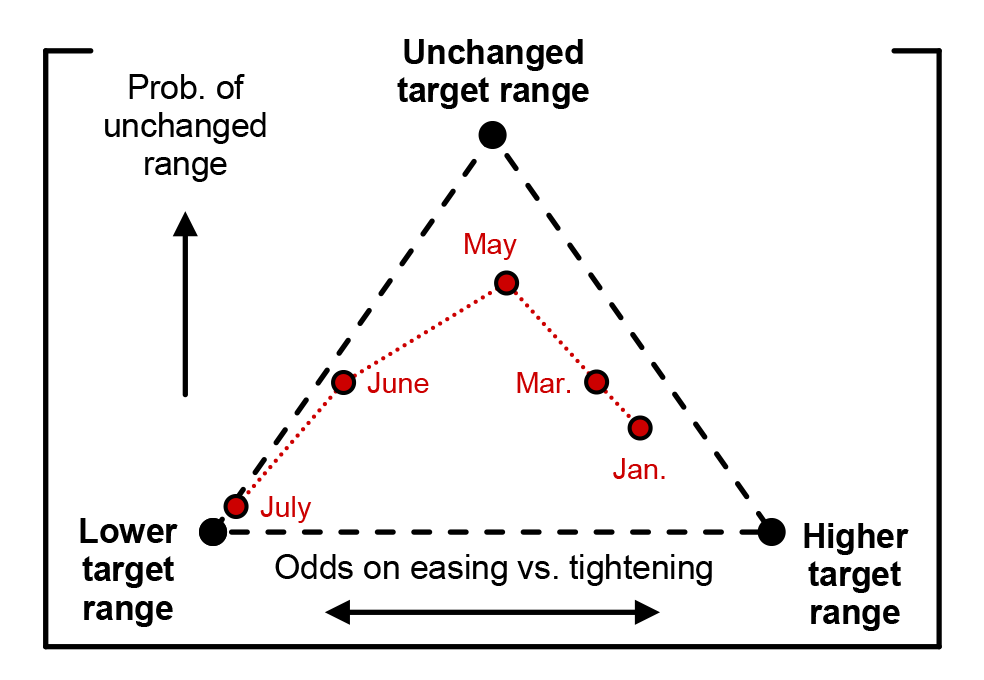
Note: Points within the dashed triangle represent probabilities that the next policy move by the FOMC in 2019 will be a rate cut, a rate hike, or no change in the federal funds target range. Each red circle depicts the average probabilities across respondents from the Federal Reserve Bank of New York's surveys of primary dealers and market participants conducted before the indicated FOMC meeting.
Source: Federal Reserve Bank of New York; Federal Reserve Board staff computations.
Robustness: Eurodollar Futures Options
In contrast to the underlying futures contracts, trading volume and open interest in federal funds futures options are limited.7 For contracts without open interest or trading volume, the CME Group provides indicative settlement quotes that are not based on market activity.8 To assess the plausibility of the risk-neutral probabilities derived from these quotes in the previous section, the more liquid Eurodollar futures options market is a useful benchmark. Risk-neutral distributions derived from Eurodollar futures options are for three-month LIBOR (London interbank offered rate), the reference rate for Eurodollar futures. Expectations for LIBOR are likely to reflect not only an assessment of future monetary policy, but also considerations of bank funding risk. While the difference between risk-neutral means of LIBOR and the federal funds rate can be quantified based on their relative futures rates or the price of over-the-counter instruments called "basis swaps," adjusting for the difference in higher moments is not straightforward.9 For purposes of this robustness check, suppose we shift the risk-neutral distribution for LIBOR by the difference in futures rates and then scale the distribution down toward its mean by a fixed ratio to correct for the additional risks affecting LIBOR.10 Figure 4 shows the resulting probabilities in a simplex diagram. Reassuringly, figures 2 and 4 appear to tell the same qualitative story, and what modest quantitative differences there are arguably lie within the margin of uncertainty about the necessary adjustments from LIBOR outcomes to federal funds rate outcomes. Indeed, it is not obvious that the error introduced by adjusting LIBOR option-based probabilities is any less consequential than the potential noise in probabilities derived directly from lower-liquidity federal funds futures options.
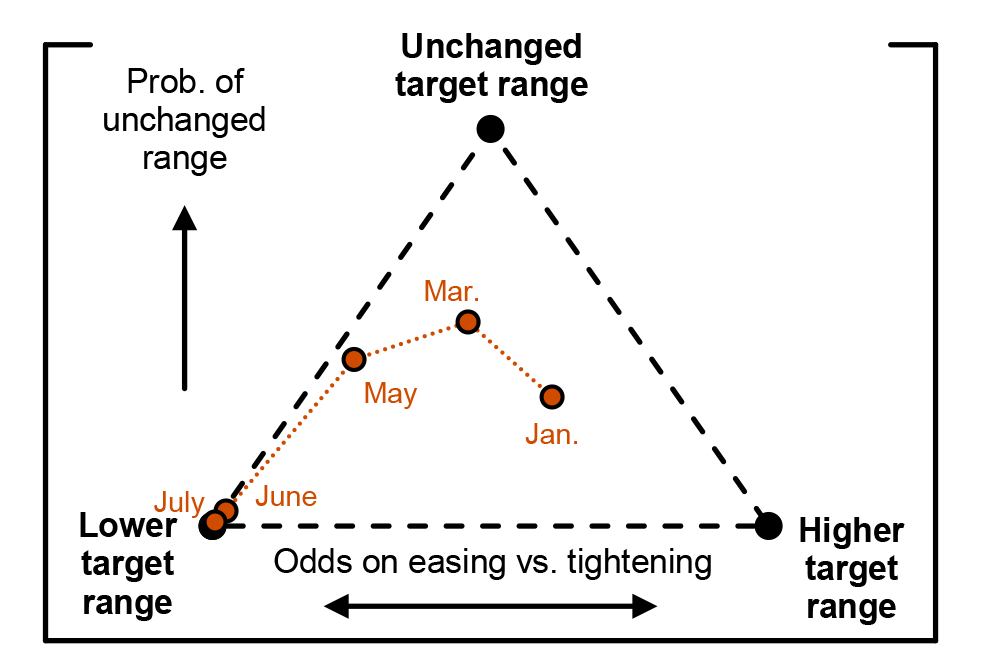
Note: Points within the dashed triangle represent probabilities that the federal funds rate at the end of 2019 will be below, within, or above the range of 2.25 to 2.50 percent. Each orange circle depicts the probabilities as implied by Eurodollar futures options (after adjustment as discussed in the main text) on the eve of the indicated FOMC meeting.
Source: CME Group Inc.; Federal Reserve Board staff computations.
Probabilities Implied by Binary Tree Models
A popular method of deriving market-implied policy rate distributions based on futures data alone (that is, with no use of options) relies on binary trees to represent the FOMC's decision problem. Examples are Bloomberg's World Interest Rate Probabilities (WIRP) and the CME Group's FedWatch Tool.11 Since these models rely on a single piece of information per FOMC meeting (the futures-implied federal funds rate after the meeting) to derive probabilities for an ever-expanding range of outcomes, strong assumptions need to be imposed, including the binary restriction on the FOMC's choice set at each meeting, an assumption on where within the target range the effective federal funds rate will settle, and the assumption that the probability of a given future policy move does not depend on the history of previous moves. Figure 5 shows the trace of probabilities for year-end 2019 federal funds rate outcomes as implied by WIRP. While the path from May onward closely matches the option-implied probabilities in figure 2, the probabilities for January and March are notably different:
- In January, compared with the option-implied probabilities, WIRP implied a substantially higher probability of an unchanged range at year-end, but notably greater directional odds on higher rates.
- Between January and March, WIRP implied little change in the probability of an unchanged year-end funds rate, but a more-than-full reversal in directional odds.
The tree model, taking as its only input a futures curve that, earlier in 2019, was relatively flat, interpreted the substantial uncertainty about the direction of the next rate move as instead reflecting a high likelihood of no rate move. As the futures curve went from slightly upward sloping in January to slightly downward sloping in March, the model assigned an almost unrevised probability to the "unchanged" outcome but drastically shifted the odds on easing versus tightening. Both this dramatic shift in directional odds and the subsequent move along the leftmost edge of the diagram are due to the binary tree structure, which cannot accommodate a situation in which investors assign strictly positive risk-neutral probabilities to both a possible rate hike and a possible rate cut at the same meeting.
Note: Points within the dashed triangle represent probabilities that the federal funds rate at the end of 2019 will be below, within, or above the range of 2.25 to 2.50 percent. Each green circle depicts the probabilities as implied by Bloomberg's binary tree model fit to federal funds futures rates on the eve of the indicated FOMC meeting.
Source: Bloomberg Finance LP.
Expectations for the Outcome of the July 2019 FOMC Meeting
Since market-implied expectations for year-end were firmly on lower rates by June 2019 (see figure 2), figure 6 uses a different partition of the outcome set to study the evolution of policy expectations immediately leading up to the July 2019 rate cut. A move vertically downward in figure 6 represents an increase in the probability that there will be a rate cut at the July meeting. A move horizontally to the right signifies greater odds on a 50 (or more) basis point rate cut versus a 25 basis point rate cut. The diagram plots the trace of market-implied probabilities since the May FOMC meeting (with daily observations for the June-July intermeeting period) as well as the average survey-implied probabilities from the New York Fed's July surveys.
As figure 6 shows, before the May meeting, markets assigned a high probability to an unchanged target range after the July meeting, and there was virtually no probability of a cut exceeding 25 basis points. However, by June, the probability of a July rate cut had increased notably, with a nontrivial probability of a 50 basis point rate cut. Over the intermeeting period, most fluctuation in market-implied probabilities was lateral within the diagram, suggesting that investors expected a rate cut with high probability and appeared to focus mostly on calibrating the odds on a 25 versus 50 basis point cut.12 Immediately before the July meeting, the market-implied probabilities reflected a high likelihood of a 25 basis point rate cut, with a modest residual probability on the two other outcomes. Survey respondents showed only slightly less conviction around that same outcome for July.
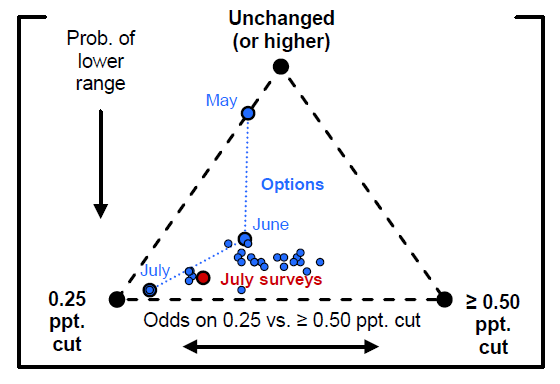
Note: Points within the dashed triangle represent probabilities for the outcome of the July 2019 FOMC meeting in terms of the federal funds target range. Larger blue circles depict the option-implied probabilities on the eve of the indicated FOMC meeting. The smaller blue dots are daily observations for the June-July intermeeting period. The red circle is the average across respondents from the New York Fed's July surveys.
Source: CME Group Inc.; Federal Reserve Bank of New York; Federal Reserve Board staff computations.
Conclusion
Between January and July 2019, market- and survey-implied probabilities of different events regarding future policy rates have mirrored and, to some extent, anticipated the FOMC's move from expecting higher future rates in December 2018 to adopting a patient stance and, finally, to making the decision in July 2019 to cut rates. Probability simplex diagrams can be used to chart the evolution of such policy expectations in situations where central tendencies (for example, mean expectations) alone are insufficiently granular. Risk-neutral probabilities derived from federal funds futures options and Eurodollar futures options present a closely matching pattern that anticipated lower rates as the most likely year-end outcome as early as May. Complementary information from surveys suggests that physical probabilities took about one FOMC meeting cycle to catch up. By June, the market-implied probability of a rate cut at the upcoming July meeting was substantial, although uncertainty about the size of the cut remained until shortly before the July meeting.
References
Bauer, Michael (2012). "Monetary Policy and Interest Rate Uncertainty," FRBSF Economic Letter 2012-38. San Francisco: Federal Reserve Bank of San Francisco, December, https://www.frbsf.org/economic-research/publications/economic-letter/2012/december/monetary-policy-interest-rate-uncertainty.
Bauer, Michael, Aeimit Lakdawala, and Philippe Mueller (2019). "Market-Based Monetary Policy Uncertainty," Working Paper Series 2019-12. San Francisco: Federal Reserve Bank of San Francisco, April, https://doi.org/10.24148/wp2019-12.
Board of Governors of the Federal Reserve System (2019a). "Federal Reserve Issues FOMC Statement," press release, January 30, https://www.federalreserve.gov/newsevents/pressreleases/monetary20190130a.htm.
-- (2019b). "Federal Reserve Issues FOMC Statement," press release, July 31, https://www.federalreserve.gov/newsevents/pressreleases/monetary20190731a.htm.
-- (2019c). "Transcript of Chair Powell's Press Conference, July 31, 2019," July 31, https://www.federalreserve.gov/mediacenter/files/FOMCpresconf20190731.pdf.
De Pooter, Michiel, Giovanni Favara, Michele Modugno, and Jason Wu (2018). "Monetary Policy Surprises and Monetary Policy Uncertainty," FEDS Notes. Washington: Board of Governors of the Federal Reserve System, May 18, https://doi.org/10.17016/2380-7172.2176.
Forsyth, Randall W. (2019). "The Federal Reserve Is About to Cut Interest Rates: The Only Question Is How Much," Barron's, July 30.
Otani, Akane (2019). "Why Is Wall Street So Sold on the 50-Basis-Point Rate Cut?" Wall Street Journal, July 19.
Piazzesi, Monika, and Eric T. Swanson (2008). "Futures Prices as Risk-Adjusted Forecasts of Monetary Policy," Journal of Monetary Economics, vol. 55 (May), pp. 677-91.
Priebsch, Marcel (forthcoming). "Robust Extraction of Risk-Neutral Distributions from Options on Interest Rate Futures," Finance and Economics Discussion Series. Washington: Board of Governors of the Federal Reserve System.
Smialek, Jeanna (2019). "Fed Holds Rates Steady but Opens Door to a Cut," New York Times, June 19.
Szalay, Eva (2019). "Speculation Builds on Depth of US Rate Cut against Increasingly Worrying Global Growth Backdrop," Financial Times, July 29.
Torres, Craig, and Christopher Condon (2019). "Fed Scraps Patient Approach and Opens Door to Potential Rate Cut," Bloomberg, June 19.
1. This article will use the term "expectation" broadly to encompass distributional forecasts, while reserving the terms "expected value" and "mean" for the central-tendency concept of mathematical expectation. Return to text
2. See Board of Governors (2019b). Return to text
3. See Board of Governors (2019c). Return to text
4. See Board of Governors (2019a). Return to text
5. See, for example, Smialek (2019) and Torres and Condon (2019). Return to text
6. The survey results shown in this article are available on the Federal Reserve Bank of New York's website at https://www.newyorkfed.org/markets/primarydealer_survey_questions and https://www.newyorkfed.org/markets/survey_market_participants. Return to text
7. Information on 30-day federal funds volume is available on the CME Group's website at https://www.cmegroup.com/trading/interest-rates/stir/30-day-federal-fund_quotes_volume_voi.html. Return to text
8. Details about 30-day federal funds options settlements can be found on the CME Group's website at https://www.cmegroup.com/trading/interest-rates/stir/30-day-federal-fund_quotes_settlements_options.html. Return to text
9. See, for example, Bauer (2012) and Bauer, Lakdawala, and Mueller (2019). Return to text
10. A similar scaling approach is taken by De Pooter and others (2018). Return to text
11. The former requires a Bloomberg subscription, while the latter is available on the CME Group's website at https://www.cmegroup.com/trading/interest-rates/countdown-to-fomc.html. Return to text
12. This interpretation is consistent with contemporaneous press reporting--for example, Forsyth (2019), Otani (2019), and Szalay (2019). Return to text
Priebsch, Marcel A. (2019). "A New Way to Visualize the Evolution of Monetary Policy Expectations," FEDS Notes. Washington: Board of Governors of the Federal Reserve System, September 20, 2019, https://doi.org/10.17016/2380-7172.2444.
Disclaimer: FEDS Notes are articles in which Board staff offer their own views and present analysis on a range of topics in economics and finance. These articles are shorter and less technically oriented than FEDS Working Papers and IFDP papers.