FEDS Notes
March 22, 2019
The Re-emergence of the Federal Reserve Funds Market in the 1950s
Depository institutions (banks) use the federal funds market to borrow and lend balances they hold at the Federal Reserve (reserves) to meet their reserve requirements, facilitate settlement of payments, and maintain a buffer of liquid assets. However, during the global financial crisis, the large scale asset purchases conducted by the Federal Reserve resulted in an environment of super-abundant reserves, which led to a substantial decline in interbank trading in the federal funds market. Therefore, as the Federal Reserve reduces the supply of reserves through tightening monetary policy, there is some uncertainty about how the federal funds market will respond.
In this note, we highlight the re-emergence of the federal funds market in the 1950s, when reserves were reduced from levels that were considered super-abundant (Meltzer 2009). At the start of the 1950s, nearly 50 percent of assets of Federal Reserve member banks consisted of reserve balances or Treasury securities that could easily be converted to reserves at a discount window facility at a preferential rate. During this time, trading in the federal funds market was anemic. As the Federal Reserve tightened liquidity conditions--sometimes through active monetary policy restraint and at other times by holding its balance sheet size fixed as the U.S. economy grew--the federal funds market revived. By the end of the decade, banks were able to borrow and lend reserves easily. We find that as the market grew, it attracted new participants amid financial innovations that further bolstered market size, liquidity, and stability. We first review monetary policy implementation in the 1950s, and concurrent developments in the banking system. We then discuss the revival of the federal funds market, which may have some implications for today.
Monetary Policy Implementation in the 1950s
Starting in 1942, the Treasury and Federal Reserve agreed to keep interest rates low to finance war-related expenses. The Federal Reserve established ceilings on a variety of rates on Treasury securities including a rate of 3/8 percent on the 3-month Treasury bill and a yield of 2 1/2 percent on long-term Treasury securities (Chaurushiya and Kuttner 2003). Maintaining the ceilings on Treasury yields, especially those on short-term Treasury bills, at times forced the Federal Reserve to buy a significant share of outstanding Treasury securities with particular maturities. After the war ended, the Federal Reserve was pressured by the Treasury to maintain caps on many interest rates to facilitate the Treasury to refinance its large debts (Wicker 1969). While the ceiling on bill rates was lifted in 1947, the ceiling on longer-term rates remained.
In 1951, the Federal Reserve and the Treasury signed the Accord that allowed the Federal Reserve to use the full range of its tools--the discount rate, reserve requirements, and its balance sheet size and composition--to implement monetary policy independently.1
When conducting monetary policy, the Federal Open Market Committee (FOMC) was reluctant to establish a target for a specific interest rate given the pre-Accord experience in which it had been under pressure to target certain Treasury rates. In addition, the FOMC focused its operations on Treasury bills to further avoid being urged to support the prices of long-term government securities.2
As one guide for setting the stance of policy, the FOMC focused on the level of net free reserves (excess reserves minus borrowed reserves) that would be most likely consistent with the Committee's desired policy objectives. The target amount of net free reserves was determined by the Committee's "feel of the market," as indicated by several short-term funding rates and volumes such as the federal funds rate, trading in the federal funds market, the Treasury bill rate, the Treasury bond rate, and Treasury debt issuance (Meltzer 2009 p. 187). The public was likely unaware of the formula used by the FOMC (which was not very precise in any case) to determine the Federal Reserve's preferred amount of net free reserves, which likely made it difficult for the public to anticipate monetary policy decisions.3
Although the FOMC was not targeting the federal funds rate, this rate was nevertheless a useful indicator for the tightness of monetary policy. As part of its policy framework in the 1950s, the Federal Reserve operated a discount window facility that allowed banks to borrow against Treasury collateral, and other select eligible collateral, at a rate 50 basis points below the rate they could borrow against more general collateral; the rate on that facility served as a ceiling for the federal funds rate. Banks appear to have been willing to borrow at the discount window using this facility at times when the federal funds rate reached the preferential rate. The Federal Reserve could observe such borrowing and viewed it as a signal of tightness in the market for reserves (Meltzer 2009). Consequently, the FOMC could engage in open market operations to add reserves when the federal funds rate approached this discount rate.
The evolution of the stance of monetary policy can be observed in Table 1, which displays the discount rate on Treasury securities and reserve requirements for net demand deposits. The monetary policy tightening cycle began in 1954 as the discount rate increased from 1.5 percent to 3 percent by 1956. A temporary easing occurred in 1958 in response to the recession, when reserve requirements for banks were cut by 1 to 2 percentage points, and the discount rate was reduced by 50 basis points.
Figure 1 illustrates some notable developments on the Federal Reserve's balance sheet during the 1950s. The percentage of marketable Treasury securities that the Federal Reserve owned decreased in the first half of the decade, from over 16 percent in 1951 to 14.5 percent after 1954 as the tightening cycle began. Total reserves also declined around this period, particularly from 1952 to 1955 due to the Federal Reserve keeping its balance sheet size constant while currency demand grew.
Developments at commercial banks
The balance sheet composition of banks also changed significantly during this decade. At the beginning of the 1950s, banks held ample reserves and a significant amount of Treasury securities, while loans comprised only a modest share of the balance sheet. Amid economic growth in the 1950s, plentiful economic opportunities led banks to extend more loans and hold fewer Treasury securities (see Figure 2). This occurred even as total reserves declined. In addition, once the Federal Reserve ended the ceilings on Treasury yields, the ability of banks to transform their Treasury securities into reserves was reduced. Consequently, during the early 1950s, banks began monitoring liquidity more carefully. Developments in bank liabilities were also important. Growth in retail deposits did not keep pace with the growth in loans, especially at some of the largest banks. Consequently, these banks turned to other forms of funding including borrowing from other banks in the federal funds market (Willis 1972).
The re-emergence of the federal funds market
At the start of the 1950s, the federal funds market experienced little to no trading amid plentiful reserves and ample Treasury securities on bank balance sheets. However the market slowly began to re-emerge as reserves became less plentiful; banks needed to manage their reserves more carefully and be able to acquire reserves from other banks in the event of a shortfall. The revival was particularly notable in 1954, as the Federal Reserve began tightening monetary policy. Around this time, there was a step up in the number of participants and the average trading volume. Table 2 provides some summary statistics of the number of participants and average daily borrowings in the federal funds market.
Figures 3 and 4 show short-term interest rates as well as estimates of federal funds trading volumes.4 In the early 1950s, when reserves were plentiful and trading volumes were low, the federal funds rate was highly volatile as a few trades could move the average price notably. As reserve management became more active and trading volumes rose, volatility in the market declined. Several months into the tightening cycle in 1955, the federal funds rate started to move in line with other market rates and exhibited lower volatility. Figure 4 also shows that the preferential discount window rate for Treasury collateral was effective at providing a ceiling on the federal funds rate. Co-movement of the federal funds rate with other market rates and its lower volatility prevailed even when the Federal Reserve eased monetary policy during the 1958 recession and rates dropped below the preferred discount window rate. (The absolute value of deviations from the 3-month Treasury bill rate in 1958 averaged 38 basis points while for a similar period in 1953, when the federal funds rate was also below the preferential discount window rate, deviations average 58 basis points.)
Other descriptions of the market reinforce the idea that a more active market brought in more participants, which further boosted activity and liquidity. First, Willis (1972) reports that in the 1950s, the structure of the market changed from a direct exchange of federal funds among banks to an exchange through a broker, leading to significant growth in trading and an increase in the number of counterparties (see Table 2). Three other institutions entered the market as federal funds brokers in the late 1950s. Moreover, some of the large banks began to trade actively on both sides of the market. Second, with more brokers and trading banks, minimum trade size in the market dropped and small country banks were able to trade in the market (Meek 1972).
As banks increasingly needed to manage their liquidity amid monetary tightening, trading in the federal funds market gradually re-emerged. Through this experience, the size and liquidity conditions in the federal funds market became self-reinforcing; as the market developed, it attracted additional participants that further enhanced its usefulness in managing liquidity. This historical experience may have implications for current monetary policy because it suggests that as the Federal Reserve reduces the supply of reserves through tightening monetary policy, and as the incentives to participate in the market return, interbank trading in the federal funds market is likely to eventually revive.
References
Carlson, Mark and David Wheelock (2016). "Navigating Constraints: the Evolution of Federal Reserve Monetary Policy 1935-1959," in The Federal Reserve's Role in the Global Economy, Michael Bordo and Mark Wynne (eds.), Cambridge University Press, New York.
Chaurushiya, Radha and Ken Kuttner (2003), "Targeting the Yield Curve: The Experience of the Federal Reserve, 1942-51," Federal Reserve memo dated June 18, 2003.
Humpage, Owen F., and Sanchita Mukherjee (2013), "Even Keel and the Great Inflation," Federal Reserve Bank of Cleveland, Working Paper, no. 13-15.
Meek, Paul (1972), "Discount Policy and Open Market Operations," in Reappraisal of the Federal Reserve Discount Mechanism, Board of Governors of the Federal Reserve.
Meltzer, Allan (2009), "A History of the Federal Reserve," Volume 2 Book 1, University of Chicago Press, Chicago.
Wicker, Elmus (1969), "The World War II Policy of Fixing A Pattern of Interest Rates." Journal of Finance, vol. 24, pp. 447-458.
Willis, Parker B. (1972), "A Study of the Market for Federal Funds," in Reappraisal of the Federal Reserve Discount Mechanism, Board of Governors of the Federal Reserve.
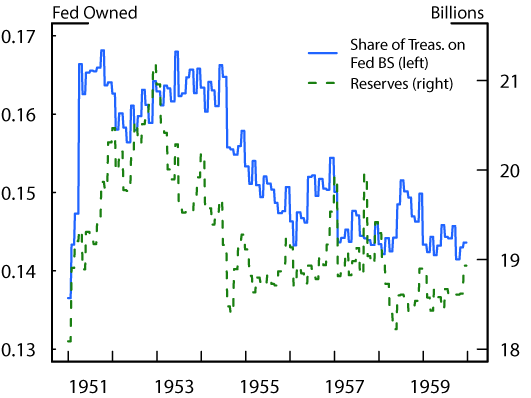
Source: Banking and Monetary Statistics, 1941 - 1970.
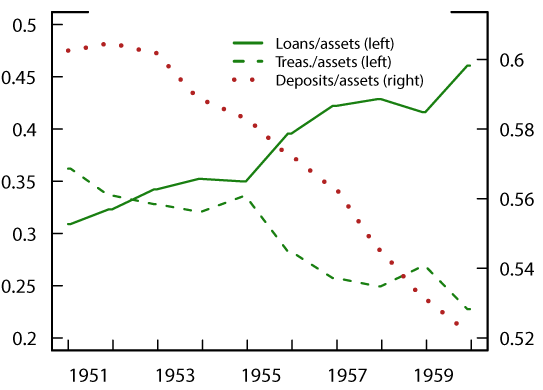
Source: Banking and Monetary Statistics, 1941 - 1970.
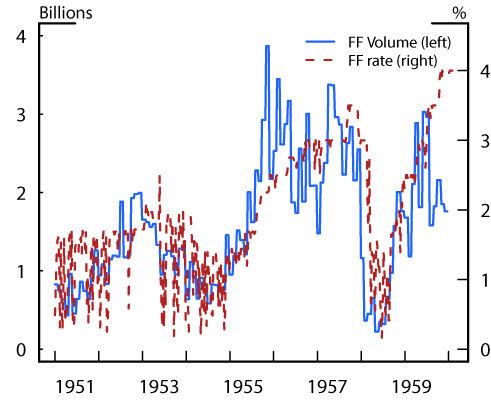
Source: Wall Street Journal; Federal Reserve Economic Data (FRED) from FRB St. Louis; and Banking and Monetary Statistics.
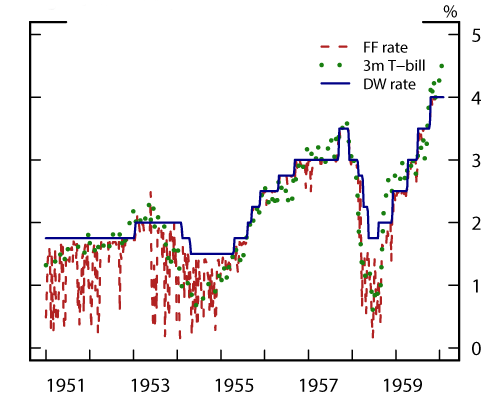
Source: Wall Street Journal; Federal Reserve Economic Data (FRED) from FRB St. Louis; and Banking and Monetary Statistics.
Table 1: Monetary Policy Tools 1951-1959
| Discount rate for loans against Treasury collateral | Reserve requirements on net demand deposits (percent of deposits) | |||
|---|---|---|---|---|
| Year | (percent) | Central Reserve City bank | Reserve City bank | Country banks |
| 1951 | 1.75 | 24 | 20 | 14 |
| 1952 | 1.75 | 24 | 20 | 14 |
| 1953 | 2 | 22 | 19 | 13 |
| 1954 | 1.5 | 20 | 18 | 12 |
| 1955 | 2.5 | 20 | 18 | 12 |
| 1956 | 3 | 20 | 18 | 12 |
| 1957 | 3 | 20 | 18 | 12 |
| 1958 | 2.5 | 18 | 16.5 | 11 |
| 1959 | 4 | 18 | 16.5 | 11 |
Note: Data are as of year-end.
Source: Banking and Monetary Statistics. 1941-1970.
Table 2: Trading in Federal Funds
| Trading among banks | Brokered volumes | |||
|---|---|---|---|---|
| Period | Number of banks regularly participating | Daily average gross purchases ($ millions) | Estimated number of banks | Daily average trading volume ($ millions) |
| 1951 | 35-45 | 210-250 | ||
| 1952 | 75-100 | 350-450 | 45-50 | 260-320 |
| 1953 | 50-75 | 280-340 | ||
| 1954 | 75-85 | 330-360 | ||
| 1955 | 85-100 | 320-350 | ||
| 1956 | 125-200 | 800-1200 | 115-130 | 350-400 |
| 1957 | 130-145 | 310-340 | ||
| 1958 | 140-160 | 350-400 | ||
| 1959 | 140-160 | 330-360 | ||
| 1960-63 | 175-275 | 1500-2500 | 160-225 | 375-540 |
Source: Willis (1967). Information on trading among banks is only available for three year windows in the source material.
1. Carlson & Wheelock (2015) argue that the Federal Reserve used changes in reserve requirements as an active part of the monetary policy toolkit prior to the Accord, and that the Federal Reserve was able to use changes in reserve requirements, in combination with changes in the discount rate, to respond to accelerating inflation in the late 1940s. However, this tool was not very efficient and there were concerns among policymakers that too frequent changes in reserve requirements could make it difficult for commercial banks to manage their liquidity. Return to text
2. The Federal Reserve remained sensitive to the needs of the Treasury to roll over debt, and tried to avoid disrupting the Treasury market when the Treasury was issuing new securities. See Humpage and Mukherjee (2013). Return to text
3. The FOMC's discussions tended to focus on both the appropriate level of the discount rate and the appropriate level of net free reserves. Minutes of the FOMC meetings from this period are available on the website of the Board of Governors: https://www.federalreserve.gov/monetarypolicy/fomc_historical_year.htm. For an example of discussions around the time of a rate increase see https://www.federalreserve.gov/monetarypolicy/files/FOMChistmin19550802.pdf. Return to text
4. Federal funds volumes are approximated from the category "Total Borrowings from Federal Reserve Banks and Other" as reported in Banking and Monetary Statistics 1941-1970. Data on the federal funds rate was published by the Federal Reserve starting in mid-1954, perhaps signifying that the Federal Reserve only viewed the market as sufficiently liquid at that point. Data prior to July 1954 are collected from the Wall Street Journal. Return to text
Anbil, Sriya, and Mark Carlson (2019). "The Re-emergence of the Federal Reserve Funds Market in the 1950s," FEDS Notes. Washington: Board of Governors of the Federal Reserve System, March 22, 2019, https://doi.org/10.17016/2380-7172.2312.
Disclaimer: FEDS Notes are articles in which Board staff offer their own views and present analysis on a range of topics in economics and finance. These articles are shorter and less technically oriented than FEDS Working Papers and IFDP papers.