FEDS Notes
October 04, 2017
A Shadow Rate Model of Intermediate-Term Policy Rate Expectations
This note introduces a shadow rate term structure model based on OIS rates and surveys to quantify federal funds rate expectations and term premiums over horizons ranging from one month to five years. The model implies that term premiums vary over time and can be substantial in magnitude, even at relatively short horizons. They appear to have trended down over the last 25 years and are recently estimated to be negative.
Introduction
Forward rates derived from quotes on overnight index swaps (OIS)--financial instruments that swap a fixed-rate payment for a floating-rate payment tied to the average realized effective overnight federal funds rate--have frequently been used to measure market expectations about future federal funds rates. However, forward rates reflect expected future short rates only under the risk-neutral measure ($$\mathbb{Q}$$) and may differ from real-world ($$\mathbb{P}$$) expectations.2 At very short horizons (up to perhaps three months), the expectations hypothesis may be a sufficiently close approximation to justify the use of risk-neutral expectations as a proxy for real-world expectations.3 However, at short-to-intermediate horizons of several months to several years, term premiums likely drive a wedge between risk-neutral and real-world expectations.4 To quantify these term premiums, and to back out term-premium-adjusted expectations for the path of the federal funds rate implied by financial market quotes, I estimate a shadow rate term structure model using OIS rates and federal funds rate forecasts from surveys.
Data
I use monthly data from May 1991 to October 2016 for rates on OIS with maturities of 1, 3, and 6 months, as well as 1, 2, 3, 4, and 5 years, supplemented by federal funds rate forecasts from Blue Chip Financial Forecasts, linearly interpolated to constant horizons of 1, 2, 3, and 4 quarters (short-range surveys, available monthly), and 2, 3, 4, 5, and 5-to-10 years (long-range surveys, available semiannually).5
The Shadow Rate Model and Model Estimates
Standard Gaussian term structure models, such as the model proposed by Kim and Wright (2005), assume that the short-term interest rate rt follows a Gaussian, or normal, process under both $$\mathbb{P}$$ and $$\mathbb{Q}$$.6 Implied bond prices--and hence longer-term yields--can then be derived by imposing the absence of arbitrage. The Gaussian assumption also implies that the short rate, and hence longer-term yields, can turn arbitrarily negative. It is therefore ill suited for modeling the short end of the nominal yield curve, and policy expectations out to a few years, at or near the effective lower bound (ELB).7 A tractable modification to the standard approach is to introduce a "shadow" short rate st that is modeled, as usual, as a Gaussian process and can take on arbitrary values, but assume that the observed short rate cannot fall below an effective lower bound, $$r_{min}$$; in other words, the observed short rate is taken to be equal to max{$$s_t, r_{min}$$}. Empirically, this shadow-rate specification has been shown to perform as well as or better than alternative term structure models that also accommodate a lower bound on yields, such as the generalized Cox-Ingersoll-Ross model or the quadratic-Gaussian model.8
Preliminary principal components analysis (not shown) suggests that three factors explain over 99.9 percent of the cross-sectional variation in OIS rates over the sample period. I therefore estimate a three-factor shadow rate model, where both yields and term premiums are assumed to be driven by three unobserved factors. The model is estimated using quasi-maximum likelihood and the unscented Kalman filter, with the second-order yield approximation methodology developed in Priebsch (2013).9 When no new survey forecasts are available, they are treated as missing observations. The filtering setup accommodates the different frequencies of monthly short-range surveys and semiannual long-range surveys, and also allows us to fit the estimated model to daily OIS rates for real-time analysis.
The ELB on the federal funds rate is treated as a free parameter, and is estimated to be approximately 13.5 basis points. The model implies an unconditional expected short rate of 4.7 percent, to which the federal funds rate will converge over very long horizons in the absence of further shocks. Although the equilibrium short rate is constant in this model, the most persistent factor is estimated to have a half life under $$\mathbb{P}$$ of about 5 years; as a result, the model is able to generate substantial time variation in expected short-term rates even at horizons of 5 to 10 years (the concept of "longer term" taken in this note).
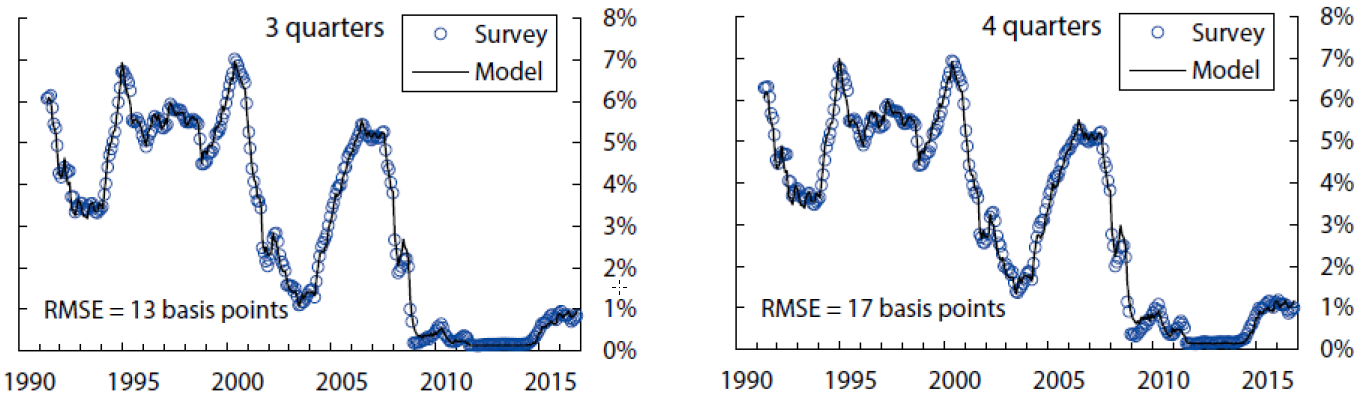
The fitting errors from this model are about 4.7 basis points for yields, 13 basis points for short-range surveys, and 28 basis points for long-range surveys.10 The empirical fit for yields and surveys over the sample period is shown in Figures 1, 2, and 3. Of note, the fit for shorter-maturity yields improves later in the sample, possibly a reflection of improved liquidity conditions. The model tracks the survey forecasts fairly closely, especially the short-range surveys. At the 5-to-10-year horizon, the model smooths through some of the early volatility in survey forecasts but matches the secular decline over the last decade or so.
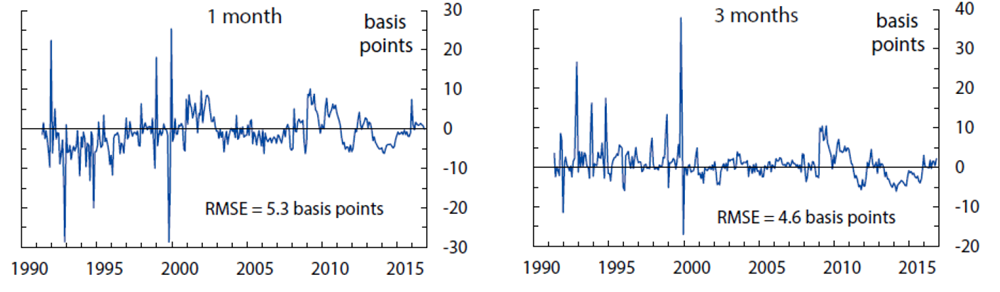
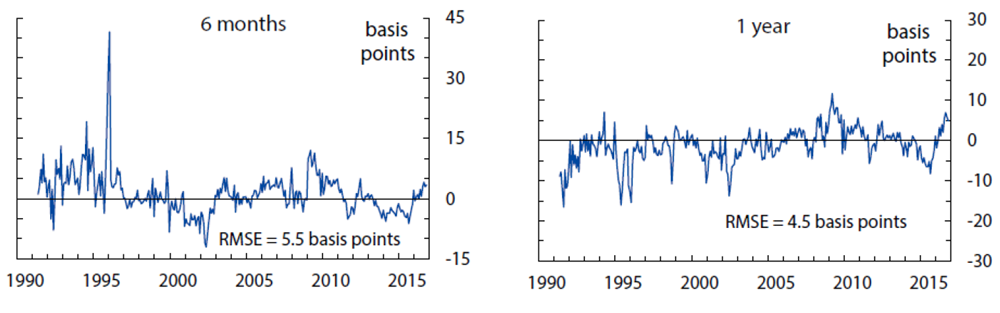
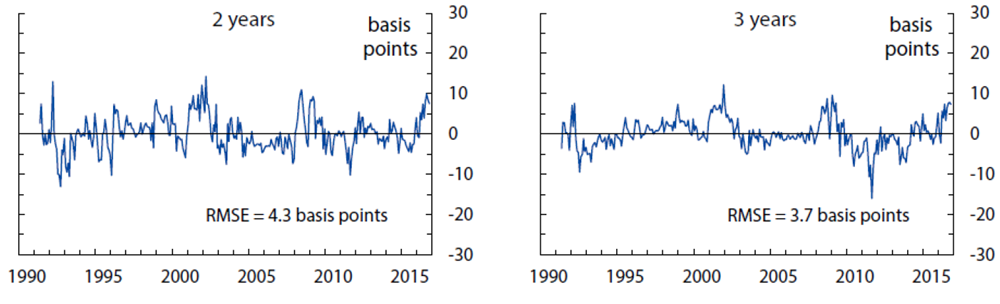
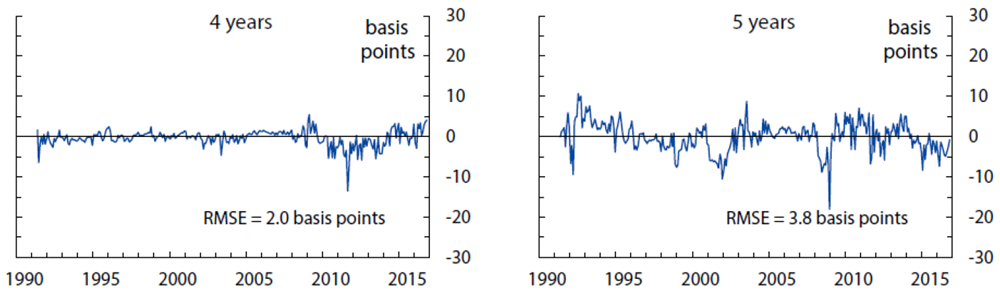
Computed as observed zero coupon OIS rates minus model-implied zero coupon yields, based on filtered state variables. Each panel also shows the empirical in-sample fitting error. The model-implied fitting error (an estimated parameter assumed constant across maturities) is 4.7 basis points.
Sources: Author's calculations, derived data from J. P. Morgan and Bloomberg Financial LP.
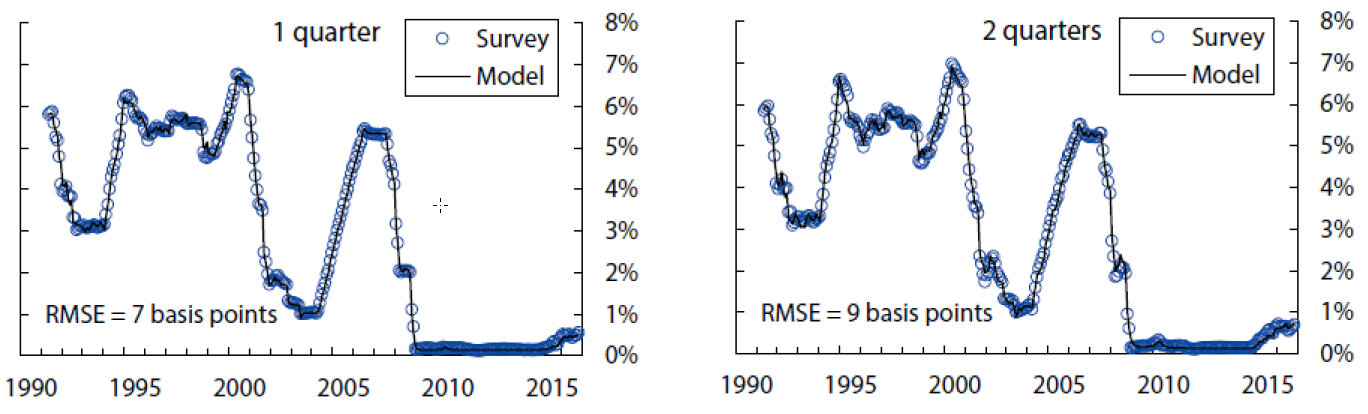
The charts show the survey forecasts for the federal funds rate for the indicated horizon, and the model-implied counterpart, based on filtered state variables. The model-implied fitting error is 13 basis points.
Sources: Author’s calculations, derived data from Blue Chip Financial Forecasts.
The charts show the survey forecasts for the federal funds rate for the indicated horizon, and the model-implied counterpart, based on filtered state variables. The model-implied fitting error is 28 basis points.
Sources: Author's calculations, derived data from Blue Chip Financial Forecasts.
Policy Rate Expectations and Term Premiums
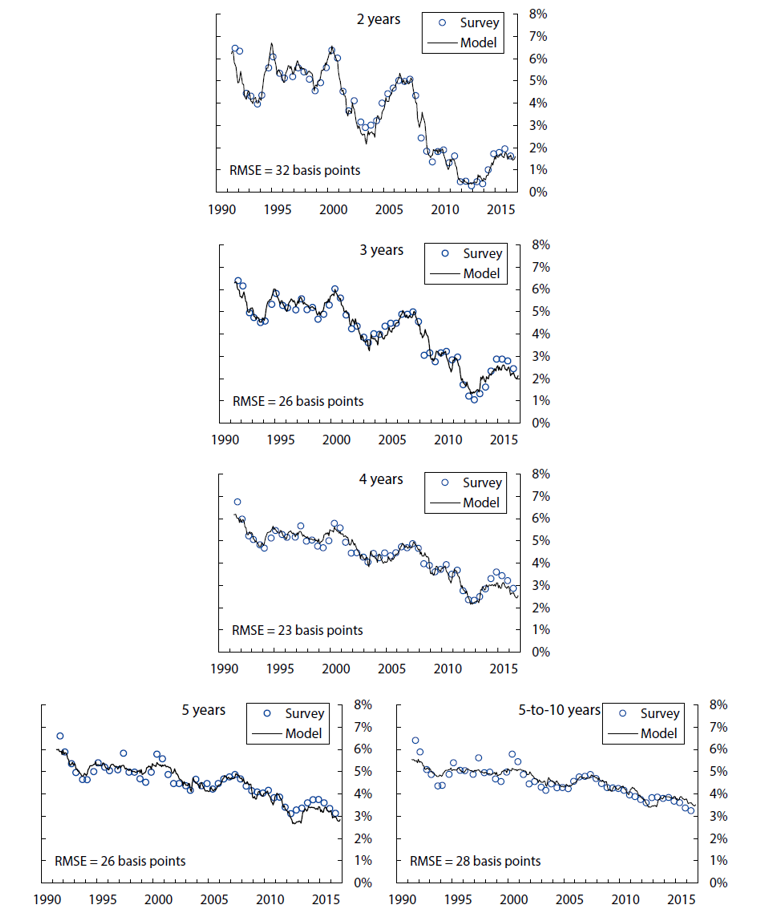
Figure 4 plots the model-implied paths of the instantaneous forward rate (the black line) and the expected future short rate (the long-dashed blue line) for October 2016 (the last observation in the estimation sample), as well as a spline-based OIS forward rate path (the crosses).11 The difference between the black and the blue paths represents the forward term premium. As the figure shows, the model implies a substantially negative term premium at the end of the sample.
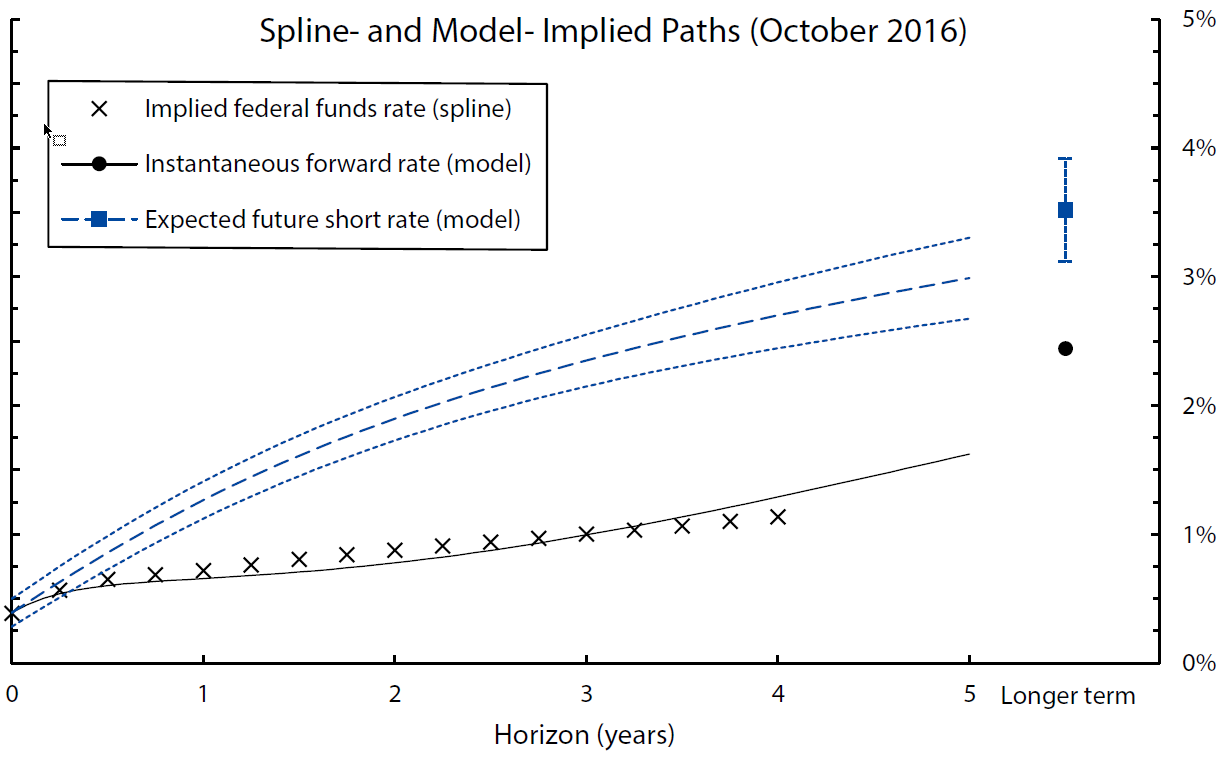
The chart show the instantaneous forward rate curve based on a spline curve fitted to OIS quotes (the black crosses) and as implied by the model (the black line), and the model-implied expected future short rate curve (the long-dashed blue line), for the last date in the estimation sample (October 2016). The "longer term" is computed as the average 5-to-10-year value. The short-dashed blue lines represent 90 percent confidence bounds on the estimated expected path.
Sources: Author's calculations, derived data from Bloomberg Financial LP.
To assess how term premiums have changed over time, Figure 5 shows the time series of forward term premiums--computed as model-implied instantaneous forward rate minus expected future short rate--for several horizons. For comparability, the term premiums are normalized to units of basis points per month of maturity and would be identical across maturities if term premiums were simple linear functions of the maturities at each point in time. The chart reveals several noteworthy patterns:
- Forward term premiums across maturities tend to co-move over time, but the lines do not overlap, indicating that term premiums are not, in general, linear in maturity.
- Forward term premiums have trended down over time, and have become substantially negative at the end of the sample period. Both observations are consistent with model-free survey-implied term premium estimates (not shown).
- Between late 2011 and early 2014, forward term premiums at maturities of one year and below were close to zero, as the FOMC's forward guidance on policy rates caused investors to anticipate a prolonged period in which the federal funds rate would remain at the ELB.
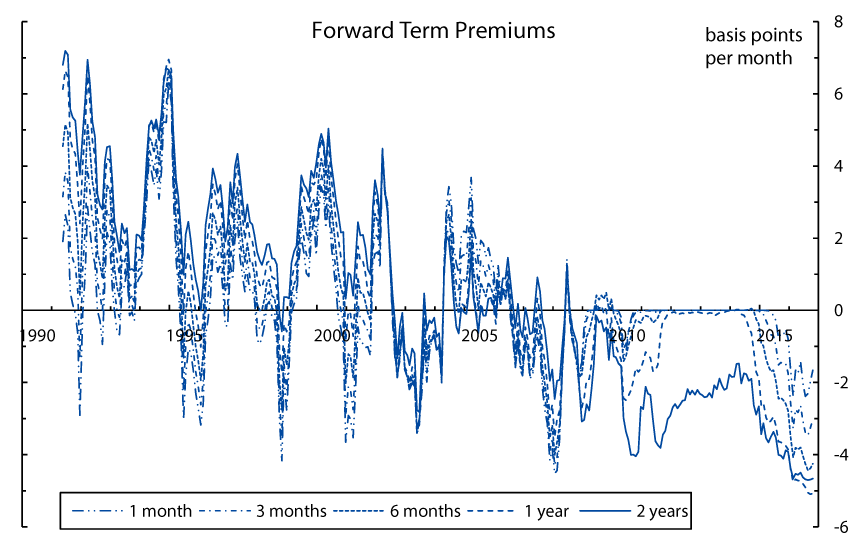
The chart plots the model-implied time series of forward term premiums for several horizons (normalized by horizon, see main text for details).
Source: Author's calculations.
Figure 6 shows the average term structures of forward term premiums over the pre–lower bound period (May 1991 to November 2008), the lower bound period (December 2008 to November 2015), and the post–lower bound period (December 2015 to October 2016). For comparison, the chart also plots a line corresponding to a hypothetical forward term premium of one basis point per month.12 Note that forward term premiums were on average positive up until 2008. The short end of the curve is roughly approximated by the one-basis-point-per-month line, but at longer horizons, the average forward term premium is closer to two basis points per month. During the lower-bound period, term premiums are close to zero at the short end and increasingly negative at longer horizons, bottoming out at about –90 basis points at the 3-to-4-year horizon. In the post–lower bound period, forward term premiums become even more negative, on average, reaching levels of almost –140 basis points at the 3-to-4-year-horizon. Significantly negative term premiums were also observed for Treasury yields over this period; both are likely driven by a similar set of factors, including shifting cyclical properties of inflation as well as global factors. Lastly, the gray line corresponds to the model-implied forward term premium when the state variables are at their unconditional expected values. Unconditionally, forward term premiums are virtually indistinguishable from zero up to a horizon of about two years. Thus, any analysis that implicitly or explicitly assumes term premiums that are constant over time may fail to uncover the substantial (but time-varying) premiums documented above.
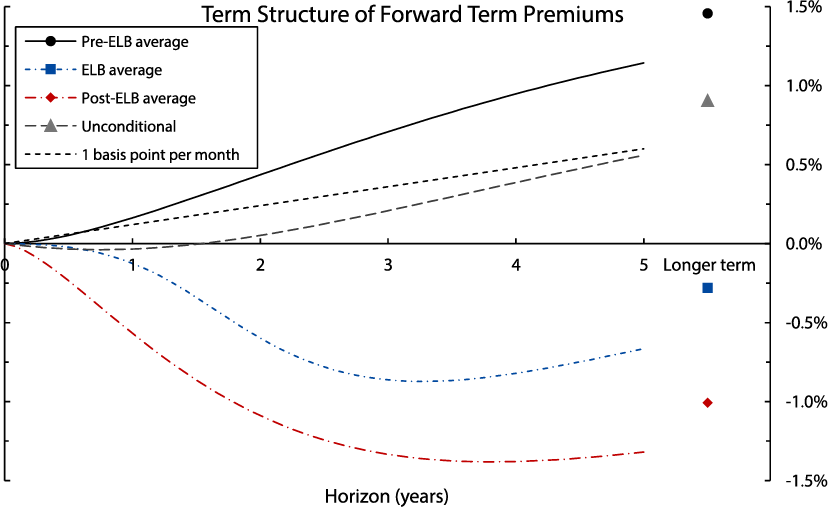
The chart plots the average term structures of forward term premiums over three sub-sample periods, as well as the model-implied unconditional expectation. The "longer term" is computed as the average 5-to-10-year value.
Source: Author's calculations.
When the model is fitted to a recent sample of daily yield data from just before the U.K.'s referendum on "Brexit" through the end of July 2017, the model's prediction for the federal funds rate that will prevail in the fourth quarter of 2017 fluctuates within a range of 1.25 to 1.50 percent, with only a few short-lived deviations outside of that range (see Figure 7). In contrast, the spline-implied OIS forward rate for the fourth quarter of 2017 falls below 50 basis points in the wake of the Brexit vote and recovers only gradually in the subsequent months, with a more notable increase following the U.S. presidential election in November 2016. The survey-implied forecast for the same horizon starts out at roughly the same level as the model's--and well above the spline forward rate--prior to Brexit, but takes a more pronounced and sustained hit following the referendum. It ticks up marginally after the U.S. election, and somewhat more notably after the March 2017 FOMC meeting. At the end of July 2017, as the forecast horizon approaches, the three measures close in on a 15 basis point range straddling 1.25 percent.
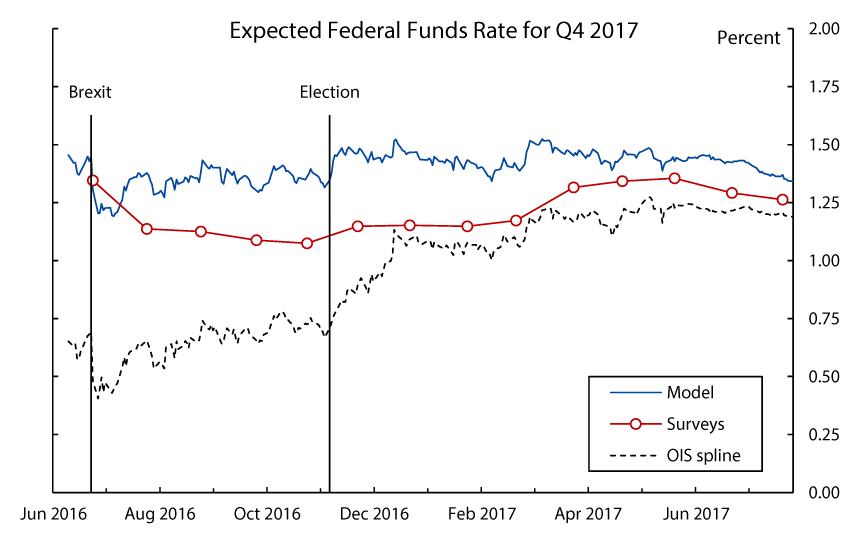
The chart plots federal funds rate expectations over time for the fixed forecast horizon Q4 2017, as implied by the model, Blue Chip surveys, and a straight read from a spline curve fitted to OIS quotes.
Sources: Author's calculations, Blue Chip Financial Forecasts, derived data from Bloomberg Financial LP.
Caveats
The analysis in this note is subject to a number of caveats:
- First, the results are derived from a specific model, and other model specifications may give somewhat different results. Empirically, the shadow rate specification has been shown to perform well, and the results presented here appear to be robust to several modifications, including down-weighing survey information and increasing the sampling frequency of yields (while surveys continue to be observed monthly).
- Second, taking the model specification as given, there is statistical uncertainty around the parameter estimates.
- Finally, since yields and surveys are assumed to be observed with error, there is filtering uncertainty around the current state variables for any given set of parameter estimates and observed yields and surveys.
The latter two uncertainties can be quantified using statistical methods: The short-dashed blue lines in Figure 4 show the 90 percent confidence bounds on the expected short rate path. The bounds represent estimation uncertainty about the expected path itself (rather than forecasting uncertainty of the realized rate around the expected path). Consistent with intuition, the model is more confident about the near-term path than the expected short rate in the more distant future.
Conclusions
Financial market quotes contain valuable information about investors' federal funds rate expectations, but a straight read may be distorted by term premiums. The shadow rate term structure model of OIS rates estimated here shows that term premiums are time varying and can be substantial, even at relatively short maturities. The term-premium-adjusted path of the expected federal funds rate from the model can therefore be a valuable tool to help gauge market-implied policy expectations more accurately. However, the caveats discussed above should be kept in mind when interpreting results from this model, and the Board's research staff will continue to assess the performance of this and other existing models.
Appendix: Model Specification and Parameter Estimates
The state variables are assumed to follow $$dX_t=\left(K_0+K_1X_t\right)dt+\Sigma dB_t$$. The short rate is given by $$r_t={\rm max}\{\rho_0+\rho_1\cdot X_t,r_{{\rm min}}\}$$. After normalizing $$K^{{\mathbb P}}_0$$, $$(K^{{\mathbb P}}_1-K^{{\mathbb Q}}_1)$$, and $$\Sigma $$ for identification, the estimated parameters are as follows: $$$${\hat{\rho}}_0=0.0473$$$$ $$$${\hat{\rho}}_1=\left( \begin{array}{c} 0.0481 \\ 0.6473 \\ 0.0959 \end{array} \right)$$$$ $$$${\hat{r}}_{{\rm min}}=0.0014$$$$ $$$$K^{{\mathbb P}}_0=\left( \begin{array}{c} 0 \\ 0 \\ 0 \end{array} \right)$$$$ $$$${\hat{K}}^{{\mathbb P}}_1=\left( \begin{array}{rrr} -1.2579 & -0.0591 & 0.5297 \\ 3.1345 & -0.6122 & -0.7806 \\ -0.3256 & 0.1250 & -0.1637 \end{array} \right)$$$$ $$$${\hat{K}}^{{\mathbb Q}}_0=\left( \begin{array}{r} 0.0005 \\ -0.0019 \\ 0.0023 \end{array} \right)$$$$ $$$${\hat{K}}^{{\mathbb Q}}_1=\left( \begin{array}{rrr} -0.6142 & -0.0591 & 0.5297 \\ 3.6219 & -0.7557 & -0.7806 \\ 0.8199 & 0.0391 & -0.7294 \end{array} \right)$$$$ $$$$\Sigma =\left( \begin{array}{rrr} 0.01 & 0 & 0 \\ 0 & 0.01 & 0 \\ 0 & 0 & 0.01 \end{array} \right)$$$$
1. I thank Min Wei, Don Kim, and Michiel De Pooter for very helpful comments and discussions. Return to text
2. Additionally, forward rates differ from expected future short rates under the risk-neutral measure by a convexity term. This term is typically negligible for short maturities. Return to text
3. See Longstaff, Francis A. (2000), "The Term Structure of Very Short-Term Rates: New Evidence for the Expectations Hypothesis," Journal of Financial Economics, 58(3), pp. 397–415. Return to text
4. See Kim, Don H., and Tanaka, Hiroatsu (2016), "Front-end Term Premiums in Federal Funds Futures Rates and Implied Probabilities of Future Rate Hikes," FEDS Notes, Washington: Board of Governors of the Federal Reserve System, November 18, 2016, https://doi.org/10.17016/2380-7172.1884. Return to text
5. Historical OIS rates are sourced from J. P. Morgan until 2002, and Bloomberg from 2002 onwards. I bootstrap zero-coupon rates from the raw OIS quotes. OIS contracts are traded over the counter and low liquidity is a potential concern, especially early in the sample. The estimation procedure therefore accommodates observation error on all quotes, as described below.
Wolters Kluwer Blue Chip Financial Forecasts are under copyright by CCH Incorporated and used under license. To account for the lag between survey collection and survey publication, I match up the Blue Chip Financial Forecasts surveys published at the beginning of a given month with rates from a week earlier. Return to text
6. Kim, Don H., and Wright, Jonathan H. (2005), "An Arbitrage-Free Three-Factor Term Structure Model and the Recent Behavior of Long-Term Yields and Distant-Horizon Forward Rates," FEDS Working Paper 2005-33, Washington: Board of Governors of the Federal Reserve System. Return to text
7. The Gaussian assumption may be less consequential for modeling longer-term yields and term premiums, as long as rates are expected to converge back toward a long-term mean that is sufficiently above zero. Return to text
8. See Kim, Don H., and Singleton, Kenneth J. (2012), "Term Structure Models and the Zero Bound: An Empirical Investigation of Japanese Yields," Journal of Econometrics, 170(1), pp. 32–49. Return to text
9. Priebsch, Marcel A. (2013), "Computing Arbitrage-Free Yields in Multi-Factor Gaussian Shadow-Rate Term Structure Models," FEDS Working Paper 2013-63, Washington: Board of Governors of the Federal Reserve System. Return to text
10. For each type of variable, the magnitude of the fitting errors is assumed to be constant across maturities/horizons. Return to text
11. The black line and the crosses represent the same theoretical object--the OIS forward rate, which is approximately the expected short rate with no term premium adjustment--but the spline curve has substantially more free parameters and is fitted to a denser set of OIS maturities. The black line thus shows how well the model matches the observed forward rate data. Return to text
12. This assumption was reportedly used as a rule of thumb by Board staff at one time, see Piazzesi, Monika, and Swanson, Eric T. (2008), "Futures Prices as Risk-Adjusted Forecasts of Monetary Policy," Journal of Monetary Economics, 55, pp. 677– 691. Return to text
Priebsch, Marcel A. (2017). "A Shadow Rate Model of Intermediate-Term Policy Rate Expectations," FEDS Notes. Washington: Board of Governors of the Federal Reserve System, October 4, 2017, https://doi.org/10.17016/2380-7172.2056.
Disclaimer: FEDS Notes are articles in which Board staff offer their own views and present analysis on a range of topics in economics and finance. These articles are shorter and less technically oriented than FEDS Working Papers and IFDP papers.