FEDS Notes
March 01, 2018
Some Characteristics of the Decline in Manufacturing Capacity Utilization
Justin Pierce and Emily Wisniewski
Background
Capacity utilization, defined as the ratio of actual production to maximum sustainable production, has long been viewed as an important measure of slack in the economy, and the Federal Reserve Board has published capacity utilization rates for the manufacturing sector since the 1960s. The G.17 Statistical Release on Industrial Production and Capacity Utilization reports that manufacturing capacity utilization was 76.4 percent in December 2017, indicating that more than eight years into the current expansion, capacity utilization remains 2 percentage points below its long-run (1972–2016) average. This paltry recovery in operating rates continues a decades-long downward trend in which capacity utilization has rarely re-attained its previous peak following a recession (Figure 1).
The resulting downward trend in manufacturing capacity utilization raises several important questions. Does the overall manufacturing capacity utilization rate overstate the level of slack due to changes in output among industries within the sector? Are utilization rates suppressed by labor shortages, skill mismatch, or changes in the use of labor? Are the declines concentrated in a small group of industries or widespread? Are the declining utilization rates observed in the aggregate also occurring within long-lived establishments?
In this note, we provide several observations regarding trends in manufacturing capacity utilization rates using data from the Federal Reserve Board and the Census Bureau. The note does not aim to consider all potential explanations for the decline in utilization rates, and indeed we do not find a single root cause of the decline. We do, however, attempt to narrow the scope of potential explanations and contribute contemporary data to the existing commentary.
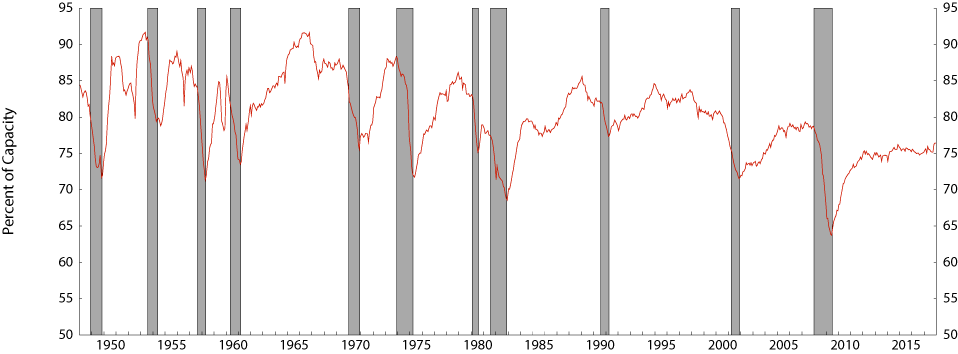
Note: Shaded bars indicate periods of business recession as defined by the National Bureau of Economic Research (NBER): November 1948-October 1949, July 1953-May 1954, August 1957-April 1958, April 1960-February 1961, December 1969-November 1970, November 1973-March 1975, January 1980-July 1980, July 1981-November 1982, July 1990-March 1991, March 2001-November 2001, and December 2007-June 2009.
Source: Federal Reserve Board, G.17 Statistical Release on Industrial Production and Capacity Utilization.
Features of the Decline in Manufacturing Capacity Utilization Rates
- The decline in capacity utilization is not the result of shifts in industry weighting.
The Federal Reserve's capacity utilization aggregates are produced by weighting the component industries by their contemporaneous value added. As a result, changes in the utilization rate for the overall manufacturing sector over time reflect not only changes in utilization rates within industries, but also changes in the value added by each industry.
In fact, capacity utilization rates differ substantially across manufacturing industries, with average rates at continuous processors like petroleum refineries and paper mills being substantially higher than those at assembly operations in which inputs and outputs can be adjusted more easily (Corrado and Mattey 1997). As a result, the observed decline in the aggregate manufacturing utilization rate could, in principle, reflect a shift in value-added toward industries with low long-run utilization rates and away from industries with high long-run utilization rates, even if the utilization rates for each industry remained unchanged.
We examine the role of changes in value added on industry weighting by recalculating the aggregate manufacturing utilization rate holding each industry's value added weight fixed at its 1972 level. Figure 2 plots this alternative utilization rate along with the published utilization rate that is based on time-varying weights. As indicated in the figure, the fixed-weight manufacturing utilization rate is nearly identical to that based on time-varying weights, and exhibits the same visible downward trend. Given the similarity between these two series, we conclude that shifts in weighting among industries with different steady-state capacity utilization rates do not account for the decline in manufacturing utilization rates.
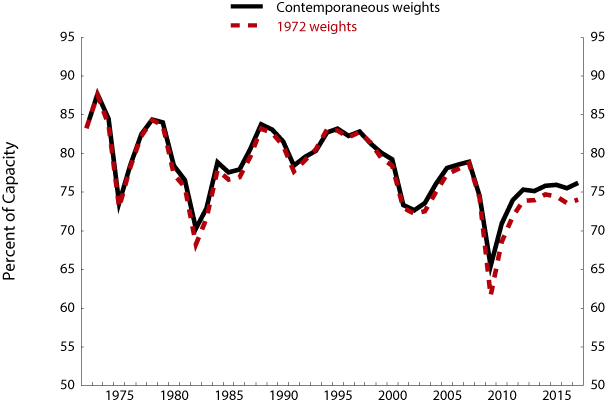
Source: Federal Reserve Board, G.17 Statistical Release on Industrial Production and Capacity Utilization.
- One indicator of labor shortages is near its pre-Recession level.
The Federal Reserve's measures of capacity are intended to capture the concept of maximum sustainable production, which is the greatest amount of output that can be produced assuming a realistic work schedule, normal downtime, and, importantly, a sufficient supply of inputs, including labor. Utilization rates could, therefore, be suppressed if output is constrained by an insufficient supply of appropriate labor and material.
To document the extent of labor shortages in the manufacturing sector, we update Stahl and Morin's (2013) analysis of responses to the Census Bureau's Quarterly Survey of Plant Capacity (QSPC). The QSPC, and the annual Survey of Plant Capacity (SPC) that preceded it, ask respondents to select reasons for operating below full production capacity from a set of options. The most commonly cited reason for operating below capacity, by far, remains, "insufficient orders/demand." As shown in the left panel of Figure 3, this response was cited by over 75 percent of respondents in the third quarter of 2017 as being a reason for operating below capacity (compared with being cited by nearly 90 percent of respondents during the most recent recession).
The second-most commonly cited response, however, is an "insufficient supply of local labor force/skills." Moreover, as shown in the right panel of Figure 3, the share of respondents citing an insufficient supply of local labor has grown throughout the recovery from the most recent recession and is now at roughly its pre-recession level. It is possible, therefore, that current utilization rates may be suppressed, to some extent, by labor shortages, though quantifying the magnitude of the effect is difficult. Furthermore, it is important to note that a higher share of respondents reported labor shortages in the late 1990s, indicating that they are unlikely to be the sole driver of the downward trend in utilization rates.

Notes: Gaps in series represent the ending of the annual Survey of Plant Capacity in 2006 and the start of the Quarterly Survey of Plant Capacity in 2007.
Source: U.S. Census Bureau, Survey of Plant Capacity and Quarterly Survey of Plant Capacity.
- Long-term declines in utilization rates are widespread, but magnitudes vary substantially.
Changes in the overall manufacturing capacity utilization rate mask substantial variation among individual manufacturing industries. To document this variation, we use data from the G.17 Statistical Release to examine long-term trends in utilization rates at the most disaggregated industry level.
We begin by estimating linear trend terms for 64 individual manufacturing industries over the period from 1972 to 2016. The estimated trends indicate that declines in utilization rates are widespread across U.S. manufacturing industries, with 86 percent of industries exhibiting a downward trend over the period. Figure 4 divides manufacturing industries into quartiles based on the estimated trend coefficient and plots the annual average utilization rate among the industries in each quartile.
As shown in the figure, declines for industries in the first quartile (the blue line) are particularly steep, but they are not confined to this group. Rates for industries in the second and third quartiles also exhibit substantial declines, and even industries in the top quartile end the period with utilization rates little changed from the beginning of the period. In sum, the figure illustrates that while a subset of industries have experienced particularly steep declines, capacity utilization is trending downward for most industries in the manufacturing sector.
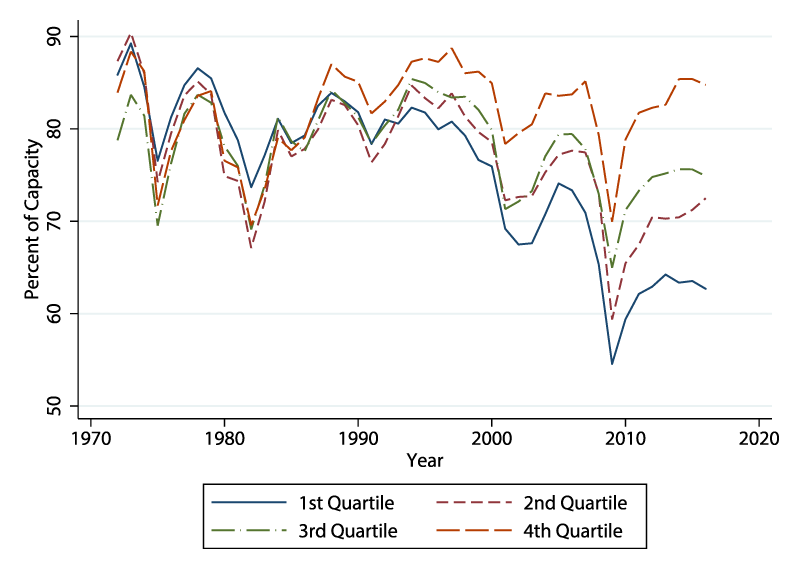
Source: Federal Reserve Board, G.17 Statistical Release on Industrial Production and Capacity Utilization.
- Capacity utilization declines are present within continuing establishments
Another important question for assessing potential causes of the decline in capacity utilization is whether it occurs within continuing establishments or it is observable in differences in utilization rates among entering and exiting establishments. For example, understanding whether changes in utilization rates occur across or between plants may help explain whether changes in utilization rates are due to changes in production technology (Bansak, Morin and Starr 2007), changes in supply chain management, or other causes. Moreover, examining changes in utilization rates within continuing establishments provides one type of check on the accuracy of published capacity utilization statistics.
As a first step toward examining this question, we calculate utilization rates for the set of establishments that appear in every year of the SPC from 1979 to 1999, which we refer to as "continuous reporters."1 These establishments are a selected sample, and thus not representative of the manufacturing sector as a whole. In addition to being particularly long-lived, they are large, with fewer than 300 continuous reporters accounting for approximately 6 percent of the manufacturing sector based on SPC sample weights.2 Nonetheless, because we can observe the continuous reporters over a long period of time, they provide a novel look at how capacity utilization has evolved within establishments. Figure 5 reports weighted average utilization rates for the continuous reporters, along with the published capacity utilization rate for the overall manufacturing sector, for comparison.
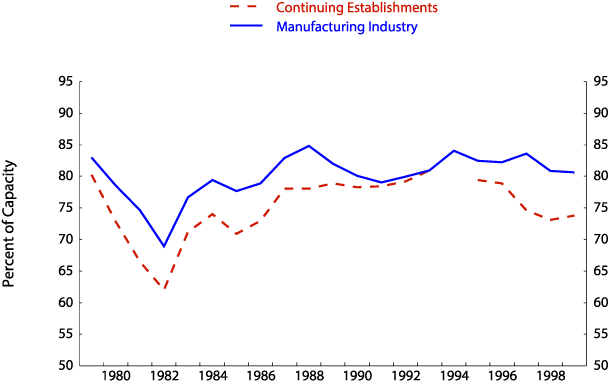
Notes: Data for 1994 are excluded due to different data reporting practices in that year.
Source: U.S. Census Bureau, Survey of Plant Capacity2.
As indicated in the figure, although the level of the utilization rate for continuous reporters is lower than the overall rate, it tracks the aggregate rate fairly closely over time. Furthermore, while the downward trend is less apparent in both series over the period examined, both the continuous reporters and the overall sector end the period at utilization rates below the level at which they started, with the decline for continuous reporters (roughly six percentage points) being slightly larger than that for the overall sector. Overall, the figure illustrates that declines in capacity utilization are occurring within continuing establishments and are not solely the result of entry and exit. Moreover, while continuous reporters account for a relatively small share of the manufacturing sector, the figure provides some reassurance that published declines in utilization rates do not solely reflect changes in sampling methodology or related measurement concerns.
Conclusion
This note documents several features of the decline in manufacturing capacity utilization observed over the past several decades. First, we find that changes in industry weighting driven by shifts in value added across industries do not explain the decline in published rates. Second, we show that labor shortages, as reported in the QSPC, have risen throughout the recovery and are near pre-recession levels, presenting a potential impediment to operating at full capacity. Third, although declines in capacity utilization are indeed widespread, we show that certain industries have experienced particularly dramatic declines. Finally, by showing that utilization rates for continuing establishments have generally mirrored overall rates for the manufacturing sector, we find that changes in utilization rates are occurring within existing plants and are not due solely to entry and exit.
References
Bansak, Cynthia, Norman Morin and Martha Starr. 2007. "Technology, Capital Spending, and Capacity Utilization." Economic Inquiry 45 (3): 631-645.
Corrado, Carol and Joe Mattey. 1997. "Capacity Utilization." Journal of Economic Perspectives 11(1): 151-167.
Morin, Norman and Jessica Stahl. 2013. "Looking for Shortages of Skilled Labor in the Manufacturing Sector." FEDS Notes. Board of Governors of the Federal Reserve System.
1. This time period is chosen because it is long enough to cover a period of notable decline in the overall manufacturing utilization rate, because it avoids sample changes from the SPC to the QSPC, and because it begins and ends at roughly similar points in the business cycle. Continuers are active in all years from 1979 to 1999, but individual establishments may not appear in all years of the sample if one or more variables are missing. Return to text
2. Any opinions and conclusions expressed herein are those of the authors and do not necessarily represent the views of the U.S. Census Bureau. All results have been reviewed to ensure that no confidential information is disclosed. Return to text
Pierce, Justin, and Emily Wisniewski (2018). "Some Characteristics of the Decline in Manufacturing Capacity Utilization," FEDS Notes. Washington: Board of Governors of the Federal Reserve System, March 1, 2018, https://doi.org/10.17016/2380-7172.2162.
Disclaimer: FEDS Notes are articles in which Board staff offer their own views and present analysis on a range of topics in economics and finance. These articles are shorter and less technically oriented than FEDS Working Papers and IFDP papers.