FEDS Notes
July 10, 2017
Trading Activities at Systemically Important Banks, Part 3: What Drives Trading Performance?
Diana Iercosan, Ashish Kumbhat, Michael Ng, and Jason Wu 1
Executive Summary
It is well known by now that before the financial crisis, systemically important banks and nonbank broker-dealers maintained large proprietary trading operations and had relied on those operations as a key source of trading revenue, in addition to revenue generated by facilitating clients' trading needs. As shown in figure 1, as a result of employing such a strategy, these entities suffered large trading losses during the crisis. In turn, these losses exacerbated financial instability and prompted, at least in part, the creation of the Volcker rule.
This note aims to identify the key drivers of the trading performance of systemically important banks in the post-crisis period. By applying a simple regression framework to confidential trading data collected daily by on-site supervisors, we find that across a number of asset classes, the average systemically important bank's trading performance--proxied by trading revenue that we adjusted using value-at-risk (VaR) estimates--was driven more by indicators of client facilitation or market making, such as bid-ask spreads or trading volumes, than by changes in asset prices. When combined with the finding that trading performance has generally trended up over the past six years--as discussed in a companion FEDS Notes article, "Trading Activities at Systemically Important Banks, Part 1: Recent Trends in Trading Performance"--it becomes apparent that banks have relied on client facilitation as a means of improving trading performance.
To the best of our knowledge, this note is the first attempt to use relatively high-frequency trading revenue data to systematically identify the drivers of trading performance across asset classes. As with other novel studies, ours is subject to several limitations. First, the indicators of client facilitation may not exhaustively or exclusively capture the extent of such activities. Second, our framework focuses on the average trading performance across banks; the results in this note do not necessarily apply to any specific bank, and the drivers of trading performance at a given bank could be quite different from those of the average bank.2 Finally, we explore the contemporaneous effects of the drivers like volumes and asset prices on trading performance; we do not study the dynamic effects of trading performance on these drivers, as a richer framework would be needed for that.
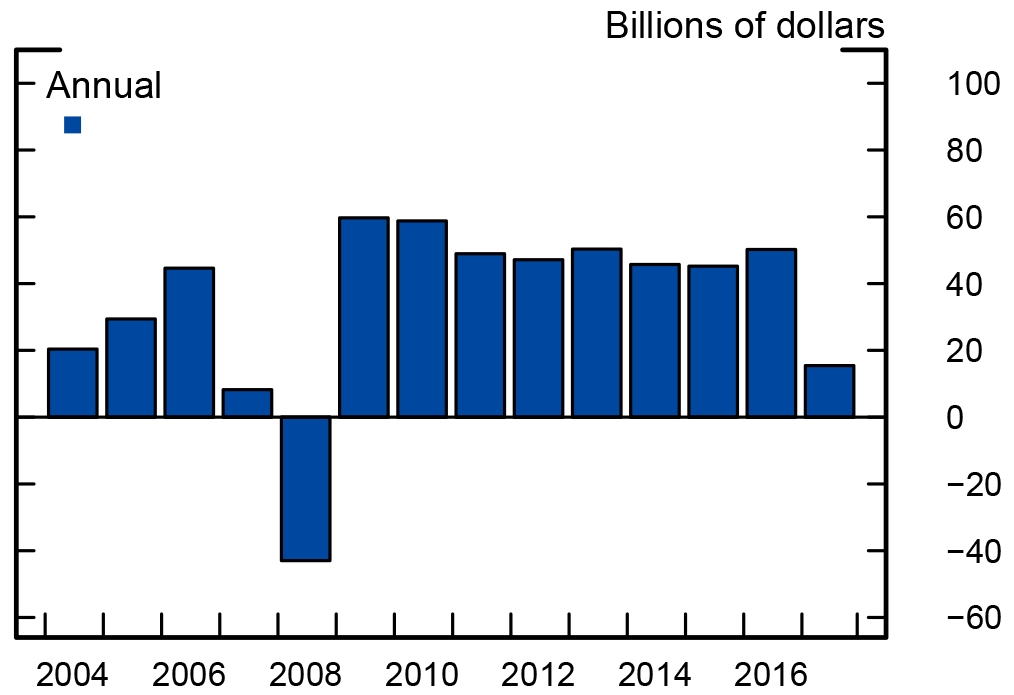
Note: Aggregate total trading revenue for the six largest domestic banks by assets: Bank of America, Citigroup, Goldman Sachs, J.P. Morgan Chase, Morgan Stanley, and Wells Fargo. Pre-crisis trading revenue for Bear Stearns, Merrill Lynch and Wachovia, which were acquired by J.P. Morgan Chase, Bank of America and Wells Fargo, are not included. Trading revenue data prior to 2009 for Goldman Sachs and Morgan Stanley were obtained from 10-K filings.
Source: Federal Reserve Board, Form FR Y-9C; SEC Form 10-K; Federal Reserve Board staff
Background on trading revenue and supervisory data
Trading revenue could originate from two sources: (1) facilitation revenue, or revenue captured by a bank through bid-asked spreads, fees, and commissions on securities and derivatives transactions; or (2) inventory revenue, which arises from changes in the marked-to-market values of securities and derivatives positions on the bank's trading book as well as from accrued interest, realized coupon payments, and dividends of these positions.3 The former is typically cast as rewards to banks for providing market liquidity, while the latter is often, but not always, associated with proprietary trading.4
We use confidential supervisory data on trading revenue and one-day-ahead VaR for four major asset classes (credit, equities, foreign exchange, and rates) from 2010 to 2016 for 13 systemically important domestic bank holding companies and foreign banking entities.5 The data on trading revenue capture both facilitation and inventory revenue, and the VaR is calculated based on the trading positions of each bank-asset class. Trading revenue data generally do not incorporate adjustments made to reflect funding, hedging, and other costs. Data for foreign banks encompass their trading activities in the United States but not globally.6 The FEDS Notes article "Trading Activities at Systemically Important Banks, Part 1: Recent Trends in Trading Performance" contains a detailed description of the data.
For the rest of this note, we proxy trading performance using VaR-adjusted trading revenue, defined as the ratio of trading revenue to the lagged one-day-ahead VaR. This ratio has the interpretation of the amount of trading revenue generated by each dollar of market risk committed, and it is a useful metric for aggregating and comparing trading performance across banks and asset classes. It is not the same as standard profitability measures such as return on equity, however, and in this note, we do not aim to delineate the drivers of profitability.7
Methodology
The framework we use is parsimonious. At a weekly frequency, for each of the four asset classes, VaR-adjusted trading revenue for the average bank is regressed on secondary-market trading volumes, primary market issuance, bid-ask spreads, and asset price changes that are relevant and available. Data from 2010 to 2016 are used. Variables that are available at the daily frequency, such as VaR-adjusted trading revenue and asset price changes, are averaged within each week to obtain weekly observations. Each regressor enters the regression normalized by its own sample standard deviation. The statistical significance of regression coefficients is determined using Newey and West standard errors.
All else being equal, we expect that higher levels of volumes improve trading performance, as that indicates more trading activity from clients; higher levels of issuance improve trading performance by boosting the supply of tradable assets; and higher levels of bid-ask spreads improve trading performance, as banks can charge more for providing market liquidity. The effects of changes in asset prices, however, depend on how the average bank is positioned--that is, whether its trading portfolio would benefit from rallies, selloffs, or neither if it has neutral positions. A maintained assumption in this framework is that the trading performance of the average bank reacts contemporaneously to indicators of facilitation activities (volumes, issuance, and bid-ask spreads) and marked-to-market profits or losses (asset price changes); any reverse effects would manifest only over time.8 Analyzing the dynamic effects of trading performance on facilitation activities or asset prices is not within the scope of this note.
Summary statistics of the regressors and the VaR-adjusted trading revenue for the average bank are displayed in table 1. Most regressors used are standard, although there are some noteworthy ones in each asset class. For credit, bid-ask spreads of corporate bonds are based on realized round-trip transaction costs, as in Green, Hollifield, and Schürhoff (2007), and the implied volatility on the CDX IG index is based on the prices of at-the-money credit default swaptions. For equities, bid-ask spreads are based on the value-weighted bid-ask spread (ask price minus bid price, divided by mid-price) across the firms in the S&P 1500. For foreign exchange, because of the dispersion in the types of currencies and marketplaces, volumes and bid-ask spreads are difficult to obtain at the weekly frequency. As a proxy for the levels of facilitation activities, we use the aggregate open interests in listed currency futures and options on futures, while bid-ask spreads on the euro/dollar front-month futures contract, calculated in the same way as those on the S&P 1500, proxy the rewards for providing liquidity. For rates, Treasury trading volume is obtained by aggregating the transaction volumes across the primary dealers of the Federal Reserve, a group that intermediates the vast majority of Treasury trades in both the primary and secondary markets, while daily interest rate derivatives trading volume covers all dollar-denominated over-the-counter and listed derivatives. The inclusion of the latter constrains the sample used in the rates regressions to four years (from 2013 to 2016).
Table 1: Summary statistics of weekly observations of regression variables
| Unit | Source | Mean | S.D. | Min. | Max. | |
|---|---|---|---|---|---|---|
| Panel A: Credit | ||||||
| VaR-adjusted credit trading revenue | Ratio | FRBNY | 0.25 | 0.17 | -0.22 | 0.98 |
| Corporate bond secondary-market trading volume | Billions of dollars | TRACE | 15.37 | 3.02 | 7.15 | 24.2 |
| Nonfinancial corporate bond issuance | Billions of dollars | FISD | 3 | 2.04 | 0.04 | 14.73 |
| Par-weighted investment-grade realized bid-ask spread | Percent of par | TRACE | 0.99 | 0.24 | 0.59 | 1.73 |
| Par-weighted speculative-grade realized bid-ask spread | Percent of par | TRACE | 1.38 | 0.2 | 0.99 | 2.36 |
| Change in CDX IG spread | Basis points | Markit | -0.1 | 5.32 | -20.43 | 27.12 |
| Change in CDX HY spread | Basis points | Markit | -0.77 | 29.69 | -117.67 | 135.12 |
| Change in 3-month-ahead CDX IG implied volatility | Percentage points | JPMM | -0.07 | 2.74 | -15.65 | 20.4 |
| Panel B: Equities | ||||||
| VaR-adjusted equities trading revenue | Ratio | FRBNY | 0.64 | 0.29 | -0.04 | 1.43 |
| NYSE trading volume | Billions of shares | NYSE | 3.78 | 0.79 | 2.03 | 7.81 |
| Nonfinancial initial public offering | Billions of dollars | SDC | 0.09 | 0.14 | 0 | 1.37 |
| Nonfinancial secondary equity offering | Billions of dollars | SDC | 0.23 | 0.27 | 0 | 3.71 |
| Value-weighted S 1500 bid-ask spread | Percent of mid-price | Tick | 0.02 | 0 | 0.01 | 0.03 |
| Change in the natural logarithm of S 500 index | Percent | Bloomberg | 0.04 | 0.43 | -1.72 | 1.6 |
| Change in the VIX | Percentage points | Bloomberg | -0.03 | 2.33 | -8.09 | 14 |
| Panel C: Foreign exchange | ||||||
| VaR-adjusted foreign exchange trading revenue | Ratio | FRBNY | 0.25 | 0.16 | -0.14 | 0.97 |
| Open interests in futures on advanced-economy currencies | Millions of contracts | CFTC | 0.82 | 0.19 | 0.41 | 1.27 |
| Open interests in futures on emerging market currencies | Millions of contracts | CFTC | 0.24 | 0.05 | 0.13 | 0.42 |
| Euro/dollar front-month futures bid-ask spread | Percent of mid-price | Tick | 0.01 | 0 | 0.01 | 0.01 |
| Change in the natural logarithm of yen per dollar | Percent | Bloomberg | 0.01 | 0.3 | -1.18 | 1.03 |
| Change in the natural logarithm of euros per dollar | Percent | Bloomberg | 0.02 | 0.29 | -0.66 | 0.9 |
| Change in the natural logarithm of EME index | Percent | Bloomberg | 0.01 | 0.13 | -0.4 | 0.57 |
| Change in the currency VIX | Percentage points | Bloomberg | -0.02 | 0.46 | -1.47 | 1.67 |
| Panel D: Rates | ||||||
| VaR-adjusted rates trading revenue | Ratio | FRBNY | 0.34 | 0.17 | -0.21 | 1.05 |
| Treasury securities trading volume by primary dealers | Billions of dollars | FR 2004 | 512.72 | 88.19 | 275.45 | 939.26 |
| Interest rate derivatives trading volume by gross notional | Billions of dollars | ISDA | 324.78 | 147.2 | 60.65 | 843.71 |
| On-the-run 10-year Treasury yield bid-ask spread | Percent of par | BrokerTec | 0.02 | 0 | 0.02 | 0.07 |
| Change in on-the-run 10-year Treasury yield | Basis points | Bloomberg | -0.09 | 2.46 | -9.4 | 9.53 |
| Change in the MOVE index | Basis points | Bloomberg | -0.13 | 5.26 | -16.32 | 22.08 |
Note: Sample period is from 2010 to 2016. Weekly observations for all VaR-adjusted trading revenues and all bid-ask spreads are obtained by averaging daily observations within each week. Similarly, weekly observations for all “Change” variables (credit spreads, CDX IG implied volatility, S&P 500 index, VIX, foreign exchange rates, currency VIX, 10-year Treasury yield, and MOVE index) are obtained by averaging one-day changes within each week. EME is emerging market economy.
Source: Here and in subsequent tables and figures, Bloomberg LLP; BrokerTec; Commodity Futures Trading Commission (CFTC); Federal Reserve Bank of New York (FRBNY); Federal Reserve Board Government Securities Dealers Reports (FR 2004); FINRA Trade Reporting and Compliance Engine (TRACE); IHS Markit (Markit); ISDA SwapsInfo (ISDA); J.P. Morgan Markets (JPMM); Mergent Fixed Income Securities Database (FISD); New York Stock Exchange (NYSE); Thomson Reuters Securities Data Company (SDC); Thomson Reuters Tick History (Tick).
Results and Discussion
It is important to note that although facilitation and inventory revenue are conceptually distinct, they are not always separable in practice for banks that make markets.9 Therefore, the regression results in this section should not be interpreted as having fully delineated these two sources of revenue; rather, we aim to provide some novel results on the drivers of trading performance that are related to each of the two sources.
Credit and equities
Table 2 summarizes the regression results for credit and equities trading, which help intermediate companies that need access to capital markets and investors that want exposures to specific sectors or firms. As can be seen in column (1) of panel A, both higher corporate bond secondary-market trading volumes and higher corporate bond issuance improve the credit trading performance of the average bank--an increase of one standard deviation in volumes and in issuance improves credit trading revenue by 2.2 cents and 1.3 cents for each dollar of VaR committed, respectively. These amounts are economically significant because, on average, 25 cents of trading revenue is generated by each dollar of VaR committed. An increase in investment-grade bid-ask spreads does not significantly affect trading performance, while the widening in speculative-grade bid-ask spreads hurts trading performance, perhaps because the widening of spreads is often accompanied by a reduction in speculative-grade trading volume, which is not separately captured in the regressions. Issuance also supports equities trading performance--as summarized in column (1) of panel B, an increase of one standard deviation in issuance from initial public offerings and in issuance from secondary equity offerings (SEOs) improves equities trading revenue by 6.3 cents and 3.2 cents for each dollar of VaR committed, respectively. Higher bid-ask spreads in stocks also support equities trading performance. However, New York Stock Exchange trading volumes do not appear to drive trading performance.
The specifications in column (2) introduce changes in asset prices into the regressions. For both credit (panel A) and equities (panel B), coefficient estimates on indicators of facilitation activities are basically unaffected by the addition of asset prices, suggesting that these two sets of variables contain different predictive content for trading performance. For credit, changes in investment-grade spreads do not drive trading performance, while higher implied volatility hampers it; speculative-grade selloffs have some positive effects on trading performance, as an increase of one standard deviation in the change in spreads leads to an increase in credit trading revenue of 2.5 cents per dollar of VaR, suggesting that the average bank may have shorted lower-credit-quality bonds. For equities, rallies in the stock market improve trading performance--an improvement of one standard deviation in S&P returns generates 4.2 cents more trading revenue for each dollar of VaR committed. Movements in the VIX, however, do not affect trading performance.
Table 2: Drivers of VaR-adjusted trading revenue for credit and equities+
| Panel A: VaR-adjusted credit trading revenue | (1) | (2) |
|---|---|---|
| Corporate bond secondary-market trading volume | 0.022*** | 0.028*** |
| (0.007) | (0.006) | |
| Nonfinancial corporate bond issuance | 0.013** | 0.011* |
| (0.006) | (0.006) | |
| Par-weighted investment-grade realized bid-ask spread | 0.017 | 0.021* |
| (0.014) | (0.012) | |
| Par-weighted speculative-grade realized bid-ask spread | -0.020* | -0.020** |
| (0.010) | (0.010) | |
| Change in CDX IG spread | -0.007 | |
| (0.014) | ||
| Change in CDX HY spread | 0.025* | |
| (0.015) | ||
| Change in 3-month-ahead CDX IG implied volatility | -0.039*** | |
| (0.006) | ||
| VaR-adjusted equities trading revenue | 0.637*** | 0.651** |
| (0.052) | (0.047) | |
| Constant | 0.03 | -0.015 |
| (0.081) | (0.068) | |
| Number of observations | 364 | 362 |
| Adjusted R2 | 0.461 | 0.513 |
| Panel B: VaR-adjusted equities trading revenue | (1) | (2) |
|---|---|---|
| NYSE trading volume | -0.005 | -0.003 |
| (0.014) | (0.012) | |
| Nonfinancial initial public offering | 0.063*** | 0.066*** |
| (0.011) | (0.013) | |
| Nonfinancial secondary equity offering | 0.032** | 0.032** |
| (0.014) | (0.014) | |
| Value-weighted S&P 1500 bid-ask spread | 0.016** | 0.016** |
| (0.007) | (0.007) | |
| Change in the natural logarithm of S&P 500 index | 0.042*** | |
| (0.013) | ||
| Change in the VIX | 0.010 | |
| (0.013) | ||
| VaR-adjusted equities trading revenue | 0.572*** | 0.572*** |
| (0.045) | (0.044) | |
| Constant | -0.015 | -0.042 |
| (0.073) | (0.070) | |
| Number of observations | 363 | 363 |
| Adjusted R2 | 0.504 | 0.529 |
+ This note was revised on July 12, 2017 to correct a few labeling errors in Table 2 Panel B and Table 3 Panel B.
Note: For data descriptions, see the general note to table 1. Panels A and B contain regression results of VaR-adjusted trading revenue for credit and equities, respectively, on indicators of facilitation activities and changes in asset prices, which all have been normalized by sample standard deviations. Newey-West standard errors based on the bandwidth selection method of Newey and West (1994) are in parentheses. The superscripts *, **, and *** indicate that the coefficient is statistically significant at the 10 percent, 5 percent, and 1 percent levels, respectively. Sample period is from 2010 to 2016.
For both credit and equities, the small differences between the R2 of specification (1) and the R2 of specification (2) indicate that trading performance is driven more by indicators of client facilitation than by changes in asset prices. Figure 2, which shows for 2016 the contributions of statistically significant regressors to the predicted VaR-adjusted trading revenue (the colored bars) against the actual VaR-adjusted trading revenue (the black lines), supports this result.10 For credit (top panel), corporate bond trading volumes contribute significantly to predicted trading performance, while changes in credit spreads or credit implied volatility appear to play only marginal roles. For equities (bottom panel), the contribution of bid-ask spreads stands out, while SEO issuance and stock returns make small contributions.
Our findings show that trading performance does react to changes in credit and equities prices, although facilitation activities appeared to have been more important.These findings are consistent with the results in a companion FEDS Notes article--"Trading Activities at Systemically Important Banks, Part 2: What Happened during Recent Risk Events?"--which indicate that banks were generally quite resilient to large stock market declines or widening credit spreads even though trading performance tends to be somewhat weaker when such moves occur.
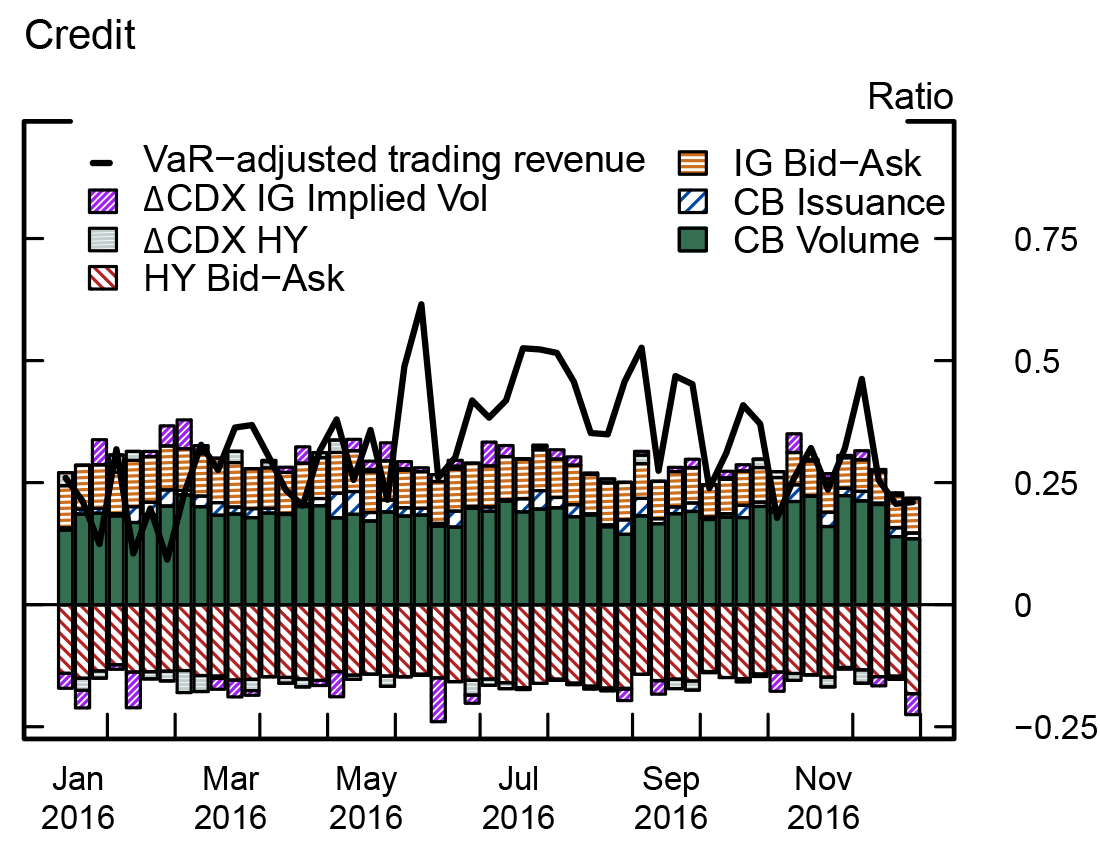
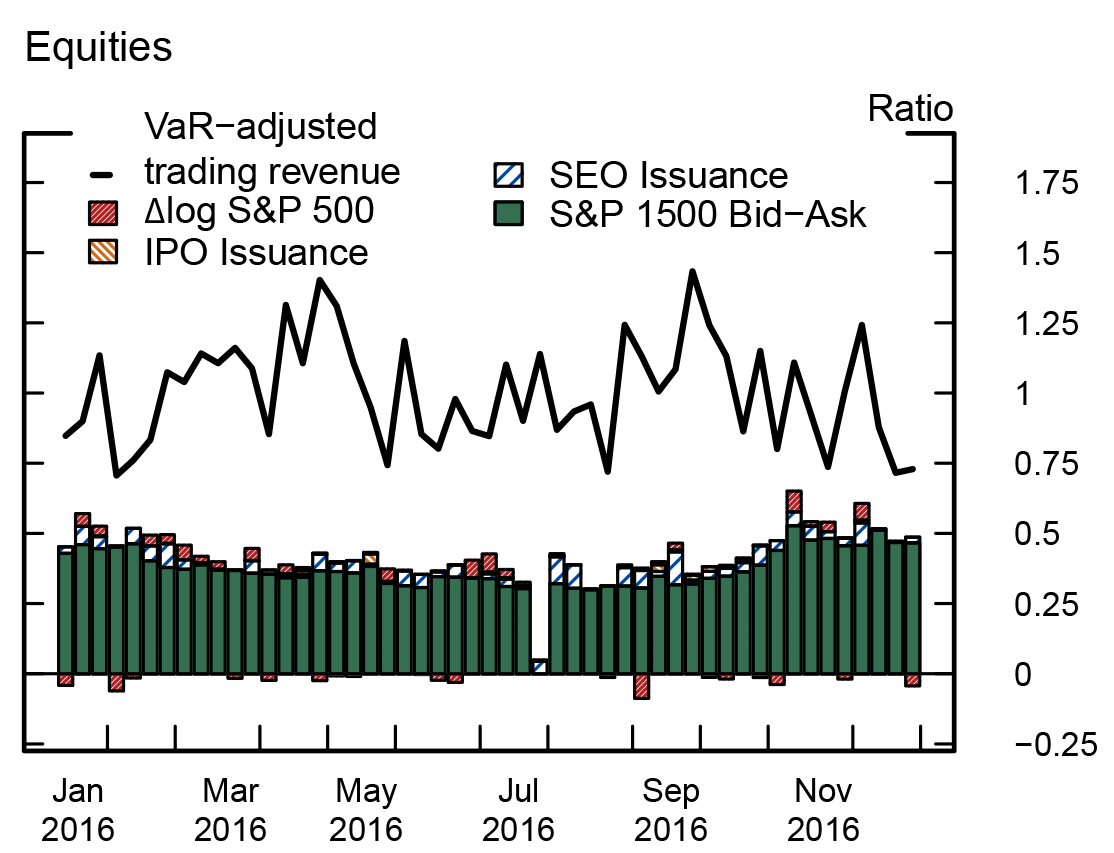
Note: For summary statistics and descriptions of the data, see table 1 and its general note. Each bar is the product of the coefficient estimate for a statistically significant regressor (see table 2) and the value of that regressor for that week. Lagged VaR-adjusted trading revenue is omitted. The black line shows the actual (realized) VaR-adjusted trading revenue. HY is high yield; IG is investment grade; CB is corporate bond; IPO is initial public offering; SEO is secondary equity offering.
Foreign exchange and rates
Table 3 documents the regression results for foreign exchange and rates, trading businesses that help clients express their views about the macroeconomic outlook or hedge currency and interest rate risks. Results for foreign exchange are in panel A, while those for rates are in panel B.
As shown in the specifications in column (1), which include only proxies of facilitation activities, an increase of one standard deviation in open interests in currency futures for advanced economies drives foreign exchange trading revenue of the average bank higher by 4.2 cents for each dollar of VaR committed, while an increase of one standard deviation in Treasury securities volumes and in interest rate derivatives volumes drives rates revenue up by 2.4 cents and 4.1 cents for each dollar of VaR, respectively. These estimates suggest that increased activities in currency and interest rate markets improve trading performance, although fluctuations in bid-ask spreads do not affect trading performance for either foreign exchange or rates, possibly because bid-ask spreads in those asset classes have been incredibly stable (see table 1 for summary statistics).
Table 3: Drivers of VaR-adjusted trading revenue for foreign exchange and rates+
| Panel A: VaR-adjusted foreign exchange trading revenue | (1) | (2) |
|---|---|---|
| Open interests in futures on advanced-economy currencies | 0.042*** | 0.037*** |
| (0.012) | (0.010) | |
| Open interests in futures on emerging market currencies | 0.006 | -0.000 |
| (0.009) | (0.007) | |
| Euro/dollar front-month futures bid-ask spread | -0.009 | -0.010 |
| (0.013) | (0.012) | |
| Change in the natural logarithm of yen per dollar | 0.062*** | |
| (0.010) | ||
| Change in the natural logarithm of euros per dollar | 0.031*** | |
| (0.012) | ||
| Change in the natural logarithm of EME index | 0.013 | |
| (0.011) | ||
| Change in the currency VIX | 0.018*** | |
| (0.009) | ||
| Lagged VaR-adjusted foreign exchange trading revenue | 0.141* | 0.106* |
| (0.077) | (0.061) | |
| Constant | 0.073 | 0.128 |
| (0.099) | (0.090) | |
| Number of observations | 300 | 300 |
| Adjusted R2 | 0.079 | 0.308 |
| Panel B: VaR-adjusted rates trading revenue | (1) | (2) |
|---|---|---|
| Treasury securities trading volume by primary dealers | 0.024* | 0.018 |
| (0.014) | (0.013) | |
| Interest rate derivatives trading volume by gross notional | 0.041*** | 0.041*** |
| (0.012) | (0.012) | |
| On-the-run 10-year Treasury yield bid-ask spread | -0.084 | -0.055 |
| (0.084) | (0.091) | |
| Change in on-the-run 10-year Treasury yield | 0.041*** | |
| (0.012) | ||
| Change in the MOVE index | 0.001 | |
| (0.010) | ||
| VaR-adjusted rates trading revenue | 0.396*** | 0.392*** |
| (0.062) | (0.063) | |
| Constant | -0.386 | -0.231 |
| (0.378) | (0.398) | |
| Number of observations | 207 | 207 |
| Adjusted R2 | 0.267 | 0.318 |
+ This note was revised on July 12, 2017 to correct a few labeling errors in Table 2 Panel B and Table 3 Panel B.
Note: For data descriptions, see the general note to table 1. Panels A and B contain regression results of VaR-adjusted trading revenue for foreign exchange and rates, respectively, on indicators of facilitation activities and changes in asset prices, which all have been normalized by sample standard deviations. Newey-West standard errors based on the bandwidth selection method of Newey and West (1994) are in parentheses. The superscripts *, **, and *** indicate that the coefficient is statistically significant at the 10 percent, 5 percent, and 1 percent levels, respectively. Sample period for the foreign exchange (rates) regressions is from 2010 to 2016 (from 2013 to 2016).
Asset price changes are added to the specifications in column (2). These additions do not have large effects on the estimated coefficients on proxies for facilitation activities. Appreciation of the dollar against the yen or the euro appears to boost foreign exchange trading performance, as do increases in currency implied volatility. But we do not know the extent to which these effects are due to banks' foreign exchange trading positions or to the possibility that dollar rallies coincide with increases in trading activities, which we are unable to capture adequately in the regressions.11 Selloffs in the Treasury market appear to boost trading performance.
Figure 3 provides evidence that stable portions of predicted VaR-adjusted trading revenue can be attributed to regressors that proxy facilitation activities, for both rates (top panel) and foreign exchange (bottom panel). That said, changes in asset prices have a significant influence on predicted trading performance.
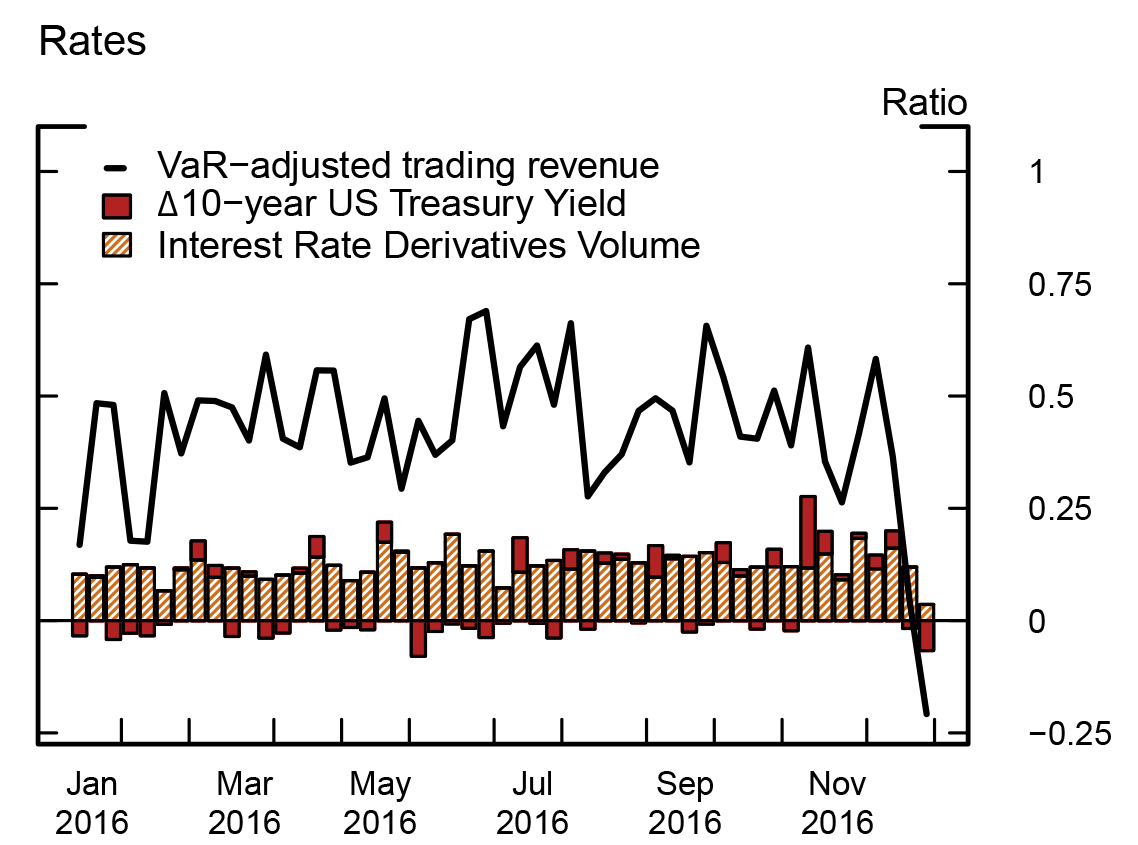
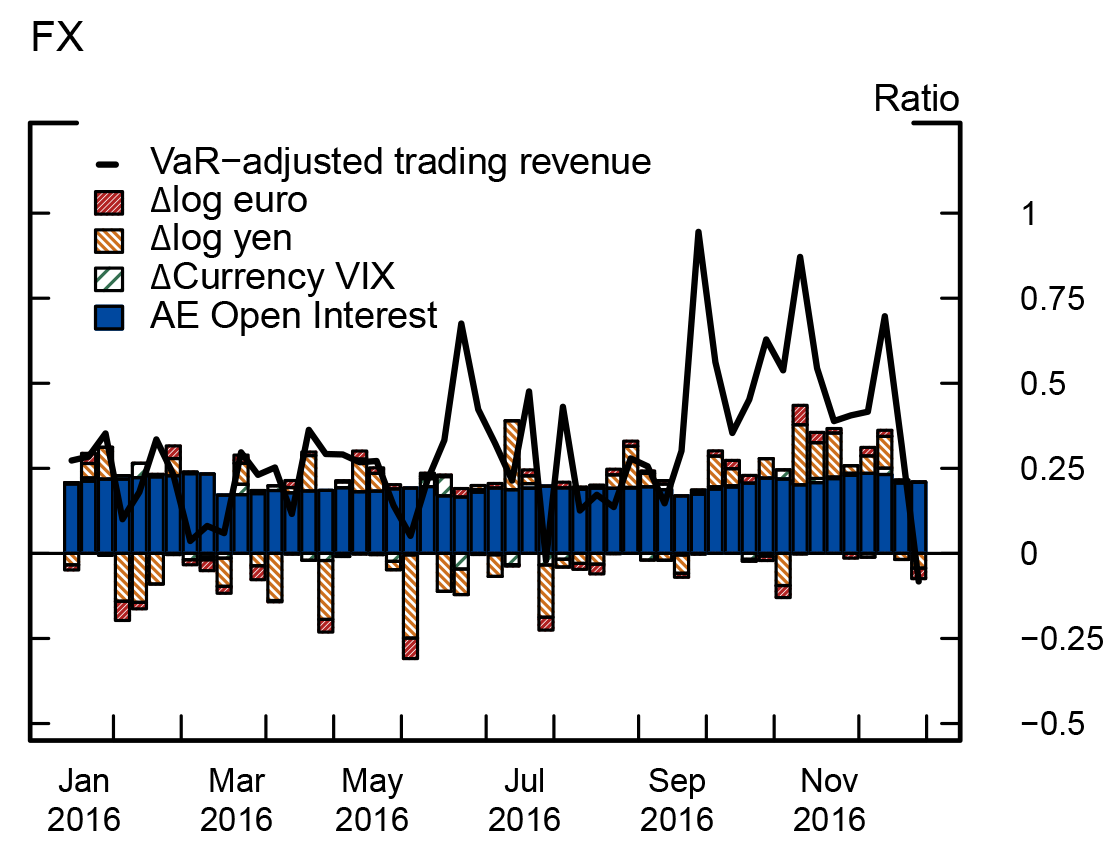
Note: For summary statistics and descriptions of the data, see table 1 and its general note. Each bar is the product of the coefficient estimate for a statistically significant regressor (see table 3) and the value of that regressor for that week. Lagged VaR-adjusted trading revenue omitted. The black line shows the actual (realized) VaR-adjusted trading revenue. See Table 1 and its notes for the sources, description and summary statistics of the data.
In sum
Using confidential supervisory data across four asset classes, we identify the key drivers of post-crisis trading performance for systematically important banks. We find that trading performance, as measured by VaR-adjusted trading revenue, is generally anchored by indicators of client facilitation and market making, such as trading volumes and bid-ask spreads, and that changes in asset prices have a smaller influence on trading performance. This finding suggests that banks have not had an overreliance on proprietary trading positions to boost trading performance during the post-crisis period, perhaps because trading operations have become more prudent given the severity of the crisis. It may also be that increased supervisory efforts and the anticipation of the Volcker rule have discouraged large-scale use of proprietary trading.
References
Committee on the Global Financial System (2014). "Market-Making and Proprietary Trading: Industry Trends, Drivers and Policy Implications," CGFS Papers 52. Basel, Switzerland: Bank for International Settlements, November, https://www.bis.org/publ/cgfs52.pdf.
Duffie, Darrell (2012). "Market Making under the Proposed Volcker Rule," Rock Center for Corporate Governance Working Paper Series 106. Stanford, Calif.: RCCG, January, https://financialreg.nd.edu/assets/153241/marketmakingundervolcker.pdf.
Green, Richard C., Burton Hollifield, and Norman Schürhoff (2007). "Dealer Intermediation and Price Behavior in the Aftermarket for New Bond Issues," Journal of Financial Economics, vol. 86 (December), pp. 643-82.
He, Zhiguo, Bryan T. Kelly, and Asaf Manela (forthcoming). "Intermediary Asset Pricing: New Evidence from Many Asset Classes," Journal of Financial Economics.
1. Iercosan and Wu are at the Federal Reserve Board. Kumbhat is a former Senior Financial Analyst at the Federal Reserve Board. He is currently a Member of the Secretariat at the G20 Financial Stability Board. Ng is a former Senior Research Assistant at the Federal Reserve Board. He is currently a Research Analyst at the Brookings Institution. The analysis and conclusions set forth are solely the responsibility of the authors and do not indicate concurrence by the Board of Governors of the Federal Reserve System, the Financial Stability Board or any of its members, or the Brookings Institution. We thank Darau Johnson, Andrew McKenna, Dan Li, Egon Zakrajšek, and the Market Risk team at the Federal Reserve Bank of New York for helpful comments, and we are grateful to David Crick for assisting with data permission and access. Return to text
2. Focusing on the average bank allows us to identify drivers of trading performance of the banking industry. The FEDS Notes article "Trading at Systemically Important Banks, Part 2: What Happened during Risk Events?" looks at the trading revenue across banks during various risk events in the post-crisis period. Return to text
3. See Committee on the Global Financial System (2014) for a more detailed discussion of sources of trading revenue. Return to text
4. Inventory could also be held for days or weeks, in anticipation of near-term trading demands from customers. Return to text
5. The commodities asset class is omitted for brevity, as it is the least significant driver of trading revenue for the average bank. Return to text
6. Not all banks' trading revenue or VaR in each asset class is captured on each day, although data for our panel of firms are reasonably balanced. On days in which a firm does not report VaR for certain asset classes, a 99 percent VaR is estimated by fitting Asymmetric Power GARCH (1,1) models to the trading revenue of those asset classes. Return to text
7. In the FEDS Notes article "Trading Activities at Systemically Important Banks, Part 1: Recent Trends in Trading Performance," we argue that return on equity is difficult to compute for the trading business from the perspective of research, especially at a high enough frequency necessary for statistical analysis. Return to text
8. That is, trading performance would affect only future asset prices. While this assumption seems to contradict the one in He, Kelly, and Manela (forthcoming) that shocks to banks' wealth help price assets in the same quarter, the work of those authors is at a much lower frequency; there is ample time for feedback effects between asset prices and bank wealth. Return to text
9. Indeed, this point has been one of the main criticisms of the Volcker rule. See, for instance, Duffie (2012). Return to text
10. For other years in our sample, the regressors have about the same contribution amounts as in 2016. For simplicity of the charts, statistically significant contributions from lagged VaR-adjusted trading revenue are omitted. Return to text
11. There is suggestive evidence that the U.S. dollar is positively correlated with trading volumes in foreign exchange markets. For example, the Bank for International Settlements (BIS) triennial survey documents that trading in foreign exchange markets increased by roughly 30 percent from 2010 to 2016 on a "net-net" U.S. dollar basis; over the same period, the broad dollar has also rallied by about 30 percent. More information about the survey results is available on the BIS website at http://www.bis.org/publ/rpfx16.htm. Return to text
Iercosan, Diana, Ashish Kumbhat, Michael Ng, and Jason Wu (2017). "Trading Activities at Systemically Important Banks, Part 3: What Drives Trading Performance?," FEDS Notes. Washington: Board of Governors of the Federal Reserve System, July 10, 2017, https://doi.org/10.17016/2380-7172.2025.
Disclaimer: FEDS Notes are articles in which Board staff offer their own views and present analysis on a range of topics in economics and finance. These articles are shorter and less technically oriented than FEDS Working Papers and IFDP papers.