FEDS Notes
February 20, 2020
Wealth concentration levels and growth: 1989-2016
Jesse Bricker and Alice Henriques Volz
I. Introduction
Although wealth concentration is broadly understood to have increased over the past decades, the question of how much it has increased and why it has increased has remained unsettled due to differences in the methodologies used to measure wealth concentration. Unlike the case of income—where administrative data have led to a revolution in income concentration measurement—there are no representative administrative wealth data. Instead, recent wealth concentration estimates are based on either household survey data from the Survey of Consumer Finances (SCF), or "capitalized" wealth data that distribute aggregate household assets in the Financial Accounts (FA) of the United States based on administrative income tax data.1 The baseline capitalized wealth concentration estimates (from Saez and Zucman, 2016) describe more growth in wealth concentration than the SCF estimates (from Bricker, Krimmel, Henriques, and Sabelhaus, 2016) beginning in the mid-2000s (Figure 1A).
Recently, though, there have been measurement innovations using both datasets. Several wealth capitalization models use assumptions that differ from the baseline model (Bricker, Hansen, and Henriques, 2018, Smith Zidar, and Zwick, 2019, Saez and Zucman, 2019); each of the updates show more muted growth in wealth concentration relative to the baseline capitalization models (figure 1B). Distributing aggregate Financial Accounts wealth using the SCF wealth distribution—as in the Distributional Financial Accounts (DFA, see Batty et al., 2019)—yields wealth concentration estimates similar to the updated capitalization models as well (figure 1B).
These most recent wealth concentration estimates show many similarities to each other over much of the 1989 to 2016 period. Each describes increasing wealth concentration, but at a slower pace than the baseline capitalization estimates, particularly in recent years, and the level of wealth concentration in each of these updates is similar to the SCF. Despite the broad agreement, though, there are still unresolved facts that are important for the future of wealth concentration research.
First, the trend in wealth concentration during and after the Financial Crisis differs in the wealth capitalization estimates and the SCF-based estimates. The capitalized wealth concentration estimates all level off post crisis, although they differ in their patterns during the crisis (Saez and Zucman, 2016 show a marked increase during the crisis; Bricker, Hansen, and Henriques, 2018 and Smith Zidar, and Zwick, 2019 show little-to-no increase during the crisis). In contrast, wealth concentration measured in the SCF increased during the subsequent economic recovery after falling slightly during the crisis; the DFA data (which uses the SCF distribution of wealth) show a similar pattern.
Second, the role of private business equity in the portfolios of wealthy households also differs across methods. In the SCF, such privately held equity is the dominant asset of wealth families' portfolios. When wealth is capitalized from income, though, financial market assets typically occupy the primary role, or share that role with business equity, in the wealthy portfolio—partially because SCF business assets are measured at market value, rather than primarily at book value as in most capitalized estimates. We confirm that private business wealth is the main component of the portfolio of wealthy households in many other U.S. and international measures of wealthy household portfolios.
II. Estimating wealth and wealth concentration
A. Measuring wealth from capitalizing income tax data.
In the United States, there are no administrative data that directly measure the cross-section of wealth at a point in time.2 There are, however, administrative income tax data that capture the cross-section of income at a point in time, and there is a long history of modeling wealth by inflating (or "capitalizing") taxable asset income by the rates of return across assets (Greenwood, 1983; Kennickell, 1999).
An innovation in the recent capitalization estimates is to distribute the aggregate household assets and debts in table B.101 of the Financial Accounts of the United States using the distribution of realized taxable income (Saez and Zucman, 2016).3 This model generates rates of return for some household assets in the Financial Accounts—such as taxable and non-taxable interest, dividends, corporate and non-corporate businesses, and some retirement plans—based on the income produced by these assets on an income tax form. The model distributes others—e.g. defined-benefit pensions and housing—according to known distributions or estimates from survey data.4
Applying the estimated asset rate of return inflates annual taxable income into an estimate of wealth. In the original capitalization estimates, all families are assumed to get the same asset-specific rate of return (see Saez and Zucman, 2016). For example, if the rate of return on interest-bearing assets is inferred to be 1 percent, then all tax filers with 1 dollar of interest income would be assumed to hold 100 dollars of interest-bearing assets. The U.S. wealth concentration estimates in the World Wealth and Income Database (WID) are also based on this assumption (Alvaredo et al, 2016).
Bricker, Hansen, and Henriques (2018) show that wealthy families tend to have higher rates of return on interest-bearing assets and incorporate heterogeneous rates of return by wealth for interest-bearing assets in a capitalization model. The model used in Smith, Zidar and Zwick (2019) incorporates this insight and also allows heterogeneous returns in private business equity—across industry and business organization—by valuing private business equity with data from Compustat (rather than from the Financial Accounts). These estimates also rely on an improved mapping between real estate taxes and housing wealth, and alternate assumptions about predicting corporate equity from dividends and capital gains.
B. Measuring wealth in the Survey of Consumer Finances
The SCF is a cross-section survey conducted triennially since 1989. The SCF oversamples households that are likely to be wealthy by predicting wealth from a sampling frame of taxable income—the same income data used in Saez and Zucman (2016), Bricker, Hansen, and Henriques (2018), and Smith, Zidar and Zwick (2019) to infer wealth.5 The SCF represents all U.S. families by combining this oversample with a nationally representative area-probability sample. SCF asset and debt data are based on self-reported values and the wealth distribution and aggregates are formed from those values (and an appropriate set of weights). In contrast, capitalization methods, in Saez and Zucman (2016) for example, start with a known stock of wealth in the Financial Accounts and use external data to estimate a wealth distribution.
Though the SCF successfully samples very wealthy families, it is prohibited from sampling the Forbes 400 per agreement with the Department of Treasury. We use a method described in Bricker, Hanson, and Volz (2019) to add the uncovered wealth of these families to the SCF wealth concentration estimates.6 We also add an estimate of defined benefit (DB) pension wealth for SCF households, which is a major component of household wealth—representing between 15 to 20 percent of the household balance sheet in the Financial Accounts B.101 data. The SCF collects detailed information about DB pension coverage across households, and we include the current accrued value of DB pensions for each SCF household covered by such a plan (as described in Sabelhaus and Volz, 2019).
Adding the Forbes wealth and DB pension wealth to the SCF allows better comparability with the wealth concept used in the capitalized wealth estimates—each of the Saez and Zucman (2016), Saez and Zucman (2019), Bricker, Hansen, and Henriques (2018), and Smith, Zidar and Zwick (2019) estimates include DB pension wealth from the Financial Accounts.7 The SCF estimates shown here, then, are different from those shown in Saez and Zucman (2019) and Smith, Zidar, and Zwick (2019), neither of which include DB pension wealth in SCF wealth concentration estimates. Because most of these DB pension assets are held outside the top 1 percent, the SCF wealth concentration estimates reported here are lower than those reported elsewhere.
The Distributional Financial Accounts (DFA) are quarterly data that align the SCF asset and liability concepts to those in the Financial Accounts table B.101.h—which remove non-profits from table B.101—and distribute aggregate Financial Accounts wealth based on the SCF wealth distribution (Batty et al 2019).
III. Wealth concentration estimates: 1989-2016
Overall, the increase in wealth concentration measured in the SCF and the original capitalized income approach (from Saez and Zucman, 2016) are similar over the whole 1989-2016 period (Figure 1A). The share of wealth held by the top 1 percent of tax units in the original capitalized income data rose 11 percentage points (red line in Figure 1A), while the share of wealth held by the top 1 percent of SCF families—augmented with estimates of DB pension wealth and Forbes 400 family wealth—rose 8 percentage points during this period (black dashed line).
Part of the more rapid growth in the capitalized estimates is due to differences in the unit of observation. As tax filing incentives have changed over time, there are more low-wealth families being split into multiple tax units (Bricker et al., 2016, Auten and Splinter, 2019). We estimate that the SCF wealth concentration estimates would have grown about 1 to 2 percentage points more if they were measured in tax units instead of families (not shown).8
However, it is also clear from Figure 1A that the two wealth concentration estimates often grow at different rates in different periods. In the 2007-2016 period of recession and economic recovery, the SCF wealth concentration measure dips before increasing, while the capitalized income estimate rises rapidly before levelling-off. However, the trend of the two estimates—that of slowly growing wealth concentration—is similar in the 1989-2004 period.
Figure 1A. Share of net worth held by the top 1 percent, Survey of Consumer Finances and Saez and Zucman (2016, and updates)
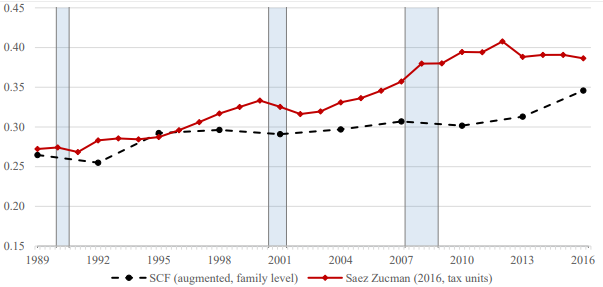
Note: blue shaded area are NBER recessions, SCF augmented to include household estimates of DB pension wealth, Forbes 400 families.
Figure 1B plots the SCF estimate and original capitalization estimate from figure 1A along with three alternate estimates that distribute aggregate household wealth from the Financial Accounts. When wealth is distributed in any of these other ways, wealth concentration levels are more comparable to the SCF over the 1989-2016 period.
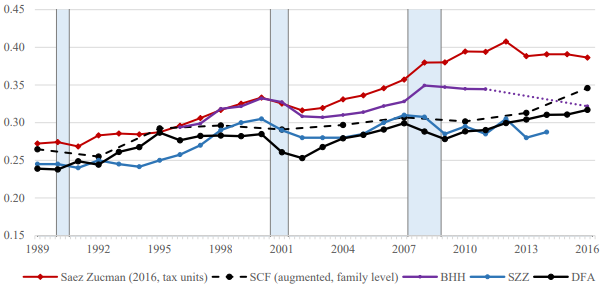
Note: blue shaded area are NBER recessions.
The Bricker, Hansen, and Henriques (BHH, 2018) estimates use the original Saez and Zucman (2016) capitalization model but allow a heterogeneous rate of return by wealth on interest-bearing assets. In practice, this means modeling the rate of return on interest assets of the wealthiest 1 percent with the 10-year Treasury yield, which is a return consistent with several outside estimates. Growth in wealth concentration in BHH is notably lower than the original capitalization estimates beginning in 2002 and there is little to no growth in wealth concentration since the current low interest rate period began in the late 2000s (purple line in figure 1B).9
Why are wealth concentration estimates in BHH lower than the baseline estimates? Wealthy asset holdings in interest-bearing assets are effectively doubled under the rate of return assumed in the original capitalization work (a 1 percent return in recent years) relative to the slightly higher rate of return estimated in BHH (2 percent) for the wealthy in recent years (Kopczuk, 2015).
The Smith, Zidar and Zwick (SZZ, 2019) estimates also use heterogeneous returns for interest assets—as in BHH—and allow heterogeneous returns on business assets and improve the mapping between real estate taxes and property values. These estimates are typically 1 to 2 percentage points lower than the BHH estimates, but are up to 5 percentage points lower in recent years.10 Much of this difference is due to using a larger rate of return—the Moody's Aaa bond yield—for wealthy interest-bearing assets. The other innovations in SZZ surrounding capital gains, dividends, business and real estate valuations account for the remaining differences.
The SZZ estimates are generally 3 to 4 percentage points lower than the baseline capitalization estimates through the late 2000s, and are up to 10 percentage points lower since then. In each of BHH, SZZ, and the baseline capitalization model in Saez and Zucman (2016), wealth concentration at the end of the sample period is about at 2007 levels.
Figure 1B also plots the estimates from the DFAs. Similar to the BHH, SZZ, and baseline capitalization estimates, the DFAs distribute the aggregate FA household wealth, though the DFAs do so according to the detailed asset and debt categories in the SCF (instead of income tax data as in the capitalization estimates). The DFA concentration estimates are typically similar to those from the SCF, and are usually lower primarily because private business equity valuations are higher in the SCF. Similar to the SCF, the DFA estimates fall during the Financial Crisis and increase in the post-crisis expansion.
In terms of levels, wealth concentration in each of SZZ, BHH, and the DFAs are similar to the SCF; the baseline capitalized estimates in Saez and Zucman (2016) are noticeably higher, though. In terms of growth, too, prior to the Financial Crisis all of the available estimates are remarkably similar, each growing about 5 percentage points—or by 20 percent of their 1989 values—from 1989 to 2006.
The trends during and after the crisis, though, differ. In each of the capitalized wealth estimates—including BHH and SZZ—wealth concentration is no higher in 2016 than in 2008. The SCF and DFA estimates, though, declined during the crisis and are growing in the post-crisis expansion. Resolving these differences is an important task for understanding the root causes in the dynamics of the distribution of wealth.
IV. Wealthy balance sheet comparisons, 1989-2016
Another difference between the set of estimates is the importance of private business wealth in the wealthy portfolio. When aggregate FA data are distributed by income—for example, Saez and Zucman (2016) or BHH—wealthy families hold mainly investment assets (those that produce dividends and interest) in a typical "rentier" fashion. In the SCF, though, privately held business is the largest component of the wealthy portfolio and the primary asset to create and maintain wealth, suggesting a different wealth accumulation processes than in the capitalized wealth data.
Privately held business assets are at least one-third of the wealthy portfolio in each year of SCF data—two to three times the share observed in the capitalized income data (figure 2).11 Equities are about one-third of the wealthy portfolio in recent years and interest-bearing assets about 15 percent. The wealthiest 1 percent of SCF families hold most (57 percent) of the publicly traded equities and private business wealth in the SCF.12 Thus, these families were well-placed to benefit from recent increases in asset valuations for these types of assets.13
Figure 2. Composition of assets of the wealthiest 1 percent in capitalized income data, by year
(Left Panel: Composition in shares, BHH; Right panel: Composition in shares, SCF)
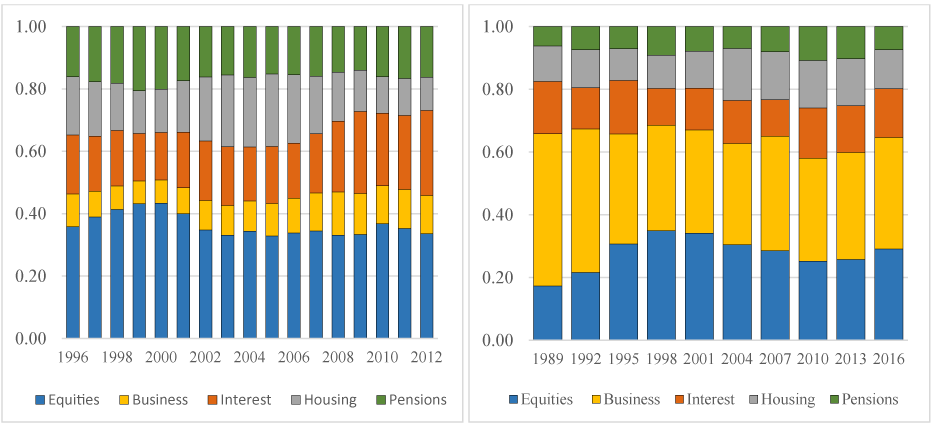
Note: key identifies bars in order from bottom to top.
The portfolio composition in BHH is also shown in figure 2 and financial assets—both interest-bearing assets (orange bars) and publicly traded equity (light blue bars)—make up the majority of assets. As in Saez and Zucman (2016), the increase in wealth concentration during and after the crisis was accompanied by a surge in interest-bearing assets in the portfolios of the wealthy (orange bars). These assets were about 15% of the balance sheet prior to the crisis but occupied more than 25% of the wealthy balance sheet in the years during and after the crisis.14 Equities are about one-third of the wealthy portfolio—a share they have occupied since the aftermath of the 2000 stock market bubble—and are similar to the SCF. Privately held business assets, though, are only about 10 percent of the portfolio.
Why does the wealthy portfolio in the SCF have a higher share in business assets than the BHH and Saez and Zucman (2016) capitalized income tax estimates? It is partly due to different valuation concepts. The SCF measure of business wealth is the market value of the business, which includes unrealized capital gains on these businesses. The business wealth definition used in BHH and Saez and Zucman (2016) uses a mixture of assets measured at cost basis (partnerships, for example), book value (for financial assets), and market value (real estate business assets, for example). The book value and a firm's cost-basis are often much lower than market value, and, thus, the aggregate SCF (market) value of household's wealth in privately-held businesses is about double that of the value found in the capitalized income estimates (which are based on the Financial Accounts).15
Figure 3. Asset portfolios, by SCF wealth percentile (Asset portfolio of the wealthiest families, by data source)
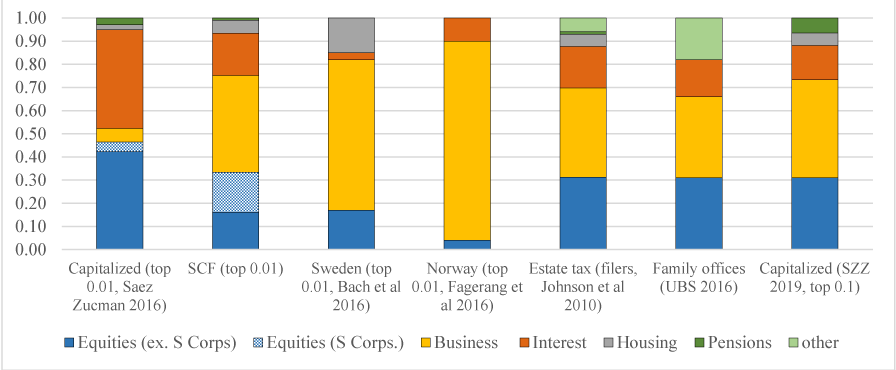
Note: key identifies bars in order from bottom to top.
For this reason, the SZZ capitalization method uses a model to estimate private business wealth using Compustat rather than mapping to the Financial Accounts aggregate. The wealthy portfolio in the SZZ estimates has a wealthy portfolio similar to the SCF (figure 3, right column).
Wealthy portfolios measured in other datasets also skew toward business assets. In figure 3, the portfolio of the wealthiest families—the top 0.01—are plotted along with the portfolio of the wealthiest 0.01 percent in Swedish and Norwegian administrative asset data (Bach, Calvet, and Sodini, 2016, and Fagereng, Guiso, Malacrino, and Pistaferri, 2016, respectively), portfolios of U.S estate tax filers (Raub, Johnson, and Newcomb, 2010), the portfolio of the average North American family office—the private managers of the assets of wealthy families (UBS/Campden Wealth, 2016) (figure 3).16
Privately held business assets (including privately held S Corporations) are more than 60 percent of the wealthy portfolio in both the SCF and the Swedish asset data, and more than 80 percent in the Norwegian data (Figure 3).17 Market based assets—interest assets or equities excluding S Corporations—are about 35 percent of assets of the wealthiest SCF families, and about 20 percent of assets in the Swedish and Norwegian asset data. In contrast, the wealthiest 0.01 percent in the baseline capitalized data (far left column) hold only about 10 percent of assets in privately held businesses and nearly 85 percent in market based assets, nearly evenly split between interest-bearing assets and publicly traded equities.
Further, private business assets are also a large part of the portfolio of the average North American family offices (UBS/Campden Wealth, 2016) and in estate tax filings (Raub, Johnson, and Newcomb, 2010). Comparedwith the SCF, such assets make up a smaller part of these portfolios (around 40 percent) as estate planning often involves divesting from these assets (Figure 3). Interest-bearing assets are about 15 to 20 percent of the asset portfolio, and comparable to the wealthy SCF portfolio.18
IV. Conclusion
Both of the most widely used wealth measures—the SCF and capitalized wealth data—indicate that wealth concentration in the U.S. has increased over the past 25 years. Though the original capitalized wealth estimates show rapid growth in wealth concentration, many recent refinements to the original effort (Bricker, Hansen, and Henriques, 2018, Smith Zidar, and Zwick, 2019, Saez and Zucman, 2019) show more muted growth (figure 1B). Overall, the most recent wealth concentration estimates are fairly similar in the level of wealth concentration observed between 1989 to 2016 (figure 1B). However, there is less agreement in the trend in wealth concentration since the Financial Crisis, with the SCF and DFA showing an increase while capitalization estimates from Saez and Zucman (2016), BHH, and SZZ show no change since 2007.
Each method of measuring wealth, though, relies on assumptions. The capitalization model relies on assumptions about rates of return on assets. A comparison of the Saez and Zucman (2016) estimates (which assume homogeneous rates of return) to the BHH and SZZ estimates (which assume heterogeneous rates of return for some asset classes) in figure 1B shows that small deviations from the baseline assumptions can lead to large changes in the level and trend of wealth concentration.
The quality of the SCF estimates depend on sampling wealthy families and ensuring their participation, adding omitted Forbes wealth, and collecting good wealth data. Even though Bricker et al. (2016) show that nonresponse in the SCF is ignorable, that the SCF wealth generally aligns with the Financial Accounts, and that standard errors around the point estimates shown here do not change the story, some uncertainty inevitably remains.
With such varied results since the Great Recession, more work is needed to understand the most recent trends in wealth concentration. In particular, one area of interest may be to gain a better understanding of the forms of income that appear on the individual tax forms of privately held business owners. If privately held businesses create income in multiple forms—interest income, dividend income, and Schedule E income, perhaps—the capitalization approach will apportion a mixture of fixed-income, equity, and business assets, whereas the survey would show solely business assets.
References
Alvaredo, Facundo, Anthony Atkinson, Lucas Chancel, Thomas Piketty, Emmanuel Saez, and Gabriel Zucman (2016). "Distributional National Accounts (DINA) Guidelines: Concepts and Methods used in WID.world,'' WID.world working paper series, No. 2016/1.
Avery, Robert, Daniel Grodzicki, and Kevin B. Moore. 2016. "Death and Taxes: An Evaluation of the Impact of Prospective Policies for Taxing Wealth at the Time of Death," National Tax Journal, Vol. 68, No. 3, pp 601-632.
Auten, Gerald and David Splinter (2019). "Income Inequality in the United States: Using Tax Data to Measure Long-term Trends," mimeo.
Bach, Laurent, Laurent Calvet, and Paolo Sodini (2016). "Rich Pickings? Risk, Return, and Skill in the Portfolios of the Wealthy,'' mimeo.
Bricker, Jesse, Alice Henriques, Jacob Krimmel, and John Sabelhaus (2016). "Measuring Income and Wealth at the Top Using Administrative and Survey Data,'' Brookings Papers on Economic Analysis, Spring.
Bricker, Jesse, Alice Henriques, and Kevin B. Moore (2017). "Updates to the Sampling of Wealthy Families in the Survey of Consumer Finances,'' FEDS Working Paper 2017-114.
Bricker, Jesse, Alice Henriques, and Peter Hansen (2018). "How Much Has Wealth Concentration Grown in the United States? A Re-examination of Data from 2001-2013,'' FEDS Working Paper 2018-024.
Bricker, Jesse, Peter Hansen, and Alice Henriques Volz (2019). "Wealth Concentration in the U.S. after Augmenting the Upper Tail of the Survey of Consumer Finances," Economic Letters Vol 184.
Credit Suisse Research Institute (2016) "Global Wealth Report 2016,'' Zürich, Switzerland: Credit Suisse AG. Available at: https://www.credit-suisse.com/corporate/en/research/research-institute/global-wealth-report.html (accessed October 29, 2018).
Fagereng, Andrea, Luigi Guiso, Davide Malacrino, and Luigi Pistaferri (2016). "Heterogeneity and Persistence in Returns to Wealth,'' NBER Working Paper 22822.
Kennickell, Arthur (1999). "Using Income Data to Predict Wealth", mimeo. Available at: https://www.federalreserve.gov/pubs/oss/oss2/papers/wealth.income.6.web.pdf.
Piketty, Thomas, and Emmanuel Saez (2003). "Income Inequality in the United States, 1913-1998,'' Quarterly Journal of Economics, vol. 118, no. 1: 1-39.
Raub, Brian, Barry Johnson, and Joseph Newcomb (2010). "A Comparison of Wealth Estimates in America's Wealthiest Decedents Using Tax Data and Data from the Forbes 400," Proceedings. Annual Conference on Taxation and Minutes of the Annual Meeting of the National Tax Association, vol. 103, 103rd Annual Conference on Taxation (November 18-20, 2010), pp. 128-135.
Sabelhaus, John, and Alice Henriques Volz (2019). "Are Disappearing Employer Pensions Contributing to Rising Wealth Inequality?," FEDS Notes. Washington: Board of Governors of the Federal Reserve System, February 1, 2019.
Saez, Emmanuel, and Gabriel Zucman (2016). "Wealth Inequality in the United States since 1913: Evidence from Capitalized Income Tax Data,'' Quarterly Journal of Economics, vol. 131, no. 2, pp. 519--578.
Saez, Emmanuel, and Gabriel Zucman (2019). "Progressive Wealth Taxation,'' Brookings Papers on Economic Analysis, Fall.
Smith, Matthew, Owen Zidar, and Eric Zwick (2019). "Top Wealth in the United States: New Estimates and Implications for Taxing the Rich". Mimeo.
Statistics of Income (2012a). "Individual Income Tax Returns.'' Washington, DC: Internal Revenue Service.
UBS/Campden Wealth (2018). "The Global Family Office Report 2018,'' Zürich, Switzerland: UBS AG. Available at: https://www.ubs.com/global/en/wealth-management/uhnw/global-family-office/global-family-office-report-2018.html (accessed January 15, 2019).
Zucman, Gabriel. (2019). "Global wealth inequality," NBER Working Paper 25462.
1. The only official recording of wealth that exists in the U.S. comes from an estate tax (if applicable) at death. While these data have been widely used in the past to estimate wealth concentration (Lampman, 1962, Kopczuk and Saez, 2003, and others), the estate tax data from the past 15 years have relatively small sample sizes and are less representative than past data as estate tax filing thresholds have increased. Return to text
2. The estate tax data (noted previously) only cover the upper part of the wealth distribution. Return to text
3. Zucman (2019)—updating Saez and Zucman (2016)—presents two data series: one at the tax unit level and another at the individual level. We use the tax unit series throughout this note as it is closer to the SCF family-level unit of analysis. The two series track each other over time and the individual level wealth concentration estimates are generally 1 to 2 percentage points smaller. The individual level data are publicly posted and updated regularly at the World Inequality Database (WID) at www.wid.world. Return to text
4. Not all assets and debts appear on a tax form. Only a small amount of consumer credit debt, for example, is deductible, so the Saez and Zucman (2016) model distributes consumer credit in the Financial Accounts based on the joint distribution of consumer credit and income in the SCF. Similarly, the stock of defined benefit pension wealth is distributed according to taxable pension income and the joint distribution of wages and pension income in the SCF. Return to text
5. The SCF over-sampling strategy uses two methods of predicting wealth from taxable income. The first is a capitalization model—similar to that described in the previous section but utilizing market rates of return—and the second uses the empirical correlation between wealth collected in the SCF and income from the administrative sampling data. Bricker, Henriques, and Moore (2017) provide model details. The 2016 SCF contains data on about 6,000 families, of which about 1,500 are from the oversample. Return to text
6. Bricker, Hanson, and Volz (2019), Vermeulen (2018), and Kennickell (1999) each show that any under-coverage in the baseline SCF does not arise until the extreme top, as the wealthiest SCF families have wealth comparable to the lower end of the Forbes 400. Return to text
7. However, we do not attempt to replicate all of the measurement choices from the capitalized wealth data. For instance, the stock of DB pension wealth used in the SCF results is the accrued pension obligations of pension plans (i.e. all benefits accrued to date for workers), which includes both funded and unfunded obligations. The capitalized wealth results in Saez and Zucman (2016) include only the funded obligations. Pension accounting principles and laws differ for private and public sector employers, leading to higher funding levels for private sector plans. Including both funded and unfunded obligations in the SCF estimates allocates all pension benefits workers have accrued, since they are liabilities on the balance sheet of firms, regardless of whether the assets have been set aside (for further discussion of DB concept included see Sabelhaus and Volz, 2019). The optimal choice of pension entitlement measure reflects one’s view on the risk of firm (or government) default on pension obligations. We can further close this conceptual gap by estimating an SCF wealth concentration measure at the tax unit—rather than family—level, which is not shown but serves to increase SCF wealth concentration by about 2 percentage points. Return to text
8. Income concentration measures at the tax unit level are about 2 percentage points higher than at the household level from 1980-2014 (Auten and Splinter, 2019). Return to text
9. Note that BHH are missing data for 2013-2015. Return to text
10. The SZZ data used in this figure are from Figure 1(b) of SZZ, and will be updated in the future. Return to text
11. To be comparable to Saez and Zucman (2016) and Saez and Zucman (2019), the equities category includes both publicly traded equities and S-corporations, and the pension category includes both DB and DC plans. Return to text
12. The same is true in the capitalized income data – the wealthiest one percent of tax units held 62 percent of the equities and 43 percent of the private business wealth in 2016. Return to text
13. In the Financial Accounts, for example, the value of household business and equity assets nearly doubled from 2010 to 2016 and accounted for nearly half of the growth in aggregate household wealth during this time. Wealthy SCF families hold modest positions in interest-bearing assets (around 10 to 15 percent of the portfolio). Though the share of the wealthy portfolio in interest-bearing assets increased in the SCF—from about 10% of assets prior to the financial crisis to about 15% in 2010-2016 (figure 2b)—these assets contributed little to the overall change in SCF wealth concentration (figure 2a). Most of this increase is due to bond holdings. In the SCF, between 40 to 48 percent of the interest-bearing assets held by the wealthiest 1 percent are bonds in recent years. Return to text
14. Though interest-bearing assets notably include bonds and other debt securities, the majority are transaction accounts, such as checking and savings accounts, in the Financial Accounts table B.101 (the assets data that underlie the capitalized income estimates). Return to text
15. Unrealized capital gains, a substantial component of market value, have become a larger share of wealthy families’ portfolios over time (Avery, Grodzicki, and Moore, 2016). Accordingly, if the full market value of business assets was used in the capitalization model, the inferred rate of return on business assets would be smaller—and the rate at which business income was capitalized would be larger. Return to text
16. As wealth increases, private business assets become a larger part of the SCF balance sheet (Figure 3b), similar to the Swedish (Bach, Calvet, and Sodini, 2016) and Norwegian administrative asset data (Fagereng, Guiso, Malacrino, and Pistaferri, 2016). In fact, across the entire wealth distribution, the SCF portfolio composition is nearly identical to that found in the Swedish administrative asset data. Figure 2 of Bach, Calvet, and Sodini (2016) provides a detailed version of the Swedish portfolio and figure 1 of Fagereng, Guiso, Malacrino, and Pistaferri, (2016) provides a detailed version of the Norwegian portfolio. The Norwegian data does not include real estate, which limits the comparison to the SCF for most of the wealth distribution, as housing is the dominant asset for most US families. Return to text
17. The business share in the Norwegian data does not include real estate, which biases the business share up compared to the SCF and Swedish administrative data. SCF data from 2010 are used in Figure 3 for comparability to the 2007 Swedish and 2013 Norwegian data. In this figure, S Corporation assets are shown separately—rather than included with equities, as in Figure 2—as they are closer to private business equity found in the comparison data. Return to text
18. We note, though, that definitional differences may skew the comparisons to the SCF. In the family office data, hedge funds are about 7 percent of the average North American family office portfolio but cannot be allocated further. The family office portfolios are mostly unchanged between the first such report in 2014 and the most recent in 2018. We also note that a global measure of wealth concentration shows a small change from 2000 through 2007—similar to the SCF and capitalized income estimates—then a decline through 2011 and an increase from 2011 through 2016, as in the SCF (Figure 1). Globally, the increase in equity and business assets drove the increase from 2011 to 2016, as in the SCF (Credit Suisse Research Institute, 2018). Return to text
Bricker, Jesse, and Alice Henriques Volz (2020). "Wealth concentration levels and growth: 1989-2016," FEDS Notes. Washington: Board of Governors of the Federal Reserve System, February 20, 2020, https://doi.org/10.17016/2380-7172.2438.
Disclaimer: FEDS Notes are articles in which Board staff offer their own views and present analysis on a range of topics in economics and finance. These articles are shorter and less technically oriented than FEDS Working Papers and IFDP papers.