IFDP Notes
March 24, 2017
The Effect of the GST on Indian Growth
Eva Van Leemput and Ellen A. Wiencek1
1 Introduction
In the summer of 2016, the Indian Congress approved the Goods and Services Tax (GST) legislation to simplify the current multilayered federal, state, and local indirect tax structure. The GST bill will unify at least ten types of indirect taxes into one tax to be collected at the state and federal levels. Under the existing structure, at each point of sale, additional taxes are applied to the after-tax value of each good and service. The main purpose for the GST is to eliminate this compounding effect by fixing the final tax rate, where goods will fall into one of four rate categories of 5, 12, 18, and 28 percent. The GST is currently expected to be rolled out in mid-2017.2
This note first documents India's current tax system and describes the changes approved under the new GST legislation. Second, it analyzes the impact of the new GST on Indian GDP and welfare through the impact on domestic and international trade. Recent work, Van Leemput (2016), quantifies domestic and international trade barriers in India such as shipping costs, tariffs, etc. It provides evidence that India's domestic trade barriers are highly correlated with the ease of doing business across states, proxied by the level of tax rates and the complexity of the tax system. The effects of the GST bill here are studied as an interesting application of the quantitative model of Van Leemput (2016), analyzing these effects through a reduction in domestic and international trade barriers. Finally, this note examines the sensitivity of the growth and welfare outcomes under an alternative scenario of the GST bill.
Our results indicate that the GST should be welfare improving for all Indian states and, therefore, would be an inclusive policy. The effect on Indian real GDP of the new GST system would depend on the exact allocation of goods and services to each of the four tiers of the GST, which has not yet been finalized by the Indian government. We work with alternative assumptions on this: The first gives an aggregate weighted GST of 16 percent with a positive impact on real GDP of 4.2 percent, whereas our second allocation gives an aggregate weighted GST rate of 20 percent with a lesser positive impact on GDP of 3.1 percent.
2 India's Tax System
2.1 Current Tax System
Presently, India's tax system comprises a multitude of indirect taxes, applied at the central (federal) and state levels. Table 1a and Table 1b show the most notable ones, which the GST will subsume. Table 1a summarizes the current central tax rates, and Table 1b covers the range of rates of state taxes.
Table 1a. Overview of India's Tax System: Central Taxes
| CENTRAL TAXES | Rate |
|---|---|
| 1. Central Value Added Tax (CENVAT) or Central Excise duty Tax levied on the production of manufacturing goods. |
12.36% |
| 2. Service Tax Tax levied on provided services. |
15% |
| 3. Central Sales Tax (CST) Tax on cross-state trade. |
2% |
| 4. Countervailing Duties (CVD) Additional import duty on imported goods which are produced in India in order to 'level the playing field' between domestic an dforeign producers. Additional CVDs might be applied to offset the effect of concessions and subsidies granted by an exporting country to its exporters. |
12.36% |
| 5. Special Additional Duty of Customs (SAD) Additoinal import duty to counterbalance the sales or value added tax payable by local manufactures. |
4% |
Table 1b. Overview of India's Tax System: State Taxes
| STATE TAXES | Range Rates |
|---|---|
| 1. Value Added Tax (VAT) Tax levied on the production of manufacturing goods. |
10%-14.5% |
| 2. Sales Tax Additional tax levied on the production of manufacturing goods. It was replaced in most states by VAT, but not all. |
0%-15% |
| 3. Entry Tax Tax on the entry of goods for consumption, use or sale in that state. |
0%-12.5% |
| 4. Luxury Tax Tax on luxury goods and services that include hotels, resorts, and congregational halls used for weddings, conferences, etc. |
3%-20% |
| 5. Entertainment Tax Tax on feature films, major commercial shows and private festivals. |
15%-50% |
At the central level the most important taxes are the Central Value Added Tax (CENVAT), the service tax, the Central Sales Tax (CST), the Countervailing Duties (CVD), and the Special Additional Duty of Customs (SAD). The CENVAT (or Excise Duty) is a tax levied on the production of movable and marketable goods in India and is set at 12.36 percent. The service tax is a 15 percent tax on all services provided, wherein the service provider collects the tax on services from the service receiver and pays it to the government. The 2 percent CST is a tax levied on all cross-state trade that is not destined for, nor originates from abroad. Even though the CST is a central tax, the revenue accrues to the state from which the sale originates. Finally, the government levies two additional taxes on imports in addition to tariffs.3 Those are the countervailing duties (CVD) and the special additional duties (SAD), which amount to 12.36 and 4 percent, respectively. The CVD is an additional import duty levied on imported goods that are also produced in India to `level the playing field' between domestic and foreign producers. The SAD is levied on imports to ensure that local sellers do not lose out on competition by counterbalancing the sales tax or value added tax payable by local manufacturers.
At the state level the most important taxes include the state Value Added Tax (VAT), the entry tax, the luxury tax, and the entertainment tax. The VAT taxes manufacturing goods produced within the state and ranges from 10 to 14.5 percent across states. The sales tax is a tax on goods sold within the state and ranges from 0 to 15 percent. It has been replaced by the VAT in most states, but remains in a few states. The entry tax is levied on the entry of goods into a state for the consumption, use, or sale therein and it varies between 0 and 12.5 percent. The entry tax is similar to the CST in that it taxes cross-state trade, but unlike the CST, the revenues accrue to the importing state. Finally, each state raises its own luxury and entertainment taxes, which can go up to 20 and 50 percent, respectively. Luxury taxes are mostly levied on hotels, and entertainment taxes are typically levied on movie releases.4
2.2 Tax System under the new GST
The new GST will merge the aforementioned indirect central and state taxes into a four-tier schedule of 5, 12, 18 and 28 percent, as seen in Table 2. While necessity goods will be taxed at 5 percent and luxury and consumer durable goods at 28 percent, most goods and all services will be taxed at the standard rates of either 12 or 18 percent, but the allocation to each tax rate is still uncertain.
Table 2. Proposed Tax Brackets
| Goods: Exempt | Goods: Low Rate |
Goods: Standard Rate |
Goods: High Rate |
Services: Standard Rate |
|---|---|---|---|---|
| 0% Agricultural goods |
5% Necessity goods |
12% and 18% Distribution is undecided |
28% Luxury goods and consumer durables |
12% and 18% Distribution is undecided |
The main purpose of the GST is to eliminate the compounding effect of the current multilayered tax system as well as the cross-state tax heterogeneity by fixing the final tax rate.5 To illustrate this, Table 3a shows the final tax rate for a typical manufacturing good produced and sold in different Indian states or exported to the rest of the world (ROW) in columns (1) and (2). Column (3) presents the final tax rate for an internationally imported manufacturing good.
Column (1) shows the final tax rates for manufacturing goods produced in the state of Andhra Pradesh. The first row indicates that the total tax amounts to 29 percent if sold in Andhra Pradesh. This compounded tax includes the CENVAT of 12.36 percent and the Andhra Pradesh VAT of 14.5 percent. The second row shows that the total tax is 48 percent if that manufacturing good, produced in Andhra Pradesh, is sold in the states Maharashtra. The overall tax still includes the CENVAT and the Andhra Pradesh VAT. In addition, the good incurs an additional CST of 2 percent and an entry tax of 12.5 percent in Maharashtra. Finally, the third row shows that if the good is exported internationally, neither the CST nor the entry tax apply, and the total tax is 29 percent. Column (2) shows the final tax rates for manufacturing goods produced in the state of Maharashtra and sold in the state of Andhra Pradesh, within Maharashtra, and exported internationally, respectively. It shows that the overall tax rates are lower compared to goods produced in Andhra Pradesh, which is primarily driven by a lower state VAT of 12 percent than the 14.5 percent state VAT in Andhra Pradesh. Finally, column (3) shows the final tax rate of internationally imported goods amounts to 17 percent as both the CVD of 12.36 percent and the SAD of 4 percent are levied.
Table 3a. Cross-State Taxes Under Baseline GST: Current Tax System
| Exporter: (1) Andhra Pradesh |
Exporter: (2) Maharashtra |
Exporter: (3) ROW |
|
|---|---|---|---|
| Importer: Andhra Pradesh | 29% | 28% | 175 |
| Importer: Maharashtra | 48% | 26% | 17% |
| Importer: ROW | 29% | 26% | 0% |
Table 3b. Cross-State Taxes Under Baseline GST: Tax System Under the New GST
| Exporter: Andhra Pradesh |
Exporter: Maharashtra |
Exporter: ROW |
|
|---|---|---|---|
| Importer: Andhra Pradesh | 16% | 16% | 16% |
| Importer: Maharashtra | 16% | 16% | 16% |
| Importer: ROW | 0% | 0% | 0% |
To highlight the impact of the new GST on the average manufacturing good, we construct a weighted tax based on the production shares of goods in each tier that maps the current VAT rate schedule onto these four tiers. In our baseline case, this amounts to an aggregate rate of 16 percent. Table 3b shows how bilateral taxes would change under the GST for the same two Indian states and the ROW. It shows that, on average, goods are taxed at a rate of 16 percent across states. This implies that goods produced in Andhra Pradesh are subject to the same tax regardless of being sold within state or exported to another (column (1)). Table 3b also highlights that international exports are exempt from the GST, while imports are included. To summarize, the GST bill is expected to lower the average tax rate on manufacturing goods and make them uniform across states by fixing the final tax rate.
3 Model
The model in Van Leemput (2016), which we use here to analyze the effects of the GST, builds on the seminal model of trade and geography of Eaton and Kortum (2002) to include many states within a country. More concretely, we model India as one country with 30 heterogeneous states that trade agricultural and manufacturing goods both domestically and internationally.6
Domestic trade (or cross-state trade) occurs between all 30 Indian state pairs. Trade is costly due to domestic trade barriers such as shipping costs and cross-state taxes. Hence, each state-pair faces a specific trade barrier; for example, the cost of shipping goods from Delhi to Bihar is different from Delhi to Kerala.
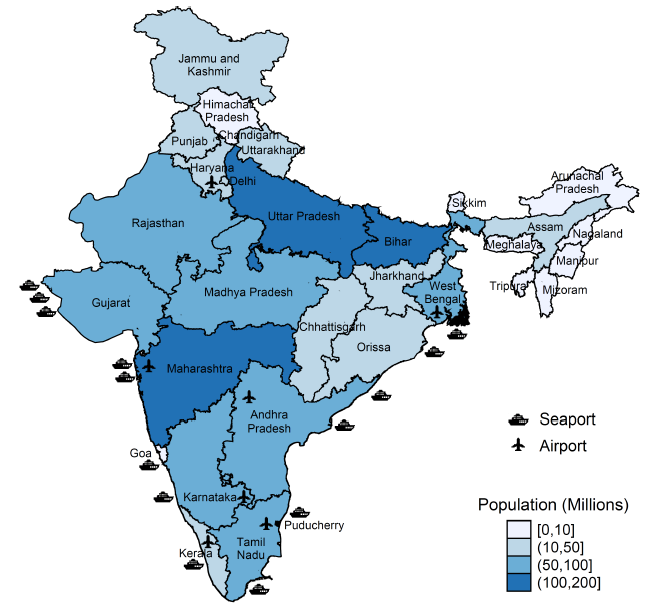
Indian states also trade internationally. Importing from and exporting to the rest of the world (ROW) is also costly due to international trade barriers such as shipping costs and tariffs. In addition, international trade can only occur through international ports. Figure 1 shows where these international ports are located. It highlights that certain Indian states do not have access to an international port. Consequently, these states face a higher cost of trading internationally, that is, they incur the domestic cost of shipping goods from the nearest port to the destination state. For instance, the state of Gujarat has international ports whereas Rajasthan does not. If Gujarat imports goods from the ROW, it only faces an international import barrier. Rajasthan, on the other hand, has to first import goods to the port of Gujarat, after which those goods are shipped from Gujarat to Rajasthan at an additional cross-state trade barrier. Hence, international trade for non-port states is more costly. Furthermore, half of the population lives in states without access to an international port.
Consumers in all Indian states and the ROW consume the cheapest agricultural and manufacturing goods according to their preferences and subject to their income, which in turn determines domestic and international trade flows. Prices are determined by both the cost of production and trade barriers. The cost of production depends on each state's productivity for a specific good, and based on the model assumption that producers are perfectly competitive and lower cost producers set lower prices. Hence, in the absence of trade barriers, consumers can optimally purchase from the most productive producers.
Trade barriers such as shipping costs and cross-state taxes, however, raise prices. The direct effect is lower consumption and production, which decreases overall welfare. In addition, trade barriers can prevent consumers from purchasing from the most productive producers, leading to an additional welfare loss by distorting the allocation efficiency. This dampens overall output even more due to less efficient production. For instance, even though the North Indian state of Punjab might be more productive in cultivating rice than the South Indian state of Tamil Nadu, the South Indian state of Kerala might import rice from Tamil Nadu as they are neighboring states and the transportation cost is likely lower in comparison to that of Punjab.
To analyze the effects of the GST we first take the estimated domestic and international barriers from Van Leemput (2016). These trade barriers account for the total cost of trading domestically and internationally for each Indian state and the ROW. A fraction of these is assumed to be due to inefficiencies associated with the compounding of taxes under India's current tax system. Therefore, to evaluate the impact of the GST, we apply the state-pair specific percentage tax changes to the current trade barriers to compute how much these barriers would be reduced under the new system.
For example, consider the export barrier from Andhra Pradesh to Maharashtra. In the calibrated model from Van Leemput (2016) the total barrier amounts to 117 percent, which includes transportation costs, taxes, etc. Column (1) in Table 3a shows that under the current tax system, the final tax on manufacturing goods from Andhra Pradesh destined for Maharashtra is 48 percent. Consequently, the total trade barrier excluding taxes would be 47 percent, computed as $$$ (\frac{1+1.17}{1+0.48})$$$. Column (1) in Table 3b shows that this tax is expected to fall to 16 percent under the GST. Hence, the impact of the GST would be an effective reduction of the total trade barrier to 70 percent from the previous 117 percent, computed as ((1+0.47)*(1+0.16)). We apply these tax changes to all domestic and international trade barriers.7 Note that agricultural goods are typically exempt from all major taxes and, therefore, we apply the change in cross-state trade barriers to manufacturing trade only. Using these new trade barriers, we then compute a new counterfactual steady state equilibrium.
4 Results
The results on the estimated impact of moving from the current tax system to the GST tax system are presented in Table 4a and Table 4b. The tables show the computed effects on welfare, real GDP, agricultural production, manufacturing production, internal trade, and external trade. All results are shown as percent changes relative to the levels under the current tax system and are presented for India as a whole, and for the port and non-port states separately.
Table 4a. Impact Baseline GST and Alternative GST Bills (Percent): Aggregate GST of 16% (Baseline)
| Welfare (1) |
Real GDP (2) |
Agric. Production (3) |
Manuf. Production (4) |
Internal Trade (5) |
External Trade (6) |
|
|---|---|---|---|---|---|---|
| India | 5.3 | 4.2 | -0.5 | 14 | 29 | 32 |
| Port States | 8 | 4.4 | -1.6 | 14 | 29 | 30 |
| Non-Port States | 2.9 | 3.9 | 0.7 | 13 | 29 | 43 |
Table 4b. Impact Baseline GST and Alternative GST Bills (Percent): Aggregate GST of 20% (Alternative)
| Welfare (1) |
Real GDP (2) |
Agric. Production (3) |
Manuf. Production (4) |
Internal Trade (5) |
External Trade (6) |
|
|---|---|---|---|---|---|---|
| India | 4 | 3.1 | -0.5 | 11 | 26 | 27 |
| Port States | 6.2 | 3.2 | -1.8 | 12 | 26 | 25 |
| Non-Port States | 2 | 3 | 1 | 11 | 25 | 38 |
Note: The real GDP expansion is weighted by the share of agricultural and manufacturing GDP of total GDP (48 percent). Welfare is population weighted. Tables 4a and 4b show the results under the aggregate GST rate of 16 and 20 percent, respectively.
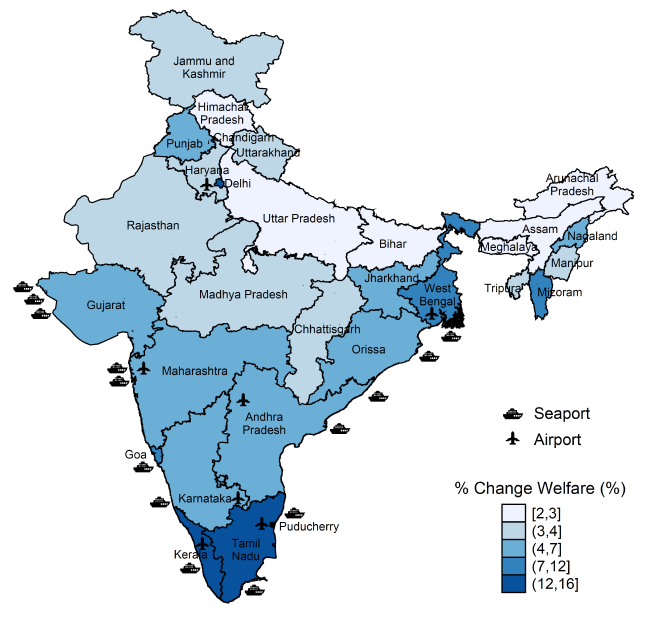
Table 4a presents the estimated effects under the baseline scenario of an aggregate GST tax rate of 16 percent. Column (1) shows that according to the model used here, the GST would raise overall welfare by 5.3 percent in India. The intuition behind this is that the GST is expected to reduce overall domestic and international trade barriers, which in turn increases welfare because consumers have access to cheaper products. Figure 2 presents the state-based welfare changes. It shows that the GST would raise welfare for all states and is thus estimated to be an inclusive policy.
Total real Indian GDP would expand by 4.2 percent, column (2). Growth is driven by an increase in both domestic and international trade. As a first order effect, the GST lowers internal trade barriers in this analysis, which improves internal trade by 29 percent, shown in column (5). As an additional effect, the GST is also foreseen to increase international competitiveness of Indian firms, which increases external trade by 32 percent, shown in column (6). The rise in internal and external trade is expected to be carried by a surge in manufacturing production of 14 percent. Agricultural production would change little because most agricultural goods would remain exempt from the GST.
Finally, column 2 shows that the GDP effects would be relatively equally distributed across states, although the port states would be slightly better off. The reason for the latter is that the non-port states benefit proportionally less from an international trade liberalization because they still face the domestic trade barriers to transport goods to and from the port. Nevertheless, the non-port states would still experience a notable increase in external trade of 43 percent as the cost of trading internationally has decreased, column (6).8
The distribution of goods in each tier has not officially been declared and most of the uncertainty lies in the allocation of the goods to the standard tax rates of either 12 or 18 percent. Therefore, we perform a counterfactual analysis that redistributes some of the higher revenue generating goods from the 12 to the 18 percent tier. Reweighing the tiers by the new distribution yields an aggregate rate of 20 percent. Table 4b presents the results for this case. The rise in welfare would be 4 percent, which is one percentage point less than the baseline. This is also reflected in the real GDP effect, which would expand by 3.1 percent, notably lower that the baseline 4.2 percent, but still significant. The reason is that a higher GST rate would dampen the rise in both domestic and international trade relative to the baseline, which translates to an increase in manufacturing production that is 3 percentage points lower.
5 Conclusion
We studied the impact of the newly approved Goods and Services Tax (GST) in India, which is scheduled to take effect in mid-2017. We collected the most notable indirect taxes that the GST will subsume both at the central and the state level. We then analyzed the effect of changes in the tax system through the lens of the trade model from Van Leemput (2016).
We find that the GST is expected to raise overall Indian welfare and is projected to be an inclusive policy in that it would be welfare improving for all Indian states. Furthermore, the model suggests that the GST would lead to real GDP gains of 4.2 percent under the baseline assumptions, driven by a surge in manufacturing output. We also find that the distribution of goods across tax rate tiers matters for the growth outlook. As more goods move to the upper tiers, the real GDP and manufacturing output gains would be dampened.
There are a few caveats in the analysis, which are important to highlight. First, this is a static model and hence, the impact of the GST should be interpreted as a long run effect. Second, the model is unable to address services trade which has become an important component of both domestic and international trade. In fact, the expected tax rate on services is higher than the current tax rate on services, which could therefore dampen the overall effects. Third, this note does not evaluate the impact on tax revenues. Even though the model predicts a decrease in tax revenue, there are reasons to believe that the GST could be revenue neutral. By simplifying the current complex tax system, the GST is expected to broaden the overall tax base through increased transparency and compliance. In addition, the increased rate on services might generate extra revenues. Finally, the analysis not does not differentiate between intermediate input and final goods trade. Even though both are subject to the tax system, there might be additional sources of welfare gains through cheaper sourcing of intermediate inputs, thereby increasing the competitiveness of the final good. In addition, the GST could reduce the inefficiencies in the production process. The current system encourages production chains within state, which could be suboptimal. Therefore, we view the studied impacts on real GDP growth and manufacturing output in this note as likely lower bounds.
References
Alder, S. (2017): "Chinese Roads in India: The Effect of Transport Infrastructure on Economic Development," Working paper.
Asturias, J., M. García-Santana, and R. Roberto (2016): "Competition and the Welfare Gains from Transportation Infrastructure: Evidence from the Golden Quadrilateral of India," Working paper.
Atkin, D. and D. Donaldson (2014): "Who's Getting Globalized? The Size and Implications of Intranational Trade Costs," NBER Working Paper No. 21439.
Cosar, A. K. and P. D. Fajgelbaum (2016): "Internal Geography, International Trade, and Regional Specialization," American Economic Journal: Microeconomics, 8, 24-56.
Directorate General of Commercial Intelligence and Statistics, Ministry of Commerce and Industry (2012a): "Foreign Trade Statistics of India," .
---- (2012b): "The Inter-State Movements/Flows of Goods by Rail, River and Air,".
Donaldson, D. (2016): "Railroads of the Raj: Estimating the Impact of Transportation Infrastructure," American Economic Review, forthcoming.
Eaton, J. and S. Kortum (2002): "Technology, Geography, and Trade," Econometrica, 70, 1741-1779.
Fieler, A. C. (2011): "Non-homotheticity and Bilateral Trade: Evidence and a Quantitative Explanation," Econometrica, 79, 1069-1101.
Van Leemput, E. (2016): "A Passage to India: Quantifying Internal and External Barriers to Trade," International finance discussion papers 1185.
Footnotes
1. The views expressed herein are those of the authors and do not necessarily reflect those of the Board of Governors of the Federal Reserve System or its staff. Return to text
2. The Indian government's target of implementing the GST is July 2017. Return to text
3. Import tariffs will not be subsumed by the GST. Return to text
4. The luxury and entertainment taxes will be subsumed by the GST, but it is expected that states will keep the right to impose additional taxes on luxury and entertainment goods. Return to text
5. The tax system is presumed to remain a dual system, that is, the GST will be split into a central GST and the state GST. This implies that both the central and state government would each still collect taxes at half of the overall GST rate. Return to text
6. Two features of the data should be noted. First, the data are for the fiscal year of 2011-2012. Hence, the state of Telangana is not included as it was not yet formed and belonged to Andhra Pradesh. Second, the state of Sikkim and the union territories Andaman and Nicobar Islands, Dadra and Nagar Haveli, Daman and Diu, and Lakshadweep are not included in the analysis as there are no available trade data for these regions. Return to text
7. Given that the model does not include services trade, we omit the service tax. Return to text
8. External trade would rise more for non-port states than for port states in percentages but not in volume. Return to text
Van Leemput, Eva, and Ellen A. Wiencek (2017). "The Effect of the GST on Indian Growth," IFDP Notes. Washington: Board of Governors of the Federal Reserve System, March 24, 2017, https://doi.org/10.17016/2573-2129.29.
Disclaimer: IFDP Notes are articles in which Board economists offer their own views and present analysis on a range of topics in economics and finance. These articles are shorter and less technically oriented than IFDP Working Papers.