IFDP Notes
June 29, 2017
Recoveries and Trade: Does the Exchange Rate Regime Matter?
Caitlin Hegarty and Beth Anne Wilson *
In the aftermath of the global financial crisis (GFC), attention has focused on what has influenced the pace of recovery across countries. Trade and, relatedly, the volatility and flexibility of exchange rates have often been cited, for both advanced and emerging market economies. Has lack of exchange rate flexibility slowed down recoveries in the euro-area periphery? Has the fluctuation of the dollar impeded U.S. growth? Are emerging market economies being hurt by exchange rate volatility? The economic consequences of a country's choice of exchange rate regime has been much studied in economics, but there has been little emphasis on the importance of this choice for post-recession economic performance. To take a closer look at the issue, this note examines the connection between a country's exchange rate regime and the strength of its recovery from recessions.
Theory proposes multiple ways in which exchange rate regimes can influence post-recession growth. In general, economic weakness puts downward pressure on the value of a country's currency. If the exchange rate is flexible, the resulting depreciation makes exports more competitive and stimulates growth. Countries with pegged nominal exchange rate regimes cannot have quick real exchange rate adjustments because the nominal exchange rate does not move and prices are typically slow to change due to nominal rigidities. With such regimes, therefore, export growth may rise only gradually after recessions, leading to slower recoveries.1
Exchange rate pegs can promote trade between pegged and base countries (the countries to which they are pegged), however, by reducing exchange rate volatility and facilitating trade linkages (Frankel, 1999). Klein and Shambaugh (2006) find positive gains to bilateral trade between a pegged country and its base. Intuitively, they argue that a peg, by providing a more reliable outlook for the exchange rate, helps encourage trade relationships. If growth were strong in the base-currency country and trade linkages were sizable, pegged regimes could experience stronger recoveries through trade. Countries with pegged regimes also keep the value of their foreign-denominated debt stable, as often much of their foreign debt is denominated in the currency of the base country. Economies with flexible regimes could experience negative balance sheet effects: a nominal depreciation would increase foreign-denominated debt and the associated debt-servicing costs, which generally reduces private domestic demand (Blanchard et al., 2010).
Past empirical work on the implications for growth of exchange rate choice has focused on structural growth or output volatility rather than specifically on the behavior of output following recessions (e.g. Ghosh et al, 1997, Husain et al, 2005, and Levy-Yeyati and Sturzenegger, 2003), and the results have been mixed. One study particular to recoveries is Tsangarides (2012), which finds that countries with pegged regimes seem to recover more slowly than those with floating regimes, but the research examines only the post-GFC period in emerging market economies. We look at this issue for a wider range of countries over a longer time period capturing multiple recession periods and use somewhat different methodology.
To examine the role of exchange rate regimes in fostering economic recovery, we use quarterly real GDP data for 52 countries (23 advanced economies (AEs) and 29 emerging market economies (EMEs)) from around 1970 to 2016 (table 1). Given the differences in recovery performance between these two types of economies, we do our analysis separately for each group (Howard et al, 2011). Applying a standard recession dating technique, we identify over 250 recessions.2 We then divide the sample of recessions by whether the countries are "pegged" or "flexible", based on whether the country had a fixed exchange rate regime during the trough year, as this is the start of the recovery period. 3 Given that it takes time for changes in the exchange rate to affect exports, this classification timing seems reasonable for assessing the effect of exchange rate regime on recoveries. To best capture the economic impact of exchange rate regime choice, we use the de facto classifications--i.e. how a country's exchange rate actually behaves, rather than de jure--what a country officially says its regime is.4 For countries in the euro area, the classification of exchange rate regime is a bit tricky. The euro behaves as a fixed rate with regard to intra-euro area trade, which makes up a sizable proportion of many member countries' trade, but as a floating currency for trade with non-member partners. Reflecting this, we examine the euro-area countries separately in much of our analysis.
Table 1. Sample countries
| Advanced Economies | Emerging Market Economies |
|---|---|
| Australia Austria Belgium Canada Denmark Finland France Germany Greece Iceland Ireland Italy Japan Luxembourg the Netherlands Norway New Zealand Portugal Sweden Spain Switzerland United Kingdom United States |
Argentina Brazil Chile Colombia Costa Rica Czech Republic Estonia Hong Kong Hungary Indonesia India Israel Jordan Lithuania Latvia Malaysia Mexico Peru the Philippines Russia South Africa South Korea Singapore Slovakia Slovenia Thailand Turkey Uruguay Venezuela |
We begin by looking at a simple relationship between exchange rate regime and economic performance. Table 2 shows the average change in the real effective exchange rate during recessions (from pre-recession peak to trough) and recoveries (from trough to three years post-trough) for pegged, euro-area, and flexible exchange rate countries. Over the recession period, there are significant differences in the movement of exchange rates; countries with exchange rate pegs or in the euro area experience real exchange rate appreciations on average (although of modest size), whereas those with flexible exchange rates experience sizable depreciations. In the recovery period, performance is mixed but, roughly speaking, in pegged currency countries the real exchange rate tends to depreciate somewhat, while for flexible currency economies the exchange rate tends to appreciate. Overall the behavior seems in line with the channels discussed above. In flexible regimes, the exchange rate depreciates, acting as an equilibrating force and then appreciates in the recovery phase. In pegged regimes, there is not much initial change in the real exchange rate, but later it very gradually depreciates as adjustment occurs through slowly moving prices, with adjustment still occurring well into the recovery.
Table 2. Total change in REER over recession and recovery (%)
| Recession | Recovery | (n) | |
|---|---|---|---|
| AEs | |||
| Pegged or euro area | 0.7 | -2.0 | (39) |
| Pegged | 0.2 | -3.1 | (10) |
| Euro area | 0.9 | -1.6 | (29) |
| Flexible | -3.0 | -0.5 | (64) |
| P-value | 0.04* | 0.45 | |
| P-value excl. euro area | 0.38 | 0.48 | |
| EMEs | |||
| Pegged+ | 2.11 | -0.02 | (14) |
| Flexible | -8.22 | 3.04 | (72) |
| P-value | 0.03* | 0.51 | |
*Significant at the 95 percent level. Return to table
+ excludes three outliers with depreciations greater than 20%. Return to table
Negative values indicate real depreciation.
But do these exchange rate adjustments lead to expected impacts on trade and output? Table 3 shows average growth in real GDP, exports, and domestic demand in recession and recovery periods. What is surprising is that the striking difference in exchange rate behavior does not seem to lead to sharp differences in economic performance. Both during the recession, and in the three years post trough, there is little significant difference in the rise in GDP, exports, or private domestic demand between economies with exchange rate pegs and those with more exchange rate flexibility, especially if euro-area countries are excluded.
Table 3. Total change in demand over recession and recovery (%)
| GDP | Exports | Priv. Domestic Demand | |||||||
|---|---|---|---|---|---|---|---|---|---|
| Recession | Recovery | (n) | Recession | Recovery | (n) | Recession | Recovery | (n) | |
| AEs | |||||||||
| Pegged or euro area | -3.8 | 6.6 | (41) | -3.6 | 19.2 | (38) | -3.2 | 5.0 | (38) |
| Pegged | -2.1 | 7.7 | (12) | 1.4 | 16.8 | (9) | -0.1 | 7.2 | (9) |
| Euro area | -4.5 | 6.2 | (29) | -5.2 | 20.0 | (29) | -4.2 | 4.3 | (29) |
| Flexible | -3.2 | 9.0 | (66) | -1.4 | 18.8 | (60) | -3.5 | 9.2 | (60) |
| P-value | 0.43 | 0.01* | 0.24 | 0.85 | 0.82 | 0.00* | |||
| P-value excl. euro area | 0.17 | 0.25 | 0.36 | 0.58 | 0.09 | 0.38 | |||
| EMEs | |||||||||
| Pegged | -7.1 | 17.2 | (19) | -8.2 | 35.8 | (16) | -9.4 | 18.1 | (16) |
| Flexible | -6.8 | 15.8 | (77) | -3.7 | 25.6 | (69) | -8.6 | 18.0 | (68) |
| P-value | 0.88 | 0.57 | 0.23 | 0.07 | 0.75 | 0.98 | |||
*Significant at the 95 percent level. Return to table
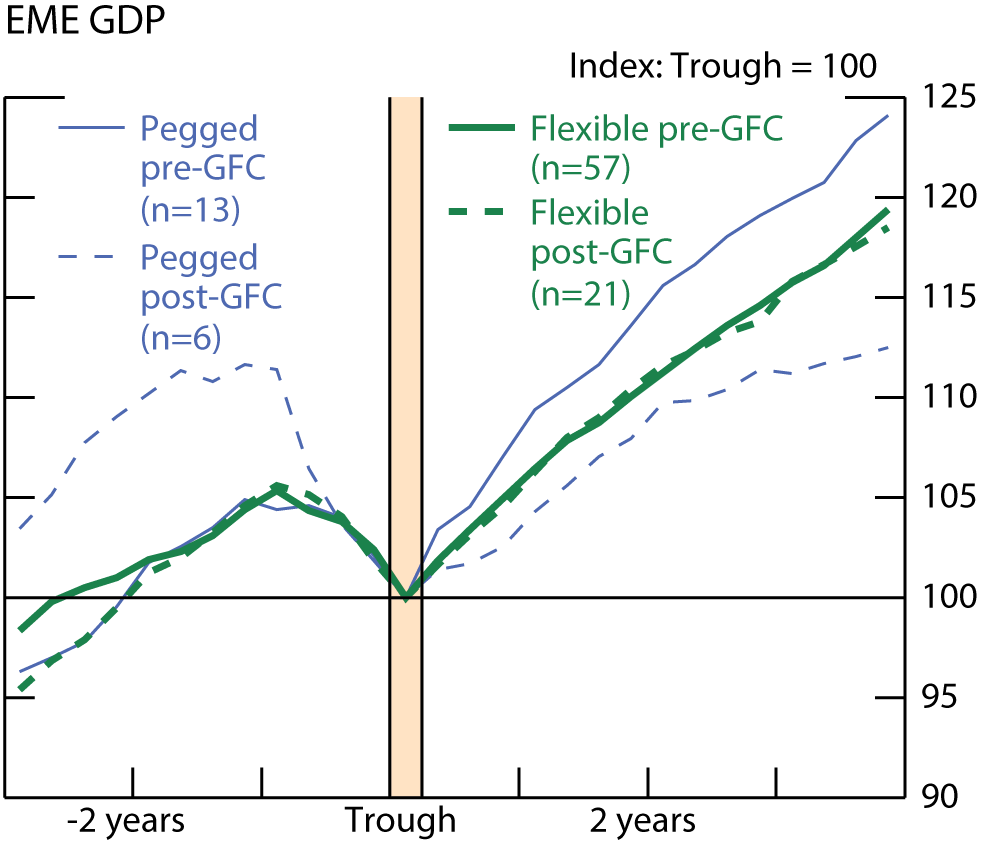
To illustrate this, we construct butterfly charts centered on recession troughs to show the average GDP recovery path by exchange rate regime. In the AEs (figure 1), pegged regimes, including the euro area, perform marginally worse than flexible regimes, on average. When we isolate the euro area (figure 2), we find that the average pace of recovery of pegged and flexible regimes is roughly the same, while the euro area underperforms. We find little notable distinction for the EMEs as well (figure 3).
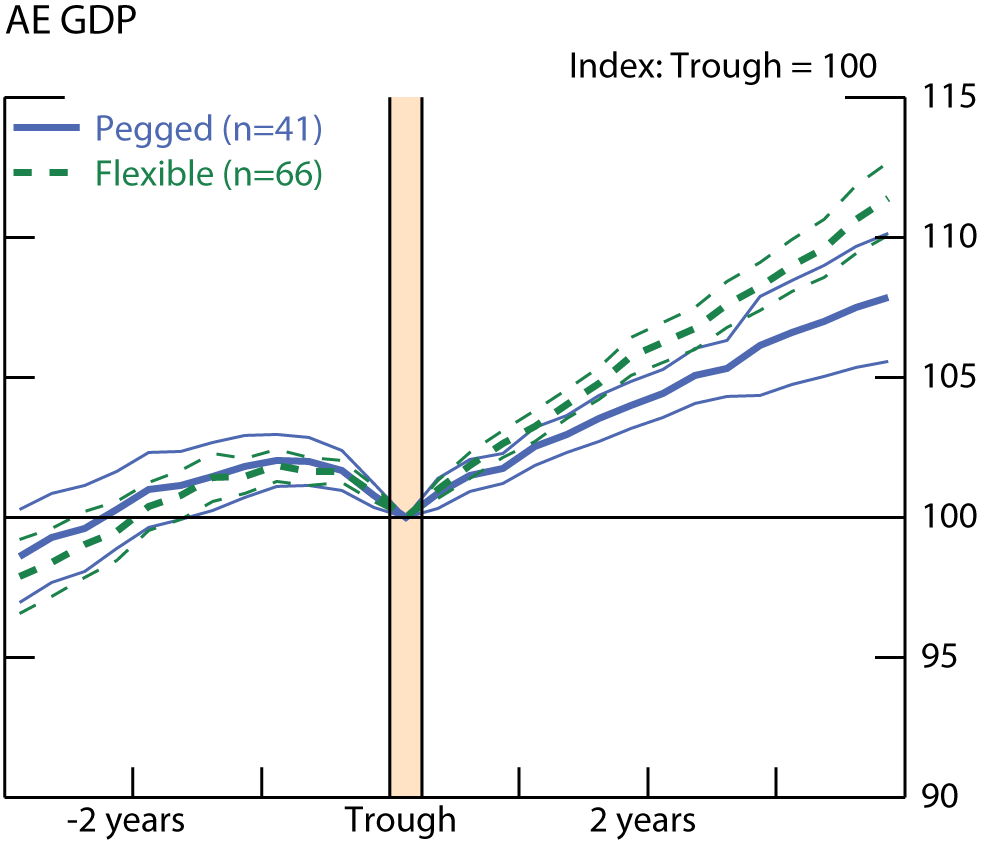
Thick lines are means. Thin lines denote two standard error bands
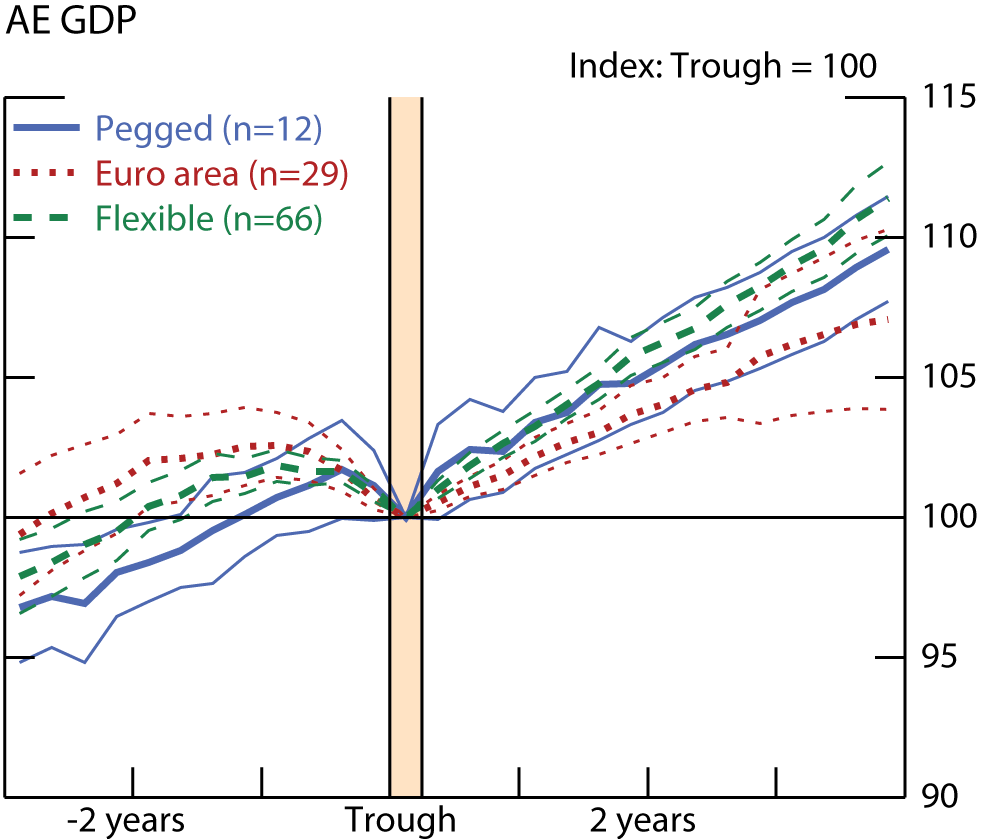
Thick lines are means. Thin lines denote two standard error bands
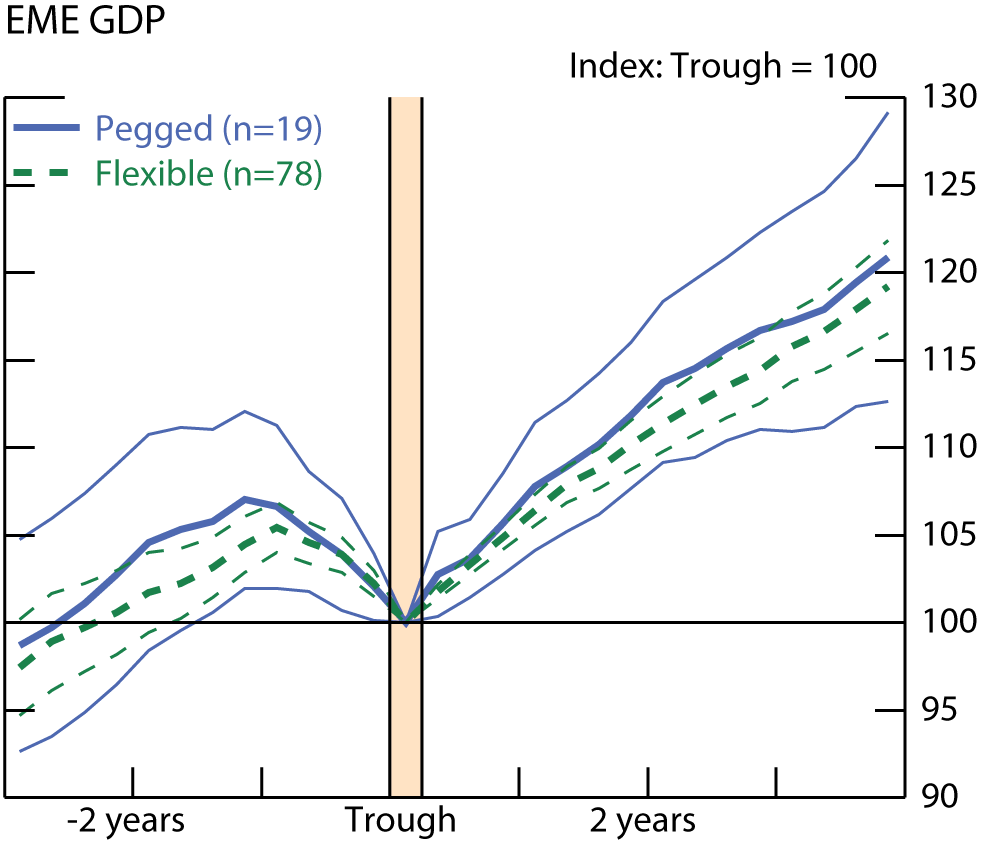
Thick lines are means. Thin lines denote two standard error bands
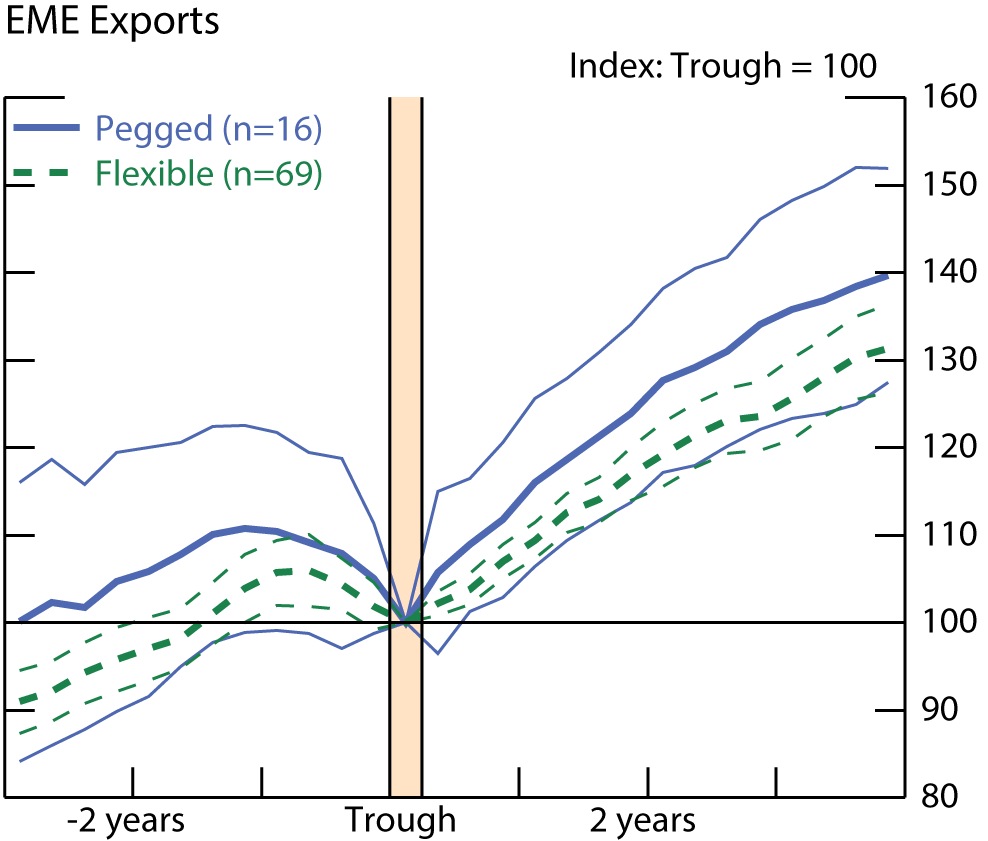
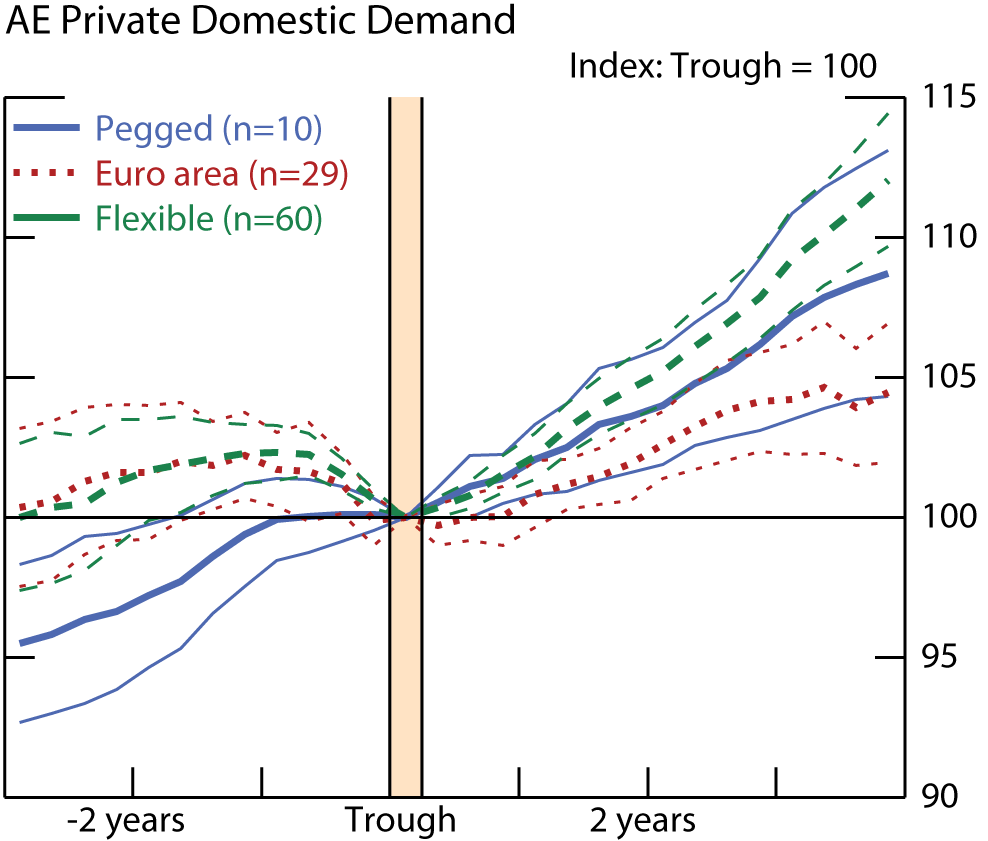
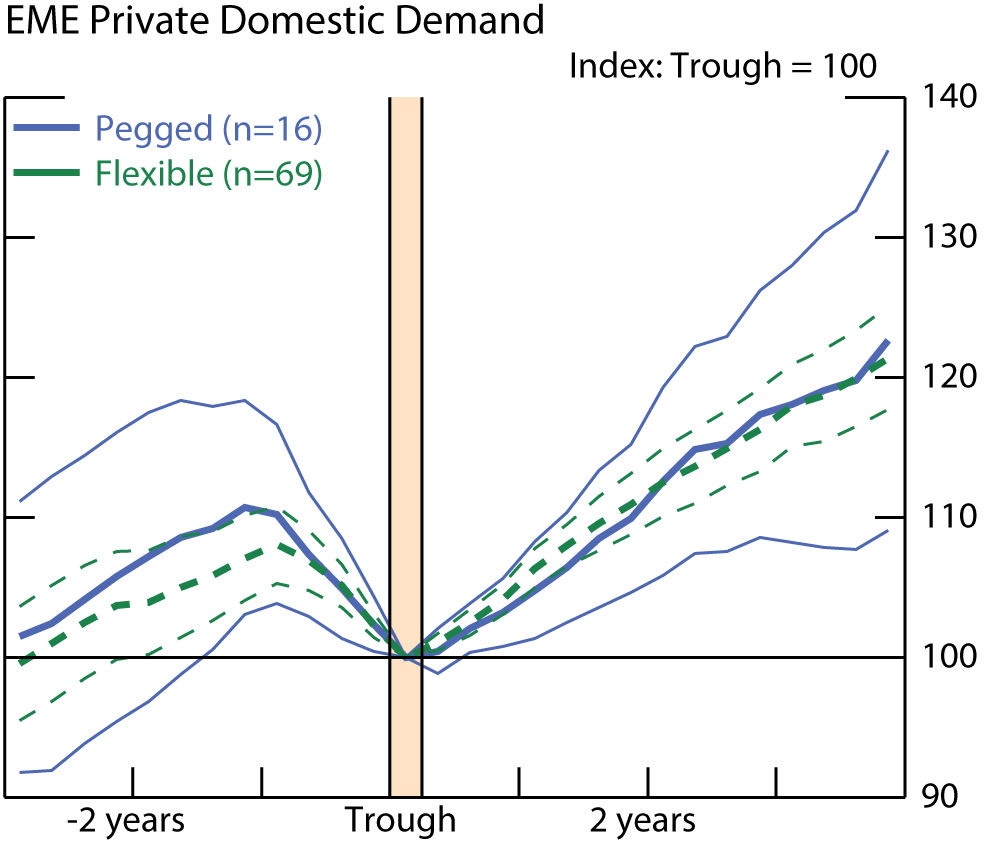
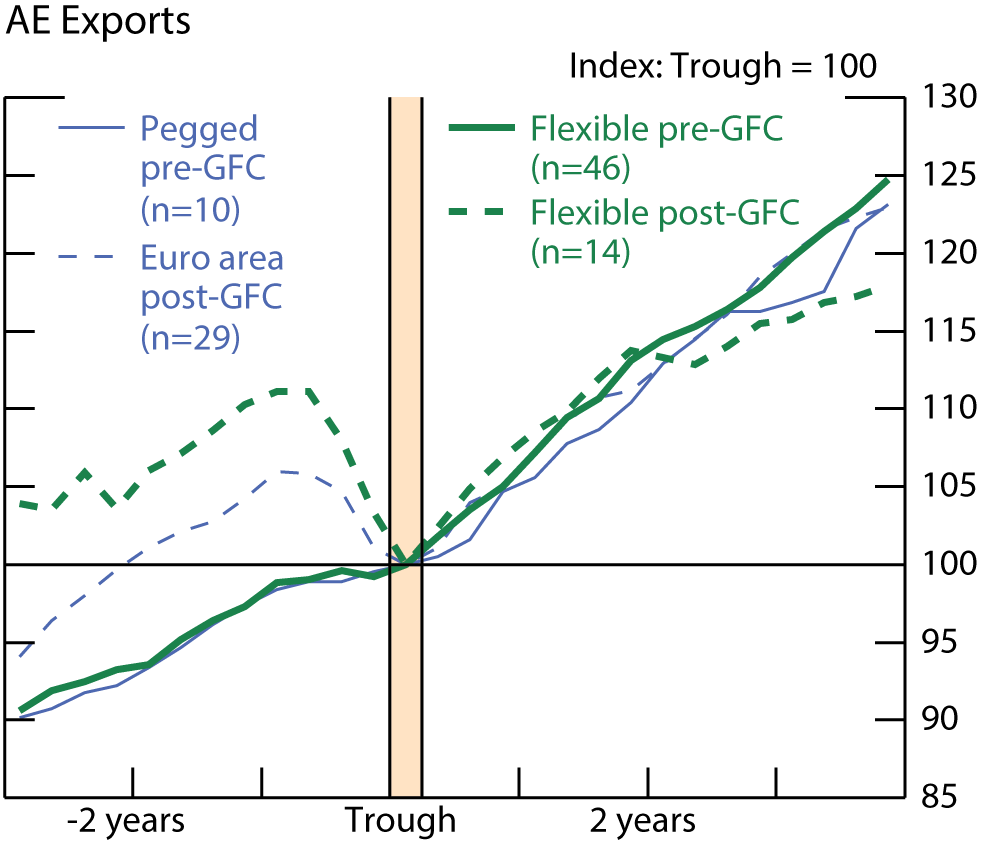
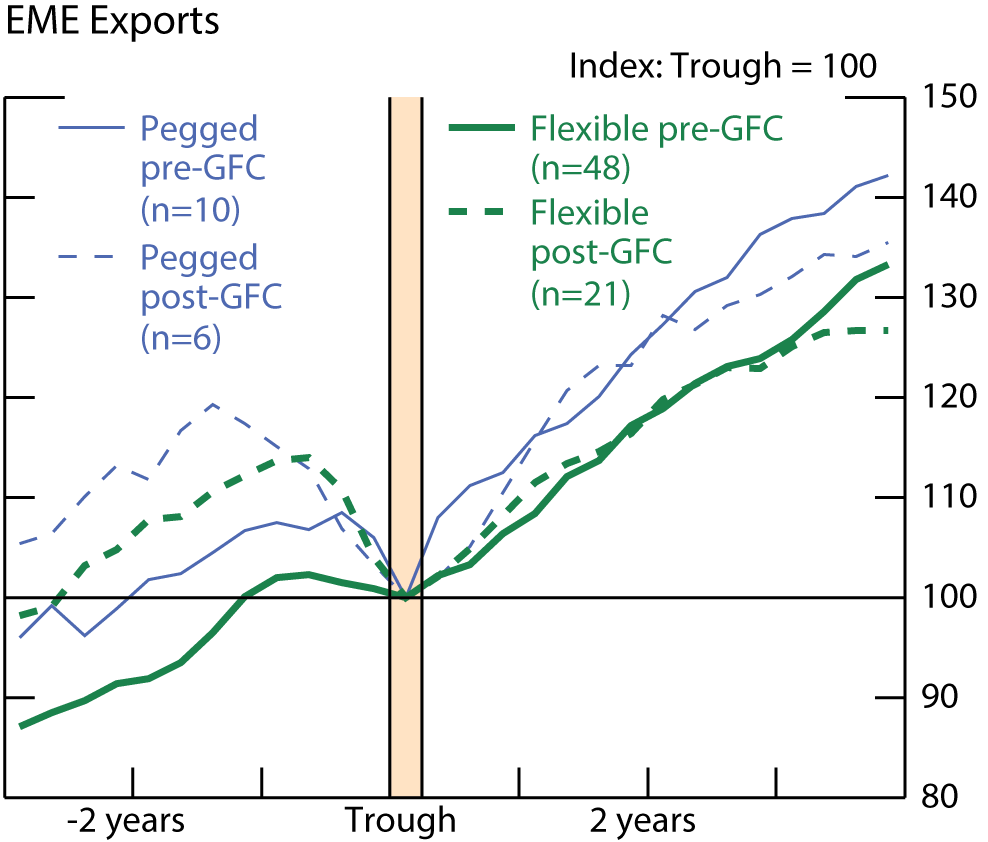
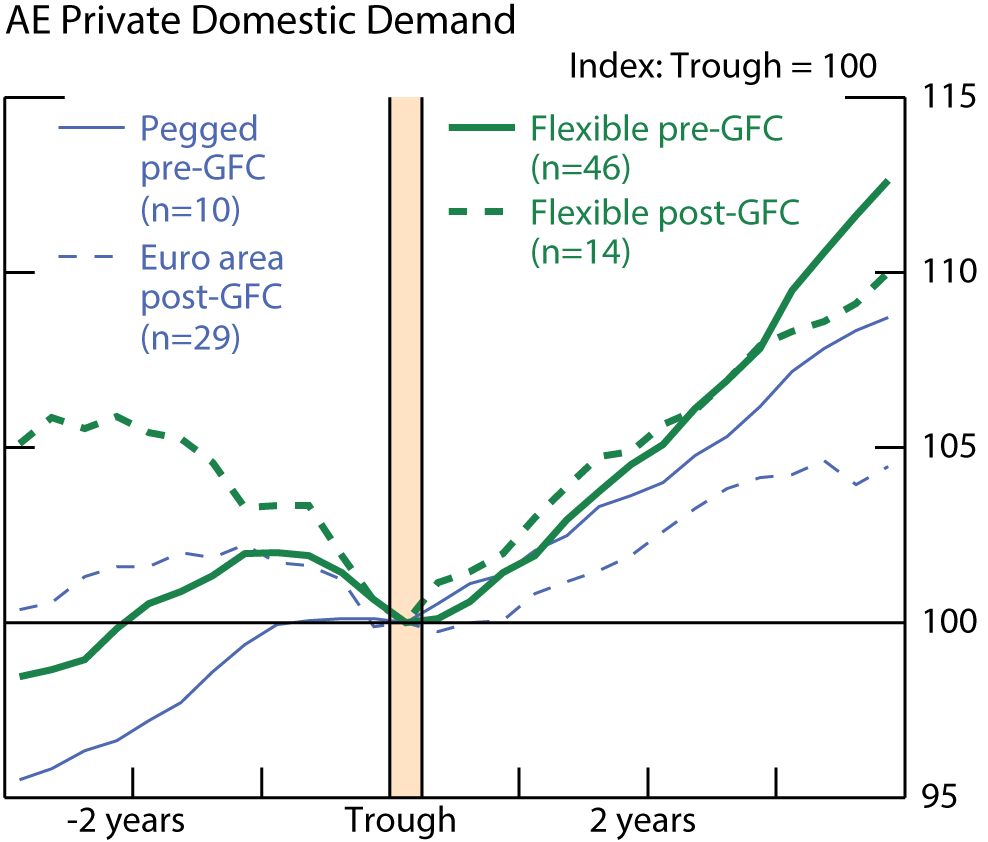
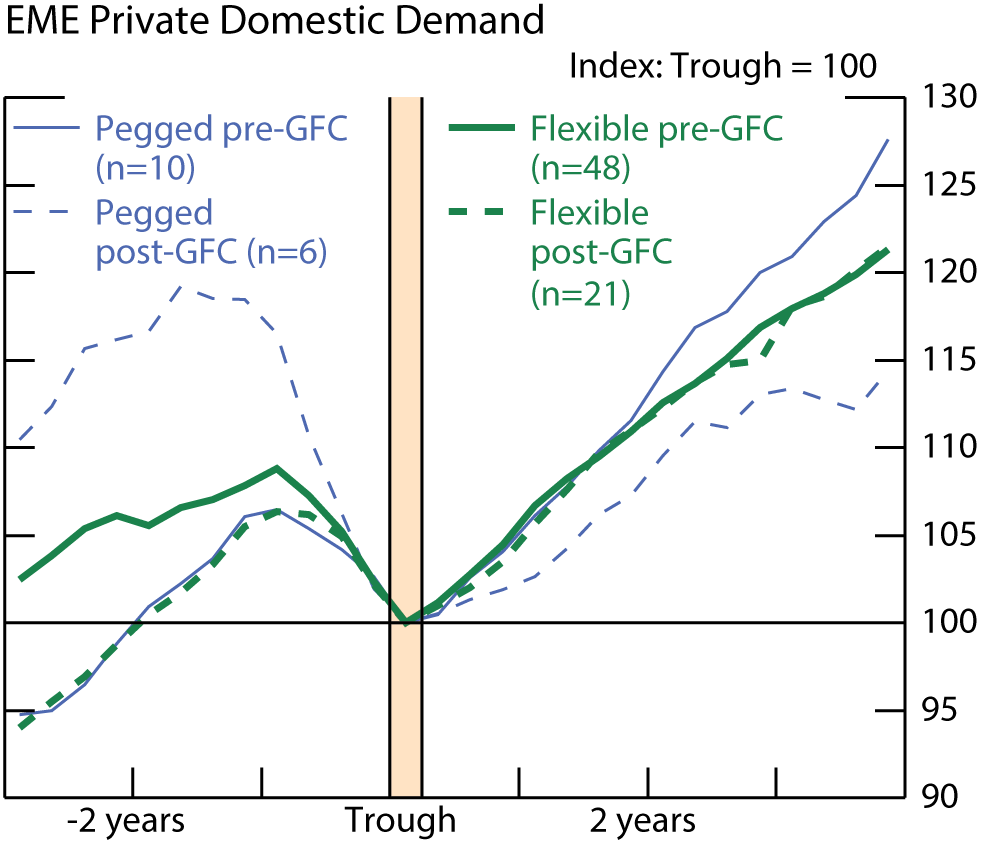
As with the results in table 3, the choice of exchange rate regime appears to make little difference to performance of key sub-components of GDP. Countries with pegged regimes tend to experience sharper contractions in exports during recessions, but the difference is not statistically significant and does not correspond to any notable difference in export growth in the recovery phase in the AEs (figure 4). In the EMEs (figure 5), exports in pegged regimes tend to fall more and rebound faster around recessions. But countries with pegs do not seem to experience greater contractions in private domestic demand during recessions, or slower recoveries (figures 6 and 7). Euro-area countries experience significantly slower private domestic demand growth than countries with flexible regimes.
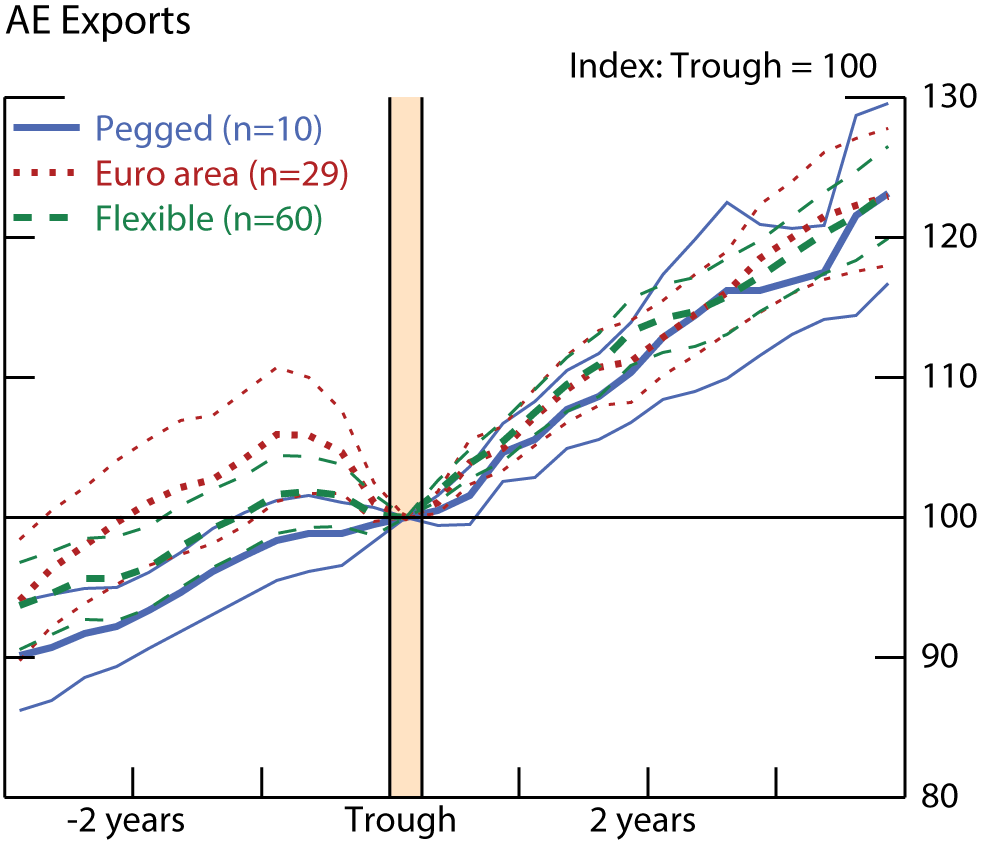
Thick lines are means. Thin lines denote two standard error bands
Thick lines are means. Thin lines denote two standard error bands
Thick lines are means. Thin lines denote two standard error bands
Thick lines are means. Thin lines denote two standard error bands
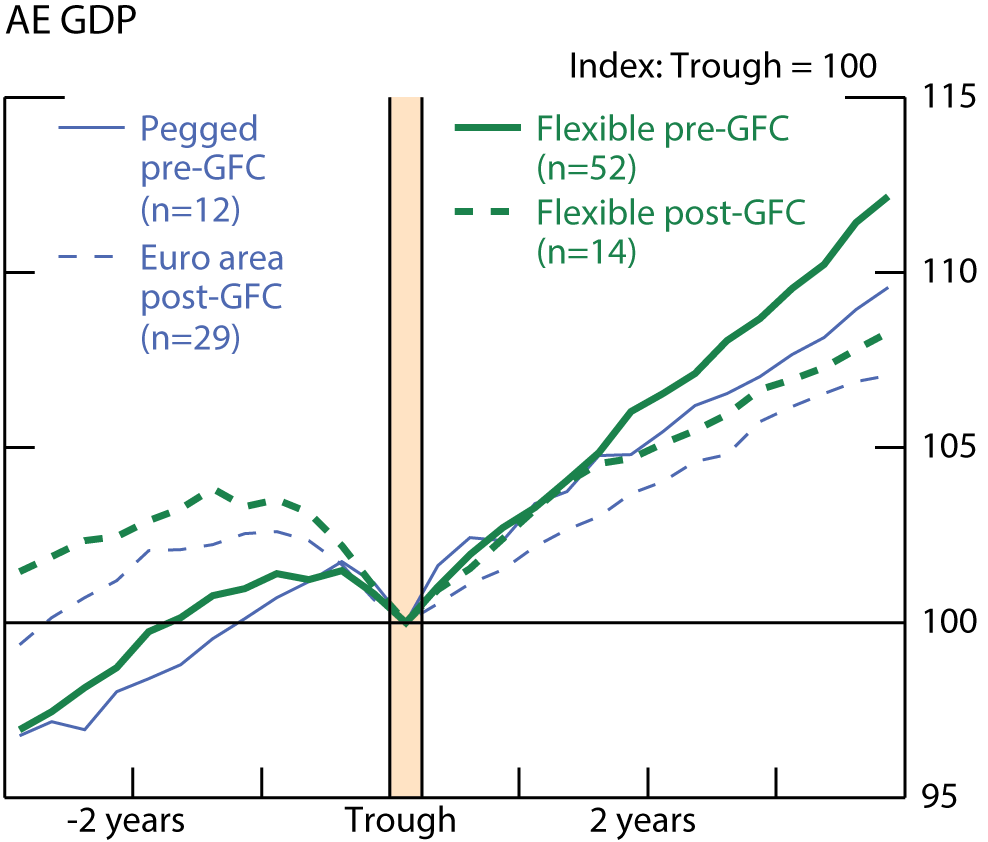
Given the interest in the current post-GFC recovery period, figures 8 through 13 compare average recession and recovery performance prior to the GFC with what has happened since. We would note that for the advanced economies, all the "pegged" countries in the post-GFC period are those in the euro area. Several interesting aspects of these charts are: First, for AEs, regardless of exchange rate regime, output recovery tends to be weaker in the post-GFC period. Given that, countries with flexible exchange rates seem to outperform those with fixed, but the differences are small and other euro-area specific factors besides exchange rate regime may be behind the result. Second, for the emerging market economies, the results are more striking. Countries with flexible exchange rates have recovered, on average, at about the same pace pre- and post-GFC. On the other hand, countries with exchange rate pegs have substantially underperformed both flexible exchange rate countries and countries with pegs during the pre-GFC period (similar to results in Tsangarides (2012)). Finally, the differences in performance across periods and exchange rate regimes do not appear to be driven by export performance, but by growth of domestic demand. This may raise deeper questions about how exchange rate regimes affect economic recovery or point to other institutional or economic factors that tend to be more common in countries which adopt exchange rate pegs.
These results do not take into account other factors that may be influencing recoveries, however. To control for such factors, we use the following equation:
$$$$y_{i,t}=\beta_0 + \beta_1{pegged_{i}}+\beta_kX_{i}+\epsilon_{i}$$$$
where $$y_{i,t}$$ is the level of GDP $$t$$ years past the trough of recession $$i$$, $$pegged_{i}$$ is a dummy variable equal to 1 if the country has a pegged exchange rate regime during the trough year of recession $$i$$, and $$X_{i}$$ represents a number of other controls based on the earlier literature.
Previous research shows that the severity of the recession, measured by recession depth (the percentage drop in real GDP between peak and trough) and length (the number of quarters between peak and trough), is an important predictor of the strength of recovery (Howard et al, 2011). We also account for the impact of trade and financial channels as in Blanchard et al. (2010). Specifically, we include trade-weighted growth of a country's major export partners,5 current account balance, and reserves-to-GDP ratio.6 Due to data availability, including these controls leads us to start these regressions in 1980, but leaves us with a still sizable sample of 204 recessions: 107 AEs and 97 EMEs.7 Finally, economic and financial pressure on exchange rates may force countries to give up their exchange rate pegs, especially in EMEs. To capture the potential economic implications of this, we include a dummy ("brokenpeg") for EMEs that experience large one-off depreciations or go off their exchange rate pegs at any point between the expansion peak and three years after the recession trough.8
We begin with a simple regression including dummies for pegged regimes and broken pegs, and controls for recession severity (tables 4 and 5). In almost all cases for both AEs and EMEs, the pegged dummy does not appear to have any significant effect on the recovery path of GDP after controlling for recession severity. Somewhat surprisingly, countries that are forced off their pegs do not seem to experience slower recoveries. For the AEs, we include a dummy for the euro-area countries. The euro-area countries seem to underperform relative to other countries with pegged or flexible exchange rate regimes. We expand our analysis to control for trade and financial channels, as discussed above. There is still no apparent effect of a pegged exchange rate regime on output recovery, though the dummy variable on euro-area countries remains negative and statistically significant.
Table 4. Determinants of the level of AE GDP during recovery
| (A) Years after trough | (B) Years after trough | |||||
|---|---|---|---|---|---|---|
| 1 yr | 2 yrs | 3 yrs | 1 yr | 2 yrs | 3 yrs | |
| pegged | -0.01 (0.65) |
-0.96 (0.77) |
-1.65* (0.98) |
0.17 (0.70) |
-0.86 (0.83) |
-1.08 (1.26) |
| euroarea | -1.18*** (0.43) |
-2.26*** (0.60) |
-2.66* (1.35) |
-1.53*** (0.48) |
-2.87*** (0.65) |
-3.67*** (1.13) |
| Depth | 0.29** (0.11) |
0.27** (0.12) |
0.07 (0.13) |
0.28** (0.11) |
0.30** (0.12) |
0.20 (0.17) |
| Duration | -0.32*** (0.12) |
-0.35** (0.13) |
-0.29 (0.19) |
-0.29** (0.12) |
-0.34** (0.14) |
-0.38 (0.23) |
| partnergrowth | 0.14* (0.08) |
0.12 (0.11) |
0.25 (0.17) |
|||
| cab | 0.03 (0.05) |
0.05 (0.06) |
0.18 (0.16) |
|||
| res_gdp | -0.04** (0.02) |
-0.08*** (0.03) |
-0.14** (0.06) |
|||
| Constant | 103.80*** (0.42) |
106.92*** (0.52) |
110.07*** (0.76) |
103.50*** (0.61) |
107.02*** (0.80) |
110.08*** (1.31) |
| Observations | 107 | 107 | 107 | 107 | 107 | 107 |
| Adjusted R-squared | 0.14 | 0.15 | 0.06 | 0.16 | 0.17 | 0.09 |
GDP indexed to 100 at recession trough.
Robust standard errors in parentheses.
*** p<0.01, ** p<0.05, * p<0.1
Table 5. Determinants of the level of EME GDP during recovery
| (A) Years after trough | (B) Years after trough | |||||
|---|---|---|---|---|---|---|
| 1 yr | 2 yrs | 3 yrs | 1 yr | 2 yrs | 3 yrs | |
| pegged | 0.40 (1.18) |
1.15 (1.61) |
0.25 (2.45) |
0.49 (1.20) |
1.46 (1.72) |
-1.21 (2.63) |
| brokenpeg | 2.86 (2.11) |
3.64 (2.81) |
3.41 (3.90) |
2.16 (1.69) |
1.51 (2.35) |
3.49 (3.73) |
| depth | 0.46** (0.18) |
0.59** (0.24) |
0.65** (0.31) |
0.45*** (0.16) |
0.56*** (0.20) |
0.73** (0.30) |
| duration | -0.86** (0.33) |
-1.21** (0.47) |
-1.13* (0.64) |
-0.80** (0.32) |
-1.16** (0.45) |
-1.15* (0.64) |
| partnergrowth | 0.56*** (0.15) |
0.85*** (0.21) |
0.56* (0.31) |
|||
| cab | 0.18 (0.13) |
0.21 (0.19) |
-0.09 (0.28) |
|||
| res_gdp | -0.02 (0.03) |
-0.00 (0.04) |
0.06 (0.06) |
|||
| Constant | 106.69*** (0.78) |
112.19*** (1.40) |
115.80*** (1.84) |
103.91*** (1.25) |
107.65*** (1.89) |
111.58*** (2.47) |
| Observations | 97 | 97 | 96 | 97 | 97 | 96 |
| Adjusted R-squared | 0.22 | 0.14 | 0.08 | 0.32 | 0.26 | 0.14 |
GDP indexed to 100 at recession trough.
Robust standard errors in parentheses.
*** p<0.01, ** p<0.05, * p<0.1
To explore further how exchange rate regime affects GDP growth, we repeat the analysis using exports and private domestic demand. We show results for the third year following a recession trough for these components and for GDP in table 6. Reflecting the differences we observed in the butterfly charts for recoveries before the GFC and after, we also include a dummy interacted with the peg dummy to capture any post-GFC effects. In the AEs, the results for exports are inconclusive and statistically insignificant, suggesting that exchange rate regimes are not importantly impacting the trade recovery. EMEs seem to receive a substantial, albeit weakly significant, boost to exports under pegged exchange rate regimes, though the effect becomes insignificant once other controls are introduced. The observed weakness in post-GFC output growth for pegged EMEs compared with earlier recessions is robust to the inclusion of controls for recession severity and external channels. However, we cannot identify what is driving the difference as there does not appear to be a significant impact on private domestic demand recovery in either the AEs or EMEs, though the euro-area countries see weaker recovery.
Table 6. Determinants of the level of GDP and components three years post-trough
| Dependent variable: | GDP | Exports | Private Domestic Demand | |||||||||
|---|---|---|---|---|---|---|---|---|---|---|---|---|
| AEs | EMEs | AEs | EMEs | AEs | EMEs | |||||||
| (1) | (2) | (3) | (4) | (5) | (6) | (7) | (8) | (9) | (10) | (11) | (12) | |
| pegged | -1.65* (0.98) |
-1.08 (1.26) |
4.52 (3.13) |
2.31 (3.53) |
-1.42 (2.29) |
0.70 (2.67) |
15.24* (7.99) |
11.05 (8.73) |
-2.41 (2.03) |
-1.82 (2.54) |
2.62 (4.74) |
1.65 (4.92) |
| euroarea | -2.66* (1.35) |
-3.67*** (1.13) |
1.04 (2.47) |
0.25 (2.32) |
-4.77*** (1.25) |
-5.12*** (1.31) |
||||||
| brokenpeg | 0.40 (3.07) |
0.97 (3.07) |
-4.87 (7.39) |
-6.03 (7.28) |
2.37 (5.02) |
3.72 (4.42) |
||||||
| pegged*postgfc | -10.97** (4.34) |
-8.48* (4.31) |
-11.48 (11.60) |
-7.04 (12.26) |
-10.59 (7.42) |
-7.11 (6.74) |
||||||
| depth | 0.07 (0.13) |
0.20 (0.17) |
0.72** (0.30) |
0.77** (0.31) |
0.77* (0.44) |
1.03** (0.44) |
0.52 (0.61) |
0.60 (0.64) |
-0.25 (0.24) |
-0.20 (0.27) |
1.01** (0.41) |
1.13*** (0.40) |
| duration | -0.29 (0.19) |
-0.38 (0.23) |
-1.03* (0.57) |
-1.07* (0.58) |
-0.86* (0.43) |
-1.02** (0.46) |
0.92 (1.49) |
0.93 (1.51) |
0.12 (0.24) |
0.14 (0.25) |
-1.16 (0.89) |
-1.42 (0.92) |
| partnergrowth | 0.25 (0.17) |
0.49 (0.32) |
0.82 (0.50) |
1.02 (0.71) |
0.38 (0.37) |
1.56*** (0.44) |
||||||
| cab | 0.18 (0.16) |
-0.08 (0.27) |
0.43 (0.29) |
0.19 (0.50) |
-0.03 (0.21) |
-0.36 (0.34) |
||||||
| res_gdp | -0.14** (0.06) |
0.05 (0.06) |
-0.10 (0.11) |
0.14 (0.12) |
-0.05 (0.06) |
-0.03 (0.09) |
||||||
| Constant | 110*** (0.76) |
110*** (1.31) |
115*** (1.85) |
112*** (2.42) |
120*** (1.65) |
117*** (2.71) |
118*** (5.02) |
110*** (6.95) |
109*** (1.21) |
108*** (2.45) |
116*** (2.98) |
109*** (4.20) |
| Observations | 107 | 107 | 96 | 96 | 99 | 99 | 84 | 84 | 99 | 99 | 84 | 84 |
| Adjusted R-squared | 0.06 | 0.09 | 0.12 | 0.15 | 0.01 | 0.03 | 0.05 | 0.09 | 0.08 | 0.08 | 0.12 | 0.22 |
Dependent variable indexed to 100 at recession trough.
Robust standard errors in parentheses.
*** p<0.01, ** p<0.05, * p<0.1
What do we make of all this? A country's choice of exchange rate is a key policy decision, and makes an observable difference in the behavior of real exchange rates around cyclical turning points. Yet, our admittedly simple analysis suggests it does not seem to impact much the outcome of trade and growth. Over our entire sample period, we find little evidence that exchange rate regime choice – in particular, whether a country has a fixed or flexible regime – matters greatly in terms of the performance of export growth around recessions or in the behavior of output or domestic demand. That said, our preliminary analysis suggests that the exchange rate regime may be more important in the post-GFC period, but more work will need to be done to disentangle the role of exchange rate regime from other factors that may be holding back countries with pegged regimes more recently.
More broadly, we found these results somewhat puzzling. Theoretically, there are a number of reasons why one might expect countries with exchange rate flexibility to outperform pegged peers in recoveries, given the importance of trade in driving growth for many countries and the emphasis put on movements in nominal exchange rates as affecting trade. On the other hand, exchange rate volatility is often viewed as negatively impacting a country's economic performance. It is possible that these results, which are initial, may be failing to identify important channels. But, at the very least, they suggest that the relationship among exchange rate regimes, trade, and economic recovery is complicated and more work is needed to understand the role of exchange rates in supporting economic performance.
Bibliography
Blanchard, Olivier J., Hamid Faruqee, and Mitali Das, "The Initial Impact of the Crisis on Emerging Market Countries," Brookings Papers on Economic Activity, 2010.
Frankel, Jeffrey A., "No single currency regime is right for all countries or at all times," NBER Working Paper 7338, 1999.
Ghosh, Atish R., Anne-Marie Gulde, Jonathan D. Ostry, and Holger C. Wolf, "Does the nominal exchange rate regime matter?" NBER Working Paper 5874, 1997.
Harding, Don and Adrian Pagan, "Dissecting the Cycle: a methodological investigation," Journal of Monetary Economics, 49: 365-381, 2002.
Howard, Greg, Robert F. Martin, and Beth Anne Wilson, "Are Recoveries from Banking and Financial Crises Really So Different?" International Finance Discussion Paper 1037, 2011.
Husain, Aasim M., Ashoka Mody, and Kenneth S. Rogoff, "Exchange rate regime durability and performance in developing versus advanced economies," Journal of Monetary Economics, 52: 35-64, 2005.
Klein, Michael W., and Jay C. Shambaugh, "Fixed exchange rates and trade," Journal of International Economics, 70: 359-383, 2006.
Levy-Yeyati, Eduardo, and Federico Sturzenegger, "To float or to fix: evidence on the impact of exchange rate regimes on growth," The American Economic Review, 93(4): 1173-1193, 2003.
Reinhart, Carmen, and Kenneth Rogoff, "The modern history of exchange rate arrangements: A reinterpretation," Quarterly Journal of Economics, 119(1): 1-48, 2004.
Tsangarides, Charalambos G., "Crisis and recovery: Role of the exchange rate regime in emerging market economies," Journal of Macroeconomics, 34(2): 470-488, 2012.
* Caitlin Hegarty is a Senior Research Assistant in Emerging Market Economies, and Beth Anne Wilson ([email protected]) is a Deputy Director in the Division of International Finance, Board of Governors of the Federal Reserve System, Washington, D.C. 20551 U.S.A. We thank Shaghil Ahmed and John Rogers for their comments. The views in this paper are solely the responsibility of the authors and should not be interpreted as reflecting the views of the Board of Governors of the Federal Reserve System or of any other person associated with the Federal Reserve System. Return to text
1. Even with fixed prices, the trade-weighted real exchange rates in countries with pegged regimes can move as their currencies move against currencies of countries to which they are not pegged. Return to text
2. We identify recessions using the Bry-Boschen quarterly procedure (BBQ) described by Harding and Pagan (2002). Return to text
3. In our regressions, we will also examine the impact of broken pegs during the recession and recovery period. Return to text
4. In 1999, the IMF began publishing de facto regimes in the Annual Report on Exchange Arrangements and Exchange Restrictions (AREAER). We use these classifications starting in 1999 and the Reinhart and Rogoff (2004) classifications from 1970 to 1999. The datasets overlap from 1999 to 2010. In that period, there are 77 recessions in our sample and only three are classified differently between the two sources. Return to text
5. We identify for each year, the country's six largest export recipients from the IMF's Direction of Trade Statistics (DOTS) and then created a trade-weighted measure of partner growth using annual real GDP growth rates from the World Economic Outlook (WEO). DOTS data are available starting in 1980. Return to text
6. Reserves-to-GDP and current account balance data come from WEO and International Financial Statistics (IFS). Return to text
7. We also tried including a ratio of foreign currency-denominated debt to GDP for the EMEs using data from the World Bank's World Development Indicators and the Quarterly External Debt Statistics database. Including this variable limited our sample size to 77 EMEs but did not materially change our results. Return to text
8. The "brokenpeg" dummy includes six EMEs that switched from pegged to flexible in the de facto regime classification between peak and the three years post trough, and four EMEs that experienced one-off devaluations but remained classified as pegged regimes. In the AEs, two countries experienced peg breaks and, given that small sample, we choose not to include the "brokenpeg" dummy in the AE regressions. Return to text
Hegarty, Caitlin and Beth Anne Wilson (2017). "Recoveries and Trade: Does the Exchange Rate Regime Matter?," IFDP Notes. Washington: Board of Governors of the Federal Reserve System, June 2017, https://doi.org/10.17016/2573-2129.34.
Disclaimer: IFDP Notes are articles in which Board economists offer their own views and present analysis on a range of topics in economics and finance. These articles are shorter and less technically oriented than IFDP Working Papers.