
Report on the Economic Well-Being of U.S. Households in 2015
 Print
Print- Preface
- Executive Summary
- Introduction
- Overall Economic Well-Being
- Income and Savings
- Economic Preparedness and Emergency Savings
Income and Savings
An important measure of economic well-being is whether respondents feel that they have sufficient income to cover their expenses without incurring debt. To capture the extent to which individuals feel that they are able to both pay current expenses and save for the future, the survey asks a series of questions related to their income, income sources, and rate of savings. Most respondents report that they saved at least some of their income in the year prior to the survey, although a sizeable minority indicate that their spending exceeded their income. The survey results also demonstrate that spending and savings behaviors differ greatly by income, as lower-income respondents are less likely to be saving and more likely to be spending more than they earn.
Income Amounts and Sources
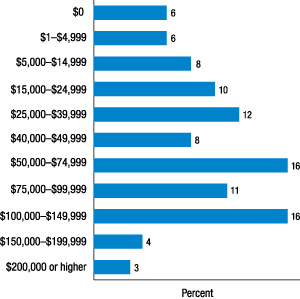
Survey respondents are asked about the income that they and their spouse or partner received in the past year from all sources. Recognizing that respondents may have imperfect recall about their income, and that some individuals are sensitive about reporting their precise income level, they are asked to provide this information in income ranges. Thirty percent of respondents report that their income in the last 12 months was less than $25,000, and 42 percent report that their income was under $40,000 (figure 5). The median family income is in the range between $40,000 and $49,999.14 The distribution of incomes varies based on individual demographic characteristics (see box 2).
Respondents are also asked about the sources of income that they and their spouse or partner received in the past year. While wages and salaries are the dominant form of income for many families, 63 percent of adults report that they or their spouse received at least some form of non-wage income. The common forms of non-wage income differ across the life-course, however. Among young adults (ages 18 to 29), freelance and hobby income was the most commonly received non-wage income (table 7). Among the three older cohorts, freelance income is less common but interest and dividends increase in prevalence. Additionally, those who are at or near retirement (age 60 and older) commonly report receiving Social Security and pension income--each of which is substantially less common for those in the younger age brackets. (The sources of income among retirees is discussed further in the "Retirement" section of this report.)
| Income source | 18-29 | 30-44 | 45-59 | 60+ | Overall |
|---|---|---|---|---|---|
| Wages or salaries | 76.1 | 84.0 | 78.5 | 36.3 | 67.9 |
| Self-employment | 11.0 | 15.1 | 16.3 | 12.7 | 13.9 |
| Freelance work or hobbies | 18.2 | 15.4 | 11.9 | 6.1 | 12.5 |
| Interest, dividends, or rental income | 12.3 | 17.2 | 24.0 | 35.7 | 23.0 |
| Social Security | 2.2 | 4.8 | 13.2 | 75.6 | 25.6 |
| Supplemental Security (SSI) | 2.5 | 4.8 | 6.0 | 5.0 | 4.7 |
| Unemployment income | 3.3 | 4.1 | 3.4 | 1.9 | 3.1 |
| Pension income | 0.8 | 2.2 | 11.7 | 49.8 | 17.3 |
| Any other income | 11.2 | 10.1 | 8.6 | 18.0 | 12.1 |
Respondents are also asked whether anyone else in their household besides a spouse or partner received any income in the past year. Twenty-six percent of all respondents indicate that there is an additional earner in their household, and 32 percent of respondents with a family income under $40,000 report having an additional earner in their household (table 8). The higher frequency of additional earners in the household of lower-income individuals is consistent with the higher propensity for these individuals to live with someone outside of their immediate family more generally, as discussed in the "Home Ownership and Living Arrangements" section of this report.
| Income category | Percent responding "Yes" |
|---|---|
| Less than $40,000 | 31.9 |
| $40,000-$100,000 | 22.2 |
| Greater than $100,000 | 21.3 |
| Overall | 25.9 |
Note: Includes respondents living alone.
Box 2. Income Profiles by Demographic Groups
A primary focus of this report is the analysis of well-being for subsets of the adult population in order to provide insights into the differing financial experiences of individuals from different backgrounds or who face different individual circumstances. In many cases, these comparisons are made based on the income of the respondent, although for some questions comparisons based on other relevant individual characteristics are also considered.
Consistent with that seen in other data, including the U.S. Census Bureau's Current Population Survey, the family income of survey respondents is correlated with a number of individual and demographic characteristics that are considered in this report. Young respondents (ages 18 to 29) are disproportionately likely to have a family income less than $40,000, as are respondents with lower levels of education (table A). Single respondents--and particularly single women--are more likely to have lower levels of income than are their married counterparts. Non-Hispanic black and Hispanic respondents are more likely to report lower levels of income than are non-Hispanic white respondents. Respondents who report a disability or functional limitation are also disproportionately low income. Furthermore, incomes appear to vary based on whether the respondent lives in a metropolitan area. These relationships between income levels and individual characteristics are valuable to remember when considering the links between individual characteristics and the financial well-being measures that are discussed in this report.
| Characteristic | Less than $40,000 | $40,000- $100,000 |
Greater than $100,000 |
|---|---|---|---|
| Age | |||
| 18-29 | 64.4 | 24.5 | 11.1 |
| 30-44 | 33.3 | 36.9 | 29.8 |
| 45-59 | 30.2 | 37.5 | 32.3 |
| 60+ | 45.6 | 37.1 | 17.3 |
| Education | |||
| High school degree or less | 55.4 | 34.9 | 9.6 |
| Some college or associate degree | 47.9 | 34.0 | 18.1 |
| Bachelor's degree or more | 20.9 | 34.3 | 44.8 |
| Race/ethnicity | |||
| White, non-Hispanic | 36.8 | 37.2 | 26.0 |
| Black, non-Hispanic | 54.0 | 31.3 | 14.7 |
| Hispanic | 58.8 | 27.4 | 13.8 |
| Gender and marital status | |||
| Single women | 69.6 | 23.3 | 7.1 |
| Single men | 61.5 | 27.8 | 10.7 |
| Married couple | 21.4 | 42.6 | 36.0 |
| Disability status | |||
| Health problem or work limitation | 66.7 | 25.3 | 8.0 |
| No limitation | 36.4 | 36.7 | 26.9 |
| Metropolitan area | |||
| Metropolitan | 41.0 | 34.3 | 24.8 |
| Non-metropolitan | 50.9 | 35.5 | 13.6 |
| Overall | 42.4 | 34.4 | 23.1 |
Spending Relative to Income
When asked how their spending compares to their income, 48 percent of adults say that they spent less than they made in the last 12 months and 31 percent report that their spending was equal to their income. The frequency of saving is 7 percentage points higher than that observed in 2014 and 9 percentage points above that seen in 2013.15 However, there are still 15 percent of respondents who report that they spent more than they earned and an additional 6 percent who report that they had no income at all. Consistent with that observed in the 2014 survey, lower-income respondents are more likely to report that their spending exceeded their income than those at higher-income levels (figure 6).
An alternate approach to measuring savings in the survey is to directly ask respondents who are not fully retired what portion of their income was set aside as savings. This question specifically asks respondents to include 401(k) savings and other retirement savings facilitated through work, thereby prompting them to consider savings more broadly than just funds saved out of their take-home pay. As such, reported frequencies of saving are higher than the fraction of respondents who say that they spend less than they earn.
Figure 6. In the past 12 months, would you say that your and your spouse's total spending was more, the same, or less than your income? (by family income)
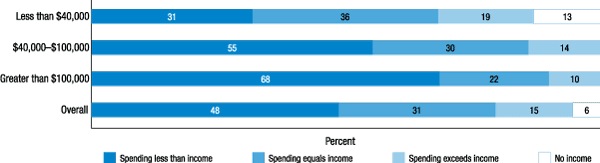
Note: Respondents who reported they had no income are not asked how their spending compares to their income, and are included separately.
Considering this broad measure of savings, 68 percent of respondents who are not fully retired indicate that they saved at least a portion of their income in the past 12 months. Among respondents who did save, however, 40 percent report saving less than 5 percent of their income and two-thirds report saving 10 percent or less.
Non-retirees with higher levels of income are more likely to report that they are saving money than those lower in the income distribution. Less than half of non-retirees making under $40,000 per year report saving some of their income in the previous 12 months, whereas three-quarters of those in the middle-income group ($40,000 to $100,000) and 90 percent of those in the highest income group (over $100,000) indicate that they saved a portion of their income. Similarly, the fraction of higher-income respondents who are saving at least 10 or 20 percent of their income outpaces the frequency of such high rates of saving for lower- or middle-income adults (figure 7).
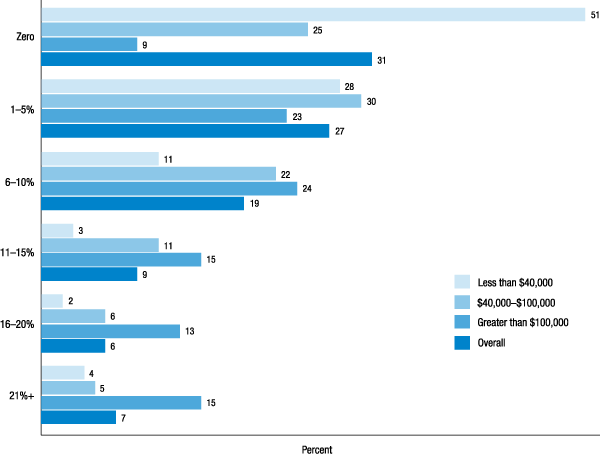
Note: Among respondents not fully retired who had at least some income in the past year.
Income and Spending Volatility
While many economic surveys, including the SHED, focus their analyses on one-year periods, summing one year's worth of income and expenses may mask substantial volatility that occurs for some families on a monthly basis. In order to assess this volatility, the SHED asks respondents about the level of consistency of both their spending and savings.
Two-thirds of respondents report that their income is roughly the same from month to month, 20 percent indicate that their monthly income varies occasionally, and 12 percent report that their income often varies quite a bit from month to month. This level of income volatility is similar to that observed in 2013, which is the most recent year in which this question was asked previously. When asked the reason their income varies, 43 percent indicate that it is due to an irregular work schedule (figure 8). Only 16 percent of those with volatile incomes attribute the volatility to bonuses, which is the next most-frequently cited reason.
Figure 8. Please indicate whether each of the following is a reason that your income changed from month to month in the past year
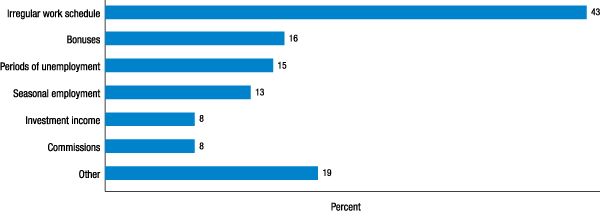
Note: Among respondents whose income varies somewhat or quite a bit from month to month.
Respondents are also asked about the stability of their expenses from month to month. Overall, individuals are somewhat less likely to report stable expenses than they are to report stable incomes. Fifty-five percent of adults indicate that their expenses are roughly the same each month, compared to the 67 percent who say that their income is roughly the same each month. Income and expense volatility also appear to be correlated, as over 40 percent of those whose income often varies say that their expenses do as well--whereas just 5 percent of those whose income is roughly the same amount each month feel that their expenses often vary.
Recognizing that income and expense fluctuations may be innocuous for some individuals but may cause financial stress for others, the survey also assesses the relationship between volatility and economic hardship. It does so by asking those who indicate at least some variation in their monthly income or expenses a follow-up question about whether they had any months when they struggled to pay their bills because their income was unusually low or their expenses were unusually high. Overall, 42 percent of those with volatile incomes or expenses report that they struggled to pay their bills at least once in the last year due to this kind of volatility.
The potential for hardship from volatile incomes and expenses appears to be greatest among lower-income respondents and among credit-constrained respondents. Among those with volatile incomes or expenses whose family income is under $40,000 per year, 54 percent report that they struggled to pay their bills due to this volatility. Among lower-income respondents who are not confident that they would be approved for a credit card if they were to apply for one, an even higher 72 percent report that they struggled to pay their bills due to income or expense fluctuations (figure 9).
Figure 9. Respondents with income or expense fluctuations who have struggled to pay their bills some months because of these fluctuations (by income and perceived credit access)
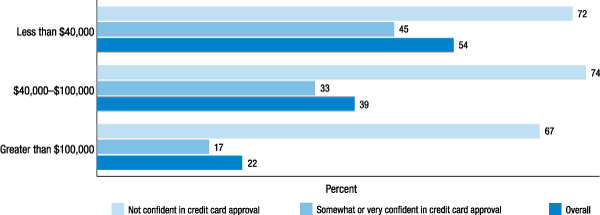
Note: Among respondents whose income or expenses vary somewhat or quite a bit from month to month.
References
14. When comparing the income distribution of SHED respondents and their spouse or partner to that seen in the 2015 March Current Population Survey, the two series are similar, although the SHED observes more respondents with incomes between $100,000 and $149,999 and fewer with incomes between $5,000 and $39,999. Recognizing that the household income distribution closely matches the March Current Population Survey, this may partially reflect that unmarried partners in the SHED are asked about the income that they and their partner receive, whereas the Current Population Survey treats these individuals as living in two separate families, so the partners cannot be directly linked. It also may reflect some SHED respondents who report their household income rather than just their own and their spouse's. Return to text
15. A methodological difference between the 2014 and 2015 survey may result in a slight understatement of the increase in the number of individuals whose spending was less than, or equal to, their income over time. In 2014, all respondents were asked about their spending relative to their savings, whereas in 2015, respondents who have zero income are assumed to spend more than they earn. To the extent that individuals with zero income report that their spending equals their income, this will impact the comparison over time. Return to text
